
Individuals with Metabolic Syndrome Show Altered Fecal Lipidomic Profiles with No Signs of Intestinal Inflammation or Increased Intestinal Permeability

 , , ,
, , ,
Abstract
:1. Introduction
2. Results
2.1. Goal of the Study
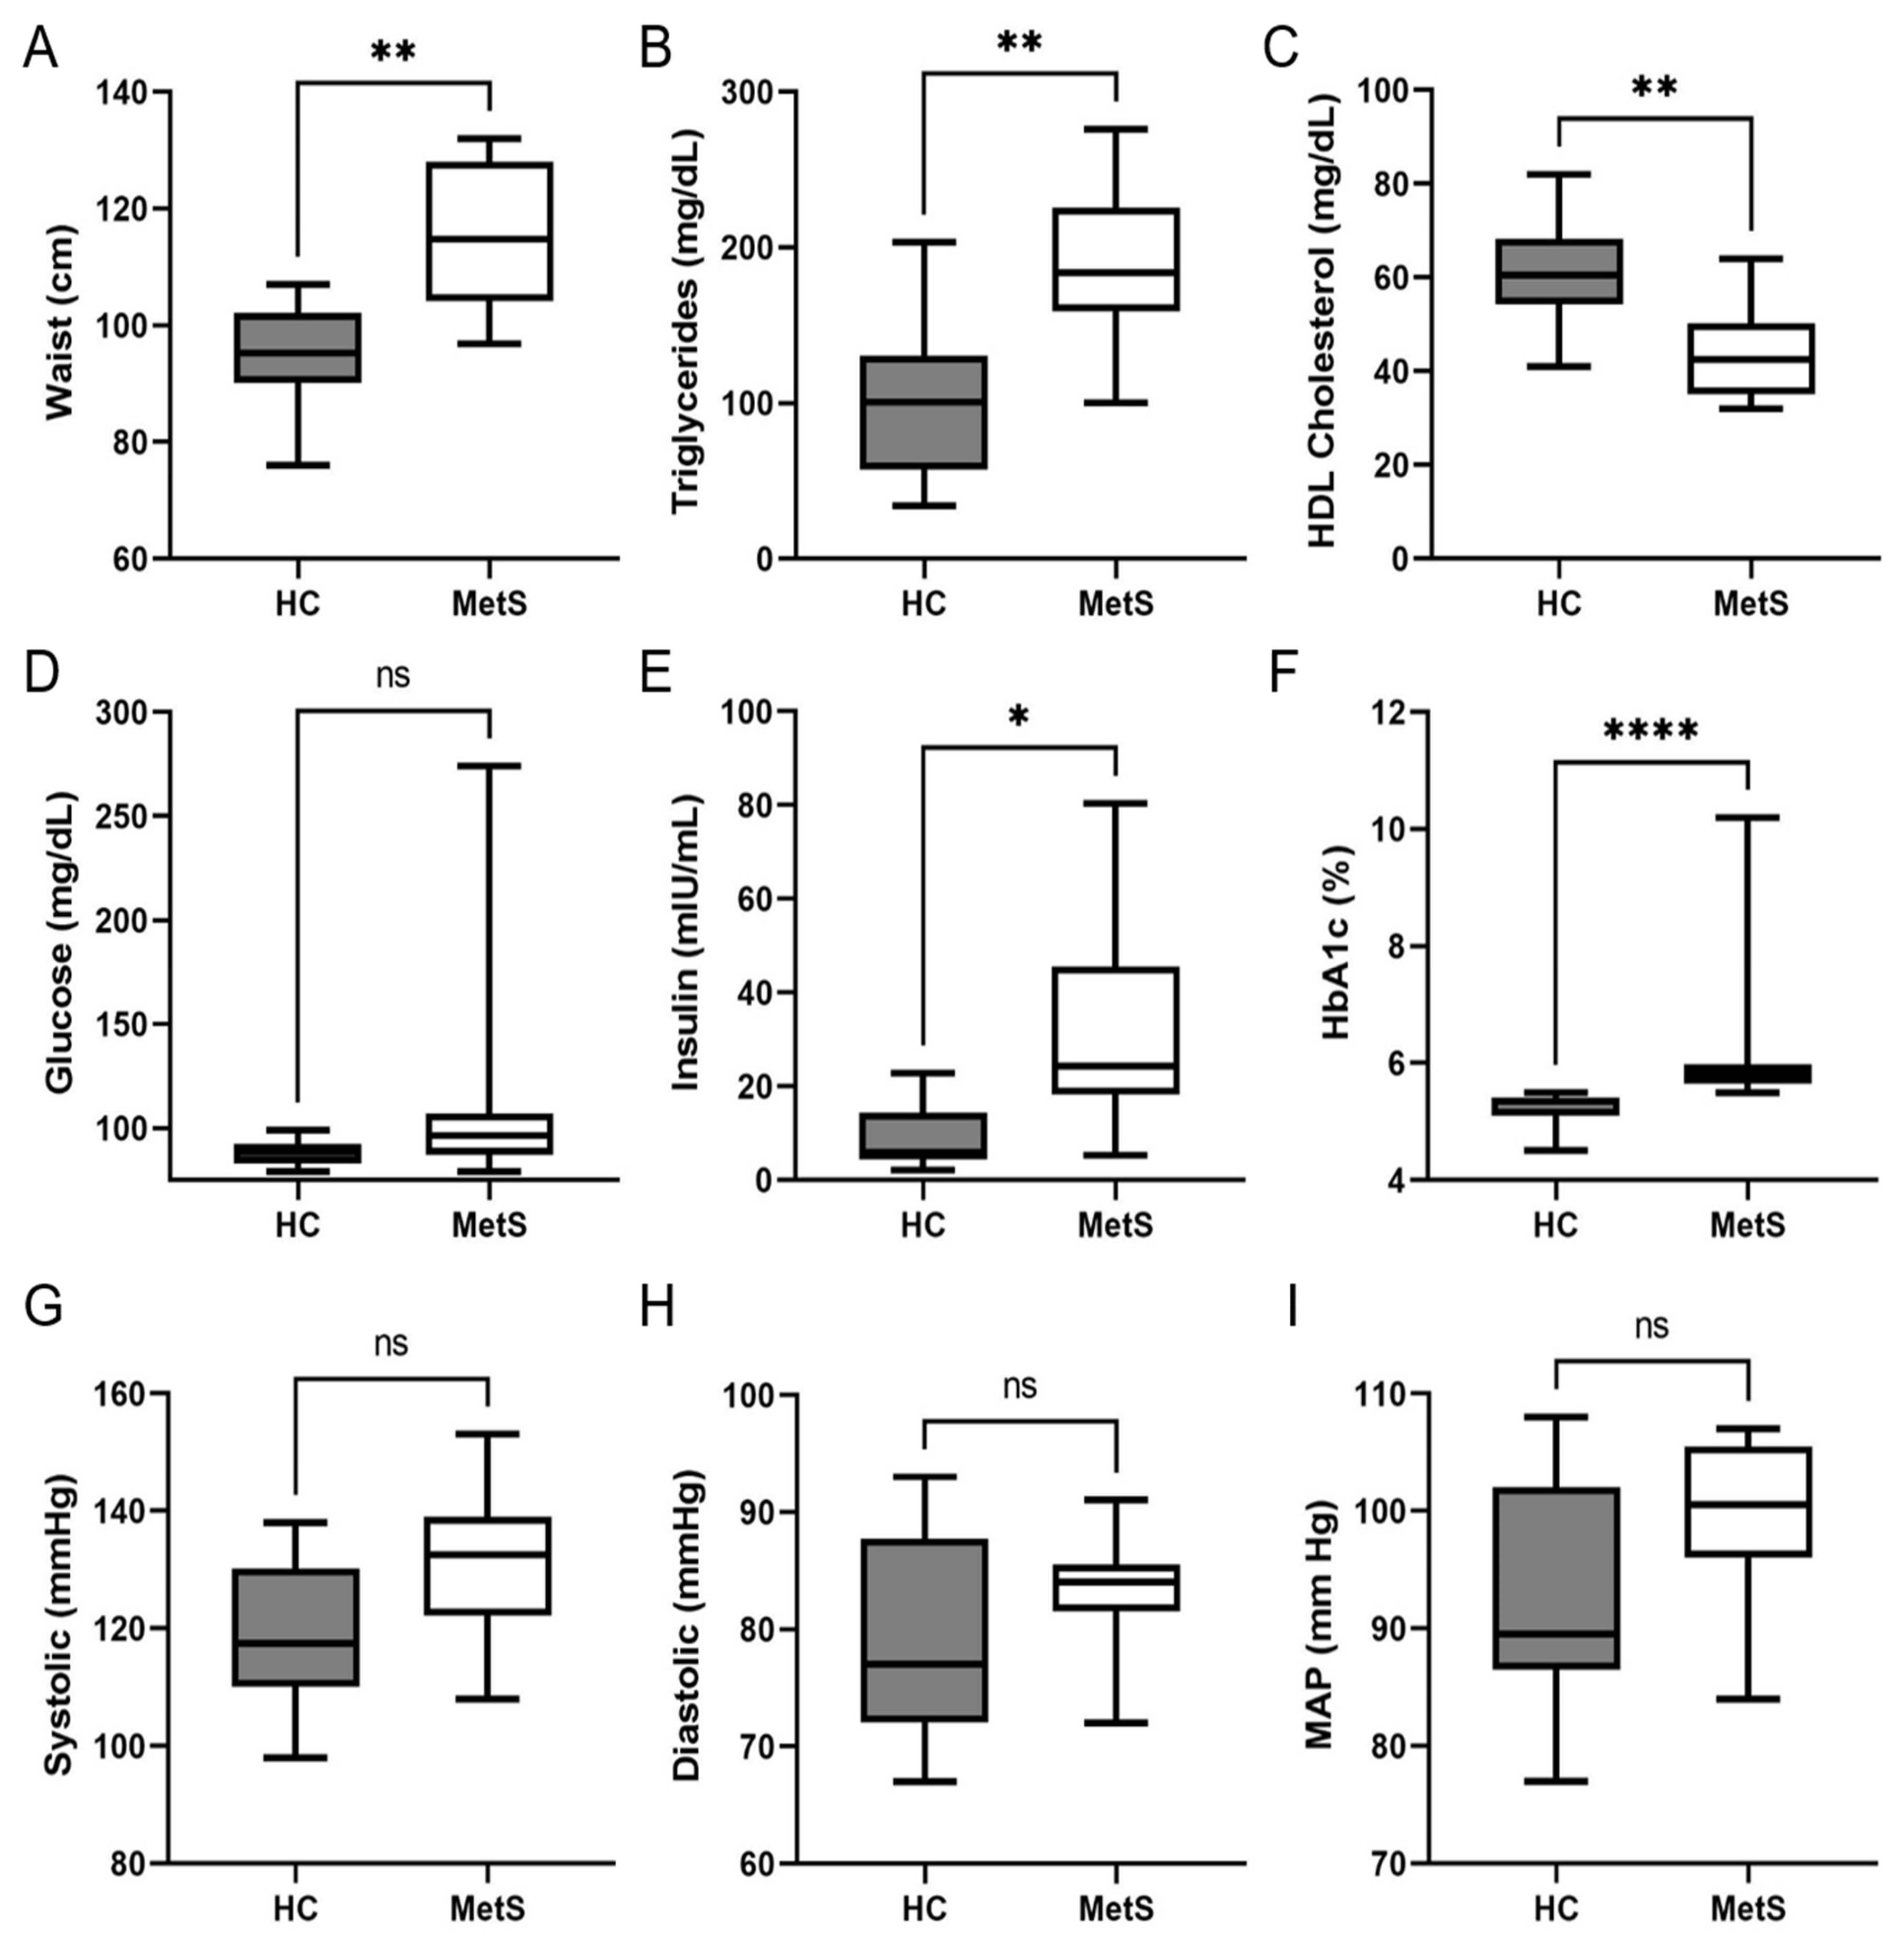
2.2. Clinical and Biochemical Analysis of Study Cohort
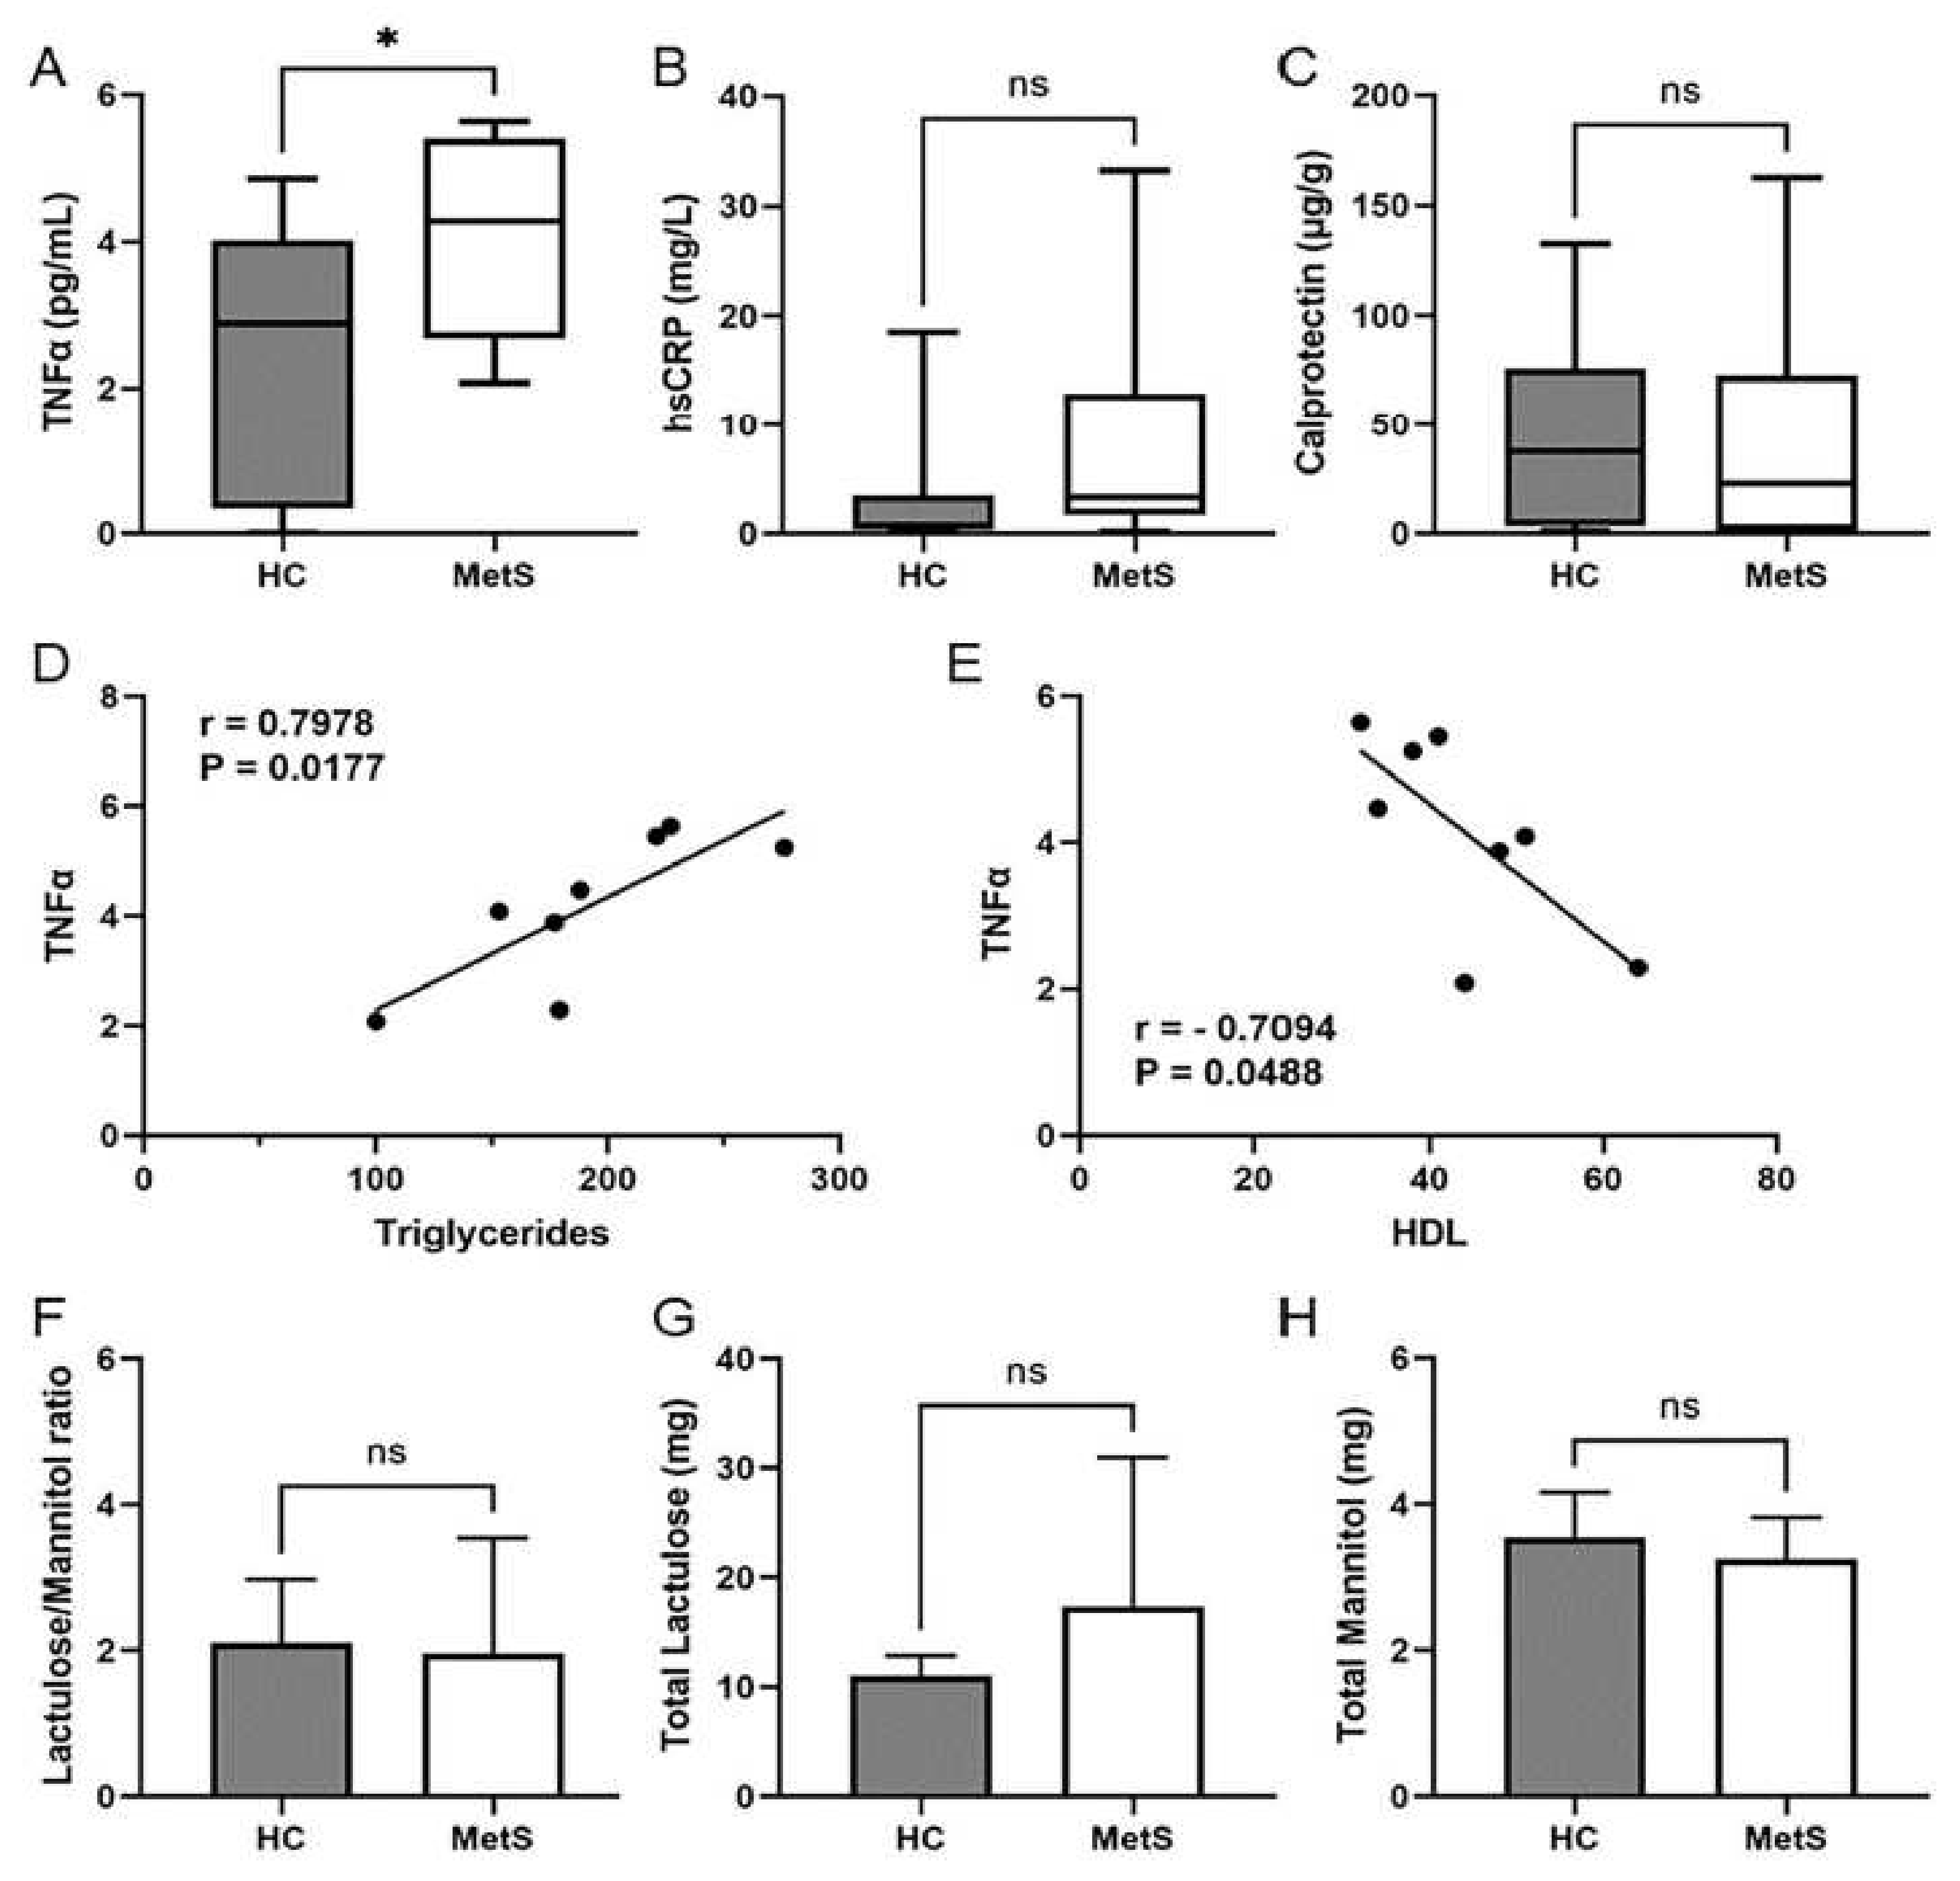
2.3. Metabolic Syndrome Participants Showed Systemic Inflammation That Correlated with Dyslipidemia
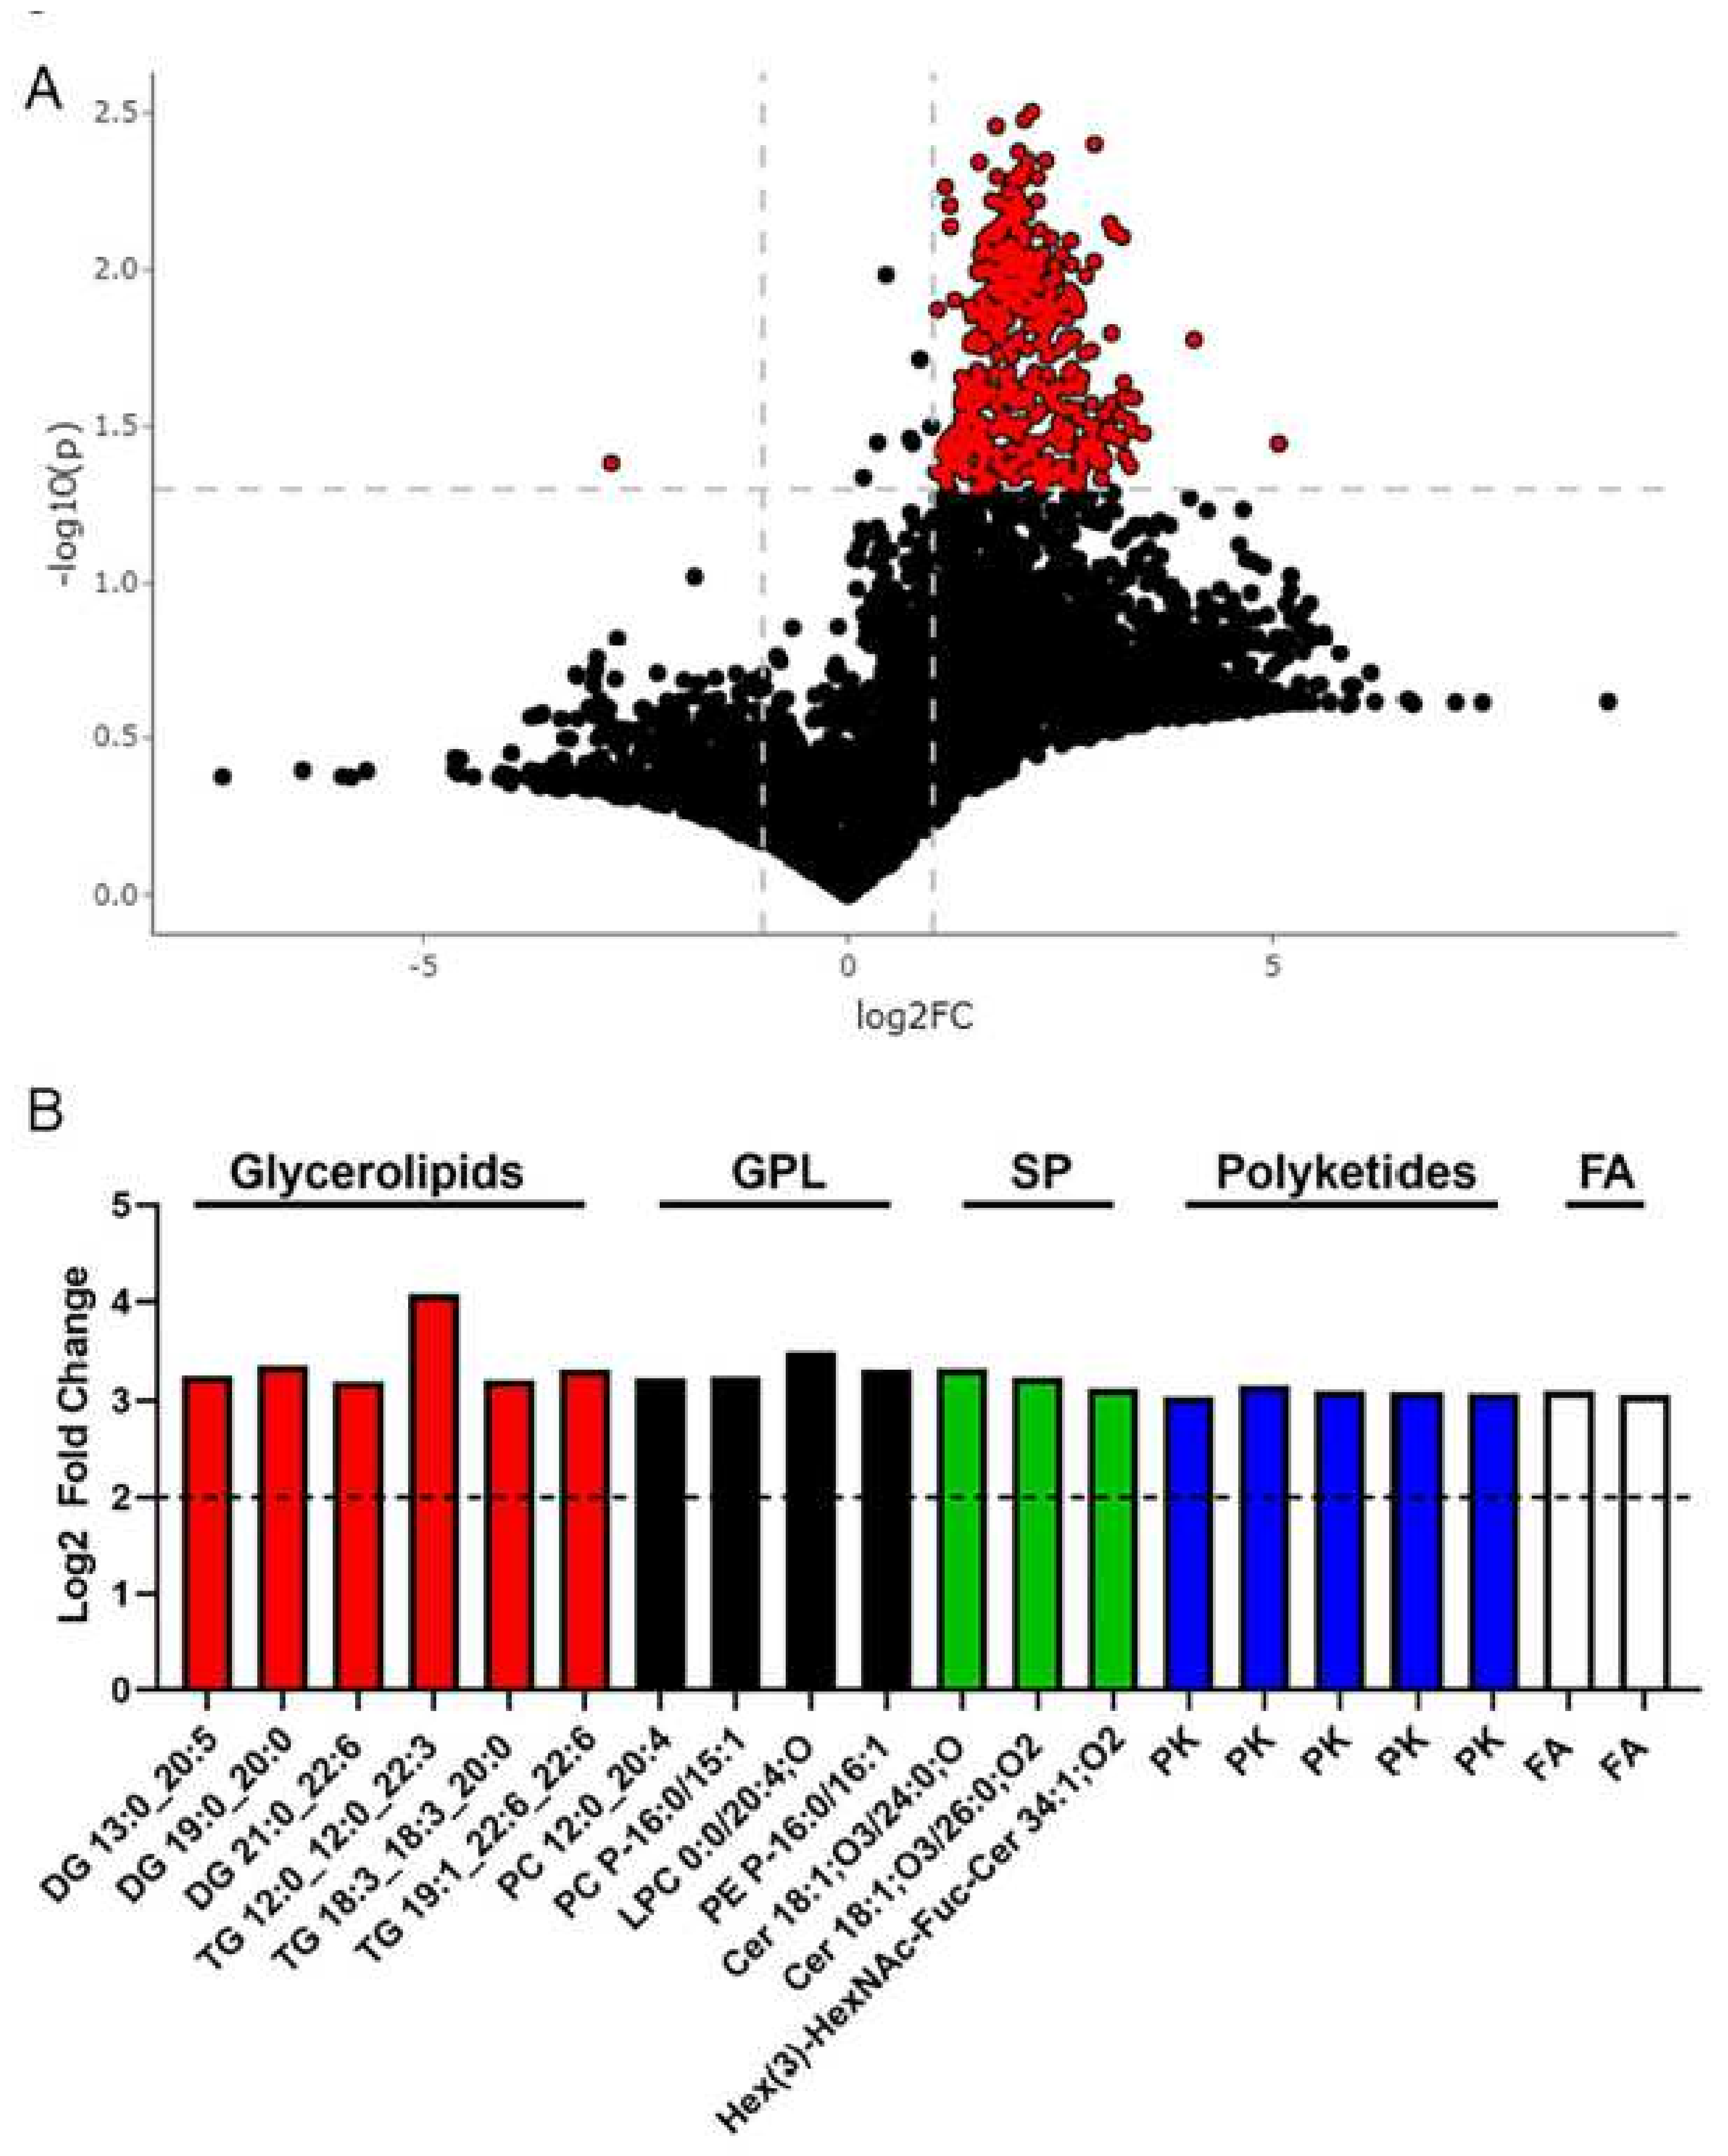
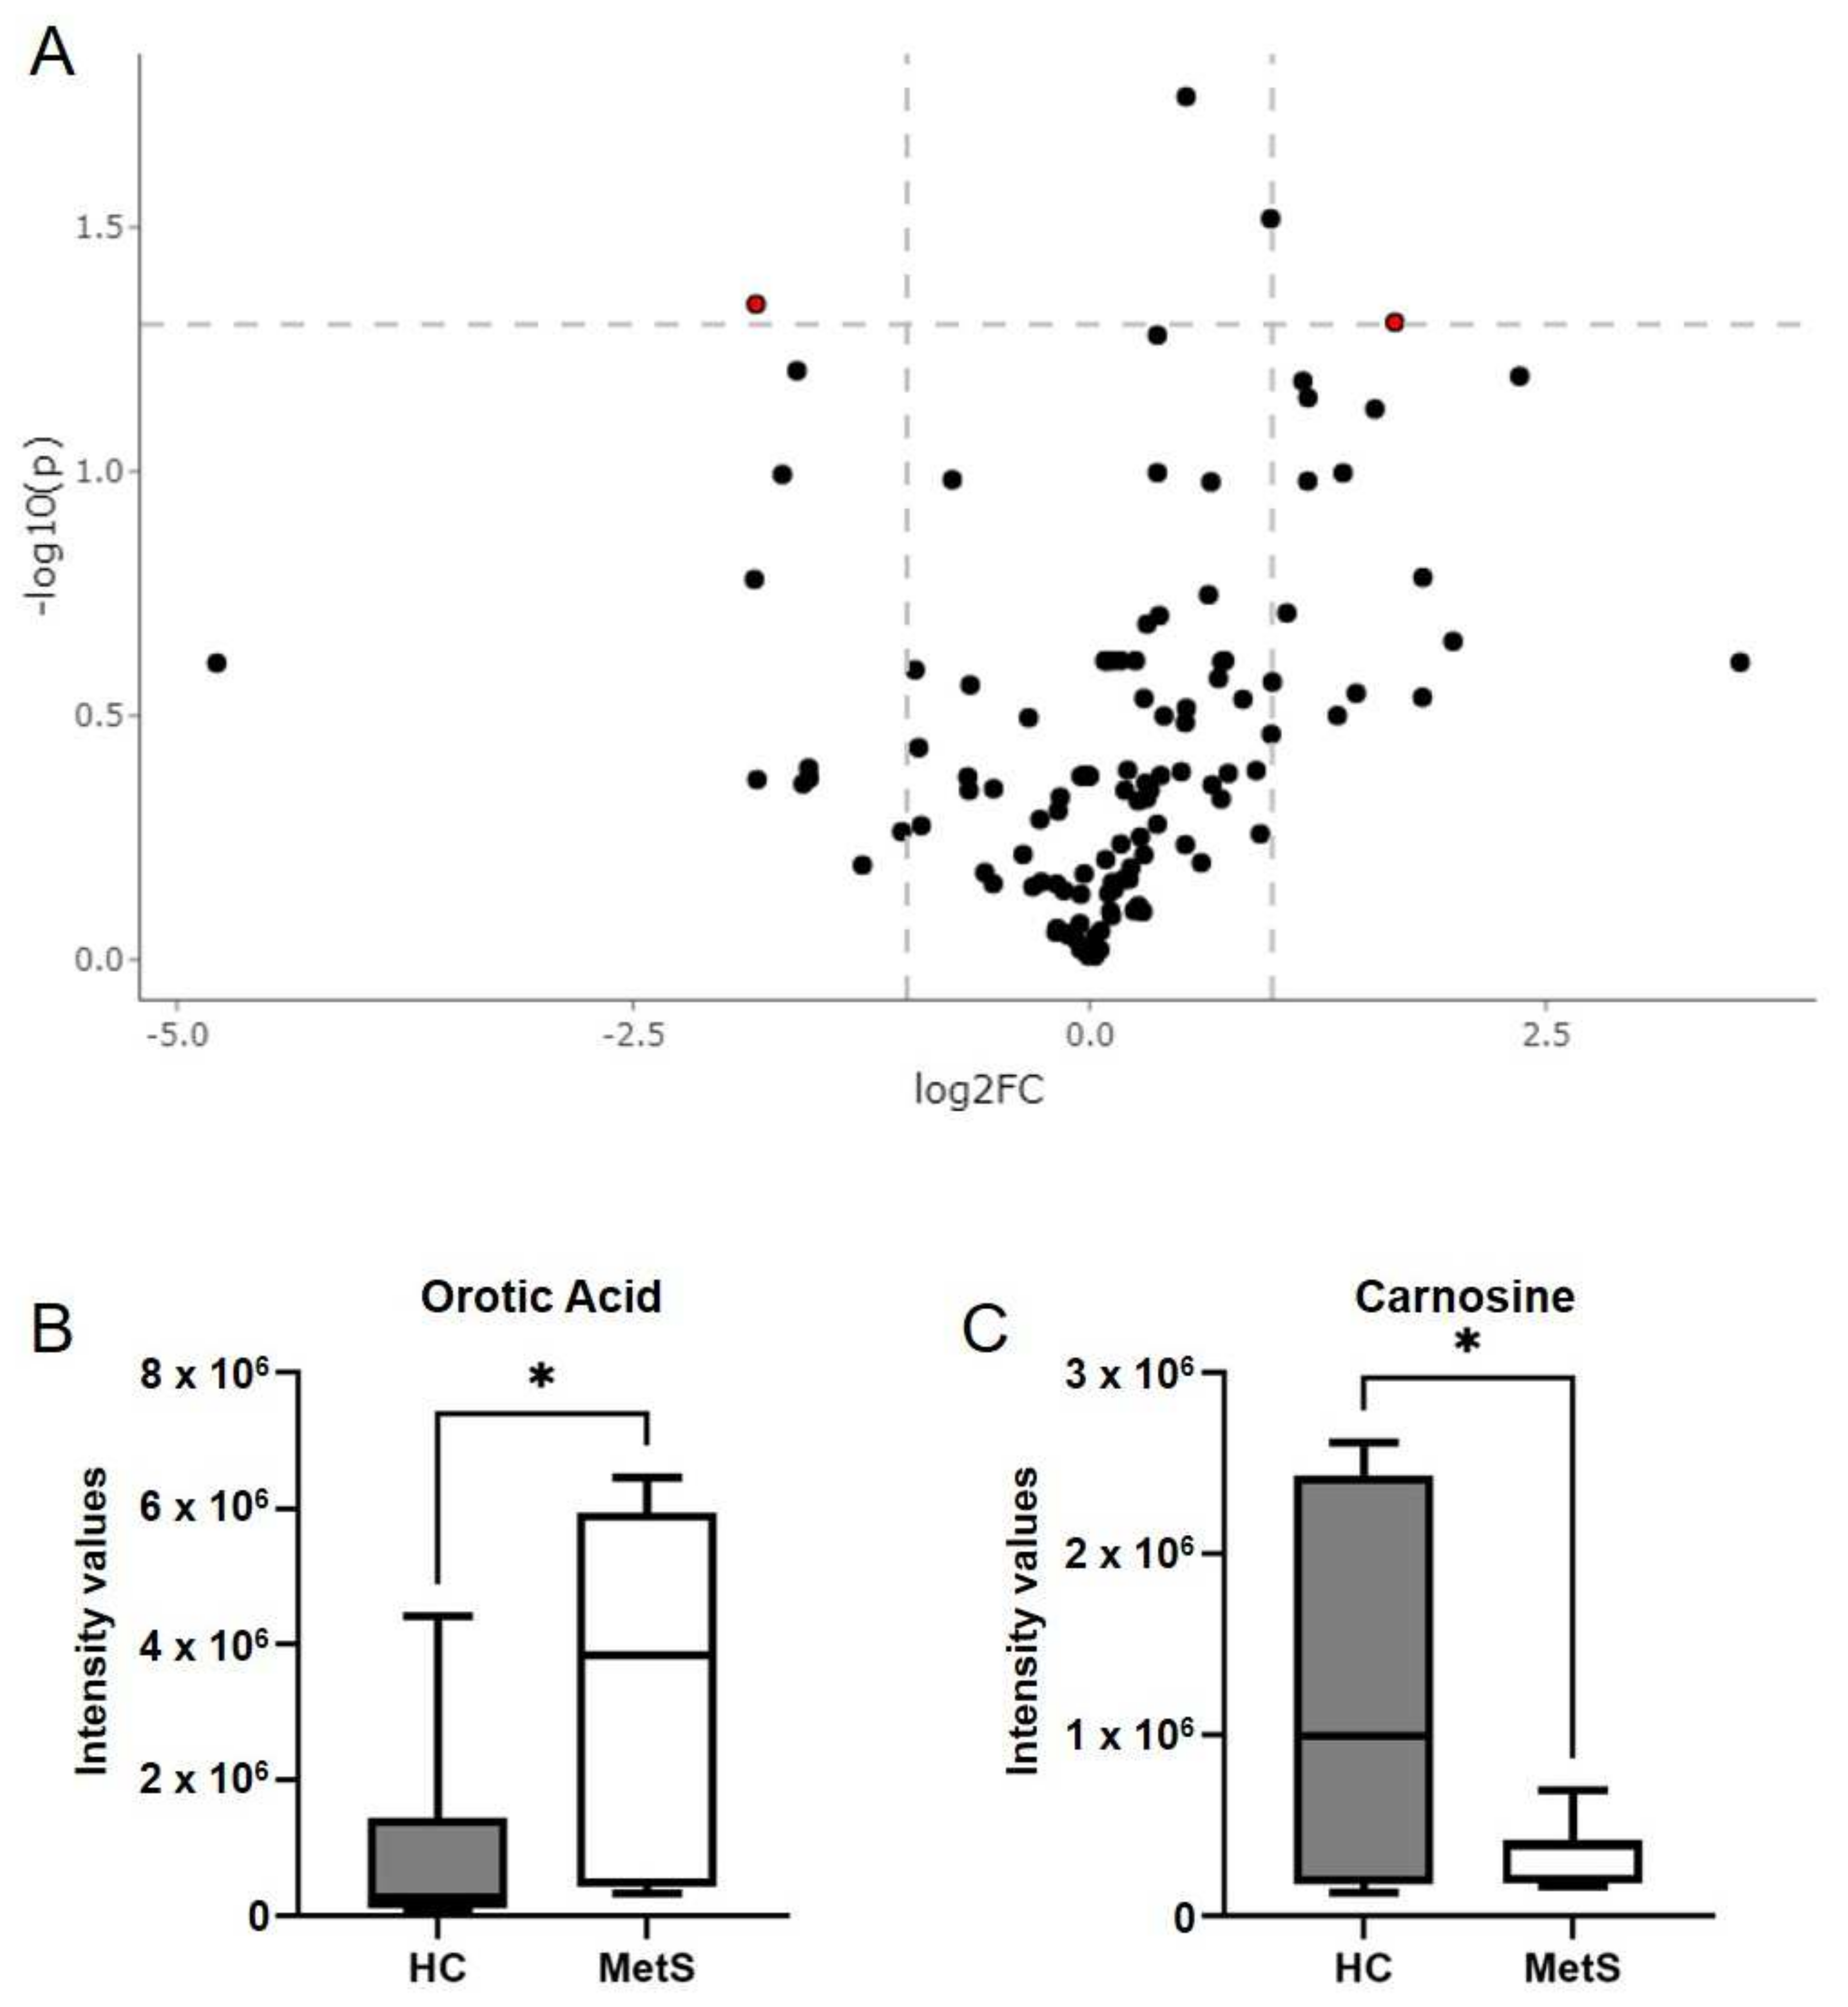
2.4. Metabolomics Revealed Altered Fecal Metabolites in Metabolic Syndrome Participants
3. Discussion
4. Conclusions
5. Limitation of the Study
6. Methods
6.1. Participants
6.2. Clinical Visit
6.3. Intestinal Permeability Assay
6.4. Fecal Metabolomics
6.5. Statistical Analysis
Supplementary Materials
Author Contributions
Funding
Institutional Review Board Statement
Informed Consent Statement
Data Availability Statement
Acknowledgments
Conflicts of Interest
References
- Saklayen, M.G. The Global Epidemic of the Metabolic Syndrome. Curr. Hypertens. Rep. 2018, 20, 12. [Google Scholar] [CrossRef] [PubMed] [Green Version]
- Vaquero Alvarez, M.; Aparicio-Martinez, P.; Fonseca Pozo, F.J.; Valle Alonso, J.; Blancas Sanchez, I.M.; Romero-Saldana, M. A Sustainable Approach to the Metabolic Syndrome in Children and Its Economic Burden. Int. J. Environ. Res. Public Health 2020, 17, 1891. [Google Scholar] [CrossRef] [PubMed] [Green Version]
- Scholze, J.; Alegria, E.; Ferri, C.; Langham, S.; Stevens, W.; Jeffries, D.; Uhl-Hochgraeber, K. Epidemiological and economic burden of metabolic syndrome and its consequences in patients with hypertension in Germany, Spain and Italy; a prevalence-based model. BMC Public Health 2010, 10, 529. [Google Scholar] [CrossRef] [PubMed] [Green Version]
- Simmons, R.K.A.K.; Gale, E.A.; Colagiuri, S.; Tuomilehto, J.; Qiao, Q.; Ramachandran, A.; Tajima, N.; Brajkovich Mirchov, I.; Ben-Nakhi, A.; Reaven, G.; et al. The metabolic syndrome: Useful concept or clinical tool? Report of a WHO Expert Consultation. Diabetologia 2010, 53, 600–605. [Google Scholar] [CrossRef]
- Eckel, R.H.; Alberti, K.G.; Grundy, S.M.; Zimmet, P.Z. The metabolic syndrome. Lancet 2010, 375, 181–183. [Google Scholar] [CrossRef]
- Li, X.; Zhai, Y.; Zhao, J.; He, H.; Li, Y.; Liu, Y.; Feng, A.; Li, L.; Hunag, T.; Xu, A.; et al. Impact of Metabolic Syndrome and It’s Components on Prognosis in Patients with Cardiovascular Diseases: A Meta-Analysis. Front. Cardiovasc. Med. 2021, 8, 704145. [Google Scholar] [CrossRef]
- Mottillo, S.; Filion, K.B.; Genest, J.; Joseph, L.; Pilote, L.; Poirier, P.; Rinfret, S.; Schiffrin, E.L.; Eisenberg, M.J. The Metabolic Syndrome and Cardiovascular Risk: A Systematic Review and Meta-Analysis. J. Am. Coll. Cardiol. 2010, 56, 1113–1132. [Google Scholar] [CrossRef] [Green Version]
- Shin, J.-A.; Lee, J.-H.; Lim, S.-Y.; Ha, H.-S.; Kwon, H.-S.; Park, Y.-M.; Lee, W.-C.; Kang, M.-I.; Yim, H.-W.; Yoon, K.-H.; et al. Metabolic syndrome as a predictor of type 2 diabetes, and its clinical interpretations and usefulness. J. Diabetes Investig. 2013, 4, 334–343. [Google Scholar] [CrossRef]
- Lee, M.-K.; Han, K.; Kim, M.K.; Koh, E.S.; Kim, E.S.; Nam, G.E.; Kwon, H.-S. Changes in metabolic syndrome and its components and the risk of type 2 diabetes: A nationwide cohort study. Sci. Rep. 2020, 10, 2313. [Google Scholar] [CrossRef]
- Yki-Järvinen, H. Diagnosis of non-alcoholic fatty liver disease (NAFLD). Diabetologia 2016, 59, 1104–1111. [Google Scholar] [CrossRef] [Green Version]
- Turati, F.; Talamini, R.; Pelucchi, C.; Polesel, J.; Franceschi, S.; Crispo, A.; Izzo, F.; La Vecchia, C.; Boffetta, P.; Montella, M. Metabolic syndrome and hepatocellular carcinoma risk. Br. J. Cancer 2012, 108, 222–228. [Google Scholar] [CrossRef] [Green Version]
- Seppälä-Lindroos, A.; Vehkavaara, S.; Häkkinen, A.M.; Goto, T.; Westerbacka, J.; Sovijärvi, A.; Halavaara, J.; Yki-Jarvinene, H. Fat accumulation in the liver is associated with defects in insulin suppression of glucose production and serum free fatty acids independent of obesity in normal men. J. Clin. Endocrinol. Metab. 2002, 87, 3023–3028. [Google Scholar] [CrossRef] [Green Version]
- Petersen, M.C.; Shulman, G.I. Mechanisms of Insulin Action and Insulin Resistance. Physiol. Rev. 2018, 98, 2133–2223. [Google Scholar] [CrossRef] [Green Version]
- Kotronen, A.; Westerbacka, J.; Bergholm, R.; Pietilainen, K.H.; Yki-Jarvinen, H. Liver Fat in the Metabolic Syndrome. J. Clin. Endocrinol. Metab. 2007, 92, 3490–3497. [Google Scholar] [CrossRef]
- Ma, M.; Liu, H.; Yu, J.; He, S.; Li, P.; Ma, C.; Zhang, H.; Xu, L.; Ping, F.; Li, W.; et al. Triglyceride is independently correlated with insulin resistance and islet beta cell function: A study in population with different glucose and lipid metabolism states. Lipids Health Dis. 2020, 19, 121. [Google Scholar] [CrossRef]
- Park, H.M.; Lee, H.S.; Lee, Y.-J.; Lee, J.-H. The triglyceride–glucose index is a more powerful surrogate marker for predicting the prevalence and incidence of type 2 diabetes mellitus than the homeostatic model assessment of insulin resistance. Diabetes Res. Clin. Pract. 2021, 180, 109042. [Google Scholar] [CrossRef]
- Chalasani, N.; Younossi, Z.; Lavine, J.E.; Diehl, A.M.; Brunt, E.M.; Cusi, K.; Charlton, M.; Sanyal, A.J. The diagnosis and management of non-alcoholic fatty liver disease: Practice Guideline by the American Association for the Study of Liver Diseases, American College of Gastroenterology, and the American Gastroenterological Association. Hepatology 2012, 55, 2005–2023. [Google Scholar] [CrossRef]
- Parameswaran, M.; Hasan, H.A.; Sadeque, J.; Jhaveri, S.; Avanthika, C.; Arisoyin, A.E.; Dhanani, M.B.; Rath, S.M. Factors That Predict the Progression of Non-alcoholic Fatty Liver Disease (NAFLD). Cureus 2021, 13, e20776. [Google Scholar] [CrossRef]
- Bence, K.K.; Birnbaum, M.J. Metabolic drivers of non-alcoholic fatty liver disease. Mol. Metab. 2020, 50, 101143. [Google Scholar] [CrossRef]
- Younossi, Z.; Anstee, Q.M.; Marietti, M.; Hardy, T.; Henry, L.; Eslam, M.; George, J.; Bugianesi, E. Global burden of NAFLD and NASH: Trends, predictions, risk factors and prevention. Nat. Rev. Gastroenterol. Hepatol. 2018, 15, 11–20. [Google Scholar] [CrossRef]
- Eslam, M.; Sanyal, A.J.; George, J.; on behalf of the International Consensus Panel. MAFLD: A Consensus-Driven Proposed Nomenclature for Metabolic Associated Fatty Liver Disease. Gastroenterology 2020, 158, 1999–2014. [Google Scholar] [CrossRef] [PubMed]
- Tacke, F.; Weiskirchen, R. Non-alcoholic fatty liver disease (NAFLD)/non-alcoholic steatohepatitis (NASH)-related liver fibrosis: Mechanisms, treatment and prevention. Ann. Transl. Med. 2021, 9, 729. [Google Scholar] [CrossRef] [PubMed]
- Brunt, E.M.; Kleiner, D.E.; Carpenter, D.H.; Rinella, M.; Harrison, S.A.; Loomba, R.; Younossi, Z.; Neuschwander-Tetri, B.A.; Sanyal, A.J.; for the American Association for the Study of Liver Diseases NASH Task Force. NAFLD: Reporting Histologic Findings in Clinical Practice. Hepatology 2020, 73, 2028–2038. [Google Scholar] [CrossRef] [PubMed]
- Yki-Järvinen, H. Non-alcoholic fatty liver disease as a cause and a consequence of metabolic syndrome. Lancet Diabetes Endocrinol. 2014, 2, 901–910. [Google Scholar] [CrossRef]
- Kawaguchi, T.; Torimura, T. Is metabolic syndrome responsible for the progression from NAFLD to NASH in non-obese patients? J. Gastroenterol. 2020, 55, 363–364. [Google Scholar] [CrossRef] [Green Version]
- Godoy-Matos, A.F.; Júnior, W.S.S.; Valerio, C.M. NAFLD as a continuum: From obesity to metabolic syndrome and diabetes. Diabetol. Metab. Syndr. 2020, 12, 60. [Google Scholar] [CrossRef]
- Rosato, V.; Masarone, M.; Dallio, M.; Federico, A.; Aglitti, A.; Persico, M. NAFLD and Extra-Hepatic Comorbidities: Current Evidence on a Multi-Organ Metabolic Syndrome. Int. J. Environ. Res. Public Health 2019, 16, 3415. [Google Scholar] [CrossRef] [Green Version]
- Cani, P.D.; Bibiloni, R.; Knauf, C.; Waget, A.; Neyrinck, A.M.; Delzenne, N.M.; Burcelin, R. Changes in Gut Microbiota Control Metabolic Endotoxemia-Induced Inflammation in High-Fat Diet-Induced Obesity and Diabetes in Mice. Diabetes 2008, 57, 1470–1481. [Google Scholar] [CrossRef] [Green Version]
- Petersen, C.; Bell, R.; Klag, K.A.; Lee, S.H.; Soto, R.; Ghazaryan, A.; Buhrke, K.; Ekiz, H.A.; Ost, K.S.; Boudina, S.; et al. T cell-mediated regulation of the microbiota protects against obesity. Science 2019, 365, eaat9351. [Google Scholar] [CrossRef]
- Thaiss, C.A.; Levy, M.; Grosheva, I.; Zheng, D.; Soffer, E.; Blacher, E.; Braverman, S.; Tengeler, A.C.; Barak, O.; Elazar, M.; et al. Hyperglycemia drives intestinal barrier dysfunction and risk for enteric infection. Science 2018, 359, 1376–1383. [Google Scholar] [CrossRef] [Green Version]
- Lécuyer, E.; Le Roy, T.; Gestin, A.; Lacombe, A.; Philippe, C.; Ponnaiah, M.; Huré, J.-B.; Fradet, M.; Ichou, F.; Boudebbouze, S.; et al. Tolerogenic Dendritic Cells Shape a Transmissible Gut Microbiota That Protects from Metabolic Diseases. Diabetes 2021, 70, 2067–2080. [Google Scholar] [CrossRef]
- Brial, F.; Le Lay, A.; Dumas, M.-E.; Gauguier, D. Implication of gut microbiota metabolites in cardiovascular and metabolic diseases. Cell. Mol. Life Sci. 2018, 75, 3977–3990. [Google Scholar] [CrossRef] [Green Version]
- Kayama, H.; Okumura, R.; Takeda, K. Interaction Between the Microbiota, Epithelia, and Immune Cells in the Intestine. Annu. Rev. Immunol. 2020, 38, 23–48. [Google Scholar] [CrossRef]
- Zheng, D.; Liwinski, T.; Elinav, E. Interaction between microbiota and immunity in health and disease. Cell Res. 2020, 30, 492–506. [Google Scholar] [CrossRef]
- Cani, P.D.; Amar, J.; Iglesias, M.A.; Poggi, M.; Knauf, C.; Bastelica, D.; Neyrinck, A.M.; Fava, F.; Tuohy, K.M.; Chabo, C.; et al. Metabolic endotoxemia initiates obesity and insulin resistance. Diabetes 2007, 56, 1761–1772. [Google Scholar] [CrossRef] [Green Version]
- Nier, A.; Engstler, A.J.; Maier, I.B.; Bergheim, I. Markers of intestinal permeability are already altered in early stages of non-alcoholic fatty liver disease: Studies in children. PLoS ONE 2017, 12, e0183282. [Google Scholar] [CrossRef] [Green Version]
- Miele, L.; Giorgio, V.; Liguori, A.; Petta, S.; Pastorino, R.; Arzani, D.; Alberelli, M.A.; Cefalo, C.; Marrone, G.; Biolato, M.; et al. Genetic susceptibility of increased intestinal permeability is associated with progressive liver disease and diabetes in patients with non-alcoholic fatty liver disease. Nutr. Metab. Cardiovasc. Dis. 2020, 30, 2103–2110. [Google Scholar] [CrossRef]
- De Munck, T.J.I.; Xu, P.; Verwijs, H.J.A.; Masclee, A.A.M.; Jonkers, D.; Verbeek, J.; Koek, G.H. Intestinal permeability in human nonalcoholic fatty liver disease: A systematic review and meta-analysis. Liver Int. 2020, 40, 2906–2916. [Google Scholar] [CrossRef]
- Thuy, S.; Ladurner, R.; Volynets, V.; Wagner, S.; Strahl, S.; Konigsrainer, A.; Maier, K.-P.; Bischoff, S.C.; Bergheim, I. Nonalcoholic Fatty Liver Disease in Humans Is Associated with Increased Plasma Endotoxin and Plasminogen Activator Inhibitor 1 Concentrations and with Fructose Intake. J. Nutr. 2008, 138, 1452–1455. [Google Scholar] [CrossRef] [Green Version]
- Mouries, J.; Brescia, P.; Silvestri, A.; Spadoni, I.; Sorribas, M.; Wiest, R.; Mileti, E.; Galbiati, M.; Invernizzi, P.; Adorini, L.; et al. Microbiota-driven gut vascular barrier disruption is a prerequisite for non-alcoholic steatohepatitis development. J. Hepatol. 2019, 71, 1216–1228. [Google Scholar] [CrossRef] [Green Version]
- Miele, L.; Valenza, V.; La Torre, G.; Montalto, M.; Cammarota, G.; Ricci, R.; Masciana, R.; Forgione, A.; Gabrieli, M.L.; Perotti, G.; et al. Increased intestinal permeability and tight junction alterations in nonalcoholic fatty liver disease. Hepatology 2009, 49, 1877–1887. [Google Scholar] [CrossRef]
- Rahman, K.; Desai, C.; Iyer, S.S.; Thorn, N.E.; Kumar, P.; Liu, Y.; Smith, T.; Neish, A.S.; Li, H.; Tan, S.; et al. Loss of Junctional Adhesion Molecule A Promotes Severe Steatohepatitis in Mice on a Diet High in Saturated Fat, Fructose, and Cholesterol. Gastroenterology 2016, 151, 733–746. [Google Scholar] [CrossRef] [Green Version]
- Luther, J.; Garber, J.J.; Khalili, H.; Dave, M.; Bale, S.S.; Jindal, R.; Motola, D.L.; Luther, S.; Bohr, S.; Jeoung, S.W.; et al. Hepatic Injury in Nonalcoholic Steatohepatitis Contributes to Altered Intestinal Permeability. Cell. Mol. Gastroenterol. Hepatol. 2015, 1, 222–232. [Google Scholar] [CrossRef] [Green Version]
- Shen, F.; Zheng, R.-D.; Sun, X.-Q.; Ding, W.-J.; Wang, X.-Y.; Fan, J.-G. Gut microbiota dysbiosis in patients with non-alcoholic fatty liver disease. Hepatobiliary Pancreat. Dis. Int. 2017, 16, 375–381. [Google Scholar] [CrossRef]
- Panasevich, M.R.; Meers, G.M.; Linden, M.A.; Booth, F.W.; Perfield, J.W., 2nd; Fritsche, K.L.; Wankhade, U.D.; Chintapalli, S.V.; Shankar, K.; Ibdah, J.A.; et al. High-fat, high-fructose, high-cholesterol feeding causes severe NASH and cecal microbiota dysbiosis in juvenile Ossabaw swine. Am. J. Physiol. Endocrinol. Metab. 2018, 314, E78–E92. [Google Scholar] [CrossRef]
- Brandl, K.; Schnabl, B. Intestinal microbiota and nonalcoholic steatohepatitis. Curr. Opin. Gastroenterol. 2017, 33, 128–133. [Google Scholar] [CrossRef] [Green Version]
- Nistal, E.; Saenz de Miera, L.E.; Ballesteros Pomar, M.; Sánchez-Campos, S.; García-Mediavilla, M.V.; Álvarez-Cuenllas, B.; Linares, P.; Olcoz, J.L.; Arias-Loste, M.T.; García-Lobo, J.M.; et al. An altered fecal microbiota profile in patients with non-alcoholic fatty liver disease (NAFLD) associated with obesity. Rev. Esp. Enferm. Dig. 2019, 111, 275–282. [Google Scholar] [CrossRef]
- Da Silva, H.E.; Teterina, A.; Comelli, E.M.; Taibi, A.; Arendt, B.M.; Fischer, S.E.; Lou, W.; Allard, J.P. Nonalcoholic fatty liver disease is associated with dysbiosis independent of body mass index and insulin resistance. Sci. Rep. 2018, 8, 1466. [Google Scholar] [CrossRef] [Green Version]
- Zhou, D.; Pan, Q.; Xin, F.-Z.; Zhang, R.-N.; He, C.-X.; Chen, G.-Y.; Liu, C.; Chen, Y.-W.; Fan, J.-G. Sodium butyrate attenuates high-fat diet-induced steatohepatitis in mice by improving gut microbiota and gastrointestinal barrier. World J. Gastroenterol. 2017, 23, 60–75. [Google Scholar] [CrossRef]
- Henao-Mejia, J.; Elinav, E.; Jin, C.; Hao, L.; Mehal, W.Z.; Strowig, T.; Thaiss, C.A.; Kau, A.L.; Eisenbarth, S.C.; Jurczak, M.J.; et al. Inflammasome-mediated dysbiosis regulates progression of NAFLD and obesity. Nature 2012, 482, 179–185. [Google Scholar] [CrossRef] [Green Version]
- Jiang, W.; Wu, N.; Wang, X.; Chi, Y.; Zhang, Y.; Qiu, X.; Hu, Y.; Li, J.; Liu, Y. Dysbiosis gut microbiota associated with inflammation and impaired mucosal immune function in intestine of humans with non-alcoholic fatty liver disease. Sci. Rep. 2015, 5, srep08096. [Google Scholar] [CrossRef] [PubMed]
- Boursier, J.; Mueller, O.; Barret, M.; Machado, M.; Fizanne, L.; Araujo-Perez, F.; Guy, C.D.; Seed, P.C.; Rawls, J.F.; David, L.A.; et al. The severity of nonalcoholic fatty liver disease is associated with gut dysbiosis and shift in the metabolic function of the gut microbiota. Hepatology 2016, 63, 764–775. [Google Scholar] [CrossRef] [PubMed] [Green Version]
- Wutthi-In, M.; Cheevadhanarak, S.; Yasom, S.; Kerdphoo, S.; Thiennimitr, P.; Phrommintikul, A.; Chattipakorn, N.; Kittichotirat, W.; Chattipakorn, S. Gut Microbiota Profiles of Treated Metabolic Syndrome Patients and their Relationship with Metabolic Health. Sci. Rep. 2020, 10, 10085. [Google Scholar] [CrossRef] [PubMed]
- Org, E.; Blum, Y.; Kasela, S.; Mehrabian, M.; Kuusisto, J.; Kangas, A.J.; Soininen, P.; Wang, Z.; Ala-Korpela, M.; Hazen, S.L.; et al. Relationships between gut microbiota, plasma metabolites, and metabolic syndrome traits in the METSIM cohort. Genome Biol. 2017, 18, 70. [Google Scholar] [CrossRef]
- Lippert, K.; Kedenko, L.; Antonielli, L.; Gemeier, C.; Leitner, M.; Kautzky-Willer, A.; Paulweber, B.; Hackl, E. Gut microbiota dysbiosis associated with glucose metabolism disorders and the metabolic syndrome in older adults. Benef. Microbes 2017, 8, 545–556. [Google Scholar] [CrossRef]
- Kootte, R.S.; Levin, E.; Salojarvi, J.; Smits, L.P.; Hartstra, A.V.; Udayappan, S.D.; Hermes, G.; Bouter, K.E.; Koopen, A.M.; Holst, J.J.; et al. Improvement of Insulin Sensitivity after Lean Donor Feces in Metabolic Syndrome Is Driven by Baseline Intestinal Microbiota Composition. Cell Metab. 2017, 26, 611–619.e6. [Google Scholar] [CrossRef] [Green Version]
- McPhee, J.; Schertzer, J.D. Immunometabolism of obesity and diabetes: Microbiota link compartmentalized immunity in the gut to metabolic tissue inflammation. Clin. Sci. 2015, 129, 1083–1096. [Google Scholar] [CrossRef]
- Matey-Hernandez, M.L.; Williams, F.M.K.; Potter, T.; Valdes, A.; Spector, T.D.; Menni, C. Genetic and microbiome influence on lipid metabolism and dyslipidemia. Physiol. Genom. 2018, 50, 117–126. [Google Scholar] [CrossRef]
- Luck, H.; Tsai, S.; Chung, J.; Clemente-Casares, X.; Ghazarian, M.; Revelo, X.; Lei, H.; Luk, C.T.; Shi, S.Y.; Surendra, A.; et al. Regulation of Obesity-Related Insulin Resistance with Gut Anti-inflammatory Agents. Cell Metab. 2015, 21, 527–542. [Google Scholar] [CrossRef] [Green Version]
- Frazier, T.H.; DiBaise, J.K.; McClain, C.J. Gut microbiota, intestinal permeability, obesity-induced inflammation, and liver injury. JPEN J. Parenter. Enter. Nutr. 2011, 35 (Suppl. 5), 14S–20S. [Google Scholar] [CrossRef]
- Bleau, C.; Karelis, A.D.; St-Pierre, D.H.; Lamontagne, L. Crosstalk between intestinal microbiota, adipose tissue and skeletal muscle as an early event in systemic low-grade inflammation and the development of obesity and diabetes. Diabetes Metab. Res. Rev. 2014, 31, 545–561. [Google Scholar] [CrossRef]
- Cox, A.J.; Zhang, P.; Bowden, D.W.; Devereaux, B.; Davoren, P.M.; Cripps, A.W.; West, N.P. Increased intestinal permeability as a risk factor for type 2 diabetes. Diabetes Metab. 2017, 43, 163–166. [Google Scholar] [CrossRef]
- Sarafidis, P.A.; Lasaridis, A.N.; Nilsson, P.M.; Pikilidou, M.I.; Stafilas, P.C.; Kanaki, A.; Kazakos, K.; Yovos, J.; Bakris, G.L. Validity and reproducibility of HOMA-IR, 1/HOMA-IR, QUICKI and McAuley’s indices in patients with hypertension and type II diabetes. J. Hum. Hypertens. 2007, 21, 709–716. [Google Scholar] [CrossRef] [Green Version]
- Quon, M.J. QUICKI is a useful and accurate index of insulin sensitivity. J. Clin. Endocrinol. Metab. 2002, 87, 949–951. [Google Scholar] [CrossRef]
- Mohn, A.; Marcovecchio, M.; Chiarelli, F. Validity of HOMA-IR as index of insulin resistance in obesity. J. Pediatr. 2006, 148, 565–566. [Google Scholar] [CrossRef]
- Tilg, H.; Zmora, N.; Adolph, T.E.; Elinav, E. The intestinal microbiota fuelling metabolic inflammation. Nat. Rev. Immunol. 2020, 20, 40–54. [Google Scholar] [CrossRef]
- Bassuk, S.S.; Rifai, N.; Ridker, P.M. High-sensitivity C-reactive protein: Clinical importance. Curr. Probl. Cardiol. 2004, 29, 439–493. [Google Scholar]
- Popa, C.; Netea, M.G.; van Riel, P.L.; van der Meer, J.W.; Stalenhoef, A.F. The role of TNF-alpha in chronic inflammatory conditions, intermediary metabolism, and cardiovascular risk. J. Lipid Res. 2007, 48, 751–762. [Google Scholar] [CrossRef] [Green Version]
- Pauciullo, P.; Gentile, M.; Marotta, G.; Baiano, A.; Ubaldi, S.; Jossa, F.; Iannuzzo, G.; Faccenda, F.; Panico, S.; Rubba, P. Tumor necrosis factor-alpha is a marker of familial combined hyperlipidemia, independently of metabolic syndrome. Metabolism 2008, 57, 563–568. [Google Scholar] [CrossRef]
- Grunfeld, C.; Feingold, K.R. Tumor necrosis factor, cytokines, and the hyperlipidemia of infection. Trends Endocrinol. Metab. 1991, 2, 213–219. [Google Scholar] [CrossRef]
- Winer, D.A.; Winer, S.; Dranse, H.J.; Lam, T.K. Immunologic impact of the intestine in metabolic disease. J. Clin. Investig. 2017, 127, 33–42. [Google Scholar] [CrossRef]
- Sourianarayanane, A.; Garg, G.; Smith, T.H.; Butt, M.I.; McCullough, A.J.; Shen, B. Risk factors of non-alcoholic fatty liver disease in patients with inflammatory bowel disease. J. Crohn’s Colitis 2013, 7, e279–e285. [Google Scholar] [CrossRef]
- Magrì, S.; Paduano, D.; Chicco, F.; Cingolani, A.; Farris, C.; Delogu, G.; Tumbarello, F.; Lai, M.; Melis, A.; Casula, L.; et al. Nonalcoholic fatty liver disease in patients with inflammatory bowel disease: Beyond the natural history. World J. Gastroenterol. 2019, 25, 5676–5686. [Google Scholar] [CrossRef]
- Michalak, A.; Mosińska, P.; Fichna, J. Common links between metabolic syndrome and inflammatory bowel disease: Current overview and future perspectives. Pharmacol. Rep. 2016, 68, 837–846. [Google Scholar] [CrossRef]
- Dragasevic, S.; Stankovic, B.; Kotur, N.; Sokic-Milutinovic, A.; Milovanovic, T.; Lukic, S.; Milosavljevic, T.; Drazilov, S.S.; Klaassen, K.; Pavlovic, S.; et al. Metabolic Syndrome in Inflammatory Bowel Disease: Association with Genetic Markers of Obesity and Inflammation. Metab. Syndr. Relat. Disord. 2020, 18, 31–38. [Google Scholar] [CrossRef]
- Verdugo-Meza, A.; Ye, J.; Dadlani, H.; Ghosh, S.; Gibson, D.L. Connecting the Dots Between Inflammatory Bowel Disease and Metabolic Syndrome: A Focus on Gut-Derived Metabolites. Nutrients 2020, 12, 1434. [Google Scholar] [CrossRef]
- Bjarnason, I. The Use of Fecal Calprotectin in Inflammatory Bowel Disease. Gastroenterol. Hepatol. 2017, 13, 53–56. [Google Scholar]
- Konikoff, M.R.; Denson, L.A. Role of fecal calprotectin as a biomarker of intestinal inflammation in inflammatory bowel disease. Inflamm. Bowel Dis. 2006, 12, 524–534. [Google Scholar] [CrossRef]
- Fagerberg, U.L.; Lööf, L.; Lindholm, J.; Hansson, L.-O.; Finkel, Y. Fecal Calprotectin: A Quantitative Marker of Colonic Inflammation in Children With Inflammatory Bowel Disease. J. Pediatr. Gastroenterol. Nutr. 2007, 45, 414–420. [Google Scholar] [CrossRef]
- Vojdani, A. For the assessment of intestinal permeability, size matters. Altern. Ther. Health Med. 2013, 19, 12–24. [Google Scholar]
- Vorkas, P.A.; Shalhoub, J.; Isaac, G.; Want, E.J.; Nicholson, J.K.; Holmes, E.; Davies, A.H. Metabolic Phenotyping of Atherosclerotic Plaques Reveals Latent Associations between Free Cholesterol and Ceramide Metabolism in Atherogenesis. J. Proteome Res. 2015, 14, 1389–1399. [Google Scholar] [CrossRef] [PubMed] [Green Version]
- Vorkas, P.A.; Isaac, G.; Anwar, M.A.; Davies, A.H.; Want, E.J.; Nicholson, J.K.; Holmes, E. Untargeted UPLC-MS Profiling Pipeline to Expand Tissue Metabolome Coverage: Application to Cardiovascular Disease. Anal. Chem. 2015, 87, 4184–4193. [Google Scholar] [CrossRef] [PubMed] [Green Version]
- Sud, M.; Fahy, E.; Subramaniam, S. Template-based combinatorial enumeration of virtual compound libraries for lipids. J. Cheminform. 2012, 4, 23. [Google Scholar] [CrossRef] [PubMed] [Green Version]
- Wishart, D.S.; Guo, A.; Oler, E.; Wang, F.; Anjum, A.; Peters, H.; Dizon, R.; Sayeeda, Z.; Tian, S.; Lee, B.L.; et al. HMDB 5.0: The Human Metabolome Database for 2022. Nucleic Acids Res. 2021, 50, D622–D631. [Google Scholar] [CrossRef] [PubMed]
- Nolan, C.J.; Prentki, M. Insulin resistance and insulin hypersecretion in the metabolic syndrome and type 2 diabetes: Time for a conceptual framework shift. Diabetes Vasc. Dis. Res. 2019, 16, 118–127. [Google Scholar] [CrossRef] [PubMed]
- Anstee, Q.M.; Targher, G.; Day, C.P. Progression of NAFLD to diabetes mellitus, cardiovascular disease or cirrhosis. Nat. Rev. Gastroenterol. Hepatol. 2013, 10, 330–344. [Google Scholar] [CrossRef]
- Gunn, N.T.; Shiffman, M.L. The Use of Liver Biopsy in Nonalcoholic Fatty Liver Disease: When to Biopsy and in Whom. Clin. Liver Dis. 2018, 22, 109–119. [Google Scholar] [CrossRef]
- Han, X. Lipidomics for studying metabolism. Nat. Rev. Endocrinol. 2016, 12, 668–679. [Google Scholar] [CrossRef]
- Ramos-Molina, B.; Castellano-Castillo, D.; Alcaide-Torres, J.; Pastor, O.; Díaz, R.D.L.; Salas-Salvadó, J.; López-Moreno, J.; Fernández-García, J.C.; Macías-González, M.; Cardona, F.; et al. Differential effects of restrictive and malabsorptive bariatric surgery procedures on the serum lipidome in obese subjects. J. Clin. Lipidol. 2018, 12, 1502–1512. [Google Scholar] [CrossRef]
- Yin, X.; Willinger, C.M.; Keefe, J.; Liu, J.; Fernández-Ortiz, A.; Ibanez, B.; Penalvo, J.; Adourian, A.; Chen, G.; Corella, D.; et al. Lipidomic profiling identifies signatures of metabolic risk. EBioMedicine 2019, 51, 102520. [Google Scholar] [CrossRef] [Green Version]
- Bruzzone, C.; Gil-Redondo, R.; Seco, M.; Barragan, R.; de la Cruz, L.; Cannet, C.; Schäfer, H.; Fang, F.; Diercks, T.; Bizkarguenaga, M.; et al. A molecular signature for the metabolic syndrome by urine metabolomics. Cardiovasc. Diabetol. 2021, 20, 155. [Google Scholar] [CrossRef]
- Monnerie, S.; Comte, B.; Ziegler, D.; Morais, J.A.; Pujos-Guillot, E.; Gaudreau, P. Metabolomic and Lipidomic Signatures of Metabolic Syndrome and its Physiological Components in Adults: A Systematic Review. Sci. Rep. 2020, 10, 669. [Google Scholar] [CrossRef] [Green Version]
- Surowiec, I.; Noordam, R.; Bennett, K.; Beekman, M.; Slagboom, P.E.; Lundstedt, T.; van Heemst, D. Metabolomic and lipidomic assessment of the metabolic syndrome in Dutch middle-aged individuals reveals novel biological signatures separating health and disease. Metabolomics 2019, 15, 23. [Google Scholar] [CrossRef] [Green Version]
- den Besten, G.; van Eunen, K.; Groen, A.K.; Venema, K.; Reijngoud, D.J.; Bakker, B.M. The role of short-chain fatty acids in the interplay between diet, gut microbiota, and host energy metabolism. J. Lipid Res. 2013, 54, 2325–2340. [Google Scholar] [CrossRef] [Green Version]
- Allayee, H.; Hazen, S.L. Contribution of Gut Bacteria to Lipid Levels: Another Metabolic Role for Microbes? Circ. Res. 2015, 117, 750–754. [Google Scholar] [CrossRef]
- Suzuki, T.; Yoshida, S.; Hara, H. Physiological concentrations of short-chain fatty acids immediately suppress colonic epithelial permeability. Br. J. Nutr. 2008, 100, 297–305. [Google Scholar] [CrossRef] [Green Version]
- Smith, P.M.; Howitt, M.R.; Panikov, N.; Michaud, M.; Gallini, C.A.; Bohlooly, Y.M.; Glickman, J.N.; Garrett, W.S. The microbial metabolites, short-chain fatty acids, regulate colonic Treg cell homeostasis. Science 2013, 341, 569–573. [Google Scholar] [CrossRef] [Green Version]
- Yang, W.; Yu, T.; Huang, X.; Bilotta, A.J.; Xu, L.; Lu, Y.; Sun, J.; Pan, F.; Zhou, J.; Zhang, W.; et al. Intestinal microbiota-derived short-chain fatty acids regulation of immune cell IL-22 production and gut immunity. Nat. Commun. 2020, 11, 4457. [Google Scholar] [CrossRef]
- Sun, M.; Wu, W.; Chen, L.; Yang, W.; Huang, X.; Ma, C.; Chen, F.; Xiao, Y.; Zhao, Y.; Ma, C.; et al. Microbiota-derived short-chain fatty acids promote Th1 cell IL-10 production to maintain intestinal homeostasis. Nat. Commun. 2018, 9, 3555. [Google Scholar] [CrossRef] [Green Version]
- Goncalves, P.; Araujo, J.R.; Di Santo, J.P. A Cross-Talk Between Microbiota-Derived Short-Chain Fatty Acids and the Host Mucosal Immune System Regulates Intestinal Homeostasis and Inflammatory Bowel Disease. Inflamm. Bowel Dis. 2018, 24, 558–572. [Google Scholar] [CrossRef] [Green Version]
- Kelly, C.J.; Zheng, L.; Campbell, E.L.; Saeedi, B.; Scholz, C.C.; Bayless, A.J.; Wilson, K.E.; Glover, L.E.; Kominsky, D.J.; Magnuson, A.; et al. Crosstalk between Microbiota-Derived Short-Chain Fatty Acids and Intestinal Epithelial HIF Augments Tissue Barrier Function. Cell Host Microbe 2015, 17, 662–671. [Google Scholar] [CrossRef] [Green Version]
- Anjani, K.; Lhomme, M.; Sokolovska, N.; Poitou, C.; Aron-Wisnewsky, J.; Bouillot, J.L.; Lesnik, P.; Bedossa, P.; Kontush, A.; Clement, K.; et al. Circulating phospholipid profiling identifies portal contribution to NASH signature in obesity. J. Hepatol. 2015, 62, 905–912. [Google Scholar] [CrossRef] [Green Version]
- Papandreou, C.; Bullò, M.; Tinahones, F.J.; Martínez-González, M.; Corella, D.; Fragkiadakis, G.A.; López-Miranda, J.; Estruch, R.; Fitó, M.; Salas-Salvadó, J. Serum metabolites in non-alcoholic fatty-liver disease development or reversion; a targeted metabolomic approach within the PREDIMED trial. Nutr. Metab. 2017, 14, 58. [Google Scholar] [CrossRef] [Green Version]
- Luukkonen, P.K.; Zhou, Y.; Sädevirta, S.; Leivonen, M.; Arola, J.; Oresic, M.; Hyötyläinen, T.; Yki-Järvinen, H. Hepatic ceramides dissociate steatosis and insulin resistance in patients with non-alcoholic fatty liver disease. J. Hepatol. 2016, 64, 1167–1175. [Google Scholar] [CrossRef] [Green Version]
- Syme, C.; Czajkowski, S.; Shin, J.; Abrahamowicz, M.; Leonard, G.; Perron, M.; Richer, L.; Veillette, S.; Gaudet, D.; Strug, L.; et al. Glycerophosphocholine Metabolites and Cardiovascular Disease Risk Factors in Adolescents: A Cohort Study. Circulation 2016, 134, 1629–1636. [Google Scholar] [CrossRef]
- Ferrannini, E.; Natali, A.; Camastra, S.; Nannipieri, M.; Mari, A.; Adam, K.P.; Milburn, M.V.; Kastenmüller, G.; Adamski, J.; Tuomi, T.; et al. Early metabolic markers of the development of dysglycemia and type 2 diabetes and their physiological significance. Diabetes 2013, 62, 1730–1737. [Google Scholar] [CrossRef] [Green Version]
- Lemaitre, R.N.; Yu, C.; Hoofnagle, A.; Hari, N.; Jensen, P.N.; Fretts, A.M.; Umans, J.G.; Howard, B.V.; Sitlani, C.M.; Siscovick, D.S.; et al. Circulating Sphingolipids, Insulin, HOMA-IR, and HOMA-B: The Strong Heart Family Study. Diabetes 2018, 67, 1663–1672. [Google Scholar] [CrossRef] [Green Version]
- McGurk, K.A.; Keavney, B.D.; Nicolaou, A. Circulating ceramides as biomarkers of cardiovascular disease: Evidence from phenotypic and genomic studies. Atherosclerosis 2021, 327, 18–30. [Google Scholar] [CrossRef] [PubMed]
- Laaksonen, R.; Ekroos, K.; Sysi-Aho, M.; Hilvo, M.; Vihervaara, T.; Kauhanen, D.; Suoniemi, M.; Hurme, R.; März, W.; Scharnagl, H.; et al. Plasma ceramides predict cardiovascular death in patients with stable coronary artery disease and acute coronary syndromes beyond LDL-cholesterol. Eur. Heart J. 2016, 37, 1967–1976. [Google Scholar] [CrossRef] [PubMed]
- Xia, J.Y.; Holland, W.L.; Kusminski, C.M.; Sun, K.; Sharma, A.X.; Pearson, M.J.; Sifuentes, A.J.; McDonald, J.G.; Gordillo, R.; Scherer, P.E. Targeted Induction of Ceramide Degradation Leads to Improved Systemic Metabolism and Reduced Hepatic Steatosis. Cell Metab. 2015, 22, 266–278. [Google Scholar] [CrossRef] [PubMed] [Green Version]
- Chaurasia, B.; Tippetts, T.S.; Mayoral Monibas, R.; Liu, J.; Li, Y.; Wang, L.; Wilkerson, J.L.; Rufus Sweeney, C.; Pereira, R.F.; Sumida, D.H.; et al. Targeting a ceramide double bond improves insulin resistance and hepatic steatosis. Science 2019, 365, 386–392. [Google Scholar] [CrossRef]
- Duan, R.-D. Physiological functions and clinical implications of sphingolipids in the gut. J. Dig. Dis. 2011, 12, 60–70. [Google Scholar] [CrossRef]
- Johnson, E.L.; Heaver, S.L.; Waters, J.L.; Kim, B.I.; Bretin, A.; Goodman, A.L.; Gewirtz, A.T.; Worgall, T.S.; Ley, R.E. Sphingolipids produced by gut bacteria enter host metabolic pathways impacting ceramide levels. Nat. Commun. 2020, 11, 2471. [Google Scholar] [CrossRef]
- Choi, Y.-J.; Yoon, Y.; Lee, K.-Y.; Kang, Y.-P.; Lim, D.K.; Kwon, S.W.; Kang, K.-W.; Lee, S.-M.; Lee, B.-H. Orotic Acid Induces Hypertension Associated with Impaired Endothelial Nitric Oxide Synthesis. Toxicol. Sci. 2015, 144, 307–317. [Google Scholar] [CrossRef] [Green Version]
- Windmueller, H.G.; Mcdaniel, E.G.; Spaeth, A. Orotic acid-induced fatty liver: Metabolic studies in conventional and germ-free rats. Arch. Biochem. Biophys. 1965, 109, 13–19. [Google Scholar] [CrossRef]
- Bang, W.S.; Hwang, Y.R.; Li, Z.; Lee, I.; Kang, H.E. Effects of Orotic Acid-Induced Non-Alcoholic Fatty Liver on the Pharmacokinetics of Metoprolol and its Metabolites in Rats. J. Pharm. Pharm. Sci. 2019, 22, 98–111. [Google Scholar] [CrossRef] [Green Version]
- Al-Sawalha, N.A.; Alshogran, O.; Awawdeh, M.S.; Almomani, B.A. The effects of l-Carnosine on development of metabolic syndrome in rats. Life Sci. 2019, 237, 116905. [Google Scholar] [CrossRef]
- Nagai, K.; Tanida, M.; Niijima, A.; Tsuruoka, N.; Kiso, Y.; Horii, Y.; Shen, J.; Okumura, N. Role of l-carnosine in the control of blood glucose, blood pressure, thermogenesis, and lipolysis by autonomic nerves in rats: Involvement of the circadian clock and histamine. Amino Acids 2012, 43, 97–109. [Google Scholar] [CrossRef]
- Anderson, E.J.; Vistoli, G.; Katunga, L.A.; Funai, K.; Regazzoni, L.; Monroe, B.; Gilardoni, E.; Cannizzaro, L.; Colzani, M.; De Maddis, D.; et al. A carnosine analog mitigates metabolic disorders of obesity by reducing carbonyl stress. J. Clin. Investig. 2018, 128, 5280–5293. [Google Scholar] [CrossRef]
- Baye, E.; Ukropec, J.; De Courten, M.P.; Vallova, S.; Krumpolec, P.; Kurdiova, T.; Aldini, G.; Ukropcova, B.; de Courten, B. Effect of carnosine supplementation on the plasma lipidome in overweight and obese adults: A pilot randomised controlled trial. Sci. Rep. 2017, 7, 17458. [Google Scholar] [CrossRef]
- Lee, Y.-T.; Hsu, C.-C.; Lin, M.-H.; Liu, K.-S.; Yin, M.-C. Histidine and carnosine delay diabetic deterioration in mice and protect human low density lipoprotein against oxidation and glycation. Eur. J. Pharmacol. 2005, 513, 145–150. [Google Scholar] [CrossRef]
- Arnone, D.; Vallier, M.; Hergalant, S.; Chabot, C.; Ndiaye, N.C.; Moulin, D.; Aignatoaei, A.-M.; Alberto, J.-M.; Louis, H.; Boulard, O.; et al. Long-Term Overconsumption of Fat and Sugar Causes a Partially Reversible Pre-inflammatory Bowel Disease State. Front. Nutr. 2021, 8, 758518. [Google Scholar] [CrossRef]
- Gulhane, M.; Murray, L.; Lourie, R.; Tong, H.; Sheng, Y.H.; Wang, R.; Kang, A.; Schreiber, V.; Wong, K.Y.; Magor, G.; et al. High Fat Diets Induce Colonic Epithelial Cell Stress and Inflammation that is Reversed by IL-22. Sci. Rep. 2016, 6, 28990. [Google Scholar] [CrossRef] [Green Version]
- Zhang, X.; Monnoye, M.; Mariadassou, M.; Beguet-Crespel, F.; Lapaque, N.; Heberden, C.; Douard, V. Glucose but Not Fructose Alters the Intestinal Paracellular Permeability in Association with Gut Inflammation and Dysbiosis in Mice. Front. Immunol. 2021, 12, 742584. [Google Scholar] [CrossRef]
- Ponziani, F.R.; Bhoori, S.; Castelli, C.; Putignani, L.; Rivoltini, L.; Del Chierico, F.; Sanguinetti, M.; Morelli, D.; Sterbini, F.P.; Petito, V.; et al. Hepatocellular Carcinoma Is Associated With Gut Microbiota Profile and Inflammation in Nonalcoholic Fatty Liver Disease. Hepatology 2019, 69, 107–120. [Google Scholar] [CrossRef]
- Gundling, F.; Schmidtler, F.; Hapfelmeier, A.; Schulte, B.; Schmidt, T.; Pehl, C.; Schepp, W.; Seidl, H. Fecal calprotectin is a useful screening parameter for hepatic encephalopathy and spontaneous bacterial peritonitis in cirrhosis. Liver Int. 2011, 31, 1406–1415. [Google Scholar] [CrossRef]
- Lin, X.-F.; Shi, K.-Q.; You, J.; Liu, W.-Y.; Luo, Y.-W.; Wu, F.-L.; Chen, Y.-P.; Wong, D.K.-H.; Yuen, M.-F.; Zheng, M.-H. Increased risk of colorectal malignant neoplasm in patients with nonalcoholic fatty liver disease: A large study. Mol. Biol. Rep. 2014, 41, 2989–2997. [Google Scholar] [CrossRef]
- Lin, X.; You, F.; Liu, H.; Fang, Y.; Jin, S.; Wang, Q. Site-specific risk of colorectal neoplasms in patients with non-alcoholic fatty liver disease: A systematic review and meta-analysis. PLoS ONE 2021, 16, e0245921. [Google Scholar] [CrossRef]
- Cho, Y.; Lim, S.; Joo, S.K.; Jeong, D.; Kim, J.H.; Bae, J.M.; Park, J.H.; Chang, M.S.; Lee, D.H.; Jung, Y.J.; et al. Nonalcoholic steatohepatitis is associated with a higher risk of advanced colorectal neoplasm. Liver Int. 2019, 39, 1722–1731. [Google Scholar] [CrossRef]
- Xue, L.; He, J.; Gao, N.; Lu, X.; Li, M.; Wu, X.; Liu, Z.; Jin, Y.; Liu, J.; Xu, J.; et al. Probiotics may delay the progression of nonalcoholic fatty liver disease by restoring the gut microbiota structure and improving intestinal endotoxemia. Sci. Rep. 2017, 7, 45176. [Google Scholar] [CrossRef]
- Xiao, M.-W.; Lin, S.-X.; Shen, Z.-H.; Luo, W.-W.; Wang, X.-Y. Systematic Review with Meta-Analysis: The Effects of Probiotics in Nonalcoholic Fatty Liver Disease. Gastroenterol. Res. Pract. 2019, 2019, 1484598. [Google Scholar] [CrossRef] [PubMed]
- Tang, Y.; Huang, J.; Zhang, W.Y.; Qin, S.; Yang, Y.X.; Ren, H.; Yang, Q.-B.; Hu, H. Effects of probiotics on nonalcoholic fatty liver disease: A systematic review and meta-analysis. Ther. Adv. Gastroenterol. 2019, 12, 1756284819878046. [Google Scholar] [CrossRef] [PubMed]
- Qamar, A.A. Probiotics in Nonalcoholic Fatty Liver Disease, Nonalcoholic Steatohepatitis, and Cirrhosis. J. Clin. Gastroenterol. 2015, 49 (Suppl. 1), S28–S32. [Google Scholar] [CrossRef] [PubMed]
- Liu, L.; Li, P.; Liu, Y.; Zhang, Y. Efficacy of Probiotics and Synbiotics in Patients with Nonalcoholic Fatty Liver Disease: A Meta-Analysis. Am. J. Dig. Dis. 2019, 64, 3402–3412. [Google Scholar] [CrossRef]
- Li, Z.; Yang, S.; Lin, H.; Huang, J.; Watkins, P.A.; Moser, A.B.; Desimone, C.; Song, X.; Diehl, A.M. Probiotics and antibodies to TNF inhibit inflammatory activity and improve nonalcoholic fatty liver disease. Hepatology 2003, 37, 343–350. [Google Scholar] [CrossRef]
- Famouri, F.; Shariat, Z.; Hashemipour, M.; Keikha, M.; Kelishadi, R. Effects of Probiotics on Nonalcoholic Fatty Liver Disease in Obese Children and Adolescents. J. Pediatr. Gastroenterol. Nutr. 2017, 64, 413–417. [Google Scholar] [CrossRef]
- Endo, H.; Niioka, M.; Kobayashi, N.; Tanaka, M.; Watanabe, T. Butyrate-Producing Probiotics Reduce Nonalcoholic Fatty Liver Disease Progression in Rats: New Insight into the Probiotics for the Gut-Liver Axis. PLoS ONE 2013, 8, e63388. [Google Scholar] [CrossRef] [Green Version]
- Briskey, D.; Heritage, M.; Jaskowski, L.-A.; Peake, J.; Gobe, G.; Subramaniam, V.N.; Crawford, D.; Campbell, C.; Vitetta, L. Probiotics modify tight-junction proteins in an animal model of nonalcoholic fatty liver disease. Ther. Adv. Gastroenterol. 2016, 9, 463–472. [Google Scholar] [CrossRef] [Green Version]
- Lavekar, A.S.; Raje, D.V.; Manohar, T.; Lavekar, A.A. Role of Probiotics in the Treatment of Nonalcoholic Fatty Liver Disease: A Meta-analysis. Euroasian J. Hepatogastroenterol. 2017, 7, 130–137. [Google Scholar] [CrossRef]
- Litvak, Y.; Byndloss, M.X.; Bäumler, A.J. Colonocyte metabolism shapes the gut microbiota. Science 2018, 362, eaat9076. [Google Scholar] [CrossRef] [Green Version]
- World Health Organization. AUDIT: The Alcohol Use Disorders Identification Test: Guidelines for Use in Primary Health Care; World Health Organization: Geneva, Switzerland, 2001; Available online: https://apps.who.int/iris/handle/10665/67205 (accessed on 5 May 2020).
- Sequeira, I.R.; Lentle, R.G.; Kruger, M.C.; Hurst, R.D. Standardising the Lactulose Mannitol Test of Gut Permeability to Minimise Error and Promote Comparability. PLoS ONE 2014, 9, e99256. [Google Scholar] [CrossRef] [Green Version]
- Kingstone, K.; Gillett, H.R. Lactulose-mannitol intestinal permeability test: A useful screening test for adult coeliac disease. Ann. Clin. Biochem. 2001, 38, 415–416. [Google Scholar]
- Dastych, M.; Dastych, M., Jr.; Novotna, H.; Cihalova, J. Lactulose/mannitol test and specificity, sensitivity, and area under curve of intestinal permeability parameters in patients with liver cirrhosis and Crohn’s disease. Dig. Dis. Sci. 2008, 53, 2789–2792. [Google Scholar] [CrossRef]
- Chen, W.W.; Freinkman, E.; Wang, T.; Birsoy, K.; Sabatini, D.M. Absolute Quantification of Matrix Metabolites Reveals the Dynamics of Mitochondrial Metabolism. Cell 2016, 166, 1324–1337. [Google Scholar] [CrossRef]
- Smith, C.A.; O’Maille, G.; Want, E.J.; Qin, C.; Trauger, S.A.; Brandon, T.R.; Custodio, D.E.; Abagyan, R.; Siuzdak, G. METLIN: A metabolite mass spectral database. Ther. Drug Monit. 2005, 27, 747–751. [Google Scholar] [CrossRef]
- Kind, T.; Liu, K.-H.; Lee, D.Y.; DeFelice, B.; Meissen, J.K.; Fiehn, O. LipidBlast in silico tandem mass spectrometry database for lipid identification. Nat. Methods 2013, 10, 755–758. [Google Scholar] [CrossRef] [Green Version]
- Zhao, S.; Guo, Y.; Sheng, Q.; Shyr, Y. Advanced Heat Map and Clustering Analysis Using Heatmap3. BioMed Res. Int. 2014, 2014, 986048. [Google Scholar] [CrossRef] [Green Version]
- Virtanen, P.; Gommers, R.; Oliphant, T.E.; Haberland, M.; Reddy, T.; Cournapeau, D.; Burovski, E.; Peterson, P.; Weckesser, W.; Bright, J.; et al. SciPy 1.0: Fundamental algorithms for scientific computing in Python. Nat. Methods 2020, 17, 261–272. [Google Scholar] [CrossRef] [Green Version]
- Harris, C.R.; Millman, K.J.; van der Walt, S.J.; Gommers, R.; Virtanen, P.; Cournapeau, D.; Wieser, E.; Taylor, J.; Berg, S.; Smith, N.J.; et al. Array programming with NumPy. Nature 2020, 585, 357–362. [Google Scholar] [CrossRef]
- Hunter, J.D. Matplotlib: A 2D graphics environment. Comput. Sci. Eng. 2007, 9, 90–95. [Google Scholar] [CrossRef]
- Pedregosa, F.; Varoquaux, G.; Gramfort, A.; Michel, V.; Thirion, B.; Grisel, O.; Blondel, M.; Prettenhofer, P.; Weiss, R.; Dubourg, V.; et al. Scikit-learn: Machine Learning in Python. J. Mach. Learn. Res. 2011, 12, 2825–2830. [Google Scholar]


| Demographics | Controls | Metabolic Syndrome | |
|---|---|---|---|
| Gender | Male | 4 | 3 |
| Female | 6 | 5 | |
| Age | Median | 42.50 | 50.50 |
| Minimum | 31 | 45 | |
| Maximum | 56 | 58 | |
| Race/Ethnicity | Non-Hispanic White | 4 | 2 |
| Hispanic | 6 | 4 | |
| Native American | 1 | ||
| Black | 1 |
| Feature ID | Observed m/z | Log2 Fold Change | p-Value | Putative ID * (Category) | Main Class (Abbrev. Chains) |
| 5617 | 771.5399 | 4.076 | 0.016 | Glycerolipids | Triradylglycerols (TG 12:0_12:0_22:3) |
| 1432 | 558.4388 | 3.477 | 0.033 | Glycerophospholipids | Oxid. glycerophospholipids (LPC 0:0/20:4;O) |
| 4631 | 665.7446 | 3.367 | 0.025 | Glycerolipids | Diradylglycerols (DG 19:0_20:0) |
| 4799 | 680.7542 | 3.333 | 0.032 | Sphingolipids | Ceramides (Cer 18:1;O3/24:0;O) |
| 6916 | 989.5998 | 3.326 | 0.030 | Glycerolipids | Triradylglycerols (TG 19:1_22:6_22:6) |
| 4688 | 672.6672 | 3.326 | 0.042 | Glycerophospholipids | Glycerophosphoethanolamines (PE P-16:0/16:1) |
| 3675 | 571.3263 | 3.261 | 0.039 | Fatty Acyls | Diradylglycerols (DG 13:0_20:5) |
| 5044 | 700.6979 | 3.252 | 0.022 | Glycerophospholipids | Glycerophosphocholines (PC P-16:0/15:1) |
| 5270 | 724.7805 | 3.244 | 0.025 | Sphingolipids | Ceramides (Cer 18:1;O3/26:0;O2) |
| 5266 | 724.4458 | 3.231 | 0.007 | Glycerophospholipids | Glycerophosphocholines (PC 12:0_20:4) |
| 6454 | 905.5635 | 3.216 | 0.035 | Glycerolipids | Triradylglycerols (TG 18:3_18:3_20:0) |
| 5128 | 709.7706 | 3.201 | 0.029 | Glycerolipids | Diradylglycerols (DG 21:0_22:6) |
| 5129 | 710.1051 | 3.158 | 0.034 | Polyketides | Flavonoids |
| 7315 | 1371.8158 | 3.127 | 0.007 | Sphingolipids | Neutral glycosphingolipids (Hex(3)-HexNAc-Fuc-Cer 34:1;O2) |
| 4442 | 651.0691 | 3.104 | 0.033 | Polyketides | Flavonoids |
| 1490 | 531.4196 | 3.103 | 0.015 | Fatty Acyls | Fatty esters (FA 36:2) |
| 5383 | 739.1213 | 3.094 | 0.026 | Polyketides | Flavonoids |
| 4961 | 695.0953 | 3.077 | 0.032 | Polyketides | Flavonoids |
| 4980 | 695.7639 | 3.059 | 0.033 | Fatty Acyls | Fatty amides |
| 4982 | 696.0981 | 3.045 | 0.033 | Polyketides | Flavonoids |
Publisher’s Note: MDPI stays neutral with regard to jurisdictional claims in published maps and institutional affiliations. |
© 2022 by the authors. Licensee MDPI, Basel, Switzerland. This article is an open access article distributed under the terms and conditions of the Creative Commons Attribution (CC BY) license (https://creativecommons.org/licenses/by/4.0/).
Share and Cite
Coleman, M.J.; Espino, L.M.; Lebensohn, H.; Zimkute, M.V.; Yaghooti, N.; Ling, C.L.; Gross, J.M.; Listwan, N.; Cano, S.; Garcia, V.; et al. Individuals with Metabolic Syndrome Show Altered Fecal Lipidomic Profiles with No Signs of Intestinal Inflammation or Increased Intestinal Permeability. Metabolites 2022, 12, 431. https://doi.org/10.3390/metabo12050431
Coleman MJ, Espino LM, Lebensohn H, Zimkute MV, Yaghooti N, Ling CL, Gross JM, Listwan N, Cano S, Garcia V, et al. Individuals with Metabolic Syndrome Show Altered Fecal Lipidomic Profiles with No Signs of Intestinal Inflammation or Increased Intestinal Permeability. Metabolites. 2022; 12(5):431. https://doi.org/10.3390/metabo12050431
Chicago/Turabian StyleColeman, Mia J., Luis M. Espino, Hernan Lebensohn, Marija V. Zimkute, Negar Yaghooti, Christina L. Ling, Jessica M. Gross, Natalia Listwan, Sandra Cano, Vanessa Garcia, and et al. 2022. "Individuals with Metabolic Syndrome Show Altered Fecal Lipidomic Profiles with No Signs of Intestinal Inflammation or Increased Intestinal Permeability" Metabolites 12, no. 5: 431. https://doi.org/10.3390/metabo12050431