Review

In Vivo Magnetic Resonance Spectroscopy Methods for Investigating Cardiac Metabolism

by
Morteza Esmaeili
1,2,* and
Riyas Vettukattil
3,4
1
Department of Diagnostic Imaging, Akershus University Hospital, 1478 Lørenskog, Norway
2
Department of Electrical Engineering and Computer Science, Faculty of Science and Technology, University of Stavanger, 4021 Stavanger, Norway
3
Faculty of Medicine, Institute of Clinical Medicine, University of Oslo, 0315 Oslo, Norway
4
Division of Paediatric and Adolescent Medicine, Oslo University Hospital, 0372 Oslo, Norway
*
Author to whom correspondence should be addressed.
Metabolites 2022, 12(2), 189; https://doi.org/10.3390/metabo12020189
Submission received: 30 November 2021 / Revised: 14 February 2022 / Accepted: 15 February 2022 / Published: 18 February 2022

Abstract

:
Magnetic resonance spectroscopy (MRS) is a non-invasive and non-ionizing technique, enabling in vivo investigation of cardiac metabolism in normal and diseased hearts. In vivo measurement tools are critical for studying mechanisms that regulate cardiac energy metabolism in disease developments and to assist in early response assessments to novel therapies. For cardiac MRS, proton (1H), phosphorus (31P), and hyperpolarized 13-carbon (13C) provide valuable metabolic information for diagnosis and treatment assessment purposes. Currently, low sensitivity and some technical limitations limit the utility of MRS. An essential step in translating MRS for clinical use involves further technological improvements, particularly in coil design, improving the signal-to-noise ratios, field homogeneity, and optimizing radiofrequency sequences. This review addresses the recent advances in metabolic imaging by MRS from primarily the literature published since 2015.

1. Myocardial Metabolism in Failing Heart

The heart is one of the most energy-consuming organs in our body. To tackle its high energy demand, heart muscles (myocardium) have a complex and efficient metabolic machinery for high energy phosphate and adenosine triphosphate (ATP) production from various energy substrates, such as fatty acids, carbohydrates, and ketones. The heart muscles are highly flexible in their energy metabolism and quickly adapt to the growing energy demand. In heart failure (HF) disease, the heart muscles cannot adequately pump and circulate blood through the body. Moreover, there is a loss of flexibility in the myocardial energy metabolism, which results in impaired ATP production. HF is continuously evolving, with an estimation of over 25 million diagnosed patients globally [1]. This complex disease is fatal and poses a significant socio-economic burden to the healthcare system [2,3]. Heart failure is diagnosed by a spectrum of symptoms. The heart cannot maintain regular contractions, harmonic systolic and diastolic movements, and overall circulation functionality. Metabolic remodeling may serve as a signature of a failing heart.
The term “engine out of fuel” is often used in the literature to precisely describe the interplay between failing heart and bioenergetics dynamics [4]. The failing heart cannot compensate for the increased energy demands due to less efficient energy metabolism [5]. Dysregulated metabolism may also be extended to skeletal muscles with similar bioenergetics starvation symptoms. Together, these shortages in biosynthetic metabolism contribute to the deterioration of patients’ general health and mobility, experiencing muscle weakness, fatigue, exercise limitation, and dyspnea to disease progression. Magnetic resonance spectroscopy (MRS) is the only in vivo method that allows cardiac metabolism investigations non-invasively. Despite the complications of performing clinical MRS, translating the technique into clinical cardiac examination is not impossible, as described in this paper.

2. ATP and Phosphocreatine

The most energy-consuming reactions in the heart, such as the contraction of the myofilaments of the active pump function, are fueled by ATP utilization. ATP is partly obtained from phosphocreatine (PCr) via the creatine-kinase (CK) process occurring in the mitochondria (CKmitochondrial) (Figure 1). The heart uses PCr as the prime temporal and spatial energy reserve [6]. PCr transports energy within the cell and acts as a short-term energy buffer, which helps in the rapid regeneration of ATP at increased demand. Mitochondrial dysfunction leads to myocardial energy depletion by poor energy transfer to the myofibrils and impaired uptake and use of ATP and PCr [7]. The enzyme CKmitochondrial helps transfer ATP’s gamma phosphoryl group to creatine, resulting in the formation of PCr. A reverse reaction follows with a transfer of the phosphoryl group to adenosine diphosphate (ADP) to generate ATP. A reduction in the activity of the CK system is a hallmark of heart failure regardless of etiology [8]. New approaches in measuring altered energetics may be useful in timely detection and monitoring HF.
At rest, free fatty acid oxidation provides the primary energy source for the myocardium [9]. The oxidation of free fatty acids produces up to 60 to 80% of high-energy phosphates at rest [9]. Studies of cardiac metabolism show that in HF, there is a change in the proportion of fatty acid and glucose uptakes and utilization [7]. Unhealthy heart muscles tend to increase the glucose substrate, switching from fatty acids metabolism towards glucose [10,11]. Furthermore, the failing heart increasingly relies on cytosolic glycolysis, reducing mitochondrial fatty acid and glucose oxidation [10,11]. This reprogramming may be interpreted as the heart’s reduced metabolic flexibility and dynamics and a shift towards a single energy source.

3. MR Spectroscopy

Magnetic resonance (MR) signals arise from the intrinsic magnetic moments of specific atomic nuclei. MR imaging (MRI) and MR spectroscopy detect nuclides with an odd number of protons and neutrons. Protons (1H) are the most commonly utilized nuclide due to their high intrinsic sensitivity and ~100% natural abundance in the human body. Others include 31P phosphorus, 13C carbon, and 19F fluorine, which have been well-established and examined.
The nuclear magnetic moments (spins) align in an MRI scanner, precessing at a particular resonance frequency, called the Larmor frequency (in MHz). This frequency is directly proportional to the strength of the externally applied magnetic field (in Tesla) and a constant gyromagnetic ratio for a specific nucleus. The Larmor frequency varies for every nuclide (e.g., the gyromagnetic ratio of 1H is 42.58 MHz/Tesla, and for 31P is 17.24 MHz/Tesla). The aligned spins produce a net magnetization pointing toward the scanner’s main magnetic field direction, referred to as B0. This equilibrium magnetization can be perturbed by applying a radiofrequency (RF) “excitation pulse” at the Larmor frequency—the nuclei absorb this RF energy, causing the magnetization to tilt away from the B0 (B0 direction is commonly designated along the Z-axis). The magnetic field component of the electromagnetic RF pulse is referred to as B1. Conceptualizing the net magnetization as a rotating vector, and at the equilibrium state, this vector is aligned to B0 (longitudinal magnetization, along Z direction). Applied 90-degree RF pulse tilts the energized vector to the XY plane, producing a component perpendicular to the B0 (transverse magnetization). The “reception pipeline” could be a separate surface coil or integrated with the “transmission pipeline” in a volume coil. The hardware accomplishes the switching between transmission to receiving. Tuning the RF mode from a transmitter to a receiver detects the RF energy by the RF receiver coil elements tuned to the Larmor frequency of the excited nuclei.
Nuclei within a molecule experience slightly different magnetic fields based on molecular environments, leading to chemical shielding and chemical shift alterations for the otherwise identical nuclei in the molecule. Therefore, nuclei within the molecule precess at slightly different frequencies. The resonance offsets can be described on a field-independent dimensionless scale called chemical shift (δ), expressed in dimensionless metric parts per million (ppm)—which is normalized to the main B0 field (see reference [12]). Using ppm scale, the chemical shift of a specific metabolite (molecule) will be expressed at the same position in the MR spectrum regardless of the acquisition with different MR systems and field strength. For example, in a proton spectrum, methyl groups resonate around 1.3 ppm, and water resonates at 4.7 ppm.
Cardiac MRS enables an in vivo detection and quantification of myocardial metabolism, examining healthy and pathological conditions. It is possible to acquire MRS data derived from different endogenous nuclei (Table 1). Phosphorus is the most widely investigated for myocardial bioenergetics studies. Additionally, proton MRS can visualize crucial molecular triglycerides and creatine (Cr). MR spectra can be acquired from single volume elements (single-voxel spectroscopy (SVS)) with localization determined from MR images or from multiple volume elements (multi-voxel), which is referred to as multi-voxel magnetic resonance spectroscopic imaging (MRSI) or chemical shift imaging (CSI) [13,14]. In MRS, individual metabolites are detected based on their resonant frequencies that can be encoded and identified. This technique allows the acquisition of MR spectra simultaneously from a two-dimensional (2D) or three-dimensional (3D) array of voxels. 2D MRSI extends the SVS to a selective slice, in which the in-plane voxels are phase-encoded. 3D MRSI is further extended to a volume to increase the metabolic mapping coverage. Anatomical MR images, usually navigator-gated balanced steady-state free precession cine images, are used as a guide to planning the MRSI grid (voxels) (Figures 3 and 4). This section provides examples from recently published articles and a brief overview of the possible interaction between MR Spectroscopy and clinical practice.

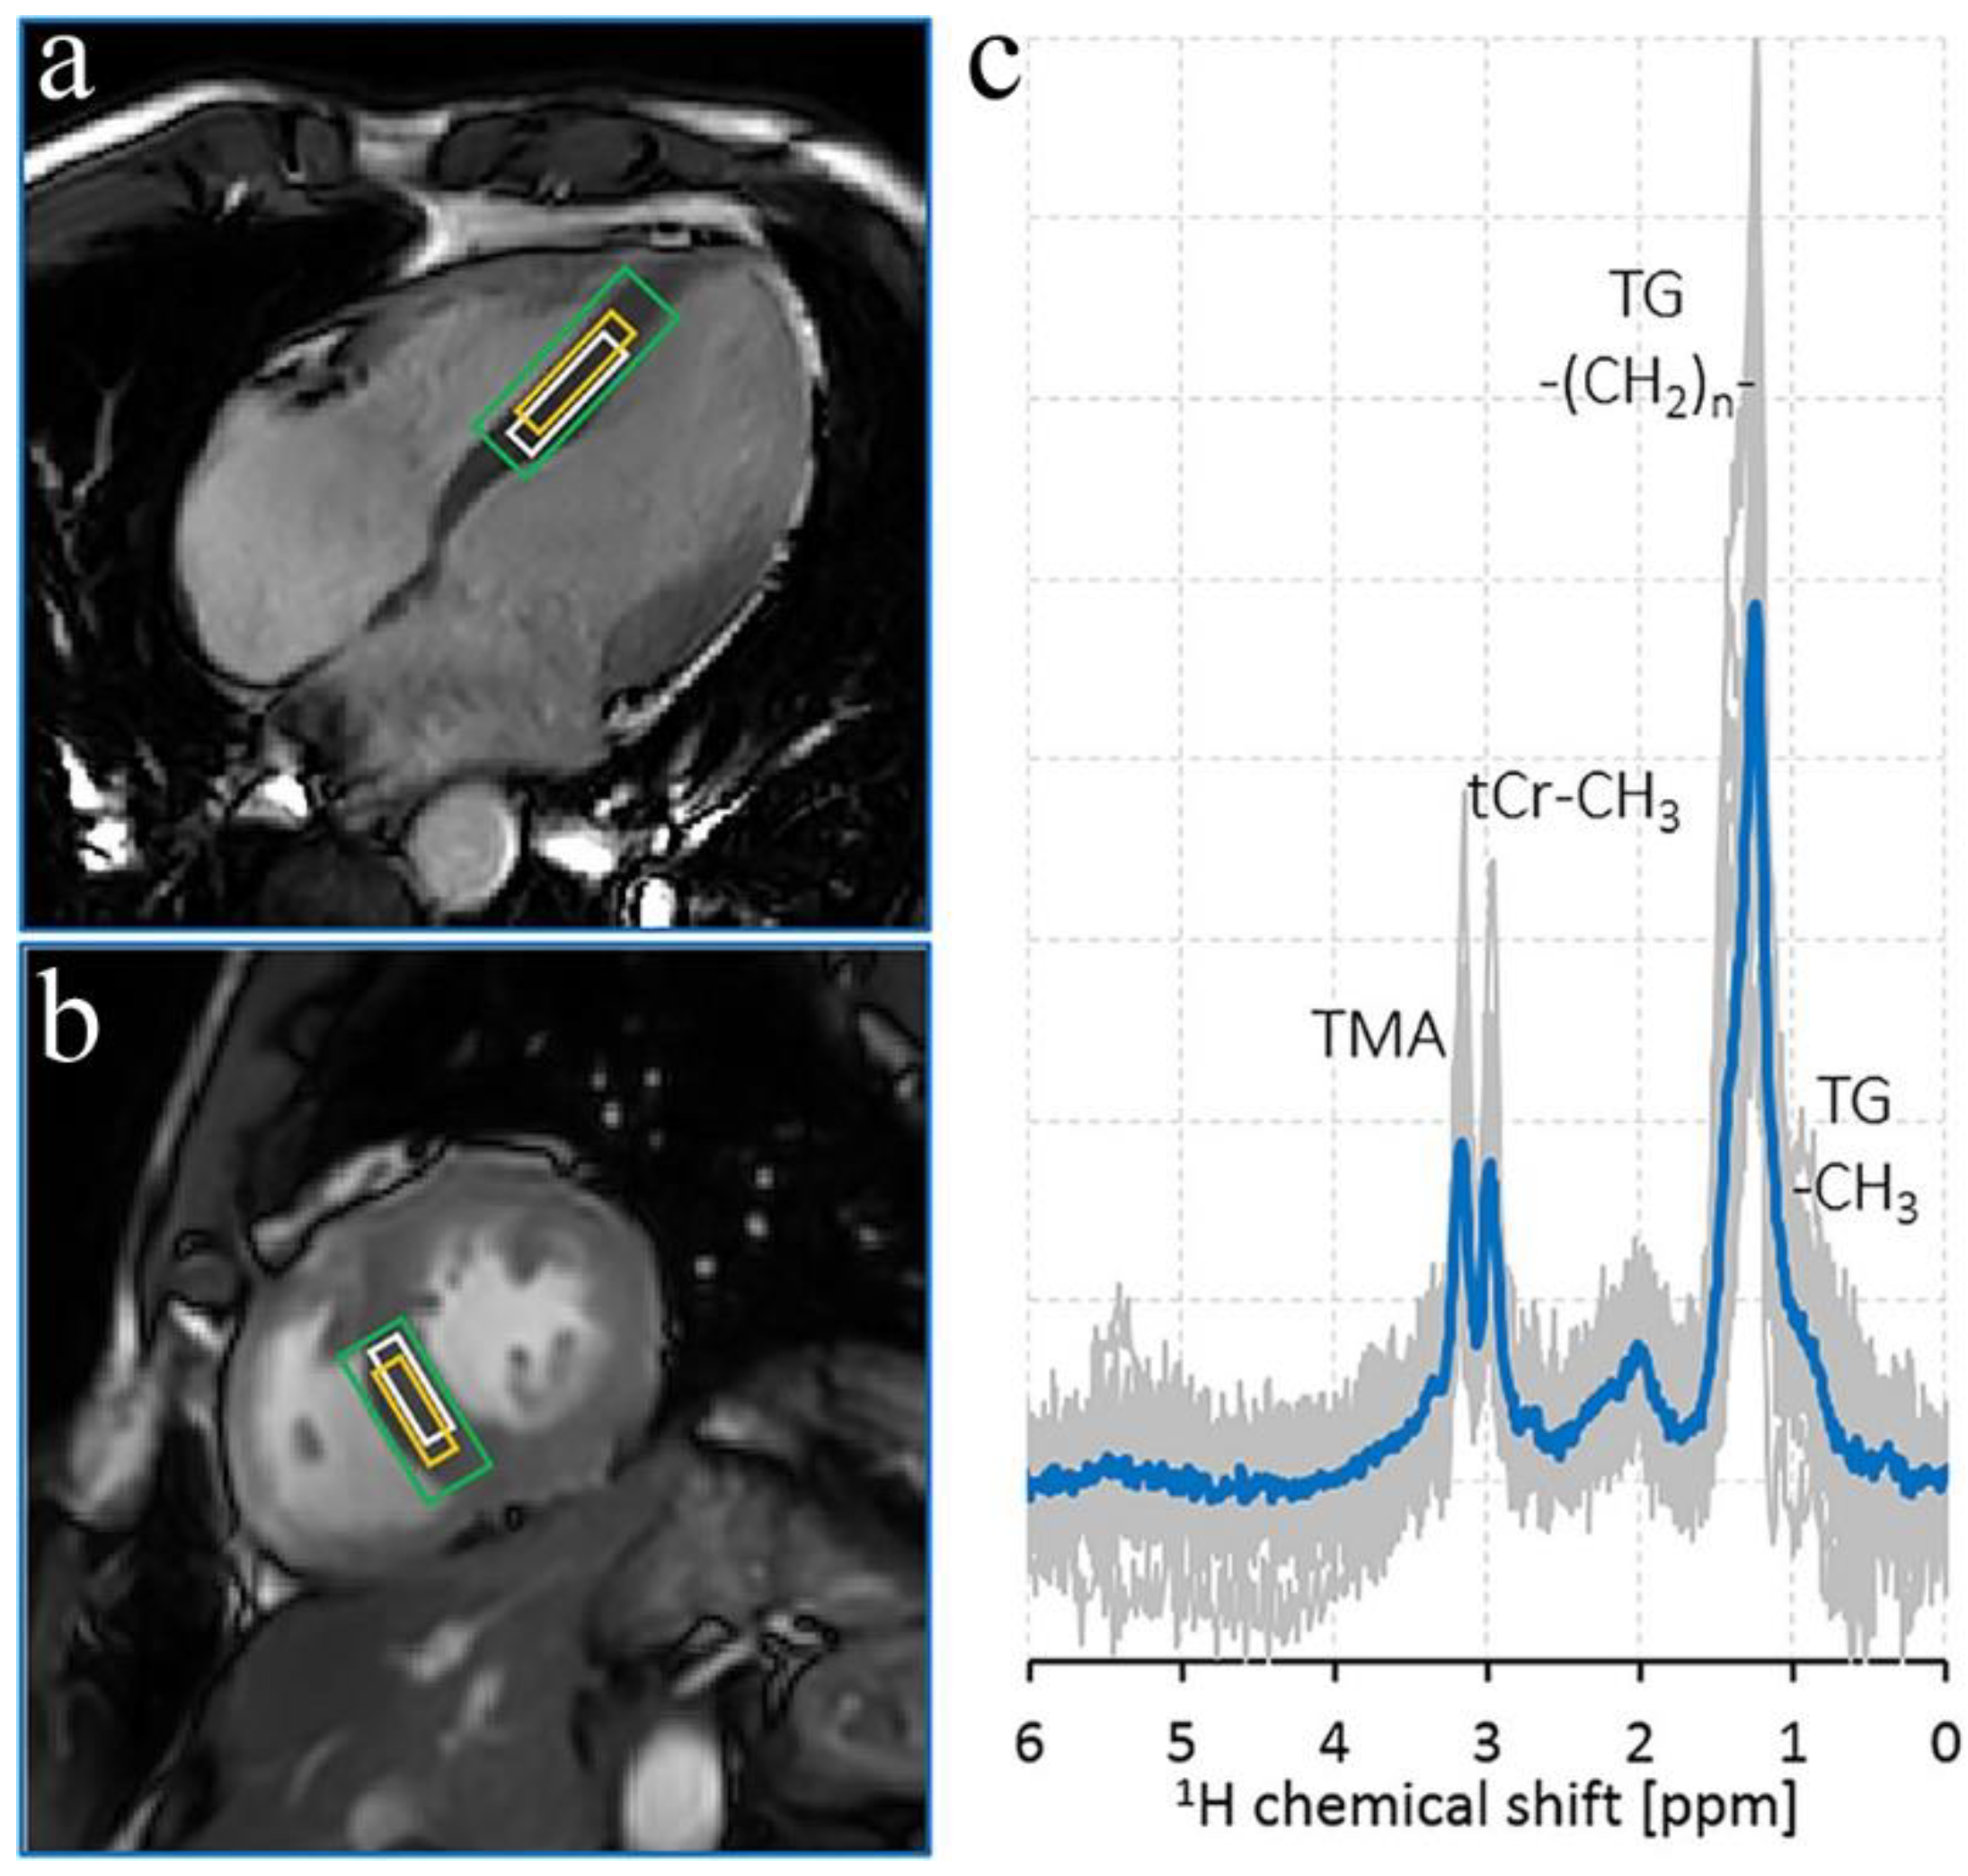
4. Proton Spectroscopy

A dominant peak in 1H MR spectra is total creatine (tCr: creatine + phosphocreatine) resonance at 3.0 ppm (Figure 2) [15]. 1H MRS can detect lipids and macromolecules around 0.9–2.5 ppm (Figure 2). Myocardial triglycerides and trimethylamine-containing compounds (TMA) are also detected by this technique [15,16]. TMA is oxidized by hepatic flavin monooxygenase 3 in the liver and forms TMAO, generally identified as a pathogenic metabolite leading to hypertension [17]. Several studies have investigated the link between increased plasma TMAO and heart failure, revealing that TMAO concentration is associated with advanced left ventricular diastolic dysfunction and poorer clinical outcomes in heart failure patients [17]. The relatively increased concentration of lipids is usually associated with, among several malfunctions, type 2 diabetes mellitus and impaired diastolic function [18]. However, several studies have addressed the complexity of distinct evaluation of intra-myocellular lipids (IMCL) from extramyocellular lipids (EMCL) [16,19]. Precise detection of IMCL and EMCL compartments is essential to investigate lipid metabolism dynamics in pathological development [16].
Several acquisition developments have been introduced to enable cardiac 1H MRS [20,21]. These techniques include rapid single-breath-hold acquisitions, prospective volume-tracking respiratory gating with pressure transducers, navigator techniques, and improved B0 field homogeneity by advanced high-order shimming. Cardiac MR and MRS are usually obtained with routine electrocardiogram (ECG) triggering [22], alternative triggering methods [23], or navigator-free approaches [24]. Post-processing developments have also contributed to the quality of 1H MR spectra, including frequency alignment, phase correction, phase-cancellation derived from cardiac motion, B0 and B1 mappings to compensate for inherent inhomogeneities [25]. In 1H cardiac MRS, the remaining un-suppressed signal from water contributes to frequency alignment and phase correction [19]. Furthermore, the water signal guides the smooth use of ECG navigations and navigator echoes to maintain respiratory gating and reduce respiratory motion artifacts. Unsuppressed or well-suppressed water approaches include a two-shot subtraction technique where the water peak has retained a reference for spectral correction [16].

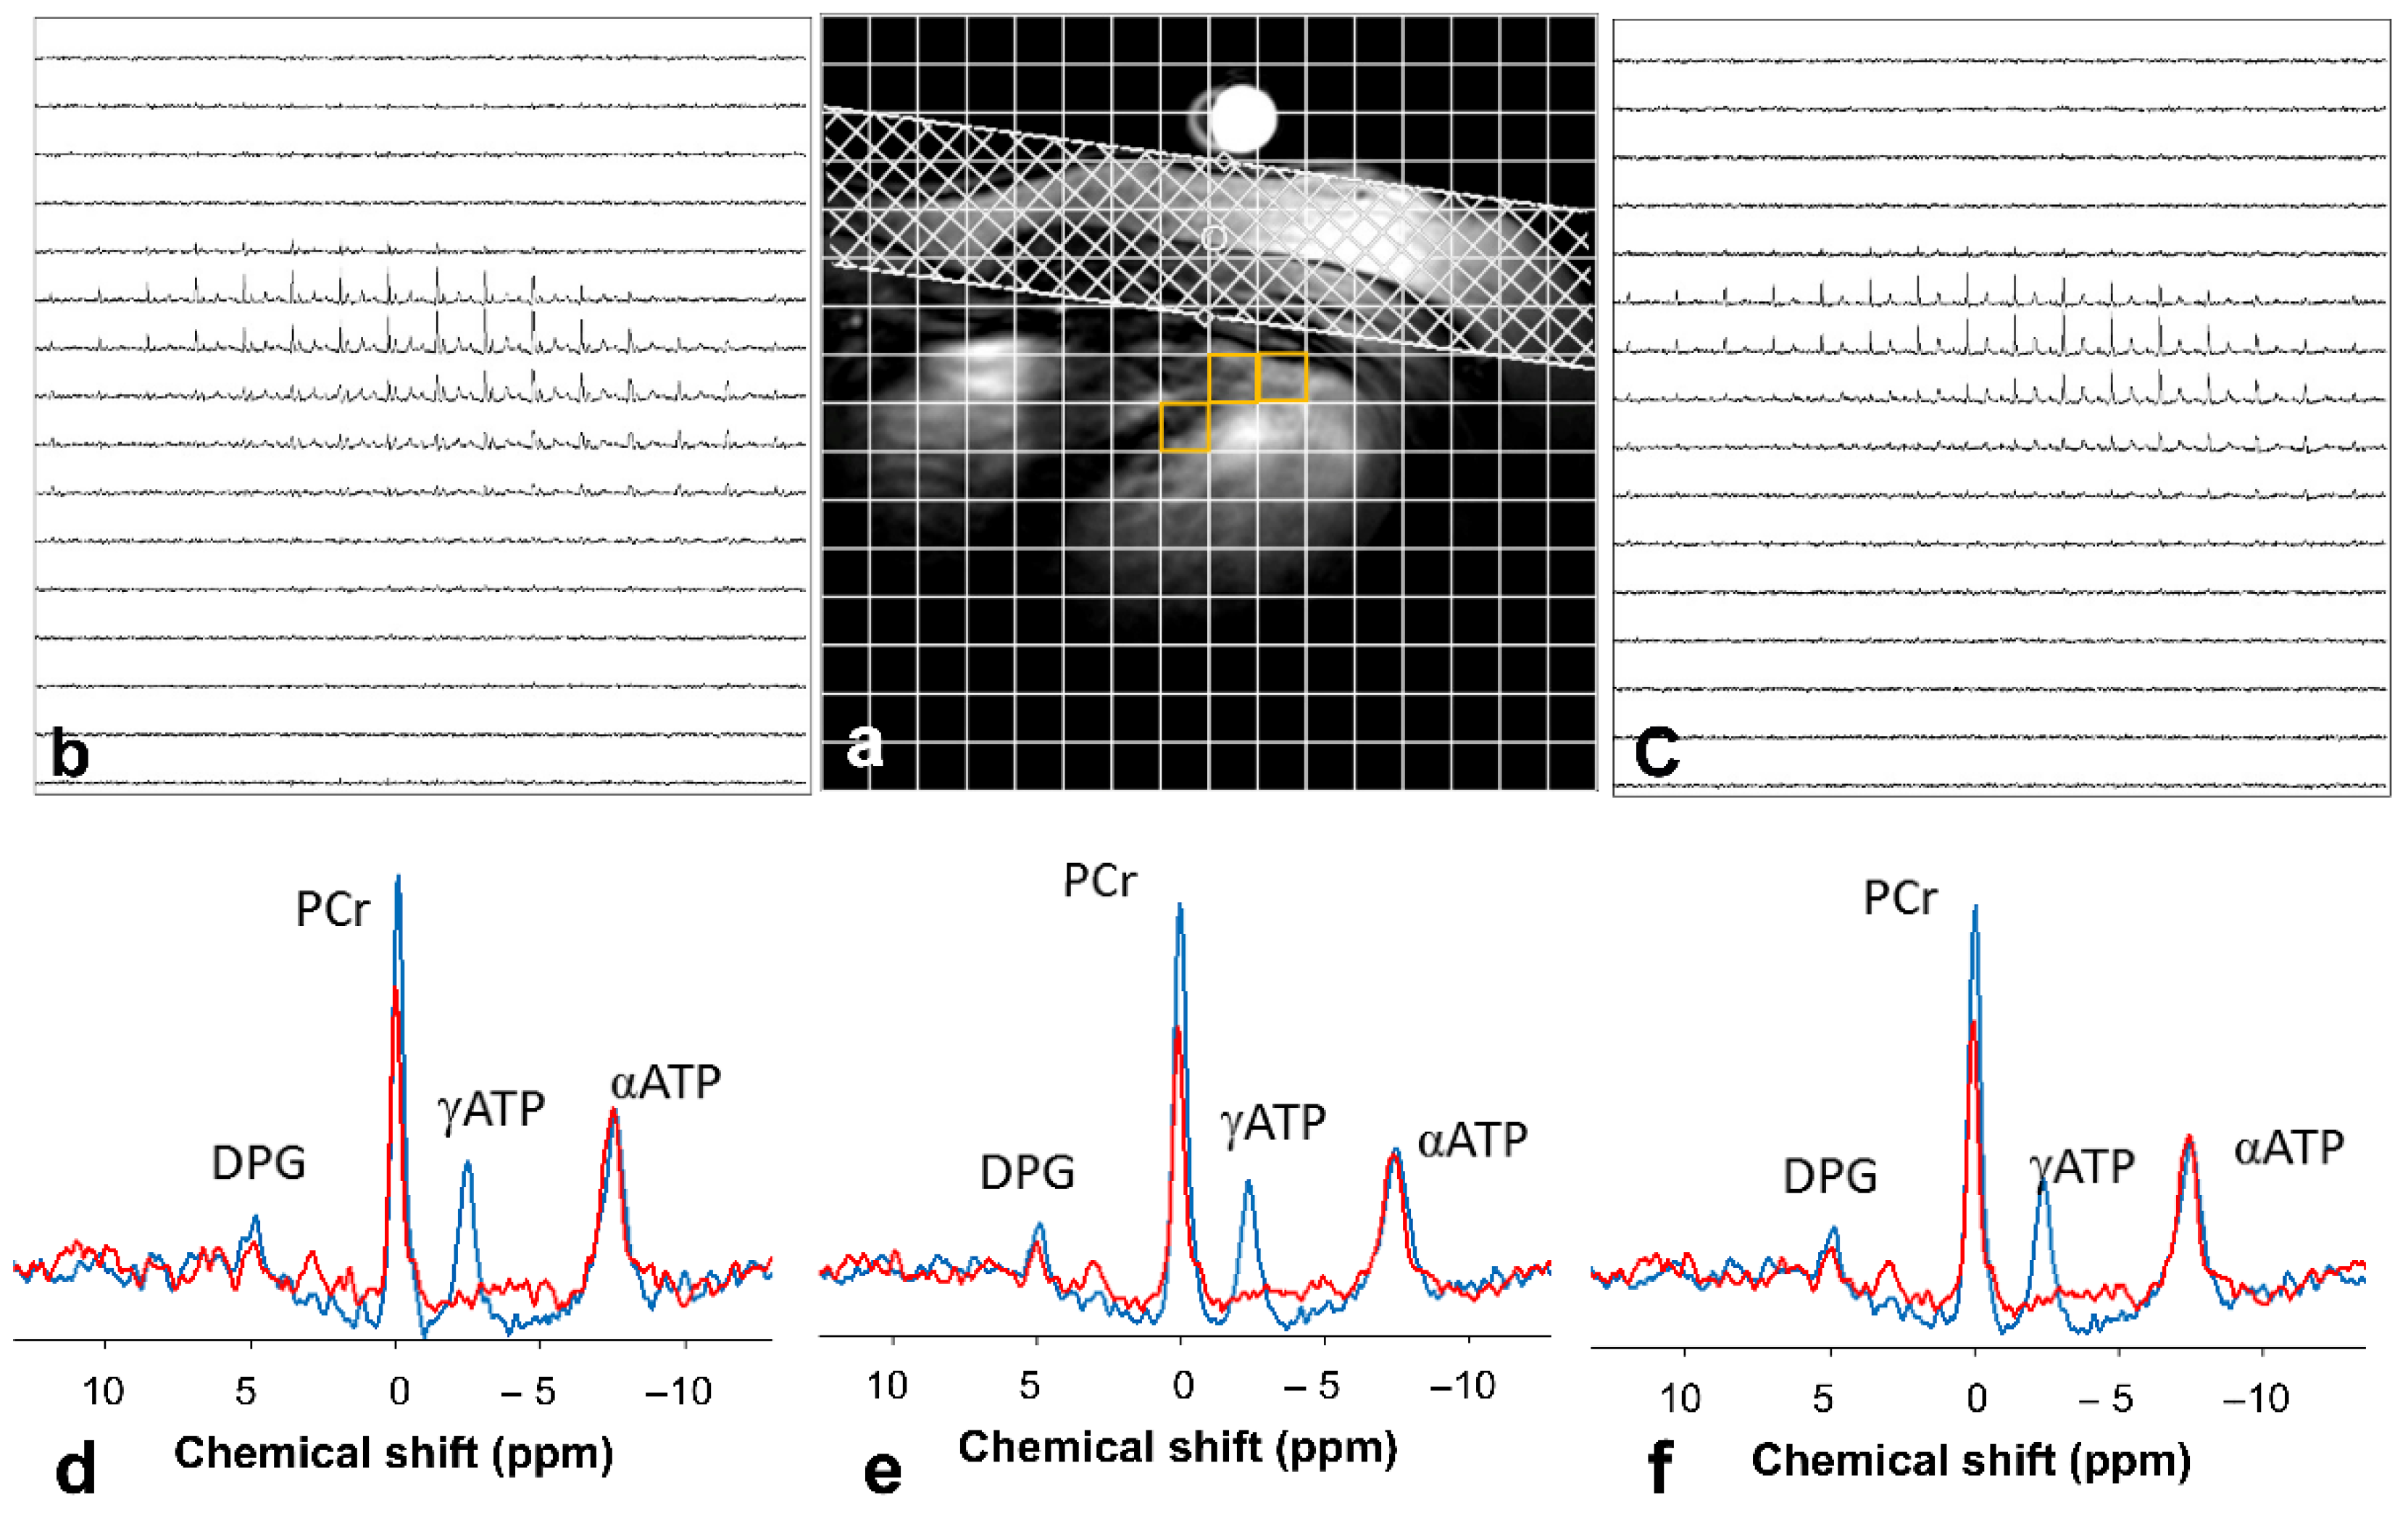
5. Phosphorus Spectroscopy

Despite a ~100% natural abundance in the human body, 31P MRS has a lower intrinsic sensitivity than proton spectroscopy. The gyromagnetic ratio of 31P is 17.24 MHz/Tesla—one/third that of the 1H. However, the number of phosphorus-containing MR detectable metabolites in the body using phosphorus spectroscopy is more than the proton. 31P MRS directly quantifies biochemical of cardiac high-energy phosphate metabolites, such as PCr and ATP, inorganic phosphate (Pi), and other phosphorus-containing metabolites, such as phosphomonoesters (PME) and phosphodiesters (PDE). The PME consists of phosphocholine (PCho) and phosphoethanolamine (Petn). The PDE includes glycerophosphocholine (GPC) and glycerophosphoethanolamine (GPE). The major peaks detected by 31P cardiac MRS are ATP, PCr, Pi, and 2,3-diphosphoglycerate (2,3-DPG) (Figure 3). Furthermore, the technique can non-invasively measure intracellular pH (pHi) [26]. The pHi measurements rely on the chemical shift difference between pH-dependent Pi resonance and pH-independent, in the physiological range, PCr or α resonance of ATP (ATPα) resonances [27].
When ATP demand rises, a healthy body will trigger diversely interrelated and coupled physiological processes to stimulate more ATP productions. However, unhealthy bodies, such as ischemic myocardium, HF, diabetes, and obesity lead to impaired energy production capacity; thus, the PCr level decreases remarkably to maintain ATP levels. The ATP signal only starts to fall by a significantly reduced PCr level [4]. As the ATP concentrations remain steady, the alteration in PCr/ATP ratio may primarily reflect the decline in PCr. This assumption has been demonstrated in several 31P cardiac studies [28,29,30,31], as the PCr/ATP ratio changes may dominantly imply a fall in PCr concentration and an increase in ADP to maintain ATP/ADP and PCr/Cr equilibrium. Some technical solutions, such as using a known concentration of phosphorus metabolite as an external reference, may enable the absolute quantification of PCr and ATP [32,33].
Furthermore, 31P MRS provides critical insight into energy turnover by an indirect unidirectional CK flux and ATP synthesis measure. The conventional 31P saturation transfer techniques [34] allow quantification of CK reaction rate to study ATP transition from mitochondria for cellular consumptions. Using frequency-selective saturation pulses [35,36], saturation transfer methods suppress the ATP’s gamma phosphoryl group (ATPγ), resulting in a decreased signal PCr [35,36] (Figure 4). The method enables an estimate of the kinetic rate for the exchange of ATP to PCr [35,36].
By allowing non-invasive molecular investigations, MR spectroscopy has contributed significantly to understanding cardiac metabolism in HF under physiologic conditions [6,37,38]. The cardiac PCr/ATP ratio level provided a sensitive biomarker in HF patients [6,38]. Some studies have demonstrated a significant correlation between decreased PCr/ATP and systolic HF and dilated cardiomyopathy (DCM) [39,40] and impaired peak systolic circumferential strain [41] at rest. PCr/ATP has been used as a sensitive metric to assess and evaluate exercise training and novel treatment on HF or coronary artery disease patients [41,42]. ATP flux and CK reaction investigations have demonstrated a significant reduction in HF patients and other cardiac diseases, such as non-ischemic DCM and left ventricular hypertrophy [34]. Also, HF diseases induce extensive energetic abnormalities, derangements in high energy phosphate metabolism, reduced CK flux, and lipid accumulation. Cardiac PCr/ATP was shown to correlate with the New York Heart Association functional class of symptom severity in DCM and HF patients [4]. Conventional medical treatments, such as b-blockers—angiotensin-converting enzyme inhibitors—have increased PCr/ATP levels [43,44]. Thus, bioenergetic abnormalities are not specific markers to HF and may indicate other myocardium pathologies and subsequent adverse cardiovascular outcomes.
The most critical elements impeding the clinical application of the 31P MRS technique are low sensitivity and lack of specificity. Additionally, the spatial resolution limits the application of 31P MRS for heterogeneous diseases, such as myocardial infarction. The sensitivity of spectroscopic acquisitions has improved in the past years due to the better performance of modern digital receivers. Cardiac 31P MR spectroscopy may significantly benefit from advanced coil designs, such as the inclusion of phased arrays and dynamic shimming capability [45,46]. Additionally, acquiring at ultra-high-field strength (≥7 Tesla) increases the MRS sensitivity, accelerates data acquisition, and allows higher spatial resolution.
However, overcoming the technical limitations of 31P MRS is not the only driver of clinical usage. 31P MR spectroscopy has not yet provided a practical clinical application to justify multinuclear capability on the clinical systems. Without the necessity to implement such diagnostic imaging examinations, insurance companies will not cover the related expenses. Thus, on the institutional level, the financial investments on multi-nuclei coils and examinations are relatively less prioritized for research if they are purely clinical sites. Consequently, clinical MR vendors have demonstrated a little momentum to develop 31P coils and examinations in general as the market is limited.

6. Carbon Spectroscopy

13C MRS can be used to non-invasively investigate metabolic processes, such as the TCA cycle, glycolysis, gluconeogenesis, ketogenesis, and ethanol metabolism [47]. The application of 13C in the clinical setting has been limited by intrinsically low sensitivity (Magnetically active carbon, 13C, only has a 1.109% natural abundance). Additionally, the 13C gyromagnetic ratio is 10.705 MHz/Tesla, four times lower than the proton. However, development in the use of hyperpolarization using the dynamic nuclear polarization (DNP) technique, which is a process that can enhance >10,000-fold signal increases in MR-active nuclei, has improved the prospects [48]. Hyperpolarized 13C MRS enables a quantitative assessment of the pyruvate dehydrogenase complex flux, which converts pyruvate to acetyl-coenzyme A (acetyl-CoA), one of the vital metabolic processes substrates altered in a failing heart [49,50]. The rapid metabolism and relatively short T1 relaxation times of most biologically relevant hyperpolarized 13C probes are limitations while studying a slower biological process.
It is technically possible to assess the changes in cardiac mitochondrial function, especially a reduction in TCA cycle (Krebs cycle) activity in a post-myocardial infarcted heart using hyperpolarized 13C MRS using labeled pyruvate. The carbon-13 from pyruvate is incorporated into downstream metabolites, which hyperpolarized 13C MRS can detect these metabolites. The changes in signal intensity of pyruvate compared to that of the downstream metabolites in a certain time window can be used to determine kinetic information about the TCA cycle (for a graphical overview, see ref. [51]) [52]. For example, the pyruvate oxidation pathway can be explored by tracing the 13C labeled throughout the involved pathways’ enzymes: lactate dehydrogenase, pyruvate dehydrogenase complex, and alanine aminotransferase. Some studies have proposed kinetic models to quantify the substrate conversion rate constants [53,54]. The model provides the exchange rate between two substrates detectable by 13C MRS; for example, the exchange rate of pyruvate to lactate identifies the kPL constant [53,54]. Other potential valuable molecules are short-chain fatty acids ([1-13C] acetate and [1-13C] butyrate), which can be used to trace the fatty acid metabolism in the heart [55]. Also, hyperpolarized [1-13C]pyruvate has been employed to generate 13CO(2) and H13CO(3)(-) measuring cardiac pHi in vivo [56]. Recent studies have also demonstrated that absolute myocardial blood flow quantification using hyperpolarized [1-13C]pyruvate is feasible in an in vivo setting [57,58].

7. Coil and Dynamic Shimming Approaches

MR imaging and spectroscopy acquisitions will benefit from ultra-high-field examinations [59]. However, the static magnetic field (B0) inhomogeneities almost increase linearly with the field strength, leading to new challenges in cardiac magnetic resonance studies at 7 Tesla [59]. Some intrinsic physiological sources that perturb the B0 field include (i) distinct MR susceptibility properties arising from the myocardium, blood, and surrounding tissues, (ii) geometrical shape of the heart, and (iii) beating heart and circulation-related motions [45,59]. Furthermore, fast data sampling techniques like spiral readout trajectories and echo-planar imaging are adversely affected by field inhomogeneity.
The amount of power deposited by a radiofrequency field in a certain mass of tissue must be limited to minimize patient heating, which puts additional constraints on the imaging sequences. Several recent studies have proposed novel solutions to effectively homogenize the main B0 magnetic field (referred to as shimming) locally in the heart [45,46]. Several methods have also been developed to optimize the B1 field and RF transmission. Some studies have demonstrated the impact of higher-order shimming protocols and parallel transmit and receive RF coils, where instead of a single-coil, separate independently powered and controlled coil elements are used to improve the RF excitation and reception on the human brain at 3 Tesla and 7 Tesla [45,46,59,60,61].
Shim coils integrated inside the MR systems and around the scanner’s bore correct the distribution of the static field. Defining a shim box on a volume of interest can also achieve more refined shim corrections. Clinical MR systems shim coils generate magnetic fields up to what so-called first and second-order shims can be used to improve the B0 field. The acquired B0 field map is used to adjust the shim prior to running the scans. Usually, the 1st–2nd-order shimming is used in correcting B0-field inhomogeneity over the entire region of interest. The higher-order shimming (>2nd order) may significantly benefit the shimming outcomes [62].
MR engineers seek new hardware developments to combine a dynamic shimming system with traditional static shimming [63]. New solutions for more advanced shimming have resulted in engineering dynamic and real-time shimming approaches. These techniques include high-order shimming and multi-shim-coil architecture to leverage spatial field homogeneity. Some experimental studies demonstrated significant B0 field homogeneity improvements in the heart using anatomy-driven shim region of interest and the vendor-supplied higher-order shimming [45,64] (Figure 5). Also, slice-by-slice (slab-selective compared to the volume shim) shimming approaches have greatly improved the utility of parallel transmission with improved homogenous B1 field across the slabs in the heart while decreasing the SAR level [65,66]. These studies aim to eventually include dynamic shim updating on the selected volume in the heart, as has been experimented with within the brain studies at ultra-high-field ≥7 Tesla [67,68]. Overall considerations on the heart shimming include: (i) using slab-selective approaches shimming to minimize the field distribution variations (shimming standard deviation (SD)), (ii) optimizing high-order shims, (iii) temporal B0-field variations with regards to cardiac cycle and respiration-induced, (iv) shimming of oblique orientations, (v) develop dynamic shimming interface by rapid field mapping using slab-specific or cardiac phase-specific mapping sets, and (vi) the emerging use of artificial intelligence in compensating the field variations [45,63,66,69,70,71].

8. Summary

MR spectroscopy is one of the few currently available techniques for in vivo metabolic imaging, enabling in vivo assessments of cardiac energy metabolism and mitochondrial functions. Although MRS has a promising potential for identifying biomarkers for disease and evaluating treatment response, the spectroscopic appearance of many pathologies can overlap. While 31P MRS has been primarily used in measuring cardiac high-energy phosphates and turnover, the emerging use of other MRS techniques provides significant progress. Studies on both HF animal models and clinical examinations have led to several findings in the field. The utility of MRS has been limited to research institutions because of several technological demands and requirements. In particular, 31P and hyperpolarized 13C MRS studies are investigated in very few research centers. To probe and understand the malfunction of cardiac metabolism and metabolic reprogramming towards disease developments, in vivo measures are critical tools. A robust MRS may critically explore the metabolic impairment and bioenergetics instability linked to heart failure developments. Also, an in vivo technique may assist early response to novel therapies. An essential step in translating MRS to clinical use involves further technological improvements, particularly in coil design, improving the signal-to-noise ratios, field homogeneity, optimizing radio-frequency sequences, and kinetic modeling of 13C. Other challenges include artifacts from cardiac movements, blood flow, and the effect of the nearby lung. Another crucial element is the improvement in MR acquisition and reconstruction methods. Much work remains to be carried out for these methods to realize their full potential in elucidating cardiac metabolism.

Author Contributions

Conceptualization, M.E. and R.V.; writing—review and editing, M.E. and R.V.; visualization, M.E.; funding acquisition, M.E. All authors have read and agreed to the published version of the manuscript.

Funding

This research was funded by HELSE SØR-ØST RHF–Southern Eastern Norway Regional Health Authority, grant number 201804.

Acknowledgments

This research was funded by HELSE SØR-ØST RHF–Southern Eastern Norway Regional Health Authority, grant number 201804.

Conflicts of Interest

The authors declare no conflict of interest.

References

  1. Savarese, G.; Lund, L.H. Global Public Health Burden of Heart Failure. Card Fail. Rev. 2017, 3, 7–11. [Google Scholar] [CrossRef]
  2. Cowie, M.R.; Simon, M.; Klein, L.; Thokala, P. The cost-effectiveness of real-time pulmonary artery pressure monitoring in heart failure patients: A European perspective. Eur. J. Heart Fail. 2017, 19, 661–669. [Google Scholar] [CrossRef]
  3. Writing Group, M.; Mozaffarian, D.; Benjamin, E.J.; Go, A.S.; Arnett, D.K.; Blaha, M.J.; Cushman, M.; Das, S.R.; de Ferranti, S.; Despres, J.P.; et al. Executive Summary: Heart Disease and Stroke Statistics—2016 Update: A Report From the American Heart Association. Circulation 2016, 133, 447–454. [Google Scholar] [CrossRef]
  4. Neubauer, S. The failing heart--an engine out of fuel. N. Engl. J. Med. 2007, 356, 1140–1151. [Google Scholar] [CrossRef] [PubMed] [Green Version]
  5. Bertero, E.; Maack, C. Metabolic remodelling in heart failure. Nat. Rev. Cardiol. 2018, 15, 457–470. [Google Scholar] [CrossRef]
  6. Watson, W.D.; Miller, J.J.J.; Lewis, A.; Neubauer, S.; Tyler, D.; Rider, O.J.; Valkovic, L. Use of cardiac magnetic resonance to detect changes in metabolism in heart failure. Cardiovasc. Diagn. Ther. 2020, 10, 583–597. [Google Scholar] [CrossRef] [PubMed]
  7. Brown, D.A.; Perry, J.B.; Allen, M.E.; Sabbah, H.N.; Stauffer, B.L.; Shaikh, S.R.; Cleland, J.G.; Colucci, W.S.; Butler, J.; Voors, A.A.; et al. Expert consensus document: Mitochondrial function as a therapeutic target in heart failure. Nat. Rev. Cardiol. 2017, 14, 238–250. [Google Scholar] [CrossRef] [PubMed]
  8. Ventura-Clapier, R.; Garnier, A.; Veksler, V. Energy metabolism in heart failure. J. Physiol. 2004, 555, 1–13. [Google Scholar] [CrossRef]
  9. Lopaschuk, G.D.; Karwi, Q.G.; Tian, R.; Wende, A.R.; Abel, E.D. Cardiac Energy Metabolism in Heart Failure. Circ. Res. 2021, 128, 1487–1513. [Google Scholar] [CrossRef]
  10. Wende, A.R.; Brahma, M.K.; McGinnis, G.R.; Young, M.E. Metabolic Origins of Heart Failure. JACC Basic Transl. Sci. 2017, 2, 297–310. [Google Scholar] [CrossRef]
  11. Fillmore, N.; Mori, J.; Lopaschuk, G.D. Mitochondrial fatty acid oxidation alterations in heart failure, ischaemic heart disease and diabetic cardiomyopathy. Br. J. Pharm. 2014, 171, 2080–2090. [Google Scholar] [CrossRef] [PubMed] [Green Version]
  12. Kuperman, V. Magnetic Resonance Imaging: Physical Principles and Applications; Academic Press: San Diego, CA, USA; London, UK, 2000; p. xiii. 182p. [Google Scholar]
  13. De Graaf, R.A. In Vivo NMR Spectroscopy—Principles and Techniques, 2nd ed.; John Wiley & Sons, Ltd.: Hoboken, NJ, USA, 2007. [Google Scholar]
  14. Keevil, S.F. Spatial localization in nuclear magnetic resonance spectroscopy. Phys. Med. Biol. 2006, 51, R579–R636. [Google Scholar] [CrossRef] [PubMed]
  15. Bakermans, A.J.; Boekholdt, S.M.; de Vries, D.K.; Reckman, Y.J.; Farag, E.S.; de Heer, P.; Uthman, L.; Denis, S.W.; Zuurbier, C.J.; Houtkooper, R.H.; et al. Quantification of Myocardial Creatine and Triglyceride Content in the Human Heart: Precision and Accuracy of in vivo Proton Magnetic Resonance Spectroscopy. J. Magn. Reson. Imaging 2021, 54, 411–420. [Google Scholar] [CrossRef] [PubMed]
  16. Fillmer, A.; Hock, A.; Cameron, D.; Henning, A. Non-Water-Suppressed 1H MR Spectroscopy with Orientational Prior Knowledge Shows Potential for Separating Intra- and Extramyocellular Lipid Signals in Human Myocardium. Sci. Rep. 2017, 7, 16898. [Google Scholar] [CrossRef] [PubMed] [Green Version]
  17. He, S.; Jiang, H.; Zhuo, C.; Jian, W. Trimethylamine/Trimethylamine-N-Oxide as a Key Between Diet and Cardiovascular Diseases. Cardiovasc. Toxicol. 2021, 21, 593–604. [Google Scholar] [CrossRef] [PubMed]
  18. Khedr, D.; Hafez, M.; Lumpuy-Castillo, J.; Emam, S.; Abdel-Massih, A.; Elmougy, F.; Elkaffas, R.; Mahillo-Fernandez, I.; Lorenzo, O.; Musa, N. Lipid Biomarkers as Predictors of Diastolic Dysfunction in Diabetes with Poor Glycemic Control. Int. J. Mol. Sci. 2020, 21, 5079. [Google Scholar] [CrossRef]
  19. Secchi, F.; Di Leo, G.; Petrini, M.; Spairani, R.; Ali, M.; Guazzi, M.; Sardanelli, F. 1H- and 31P-myocardial magnetic resonance spectroscopy in non-obstructive hypertrophic cardiomyopathy patients and competitive athletes. Radiol. Med. 2017, 122, 265–272. [Google Scholar] [CrossRef]
  20. Sourdon, J.; Roussel, T.; Costes, C.; Viout, P.; Guye, M.; Ranjeva, J.P.; Bernard, M.; Kober, F.; Rapacchi, S. Comparison of single-voxel 1H-cardiovascular magnetic resonance spectroscopy techniques for in vivo measurement of myocardial creatine and triglycerides at 3T. J. Cardiovasc. Magn. Reson. 2021, 23, 53. [Google Scholar] [CrossRef]
  21. Ding, B.; Peterzan, M.; Mozes, F.E.; Rider, O.J.; Valkovic, L.; Rodgers, C.T. Water-suppression cycling 3-T cardiac 1H-MRS detects altered creatine and choline in patients with aortic or mitral stenosis. NMR Biomed. 2021, 34, e4513. [Google Scholar] [CrossRef]
  22. Kramer, C.M.; Barkhausen, J.; Bucciarelli-Ducci, C.; Flamm, S.D.; Kim, R.J.; Nagel, E. Standardized cardiovascular magnetic resonance imaging (CMR) protocols: 2020 update. J. Cardiovasc. Magn. Reson. 2020, 22, 17. [Google Scholar] [CrossRef]
  23. Kording, F.; Yamamura, J.; Lund, G.; Ueberle, F.; Jung, C.; Adam, G.; Schoennagel, B.P. Doppler Ultrasound Triggering for Cardiovascular MRI at 3T in a Healthy Volunteer Study. Magn. Reson. Med. Sci. 2017, 16, 98–108. [Google Scholar] [CrossRef] [Green Version]
  24. Peereboom, S.M.; Gastl, M.; Fuetterer, M.; Kozerke, S. Navigator-free metabolite-cycled proton spectroscopy of the heart. Magn. Reson. Med. 2020, 83, 795–805. [Google Scholar] [CrossRef]
  25. Near, J.; Harris, A.D.; Juchem, C.; Kreis, R.; Marjanska, M.; Oz, G.; Slotboom, J.; Wilson, M.; Gasparovic, C. Preprocessing, analysis and quantification in single-voxel magnetic resonance spectroscopy: Experts’ consensus recommendations. NMR Biomed. 2021, 34, e4257. [Google Scholar] [CrossRef]
  26. Valkovic, L.; Clarke, W.T.; Schmid, A.I.; Raman, B.; Ellis, J.; Watkins, H.; Robson, M.D.; Neubauer, S.; Rodgers, C.T. Measuring inorganic phosphate and intracellular pH in the healthy and hypertrophic cardiomyopathy hearts by in vivo 7T 31P-cardiovascular magnetic resonance spectroscopy. J. Cardiovasc. Magn. Reson. 2019, 21, 19. [Google Scholar] [CrossRef] [Green Version]
  27. Rata, M.; Giles, S.L.; deSouza, N.M.; Leach, M.O.; Payne, G.S. Comparison of three reference methods for the measurement of intracellular pH using 31P MRS in healthy volunteers and patients with lymphoma. NMR Biomed. 2014, 27, 158–162. [Google Scholar] [CrossRef]
  28. Rodgers, C.T.; Clarke, W.T.; Snyder, C.; Vaughan, J.T.; Neubauer, S.; Robson, M.D. Human cardiac 31P magnetic resonance spectroscopy at 7 Tesla. Magn. Reson. Med. 2014, 72, 304–315. [Google Scholar] [CrossRef]
  29. Ellis, J.; Valkovic, L.; Purvis, L.A.B.; Clarke, W.T.; Rodgers, C.T. Reproducibility of human cardiac phosphorus MRS (31P-MRS) at 7 T. NMR Biomed. 2019, 32, e4095. [Google Scholar] [CrossRef] [Green Version]
  30. Shi, M.; Ellingsen, O.; Bathen, T.F.; Hoydal, M.A.; Stolen, T.; Esmaeili, M. The Effect of Exercise Training on Myocardial and Skeletal Muscle Metabolism by MR Spectroscopy in Rats with Heart Failure. Metabolites 2019, 9, 53. [Google Scholar] [CrossRef] [Green Version]
  31. Stolen, T.; Shi, M.; Wohlwend, M.; Hoydal, M.A.; Bathen, T.F.; Ellingsen, O.; Esmaeili, M. Effect of exercise training on cardiac metabolism in rats with heart failure. Scand. Cardiovasc. J. 2020, 54, 84–91. [Google Scholar] [CrossRef]
  32. Valkovic, L.; Chmelik, M.; Krssak, M. In-vivo 31P-MRS of skeletal muscle and liver: A way for non-invasive assessment of their metabolism. Anal. Biochem. 2017, 529, 193–215. [Google Scholar] [CrossRef]
  33. Kemp, G.J.; Ahmad, R.E.; Nicolay, K.; Prompers, J.J. Quantification of skeletal muscle mitochondrial function by 31P magnetic resonance spectroscopy techniques: A quantitative review. Acta Physiol. 2015, 213, 107–144. [Google Scholar] [CrossRef]
  34. Gabr, R.E.; El-Sharkawy, A.M.; Schar, M.; Panjrath, G.S.; Gerstenblith, G.; Weiss, R.G.; Bottomley, P.A. Cardiac work is related to creatine kinase energy supply in human heart failure: A cardiovascular magnetic resonance spectroscopy study. J. Cardiovasc. Magn. Reson. 2018, 20, 81. [Google Scholar] [CrossRef] [Green Version]
  35. Bashir, A.; Zhang, J.; Denney, T.S. Creatine kinase rate constant in the human heart at 7T with 1D-ISIS/2D CSI localization. PLoS ONE 2020, 15, e0229933. [Google Scholar] [CrossRef] [Green Version]
  36. Clarke, W.T.; Robson, M.D.; Neubauer, S.; Rodgers, C.T. Creatine kinase rate constant in the human heart measured with 3D-localization at 7 tesla. Magn. Reson. Med. 2017, 78, 20–32. [Google Scholar] [CrossRef]
  37. van Ewijk, P.A.; Schrauwen-Hinderling, V.B.; Bekkers, S.C.; Glatz, J.F.; Wildberger, J.E.; Kooi, M.E. MRS: A noninvasive window into cardiac metabolism. NMR Biomed. 2015, 28, 747–766. [Google Scholar] [CrossRef]
  38. Sourdon, J.; Lewsey, S.C.; Schar, M.; Weiss, R.G. Measuring Myocardial Energetics with Cardiovascular Magnetic Resonance Spectroscopy. Heart Fail. Clin. 2021, 17, 149–156. [Google Scholar] [CrossRef]
  39. Dass, S.; Holloway, C.J.; Cochlin, L.E.; Rider, O.J.; Mahmod, M.; Robson, M.; Sever, E.; Clarke, K.; Watkins, H.; Ashrafian, H.; et al. No Evidence of Myocardial Oxygen Deprivation in Nonischemic Heart Failure. Circ. Heart Fail. 2015, 8, 1088–1093. [Google Scholar] [CrossRef]
  40. Bayeva, M.; Gheorghiade, M.; Ardehali, H. Mitochondria as a therapeutic target in heart failure. J. Am. Coll. Cardiol. 2013, 61, 599–610. [Google Scholar] [CrossRef] [Green Version]
  41. Mahmod, M.; Pal, N.; Rayner, J.; Holloway, C.; Raman, B.; Dass, S.; Levelt, E.; Ariga, R.; Ferreira, V.; Banerjee, R.; et al. The interplay between metabolic alterations, diastolic strain rate and exercise capacity in mild heart failure with preserved ejection fraction: A cardiovascular magnetic resonance study. J. Cardiovasc. Magn. Reson. 2018, 20, 88. [Google Scholar] [CrossRef]
  42. Qureshi, W.T.; Nasir, U.B. Principals and clinical applications of magnetic resonance cardiac spectroscopy in heart failure. Heart Fail. Rev. 2017, 22, 491–499. [Google Scholar] [CrossRef]
  43. Del Franco, A.; Ambrosio, G.; Baroncelli, L.; Pizzorusso, T.; Barison, A.; Olivotto, I.; Recchia, F.A.; Lombardi, C.M.; Metra, M.; Ferrari Chen, Y.F.; et al. Creatine deficiency and heart failure. Heart Fail. Rev. 2021. [Google Scholar] [CrossRef]
  44. Meyers, T.A.; Townsend, D. Cardiac Pathophysiology and the Future of Cardiac Therapies in Duchenne Muscular Dystrophy. Int. J. Mol. Sci. 2019, 20, 4098. [Google Scholar] [CrossRef] [Green Version]
  45. Hock, M.; Terekhov, M.; Stefanescu, M.R.; Lohr, D.; Herz, S.; Reiter, T.; Ankenbrand, M.; Kosmala, A.; Gassenmaier, T.; Juchem, C.; et al. B0 shimming of the human heart at 7T. Magn. Reson. Med. 2021, 85, 182–196. [Google Scholar] [CrossRef]
  46. Darnell, D.; Truong, T.K.; Song, A.W. Recent Advances in Radio-Frequency Coil Technologies: Flexible, Wireless, and Integrated Coil Arrays. J. Magn. Reson. Imaging 2021. [Google Scholar] [CrossRef]
  47. Josan, S.; Park, J.M.; Hurd, R.; Yen, Y.F.; Pfefferbaum, A.; Spielman, D.; Mayer, D. In vivo investigation of cardiac metabolism in the rat using MRS of hyperpolarized [1-13C] and [2-13C]pyruvate. NMR Biomed. 2013, 26, 1680–1687. [Google Scholar] [CrossRef] [Green Version]
  48. Ardenkjaer-Larsen, J.H.; Fridlund, B.; Gram, A.; Hansson, G.; Hansson, L.; Lerche, M.H.; Servin, R.; Thaning, M.; Golman, K. Increase in signal-to-noise ratio of >10,000 times in liquid-state NMR. Proc. Natl. Acad. Sci. USA 2003, 100, 10158–10163. [Google Scholar] [CrossRef] [Green Version]
  49. Stanley, W.C.; Recchia, F.A.; Lopaschuk, G.D. Myocardial substrate metabolism in the normal and failing heart. Physiol. Rev. 2005, 85, 1093–1129. [Google Scholar] [CrossRef]
  50. Schroeder, M.A.; Lau, A.Z.; Chen, A.P.; Gu, Y.; Nagendran, J.; Barry, J.; Hu, X.; Dyck, J.R.; Tyler, D.J.; Clarke, K.; et al. Hyperpolarized 13C magnetic resonance reveals early- and late-onset changes to in vivo pyruvate metabolism in the failing heart. Eur. J. Heart Fail. 2013, 15, 130–140. [Google Scholar] [CrossRef] [Green Version]
  51. Sharma, G.; Wu, C.Y.; Wynn, R.M.; Gui, W.; Malloy, C.R.; Sherry, A.D.; Chuang, D.T.; Khemtong, C. Real-time hyperpolarized 13C magnetic resonance detects increased pyruvate oxidation in pyruvate dehydrogenase kinase 2/4-double knockout mouse livers. Sci. Rep. 2019, 9, 16480. [Google Scholar] [CrossRef]
  52. Befroy, D.E.; Falk Petersen, K.; Rothman, D.L.; Shulman, G.I. Assessment of in vivo mitochondrial metabolism by magnetic resonance spectroscopy. Methods Enzym. 2009, 457, 373–393. [Google Scholar] [CrossRef] [Green Version]
  53. Bankson, J.A.; Walker, C.M.; Ramirez, M.S.; Stefan, W.; Fuentes, D.; Merritt, M.E.; Lee, J.; Sandulache, V.C.; Chen, Y.; Phan, L.; et al. Kinetic Modeling and Constrained Reconstruction of Hyperpolarized [1-13C]-Pyruvate Offers Improved Metabolic Imaging of Tumors. Cancer Res. 2015, 75, 4708–4717. [Google Scholar] [CrossRef] [Green Version]
  54. Witney, T.H.; Kettunen, M.I.; Brindle, K.M. Kinetic modeling of hyperpolarized 13C label exchange between pyruvate and lactate in tumor cells. J. Biol. Chem. 2011, 286, 24572–24580. [Google Scholar] [CrossRef] [Green Version]
  55. Schroeder, M.A.; Atherton, H.J.; Ball, D.R.; Cole, M.A.; Heather, L.C.; Griffin, J.L.; Clarke, K.; Radda, G.K.; Tyler, D.J. Real-time assessment of Krebs cycle metabolism using hyperpolarized 13C magnetic resonance spectroscopy. FASEB J. 2009, 23, 2529–2538. [Google Scholar] [CrossRef] [Green Version]
  56. Schroeder, M.A.; Swietach, P.; Atherton, H.J.; Gallagher, F.A.; Lee, P.; Radda, G.K.; Clarke, K.; Tyler, D.J. Measuring intracellular pH in the heart using hyperpolarized carbon dioxide and bicarbonate: A 13C and 31P magnetic resonance spectroscopy study. Cardiovasc. Res. 2010, 86, 82–91. [Google Scholar] [CrossRef] [Green Version]
  57. Fuetterer, M.; Busch, J.; Traechtler, J.; Wespi, P.; Peereboom, S.M.; Sauer, M.; Lipiski, M.; Fleischmann, T.; Cesarovic, N.; Stoeck, C.T.; et al. Quantitative myocardial first-pass cardiovascular magnetic resonance perfusion imaging using hyperpolarized [1-13C] pyruvate. J. Cardiovasc. Magn. Reson. 2018, 20, 73. [Google Scholar] [CrossRef]
  58. Fuetterer, M.; Busch, J.; Peereboom, S.M.; von Deuster, C.; Wissmann, L.; Lipiski, M.; Fleischmann, T.; Cesarovic, N.; Stoeck, C.T.; Kozerke, S. Hyperpolarized 13C urea myocardial first-pass perfusion imaging using velocity-selective excitation. J. Cardiovasc. Magn. Reson. 2017, 19, 46. [Google Scholar] [CrossRef] [Green Version]
  59. Niendorf, T.; Schulz-Menger, J.; Paul, K.; Huelnhagen, T.; Ferrari, V.A.; Hodge, R. High Field Cardiac Magnetic Resonance Imaging: A Case for Ultrahigh Field Cardiac Magnetic Resonance. Circ. Cardiovasc. Imaging 2017, 10, e005460. [Google Scholar] [CrossRef] [Green Version]
  60. Elabyad, I.A.; Terekhov, M.; Stefanescu, M.R.; Lohr, D.; Fischer, M.; Schreiber, L.M. Design of a novel antisymmetric coil array for parallel transmit cardiac MRI in pigs at 7T. J. Magn. Reson. 2019, 305, 195–208. [Google Scholar] [CrossRef]
  61. Steensma, B.R.; Voogt, I.J.; Leiner, T.; Luijten, P.R.; Habets, J.; Klomp, D.W.J.; van den Berg, C.A.T.; Raaijmakers, A.J.E. An 8-channel Tx/Rx dipole array combined with 16 Rx loops for high-resolution functional cardiac imaging at 7 T. MAGMA 2018, 31, 7–18. [Google Scholar] [CrossRef] [Green Version]
  62. Stockmann, J.P.; Wald, L.L. In vivo B0 field shimming methods for MRI at 7T. Neuroimage 2018, 168, 71–87. [Google Scholar] [CrossRef] [Green Version]
  63. Edalati, M.; Zheng, Y.; Watkins, M.P.; Chen, J.; Liu, L.; Zhang, S.; Song, Y.; Soleymani, S.; Lenihan, D.J.; Lanza, G.M. Implementation and prospective clinical validation of AI-based planning and shimming techniques in cardiac MRI. Med. Phys. 2021, 49, 129–143. [Google Scholar] [CrossRef] [PubMed]
  64. Schar, M.; Vonken, E.J.; Stuber, M. Simultaneous B0- and B1+-map acquisition for fast localized shim, frequency, and RF power determination in the heart at 3 T. Magn. Reson. Med. 2010, 63, 419–426. [Google Scholar] [CrossRef] [Green Version]
  65. Curtis, A.T.; Gilbert, K.M.; Klassen, L.M.; Gati, J.S.; Menon, R.S. Slice-by-slice B1+ shimming at 7 T. Magn. Reson. Med. 2012, 68, 1109–1116. [Google Scholar] [CrossRef] [PubMed]
  66. Elabyad, I.A.; Terekhov, M.; Lohr, D.; Stefanescu, M.R.; Baltes, S.; Schreiber, L.M. A Novel Mono-surface Antisymmetric 8Tx/16Rx Coil Array for Parallel Transmit Cardiac MRI in Pigs at 7T. Sci. Rep. 2020, 10, 3117. [Google Scholar] [CrossRef] [Green Version]
  67. Stockmann, J.P.; Arango, N.S.; Witzel, T.; Mareyam, A.; Sappo, C.; Zhou, J.; Jenkins, L.; Craven-Brightman, L.; Milshteyn, E.; Davids, M.; et al. A 31-channel integrated “AC/DC” B0 shim and radiofrequency receive array coil for improved 7T MRI. Magn. Reson. Med. 2022, 87, 1074–1092. [Google Scholar] [CrossRef]
  68. Esmaeili, M.; Stockmann, J.; Strasser, B.; Arango, N.; Thapa, B.; Wang, Z.; van der Kouwe, A.; Dietrich, J.; Cahill, D.P.; Batchelor, T.T.; et al. An integrated RF-receive/B0-shim array coil boosts performance of whole-brain MR spectroscopic imaging at 7 T. Sci. Rep. 2020, 10, 15029. [Google Scholar] [CrossRef]
  69. Eigentler, T.W.; Kuehne, A.; Boehmert, L.; Dietrich, S.; Els, A.; Waiczies, H.; Niendorf, T. 32-Channel self-grounded bow-tie transceiver array for cardiac MR at 7.0T. Magn. Reson. Med. 2021, 86, 2862–2879. [Google Scholar] [CrossRef]
  70. Xiang, S.F.; Zhang, X.Q.; Yang, S.J.; Gao, Y.Y.; Gao, B.L.; Shi, Q.L.; Li, S. Intravoxel Incoherent Motion Magnetic Resonance Imaging with Integrated Slice-specific Shimming for old myocardial infarction: A Pilot Study. Sci. Rep. 2019, 9, 19766. [Google Scholar] [CrossRef]
  71. Roat, S.; Vít, M.; Wampl, S.; Schmid, A.I.; Laistler, E. A Flexible Array for Cardiac 31P MR Spectroscopy at 7 T. Front. Phys. 2020, 8, 92. [Google Scholar] [CrossRef]
Figure 1. Creatine kinase (CK) energy shuttle. ADP—Adenosine diphosphate; ATP—adenosine triphosphate.
Metabolites 12 00189 g001
Figure 2. 1H MR spectrum from the myocardium of a volunteer. The left panel displays the voxel positioning. (a) A quasi-4-chamber view (b) and an end-systolic short-axis view. (c) The right panel depicts the MR spectra (mean spectrum in blue). TMA, trimethylamine-containing compounds; tCr-CH3: total creatine-methyl; TG–CH2–)n triglyceride-methylene. Adapted from ref. [15] an open-access article under the terms of the Creative Commons CC BY license.
Metabolites 12 00189 g002
Figure 3. Cardiac 31P MRSI at 7 Tesla. (a) Localizer images: positions of the MRSI grid on the short-axis view of the heart. (b) MR spectra from the corresponding colored voxels marked on the localizer images. The spectra were acquired in a healthy subject using a 3-dimensional ultra-short-echo CSI sequence, matrix size of 8 × 16 × 8, nominal voxel size of 30 × 15 × 25 mm3, and five averages (for more details on the CSI protocol, see [26]). The illustration is adapted from [26], an open-access article under the terms of the Creative Commons CC BY license.
Metabolites 12 00189 g003
Figure 4. Saturation transfer techniques allow CK examinations in vivo. (a) An anatomical image highlights the typical voxel (orange) location chosen for analysis. 31P CSI from the slice (b) control and (c) saturation conditions. (df) Typical 31P magnetization transfer spectra from selected voxels. Control spectra are shown in blue and saturated spectra (γATP saturation) are in red. The PCr signal is reduced when γATP is saturated. Illustration from [35] an open-access article under the terms of the Creative Commons CC BY license.
Metabolites 12 00189 g004
Figure 5. In vivo B0 shimming of the heart using 3rd-order sets at 7 Tesla. (a) Region of interest on the magnitude images, (b) Initial measured B0-field distribution (SD, standard deviation, across the sliced region of the heart); (c) Computed magnetic shim field; (d) Expected B0-field distribution after the simulated shim; (e) B0-field distribution measured after the experimental shim. Illustration is from ref. [45] an open-access article under the terms of the Creative Commons CC BY license.
Metabolites 12 00189 g005
Table 1. Detectable nuclei with magnetic resonance spectroscopy techniques and their use in cardiac MR spectroscopy.
NucleiMetabolitesSignificance
Proton (1H)Creatine, triglyceride, lipidLipid and creatine pools within the myocytes
Phosphorus (31P)Adenosine tri phosphate (ATP); phosphocreatine (PCr); PCr/ATP ratio, pHiBioenergetics metabolites, intracellular pH measurements
Carbon (13C)Glucose, lactate, pyruvate, fatty acids, lipidProbe TCA cycle metabolism, pyruvate dehydrogenase, glycolysis, fatty acid metabolism
Publisher’s Note: MDPI stays neutral with regard to jurisdictional claims in published maps and institutional affiliations.

