
Alterations of the Intestinal Permeability are Reflected by Changes in the Urine Metabolome of Young Autistic Children: Preliminary Results

 , , , ,
  and
and
Abstract
:
1. Introduction
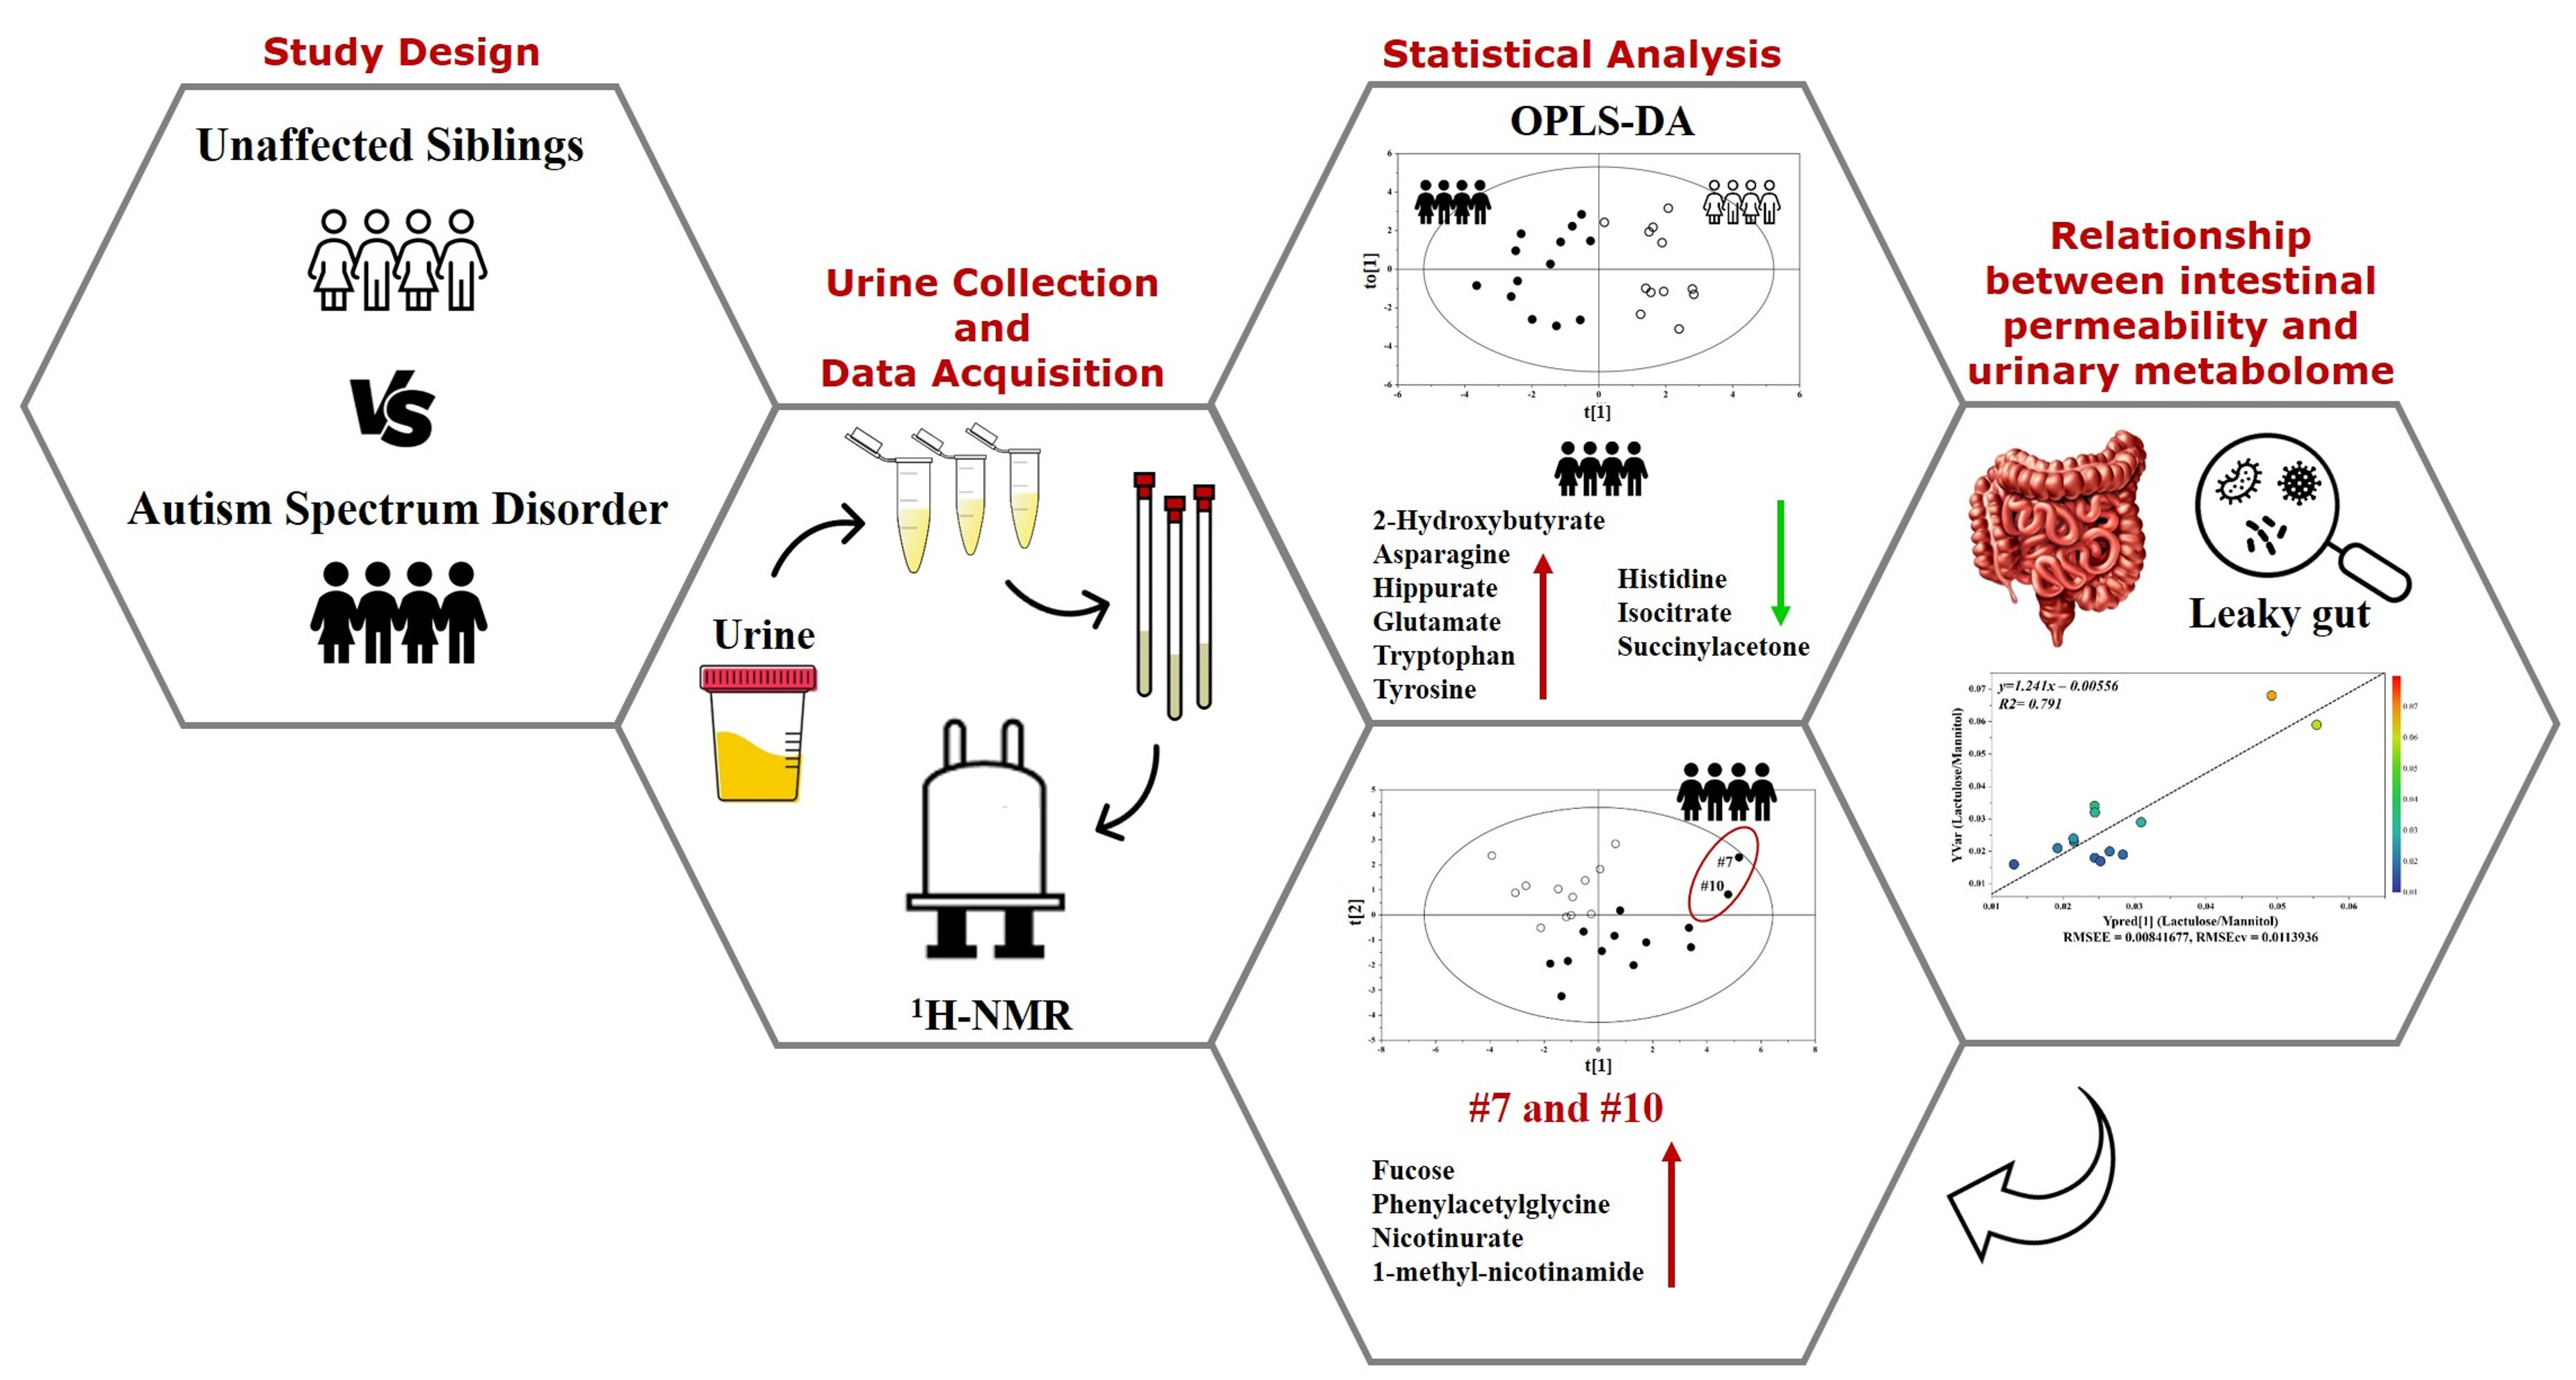
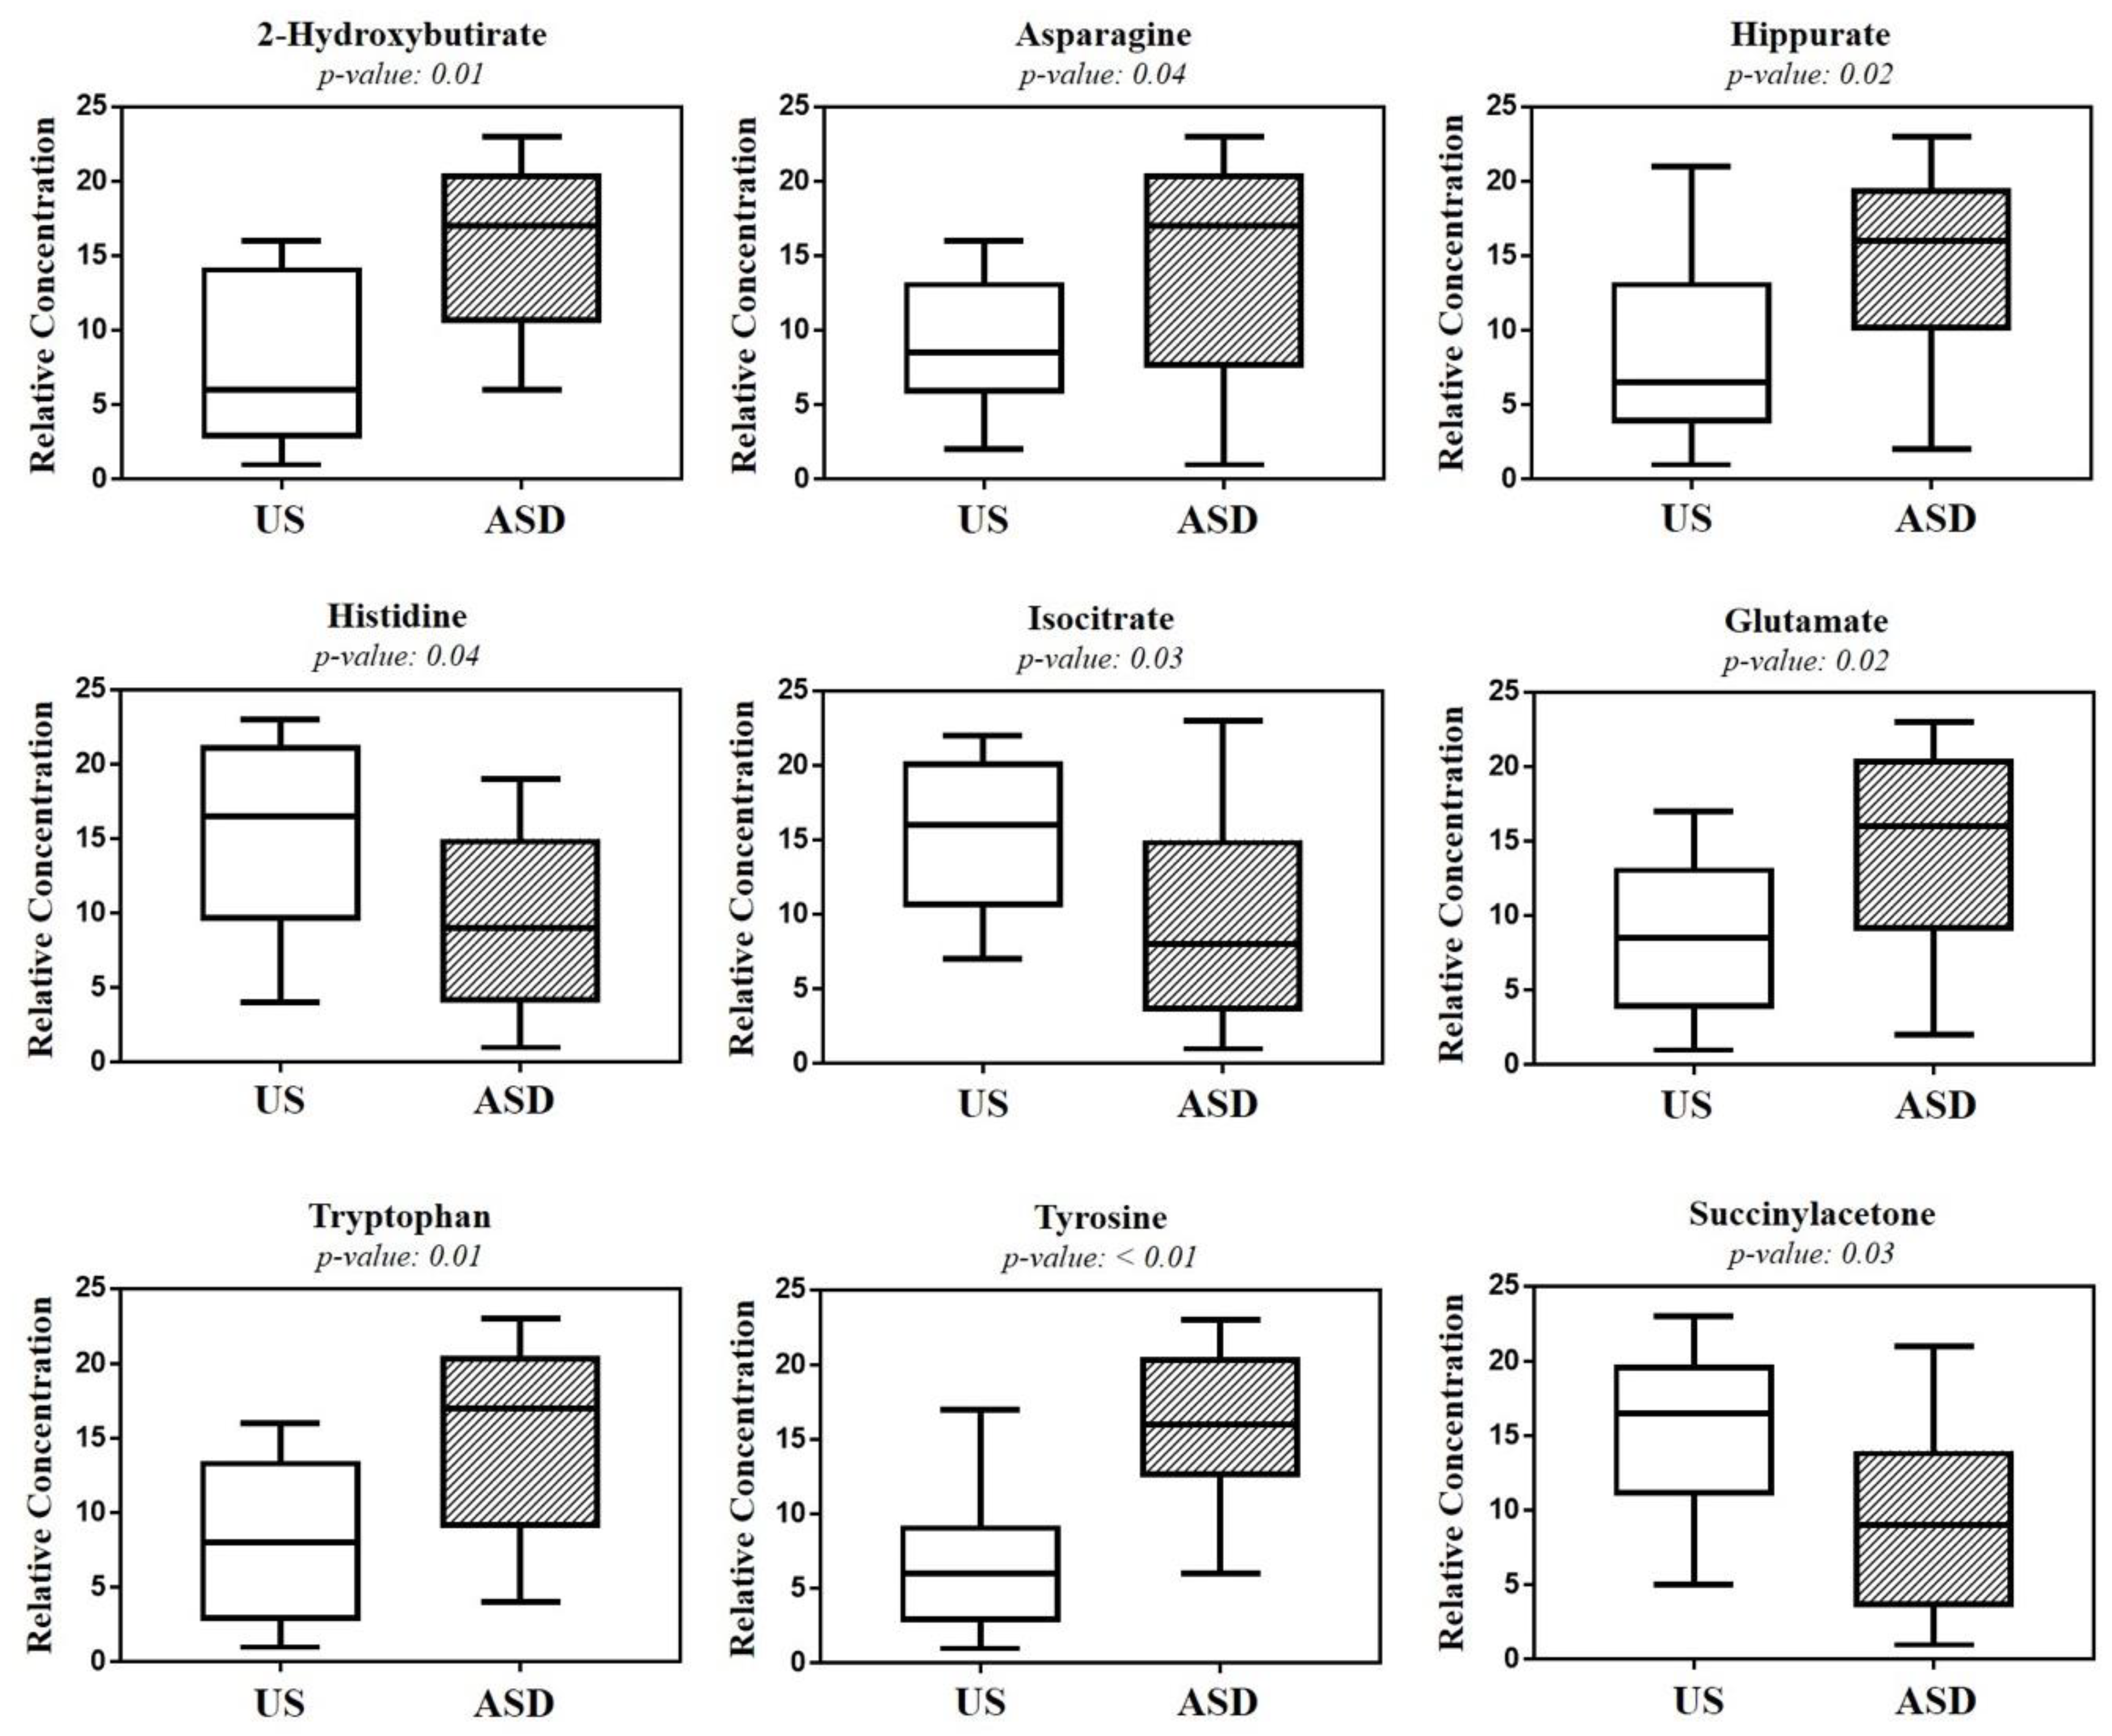
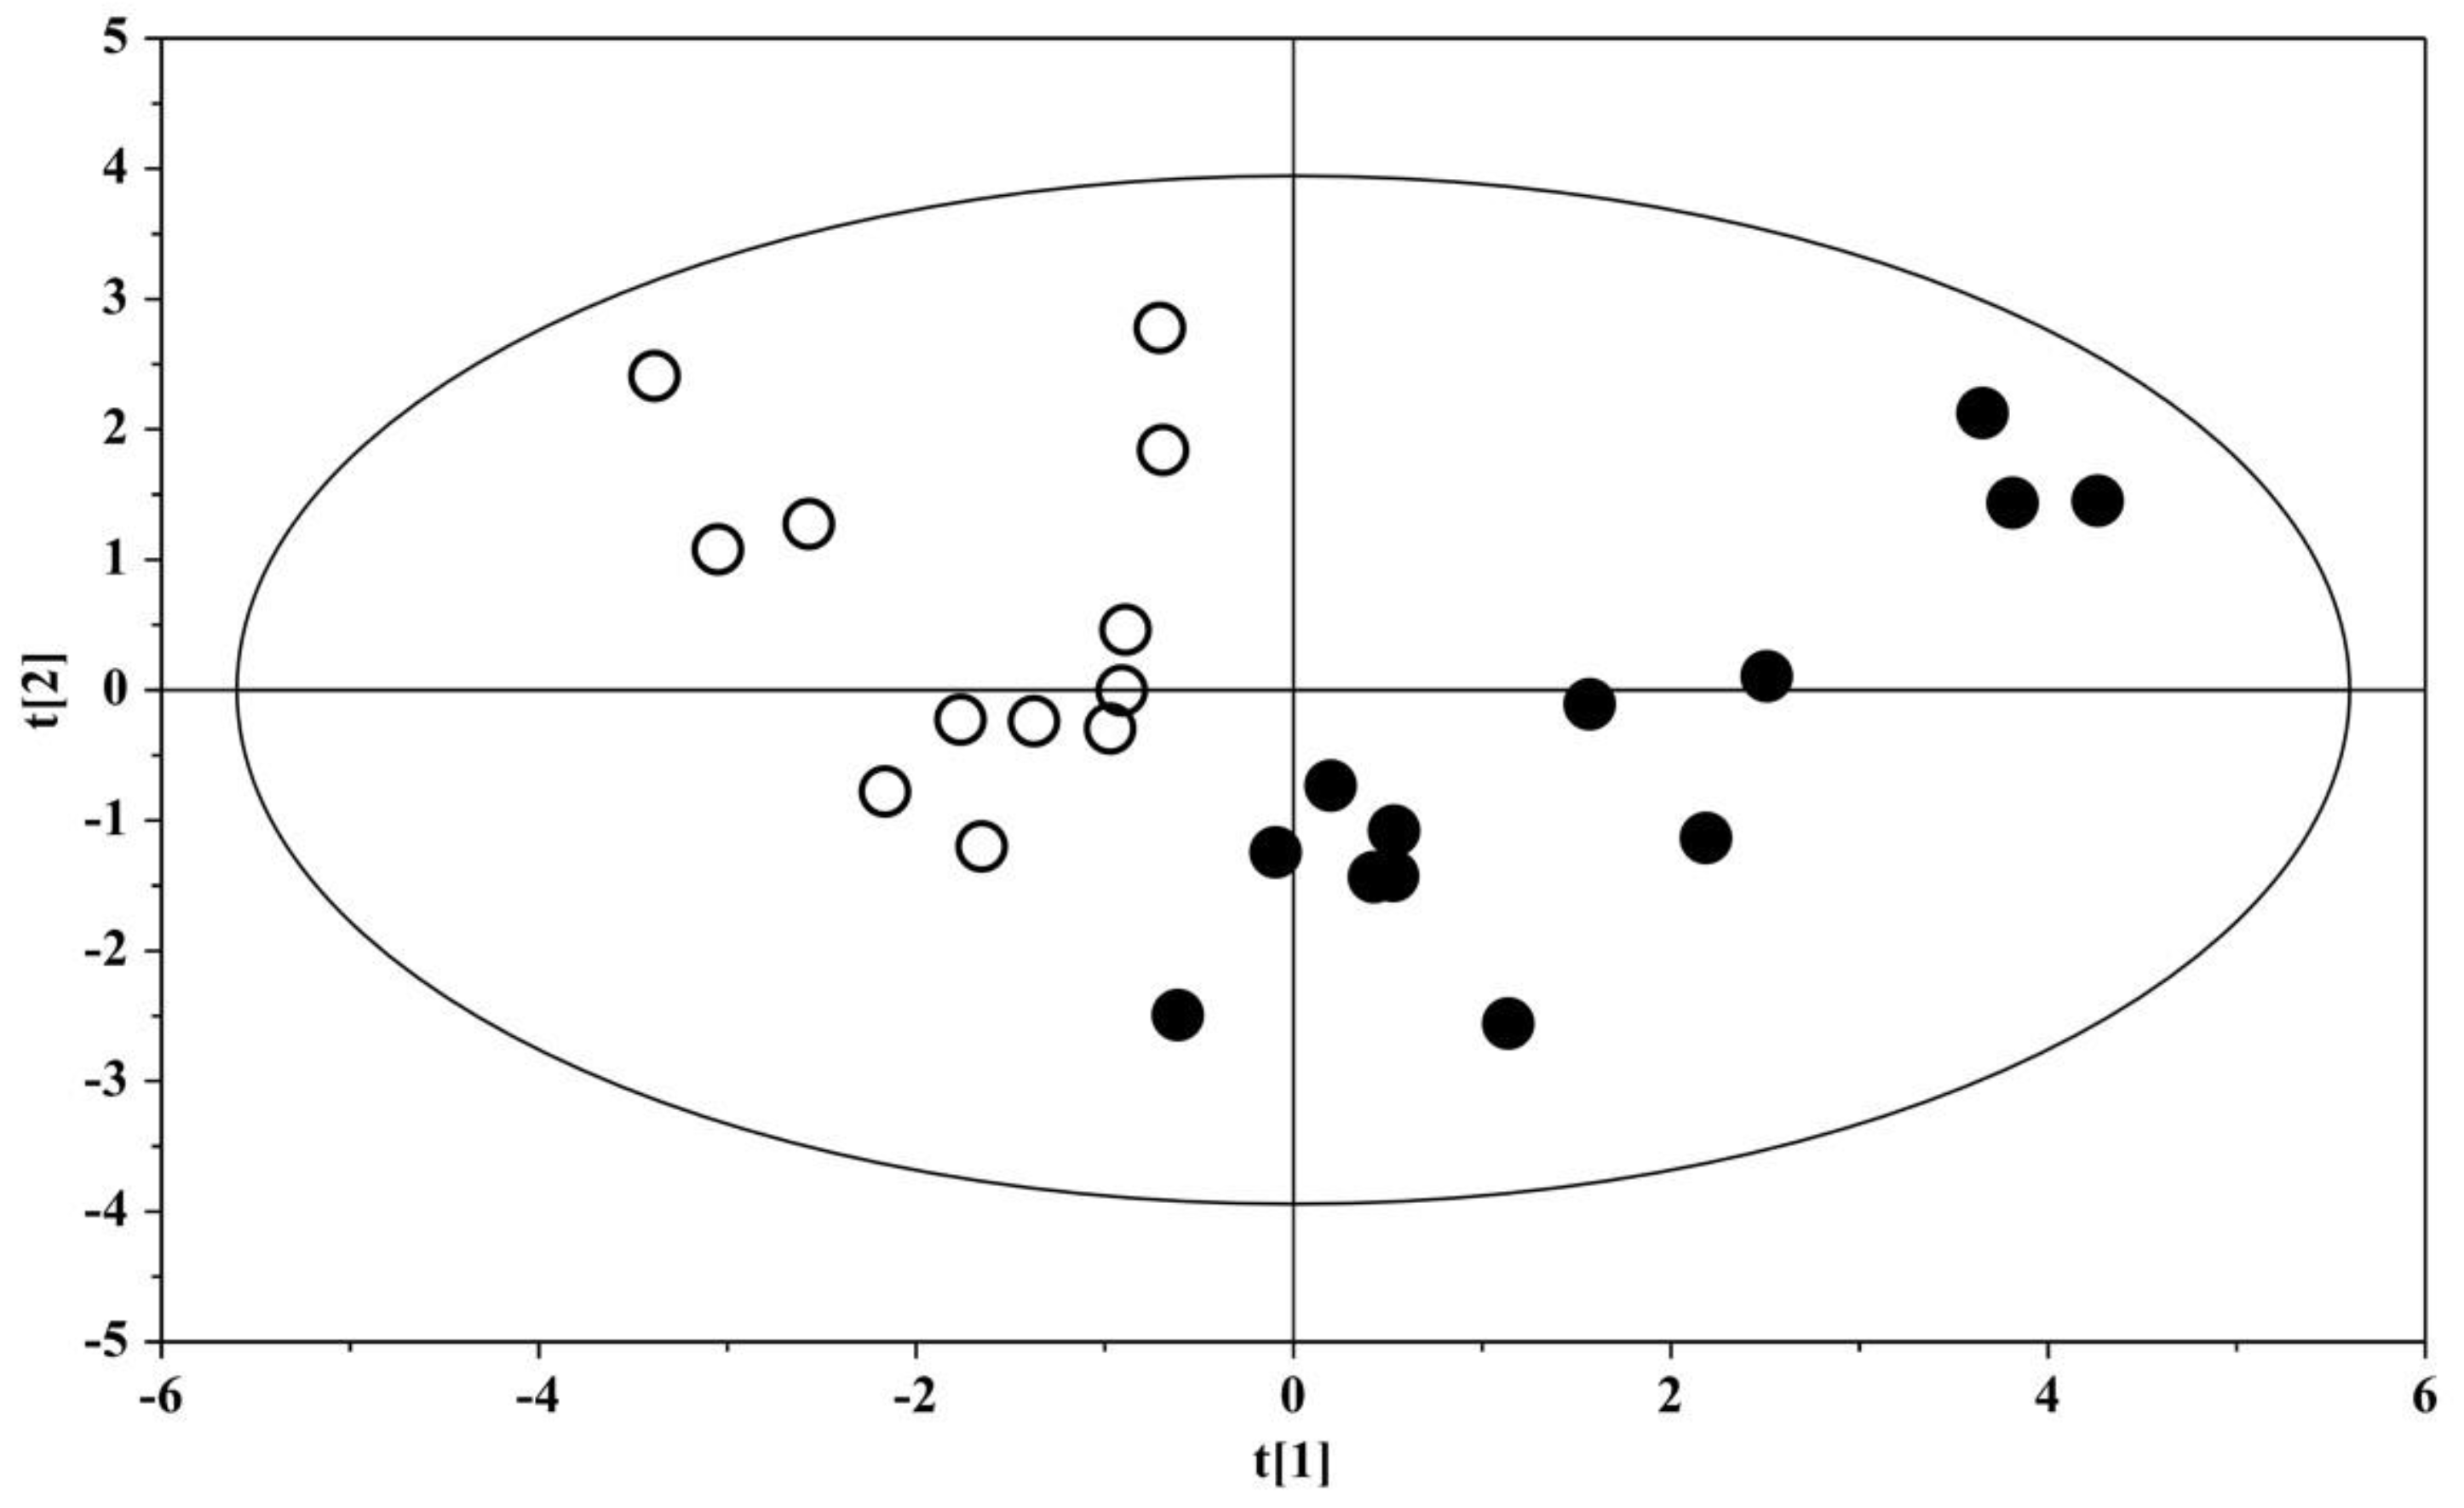
2. Results
3. Discussion
Limitations of the Study
4. Materials and Methods
4.1. Participants
4.2. Primary Behavioral Outcome Measures in Autistic Children
4.3. Sample Collection, Storage, and Preparation
4.4. Proton Nuclear Magnetic Resonance (1H-NMR) Spectroscopy Analysis
4.5. Data Preprocessing
4.6. Statistical Analysis
5. Conclusions
Supplementary Materials
Author Contributions
Funding
Institutional Review Board Statement
Informed Consent Statement
Data Availability Statement
Conflicts of Interest
References
- Loomes, R.; Hull, L.; Mandy, W.P.L. What Is the Male-to-Female Ratio in Autism Spectrum Disorder? A Systematic Review and Meta-Analysis. J. Am. Acad. Child. Adolesc. Psychiatry 2017, 56, 466–474. [Google Scholar] [CrossRef] [PubMed] [Green Version]
- Mottron, L.; Bzdok, D. Autism spectrum heterogeneity: Fact or artifact? Mol. Psychiatry 2020, 25, 3178–3185. [Google Scholar] [CrossRef] [PubMed]
- Aldinger, K.A.; Lane, C.J.; Veenstra-VanderWeele, J.; Levitt, P. Patterns of Risk for Multiple Co-Occurring Medical Conditions Replicate Across Distinct Cohorts of Children with Autism Spectrum Disorder. Autism. Res. 2015, 8, 771–781. [Google Scholar] [CrossRef] [PubMed]
- Madra, M.; Ringel, R.; Margolis, K.G. Gastrointestinal Issues and Autism Spectrum Disorder. Psychiatr. Clin. North Am. 2021, 44, 69–81. [Google Scholar] [CrossRef]
- Chen, H.; Yang, T.; Chen, J.; Chen, L.; Dai, Y.; Zhang, J.; Li, L.; Jia, F.; Wu, L.; Hao, Y.; et al. Sleep problems in children with autism spectrum disorder: A multicenter survey. BMC Psychiatry 2021, 21, 406. [Google Scholar] [CrossRef]
- Liu, X.; Sun, X.; Sun, C.; Zou, M.; Chen, Y.; Huang, J.; Wu, L.; Chen, W.X. Prevalence of epilepsy in autism spectrum disorders: A systematic review and meta-analysis. Autism 2021, 13623613211045029. [Google Scholar] [CrossRef]
- Rosenfeld, C.S. Microbiome Disturbances and Autism Spectrum Disorders. Drug Metab. Dispos. 2015, 43, 1557–1571. [Google Scholar] [CrossRef] [Green Version]
- Svoboda, E. Could the gut microbiome be linked to autism? Nature 2020, 577, S14–S15. [Google Scholar] [CrossRef]
- Xu, M.; Xu, X.; Li, J.; Li, F. Association Between Gut Microbiota and Autism Spectrum Disorder: A Systematic Review and Meta-Analysis. Front. Psychiatry 2019, 10, 473. [Google Scholar] [CrossRef]
- Lord, C.; Brugha, T.S.; Charman, T.; Cusack, J.; Dumas, G.; Frazier, T.; Jones, E.J.H.; Jones, R.M.; Pickles, A.; State, M.W.; et al. Autism spectrum disorder. Nat. Rev. Dis. Primers 2020, 6, 5. [Google Scholar] [CrossRef]
- Maenner, M.J.; Shaw, K.A.; Baio, J.; Washington, A.; Patrick, M.; DiRienzo, M.; Christensen, D.L.; Wiggins, L.D.; Pettygrove, S.; Andrews, J.G.; et al. Prevalence of Autism Spectrum Disorder Among Children Aged 8 Years—Autism and Developmental Disabilities Monitoring Network, 11 Sites, United States, 2016. MMWR Surveill Summ. 2020, 69, 1–12. [Google Scholar] [CrossRef] [PubMed]
- Mussap, M.; Noto, A.; Fanos, V. Metabolomics of autism spectrum disorders: Early insights regarding mammalian-microbial cometabolites. Expert Rev. Mol. Diagn. 2016, 16, 869–881. [Google Scholar] [CrossRef] [PubMed]
- Nadal-Desbarats, L.; Aïdoud, N.; Emond, P.; Blasco, H.; Filipiak, I.; Sarda, P.; Bonnet-Brilhault, F.; Mavel, S.; Andres, C.R. Combined 1H-NMR and 1H-13C HSQC-NMR to improve urinary screening in autism spectrum disorders. Analyst 2014, 139, 3460–3468. [Google Scholar] [CrossRef]
- Diémé, B.; Mavel, S.; Blasco, H.; Tripi, G.; Bonnet-Brilhault, F.; Malvy, J.; Bocca, C.; Andres, C.R.; Nadal-Desbarats, L.; Emond, P. Metabolomics Study of Urine in Autism Spectrum Disorders Using a Multiplatform Analytical Methodology. J. Proteome Res. 2015, 14, 5273–5282. [Google Scholar] [CrossRef] [PubMed] [Green Version]
- Noto, A.; Fanos, V.; Barberini, L.; Grapov, D.; Fattuoni, C.; Zaffanello, M.; Casanova, A.; Fenu, G.; De Giacomo, A.; De Angelis, M.; et al. The urinary metabolomics profile of an Italian autistic children population and their unaffected siblings. J. Matern. Fetal Neonatal Med. 2014, 27 (Suppl. 2), 46–52. [Google Scholar] [CrossRef] [PubMed]
- Lussu, M.; Noto, A.; Masili, A.; Rinaldi, A.C.; Dessì, A.; De Angelis, M.; De Giacomo, A.; Fanos, V.; Atzori, L.; Francavilla, R. The urinary 1H-NMR metabolomics profile of an italian autistic children population and their unaffected siblings. Autism Res. 2017, 10, 1058–1066. [Google Scholar] [CrossRef] [PubMed]
- Socała, K.; Doboszewska, U.; Szopa, A.; Serefko, A.; Włodarczyk, M.; Zielińska, A.; Poleszak, E.; Fichna, J.; Wlaź, P. The role of microbiota-gut-brain axis in neuropsychiatric and neurological disorders. Pharmacol. Res. 2021, 172, 105840. [Google Scholar] [CrossRef]
- Dodd, D.; Spitzer, M.H.; Van Treuren, W.; Merrill, B.D.; Hryckowian, A.J.; Higginbottom, S.K.; Le, A.; Cowan, T.M.; Nolan, G.P.; Fischbach, M.A.; et al. A gut bacterial pathway metabolizes aromatic amino acids into nine circulating metabolites. Nature 2017, 551, 648–652. [Google Scholar] [CrossRef]
- Zheng, Y.; Bek, M.K.; Prince, N.Z.; Peralta Marzal, L.N.; Garssen, J.; Perez Pardo, P.; Kraneveld, A.D. The Role of Bacterial-Derived Aromatic Amino Acids Metabolites Relevant in Autism Spectrum Disorders: A Comprehensive Review. Front. Neurosci. 2021, 15, 738220. [Google Scholar] [CrossRef]
- Shiman, R.; Gray, D.W. Formation and fate of tyrosine. Intracellular partitioning of newly synthesized tyrosine in mammalian liver. J. Biol. Chem. 1998, 273, 34760–34769. [Google Scholar] [CrossRef] [Green Version]
- Kałużna-Czaplińska, J.; Żurawicz, E.; Struck, W.; Markuszewski, M. Identification of organic acids as potential biomarkers in the urine of autistic children using gas chromatography/mass spectrometry. J. Chromatogr. B Analyt. Technol. Biomed. Life Sci. 2014, 966, 70–76. [Google Scholar] [CrossRef] [PubMed]
- Liu, L.Y.; Zhang, H.J.; Luo, L.Y.; Pu, J.B.; Liang, W.Q.; Zhu, C.Q.; Li, Y.P.; Wang, P.R.; Zhang, Y.Y.; Yang, C.Y.; et al. Blood and urinary metabolomic evidence validating traditional Chinese medicine diagnostic classification of major depressive disorder. Chin. Med. 2018, 13, 53. [Google Scholar] [CrossRef] [PubMed] [Green Version]
- Li, Q.; Zhang, C. A metabolome study on 90 autism spectrum disorder patients by mass spectrometry. Med. Mass Spectrom. 2017, 1, 14–19. [Google Scholar]
- Evans, C.; Dunstan, R.H.; Rothkirch, T.; Roberts, T.K.; Reichelt, K.L.; Cosford, R.; Deed, G.; Ellis, L.B.; Sparkes, D.L. Altered amino acid excretion in children with autism. Nutr. Neurosci. 2008, 11, 9–17. [Google Scholar] [CrossRef] [PubMed]
- Gorina, A.S.; Kolesnichenko, L.S.; Mikhnovich, V.I. Catecholamines and their metabolites in children with Asperger and Kanner syndromes. Biomed. Khim. 2011, 57, 562–570. (In Russian) [Google Scholar] [CrossRef] [PubMed] [Green Version]
- Mavel, S.; Nadal-Desbarats, L.; Blasco, H.; Bonnet-Brilhault, F.; Barthélémy, C.; Montigny, F.; Sarda, P.; Laumonnier, F.; Vourc’h, P.; Andres, C.R.; et al. 1H-13C NMR-based urine metabolic profiling in autism spectrum disorders. Talanta 2013, 114, 95–102. [Google Scholar] [CrossRef] [Green Version]
- Bitar, T.; Mavel, S.; Emond, P.; Nadal-Desbarats, L.; Lefèvre, A.; Mattar, H.; Soufia, M.; Blasco, H.; Vourc’h, P.; Hleihel, W.; et al. Identification of metabolic pathway disturbances using multimodal metabolomics in autistic disorders in a Middle Eastern population. J. Pharm. Biomed. Anal. 2018, 152, 57–65. [Google Scholar] [CrossRef]
- Tu, W.J.; Chen, H.; He, J. Application of LC-MS/MS analysis of plasma amino acids profiles in children with autism. J. Clin. Biochem. Nutr. 2012, 51, 248–249. [Google Scholar] [CrossRef] [Green Version]
- Laghi, L.; Mastromarino, P.; Prosperi, M.; Morales, M.A.; Calderoni, S.; Santocchi, E.; Muratori, F.; Guiducci, L. Are Fecal Metabolome and Microbiota Profiles Correlated with Autism Severity? A Cross-Sectional Study on ASD Preschoolers. Metabolites 2021, 11, 654. [Google Scholar] [CrossRef]
- Carding, S.; Verbeke, K.; Vipond, D.T.; Corfe, B.M.; Owen, L.J. Dysbiosis of the gut microbiota in disease. Microb. Ecol. Health Dis. 2015, 26, 26191. [Google Scholar] [CrossRef]
- Saito, Y.; Sato, T.; Nomoto, K.; Tsuji, H. Identification of phenol- and p-cresol-producing intestinal bacteria by using media supplemented with tyrosine and its metabolites. FEMS Microbiol. Ecol. 2018, 94, fiy125. [Google Scholar] [CrossRef] [PubMed]
- Cafaro, V.; Notomista, E.; Capasso, P.; Di Donato, A. Mutation of glutamic acid 103 of toluene o-xylene monooxygenase as a means to control the catabolic efficiency of a recombinant upper pathway for degradation of methylated aromatic compounds. Appl. Environ. Microbiol. 2005, 71, 4744–4750. [Google Scholar] [CrossRef] [PubMed] [Green Version]
- Altieri, L.; Neri, C.; Sacco, R.; Curatolo, P.; Benvenuto, A.; Muratori, F.; Santocchi, E.; Bravaccio, C.; Lenti, C.; Saccani, M.; et al. Urinary p-cresol is elevated in small children with severe autism spectrum disorder. Biomarkers 2011, 16, 252–260. [Google Scholar] [CrossRef] [PubMed]
- De Angelis, M.; Piccolo, M.; Vannini, L.; Siragusa, S.; De Giacomo, A.; Serrazzanetti, D.I.; Cristofori, F.; Guerzoni, M.E.; Gobbetti, M.; Francavilla, R. Fecal microbiota and metabolome of children with autism and pervasive developmental disorder not otherwise specified. PLoS ONE 2013, 8, e76993. [Google Scholar] [CrossRef] [Green Version]
- Glinton, K.E.; Elsea, S.H. Untargeted Metabolomics for Autism Spectrum Disorders: Current Status and Future Directions. Front Psychiatry. 2019, 10, 647. [Google Scholar] [CrossRef]
- Gabriele, S.; Sacco, R.; Altieri, L.; Neri, C.; Urbani, A.; Bravaccio, C.; Riccio, M.P.; Iovene, M.R.; Bombace, F.; De Magistris, L.; et al. Slow intestinal transit contributes to elevate urinary p-cresol level in Italian autistic children. Autism Res. 2016, 9, 752–759. [Google Scholar] [CrossRef]
- Persico, A.M.; Napolioni, V. Urinary p-cresol in autism spectrum disorder. Neurotoxicol. Teratol. 2013, 36, 82–90. [Google Scholar] [CrossRef]
- Zhu, S.; Rong, Y.; Kiang, T.K.L. Effects of p-Cresol on Oxidative Stress, Glutathione Depletion, and Necrosis in HepaRG Cells: Comparisons to Other Uremic Toxins and the Role of p-Cresol Glucuronide Formation. Pharmaceutics 2021, 13, 857. [Google Scholar] [CrossRef]
- Bermudez-Martin, P.; Becker, J.A.J.; Caramello, N.; Fernandez, S.P.; Costa-Campos, R.; Canaguier, J.; Barbosa, S.; Martinez-Gili, L.; Myridakis, A.; Dumas, M.E.; et al. The microbial metabolite p-Cresol induces autistic-like behaviors in mice by remodeling the gut microbiota. Microbiome 2021, 9, 157. [Google Scholar] [CrossRef]
- Gabriele, S.; Sacco, R.; Cerullo, S.; Neri, C.; Urbani, A.; Tripi, G.; Malvy, J.; Barthelemy, C.; Bonnet-Brihault, F.; Persico, A.M. Urinary p-cresol is elevated in young French children with autism spectrum disorder: A replication study. Biomarkers 2014, 19, 463–470. [Google Scholar] [CrossRef]
- Gevi, F.; Belardo, A.; Zolla, L. A metabolomics approach to investigate urine levels of neurotransmitters and related metabolites in autistic children. Biochim. Biophys. Acta Mol. Basis Dis. 2020, 1866, 165859. [Google Scholar] [CrossRef]
- Gątarek, P.; Jóźwik-Pruska, J.; Bjørklund, G.; Chirumbolo, S.; Kałużna-Czaplińska, J. Urinary carboxylic acids (UCAs) in subjects with autism spectrum disorder and their association with bacterial overgrowth. Rev. Anal. Chem. 2020, 39, 78–87. [Google Scholar] [CrossRef]
- Imaki, M.; Kawabata, K.; Yoshida, Y.; Nakamura, T.; Tanada, S. Evaluation of the Effects of Various Factors on the Serum αHydroxybutyrate Dehydrogenase Activity in Young Females. Appl. Hum. Sci. 1995, 14, 297–302. [Google Scholar] [CrossRef] [PubMed] [Green Version]
- Yap, I.K.; Angley, M.; Veselkov, K.A.; Holmes, E.; Lindon, J.C.; Nicholson, J.K. Urinary metabolic phenotyping differentiates children with autism from their unaffected siblings and age-matched controls. J. Proteome Res. 2010, 9, 2996–3004. [Google Scholar] [CrossRef] [PubMed] [Green Version]
- Ghanizadeh, A. Increased glutamate and homocysteine and decreased glutamine levels in autism: A review and strategies for future studies of amino acids in autism. Dis. Markers 2013, 35, 281–286. [Google Scholar] [CrossRef] [PubMed] [Green Version]
- Żurawicz, E.; Kałużna-Czaplińska, J. Analysis of amino acids in autism spectrum disorders. Trends Anal. Chem. 2015, 73, 91–118. [Google Scholar] [CrossRef]
- Zheng, Z.; Zhu, T.; Qu, Y.; Mu, D. Blood Glutamate Levels in Autism Spectrum Disorder: A Systematic Review and Meta-Analysis. PLoS ONE 2016, 11, e0158688. [Google Scholar] [CrossRef] [PubMed]
- Zheng, H.F.; Wang, W.Q.; Li, X.M.; Rauw, G.; Baker, G.B. Body fluid levels of neuroactive amino acids in autism spectrum disorders: A review of the literature. Amino Acids 2017, 49, 57–65. [Google Scholar] [CrossRef] [Green Version]
- Ueno, H. Enzymatic and structural aspects on glutamate decarboxylase. J. Mol. Catal. B Enzym. 2000, 10, 67–79. [Google Scholar] [CrossRef]
- Nissim, I. Newer aspects of glutamine/glutamate metabolism: The role of acute pH changes. Am. J. Physiol. 1999, 277, F493–F497. [Google Scholar] [CrossRef]
- Yoshimi, N.; Futamura, T.; Bergen, S.E.; Iwayama, Y.; Ishima, T.; Sellgren, C.; Ekman, C.J.; Jakobsson, J.; Pålsson, E.; Kakumoto, K.; et al. Cerebrospinal fluid metabolomics identifies a key role of isocitrate dehydrogenase in bipolar disorder: Evidence in support of mitochondrial dysfunction hypothesis. Mol. Psychiatry 2016, 21, 1504–1510. [Google Scholar] [CrossRef] [PubMed]
- Holeček, M. Histidine in Health and Disease: Metabolism, Physiological Importance, and Use as a Supplement. Nutrients 2020, 12, 848. [Google Scholar] [CrossRef] [PubMed] [Green Version]
- Al-Ayadhi, L.; Zayed, N.; Bhat, R.S.; Moubayed, N.M.S.; Al-Muammar, M.N.; El-Ansary, A. The use of biomarkers associated with leaky gut as a diagnostic tool for early intervention in autism spectrum disorder: A systematic review. Gut Pathog. 2021, 13, 54. [Google Scholar] [CrossRef] [PubMed]
- Schneider, M.; Al-Shareffi, E.; Haltiwanger, R.S. Biological functions of fucose in mammals. Glycobiology 2017, 27, 601–618. [Google Scholar] [CrossRef] [PubMed] [Green Version]
- Bansil, R.; Turner, B.S. The biology of mucus: Composition, synthesis and organization. Adv. Drug Deliv. Rev. 2018, 124, 3–15. [Google Scholar] [CrossRef]
- Garber, J.M.; Hennet, T.; Szymanski, C.M. Significance of fucose in intestinal health and disease. Mol. Microbiol. 2021, 115, 1086–1093. [Google Scholar] [CrossRef]
- Pickard, J.M.; Chervonsky, A.V. Intestinal fucose as a mediator of host-microbe symbiosis. J. Immunol. 2015, 194, 5588–5593. [Google Scholar] [CrossRef] [Green Version]
- Mir, R.; Jallu, S.; Singh, T.P. The shikimate pathway: Review of amino acid sequence, function and three-dimensional structures of the enzymes. Crit. Rev. Microbiol. 2015, 41, 172–189. [Google Scholar] [CrossRef]
- Jones, A.R. Some observations on the urinary excretion of glycine conjugates by laboratory animals. Xenobiotica 1982, 12, 387–395. [Google Scholar] [CrossRef]
- Kaufman, S. A model of human phenylalanine metabolism in normal subjects and in phenylketonuric patients. Proc. Natl. Acad. Sci. USA 1999, 96, 3160–3164. [Google Scholar] [CrossRef] [Green Version]
- Nicholls, A.W.; Nicholson, J.K.; Haselden, J.H.; Waterfield, C.J. A metabonomic approach to the investigation of drug-induced phospholipidosis: An NMR spectroscopy and pattern recognition study. Biomarkers 2000, 5, 410–423. [Google Scholar] [CrossRef]
- Ma, Y.; Zhou, H.; Li, C.; Zou, X.; Luo, X.; Wu, L.; Li, T.; Chen, X.; Mao, M.; Huang, Y.; et al. Differential Metabolites in Chinese Autistic Children: A Multi-Center Study Based on Urinary 1H-NMR Metabolomics Analysis. Front. Psychiatry 2021, 12, 624767. [Google Scholar] [CrossRef] [PubMed]
- Grimaldi, R.; Gibson, G.R.; Vulevic, J.; Giallourou, N.; Castro-Mejía, J.L.; Hansen, L.H.; Leigh Gibson, E.; Nielsen, D.S.; Costabile, A. A prebiotic intervention study in children with autism spectrum disorders (ASDs). Microbiome 2018, 6, 133. [Google Scholar] [CrossRef] [PubMed]
- Adams, J.B.; Audhya, T.; McDonough-Means, S.; Rubin, R.A.; Quig, D.; Geis, E.; Gehn, E.; Loresto, M.; Mitchell, J.; Atwood, S.; et al. Nutritional and metabolic status of children with autism vs. neurotypical children, and the association with autism severity. Nutr. Metab. 2011, 8, 34. [Google Scholar] [CrossRef] [PubMed] [Green Version]
- Rangel-Huerta, O.D.; Gomez-Fernández, A.; de la Torre-Aguilar, M.J.; Gil, A.; Perez-Navero, J.L.; Flores-Rojas, K.; Martín-Borreguero, P.; Gil-Campos, M. Metabolic profiling in children with autism spectrum disorder with and without mental regression: Preliminary results from a cross-sectional case-control study. Metabolomics 2019, 15, 99. [Google Scholar] [CrossRef] [PubMed]
- Kaliannan, K.; Li, X.Y.; Wang, B.; Pan, Q.; Chen, C.Y.; Hao, L.; Xie, S.; Kang, J.X. Multi-omic analysis in transgenic mice implicates omega-6/omega-3 fatty acid imbalance as a risk factor for chronic disease. Commun. Biol. 2019, 2, 276. [Google Scholar] [CrossRef] [Green Version]
- Larsen, P.E.; Dai, Y. Metabolome of human gut microbiome is predictive of host dysbiosis. Gigascience 2015, 4, 42. [Google Scholar] [CrossRef] [Green Version]
- American Psychiatric Association, American Psychiatric Association DSM-5 Task Force. Diagnostic and Statistical Manual of Mental Disorders: DSM-5, 5th ed.; American Psychiatric Publishing: Washington, DC, USA, 2013; pp. 1–991. [Google Scholar]
- Lord, C.; Rutter, M.; DiLavore, P.C.; Risi, S.; Gotham, K.; Bishop, S. Autism Diagnostic Observation Schedule, 2nd ed.; (ADOS-2) Manual (Part I): Modules 1–4; WPS Publishing, Western Psychological Services: Torrance, CA, USA, 2012. [Google Scholar]
- Hus, V.; Gotham, K.; Lord, C. Standardizing ADOS domain scores: Separating severity of social affect and restricted and repetitive behaviors. J. Autism Dev. Disord. 2014, 44, 2400–2412. [Google Scholar] [CrossRef] [Green Version]
- Musa, M.A.; Kabir, M.; Hossain, M.I.; Ahmed, E.; Siddique, A.; Rashid, H.; Mahfuz, M.; Mondal, D.; Ahmed, T.; Petri, W.A.; et al. Measurement of intestinal permeability using lactulose and mannitol with conventional five hours and shortened two hours urine collection by two different methods: HPAE-PAD and LC-MSMS. PLoS ONE 2019, 14, e0220397. [Google Scholar] [CrossRef] [Green Version]
- Vojdani, A. For the assessment of intestinal permeability, size matters. Altern. Ther. Health Med. 2013, 19, 12–24. [Google Scholar]
- de Magistris, L.; Familiari, V.; Pascotto, A.; Sapone, A.; Frolli, A.; Iardino, P.; Carteni, M.; De Rosa, M.; Francavilla, R.; Riegler, G.; et al. Alterations of the intestinal barrier in patients with autism spectrum disorders and in their first-degree relatives. J. Pediatr. Gastroenterol. Nutr. 2010, 51, 418–424. [Google Scholar] [CrossRef] [PubMed] [Green Version]
- Kohl, S.M.; Klein, M.S.; Hochrein, J.; Oefner, P.J.; Spang, R.; Gronwald, W. State-of-the art data normalization methods improve NMR-based metabolomic analysis. Metabolomics 2012, 8 (Suppl. 1), 146–160. [Google Scholar] [CrossRef] [PubMed] [Green Version]
- Wu, Y.; Li, L. Sample normalization methods in quantitative metabolomics. J Chromatogr A. 2016, 1430, 80–95. [Google Scholar] [CrossRef] [PubMed]
- Lipfert, M.; Rout, M.K.; Berjanskii, M.; Wishart, D.S. Automated Tools for the Analysis of 1D-NMR and 2D-NMR Spectra. Methods Mol. Biol. 2019, 2037, 429–449. [Google Scholar] [CrossRef]
- Benjamini, Y.; Hochberg, Y. Controlling the false discovery rate: A practical and powerful approach to multiple hypothesis testing. J. R. Stat. Soc. Ser. B 1995, 57, 289–300. [Google Scholar] [CrossRef]


| Variable | ASD 1 Children (n = 13) | ASD Children Excluding Those with Altered IP 2 (n = 11) | US 3 (n = 12) |
|---|---|---|---|
| Male/Female (n) | 10/3 | 8/3 | 8/4 |
| Age (years) | 8 (4–12) | 8 (4–12) | 9 (13–5) |
| Vaginal birth/Cesarean section (n) | 7/6 | 6/5 | 5/7 |
| Gestational age (weeks) | 39 (37–40) | 39 (37–40) | 39 (38–40) |
| Birthweight (kg) | 3.25 (3.0–3.45) | 3.20 (2.99–3.35) | 3.54 (3.05–3.76) |
| Birth height (cm) | 50 (48–50) | 50 (46.5–50.5) | 51 (49.8–53.2) |
| Mother’s age (years) | 35 (32–36) | 35 (33–37) | 32 (25.7–37.0) |
| Father’s age (years) | 40 (41–34) | 40 (33.5–41.5) | 35 (30.2–41.2) |
| Parental age gap (years) | 4 (2–5) | 4 (2.5–6.0) | 4 (2.0–5.5) |
| Previous abortion (n) | 2 | 0 | 2 |
| Constipation (n) | 5 | 5 | 2 |
| ADOS-2 CSS 4 (score) | 10 (8–12) | 9 (7.5–11) | - |
| Lactulose:mannitol ratio | 0.023 (0.19–0.032) | 0.021 (0.019–0.027) | 0.023 (0.015–0.029) |
| Variable | Child #7 (G.B., Male) | Child #10 (S.A., Male) | ||
|---|---|---|---|---|
| Variation from Median Value in ASD 1 Children | Variation from Median Value in US 2 | Variation from Median Value in ASD 1 Children | Variation from Median Value in US 2 | |
| Age (years) | +2 (+25%) | +1 (+11.1%) | −3 (−37.5%) | −2 (−22.2%) |
| Gestational age, weeks (%) | −1 (−2.5%) | −1 (−2.5%) | 0 (0%) | 0 (0%) |
| Birthweight, kg (%) | +0.40 (+12.3%) | +0.11 (+3.1%) | +0.20 (+6.1%) | −0.09 (−2.5%) |
| Birth height, cm (%) | 0 (0%) | −1 (−1.9%) | −1 (−2.0%) | −2 (−3.9%) |
| Mother’s age, years (%) | 0 (0%) | +3 (+9.3%) | −3 (−9.3%) | 0 (0%) |
| Father’s age, years (%) | −3 (−7.5%) | +2 (+5.7%) | −6 (−15%) | −1 (−2.8%) |
| Parental age gap, years (%) | −2 (−50%) | −2 (−50%) | −2 (−50%) | −2 (−50%) |
| ADOS-2 CSS 3, score (%) | −1 (−10%) | - | +9 (+90%) | - |
| Lactulose:mannitol ratio (%) | +0.036 (+156%) | +0.036 (+156%) | +0.045 (+195%) | +0.045 (+195%) |
| OPLS-DA Model | Permutation (400 Times) * | |||||
|---|---|---|---|---|---|---|
| Component a | R2X Cum b | R2Y Cum c | Q2 Cum d | R2 Intercept | Q2 Intercept | |
| ASD vs. US | 1P + 1O | 0.229 | 0.801 | 0.504 | 0.394 | −0.315 |
| OPLS model | ||||||
| ASD children | 1P + 1O | 0.359 | 0.662 | 0.478 | 0.467 | −0.331 |
| Metabolite (mM) a | ASD | US | p b | FC c (log10) |
|---|---|---|---|---|
| 2-Hydroxybutyrate | 5.24 (3.8–7.0) | 3.05 (2.5–4.3) | 0.01 | 0.778 |
| Asparagine | 5.12 (2.8–7.1) | 3.18 (2.4–3.7) | 0.04 | 0.686 |
| Hippurate | 5.79 (2.7–7.0) | 2.07 (1.3–3.8) | 0.02 | 1.482 |
| Histidine | 3.25 (1.6–5.0) | 5.44 (3.5–7.9) | 0.04 | −0.739 |
| Isocitrate | 3.62 (2.6–4.4) | 4.58 (3.8–6.2) | 0.03 | −0.337 |
| Glutamate | 5.35 (3.6–6.7) | 3.48 (2.5–4.1) | 0.02 | 0.618 |
| Tryptophan | 4.87 (3.4–7.2) | 3.34 (2.2–4.2) | 0.01 | 0.542 |
| Tyrosine | 4.75 (2.3–7.9) | 3.03 (2.5–3.4) | <0.01 | 0.650 |
| Succinylacetone | 3.58 (2.6–4.5) | 4.92 (3.8–5.8) | 0.03 | −0.458 |
Publisher’s Note: MDPI stays neutral with regard to jurisdictional claims in published maps and institutional affiliations. |
© 2022 by the authors. Licensee MDPI, Basel, Switzerland. This article is an open access article distributed under the terms and conditions of the Creative Commons Attribution (CC BY) license (https://creativecommons.org/licenses/by/4.0/).
Share and Cite
Piras, C.; Mussap, M.; Noto, A.; De Giacomo, A.; Cristofori, F.; Spada, M.; Fanos, V.; Atzori, L.; Francavilla, R. Alterations of the Intestinal Permeability are Reflected by Changes in the Urine Metabolome of Young Autistic Children: Preliminary Results. Metabolites 2022, 12, 104. https://doi.org/10.3390/metabo12020104
Piras C, Mussap M, Noto A, De Giacomo A, Cristofori F, Spada M, Fanos V, Atzori L, Francavilla R. Alterations of the Intestinal Permeability are Reflected by Changes in the Urine Metabolome of Young Autistic Children: Preliminary Results. Metabolites. 2022; 12(2):104. https://doi.org/10.3390/metabo12020104
Chicago/Turabian StylePiras, Cristina, Michele Mussap, Antonio Noto, Andrea De Giacomo, Fernanda Cristofori, Martina Spada, Vassilios Fanos, Luigi Atzori, and Ruggiero Francavilla. 2022. "Alterations of the Intestinal Permeability are Reflected by Changes in the Urine Metabolome of Young Autistic Children: Preliminary Results" Metabolites 12, no. 2: 104. https://doi.org/10.3390/metabo12020104