
Comparative Investigation of Raw and Processed Radix Polygoni Multiflori on the Treatment of Vascular Dementia by Liquid Chromatograph−Mass Spectrometry Based Metabolomic Approach
Abstract
: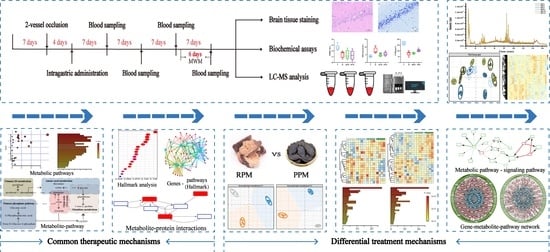
1. Introduction
2. Results
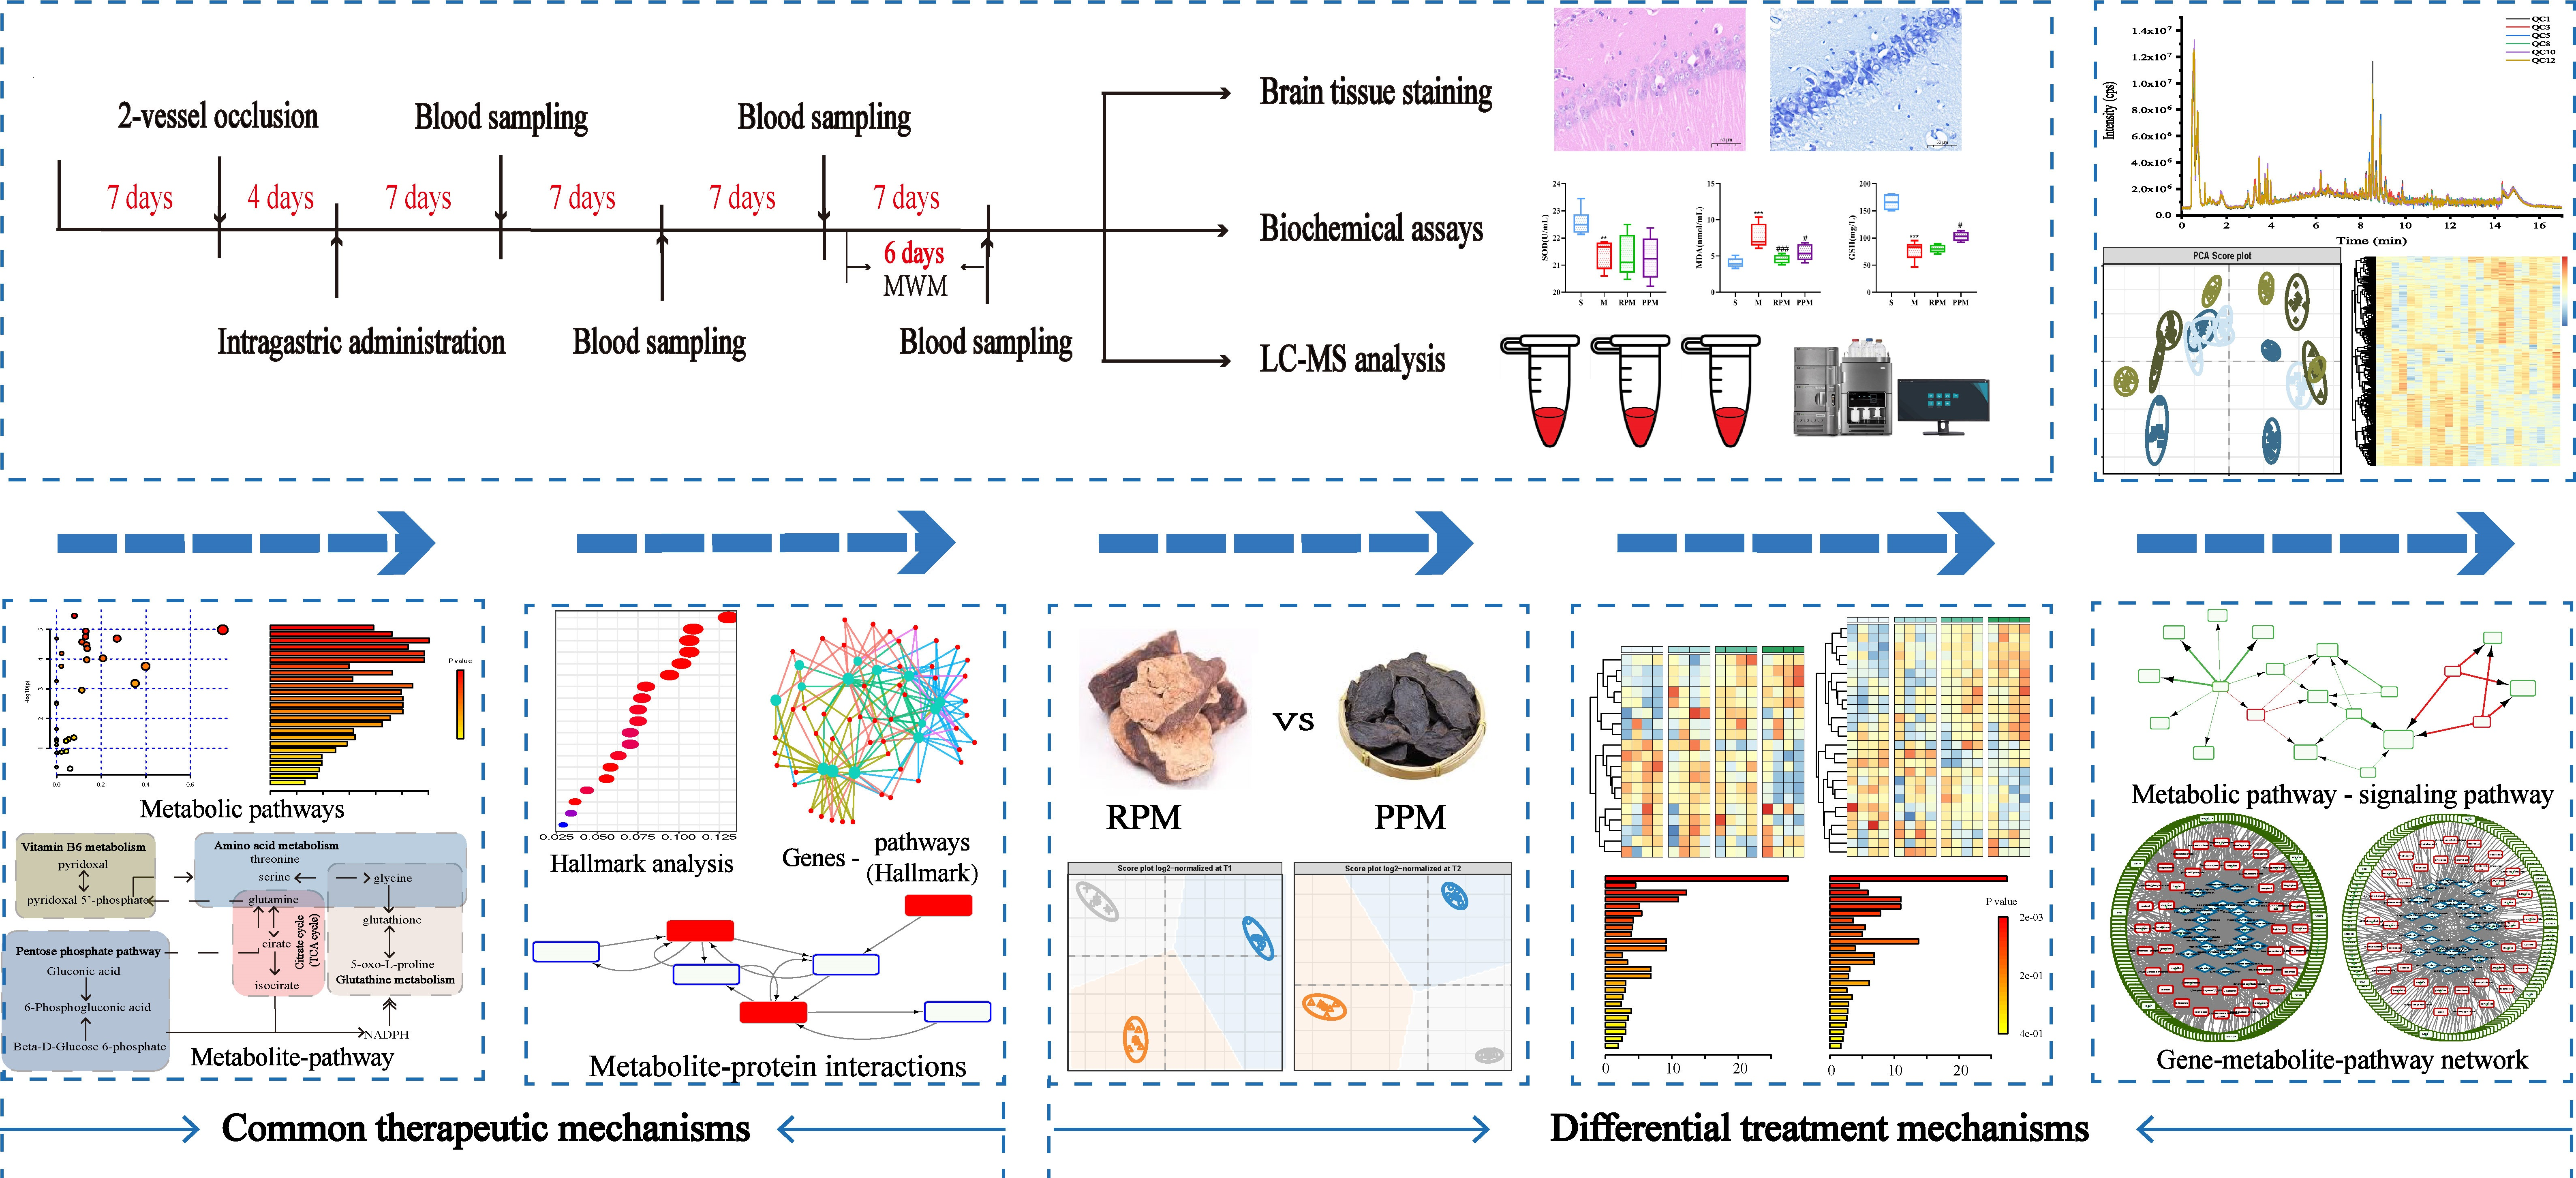
2.1. RPM and PPM Improved Memory Performance of VaD Rats
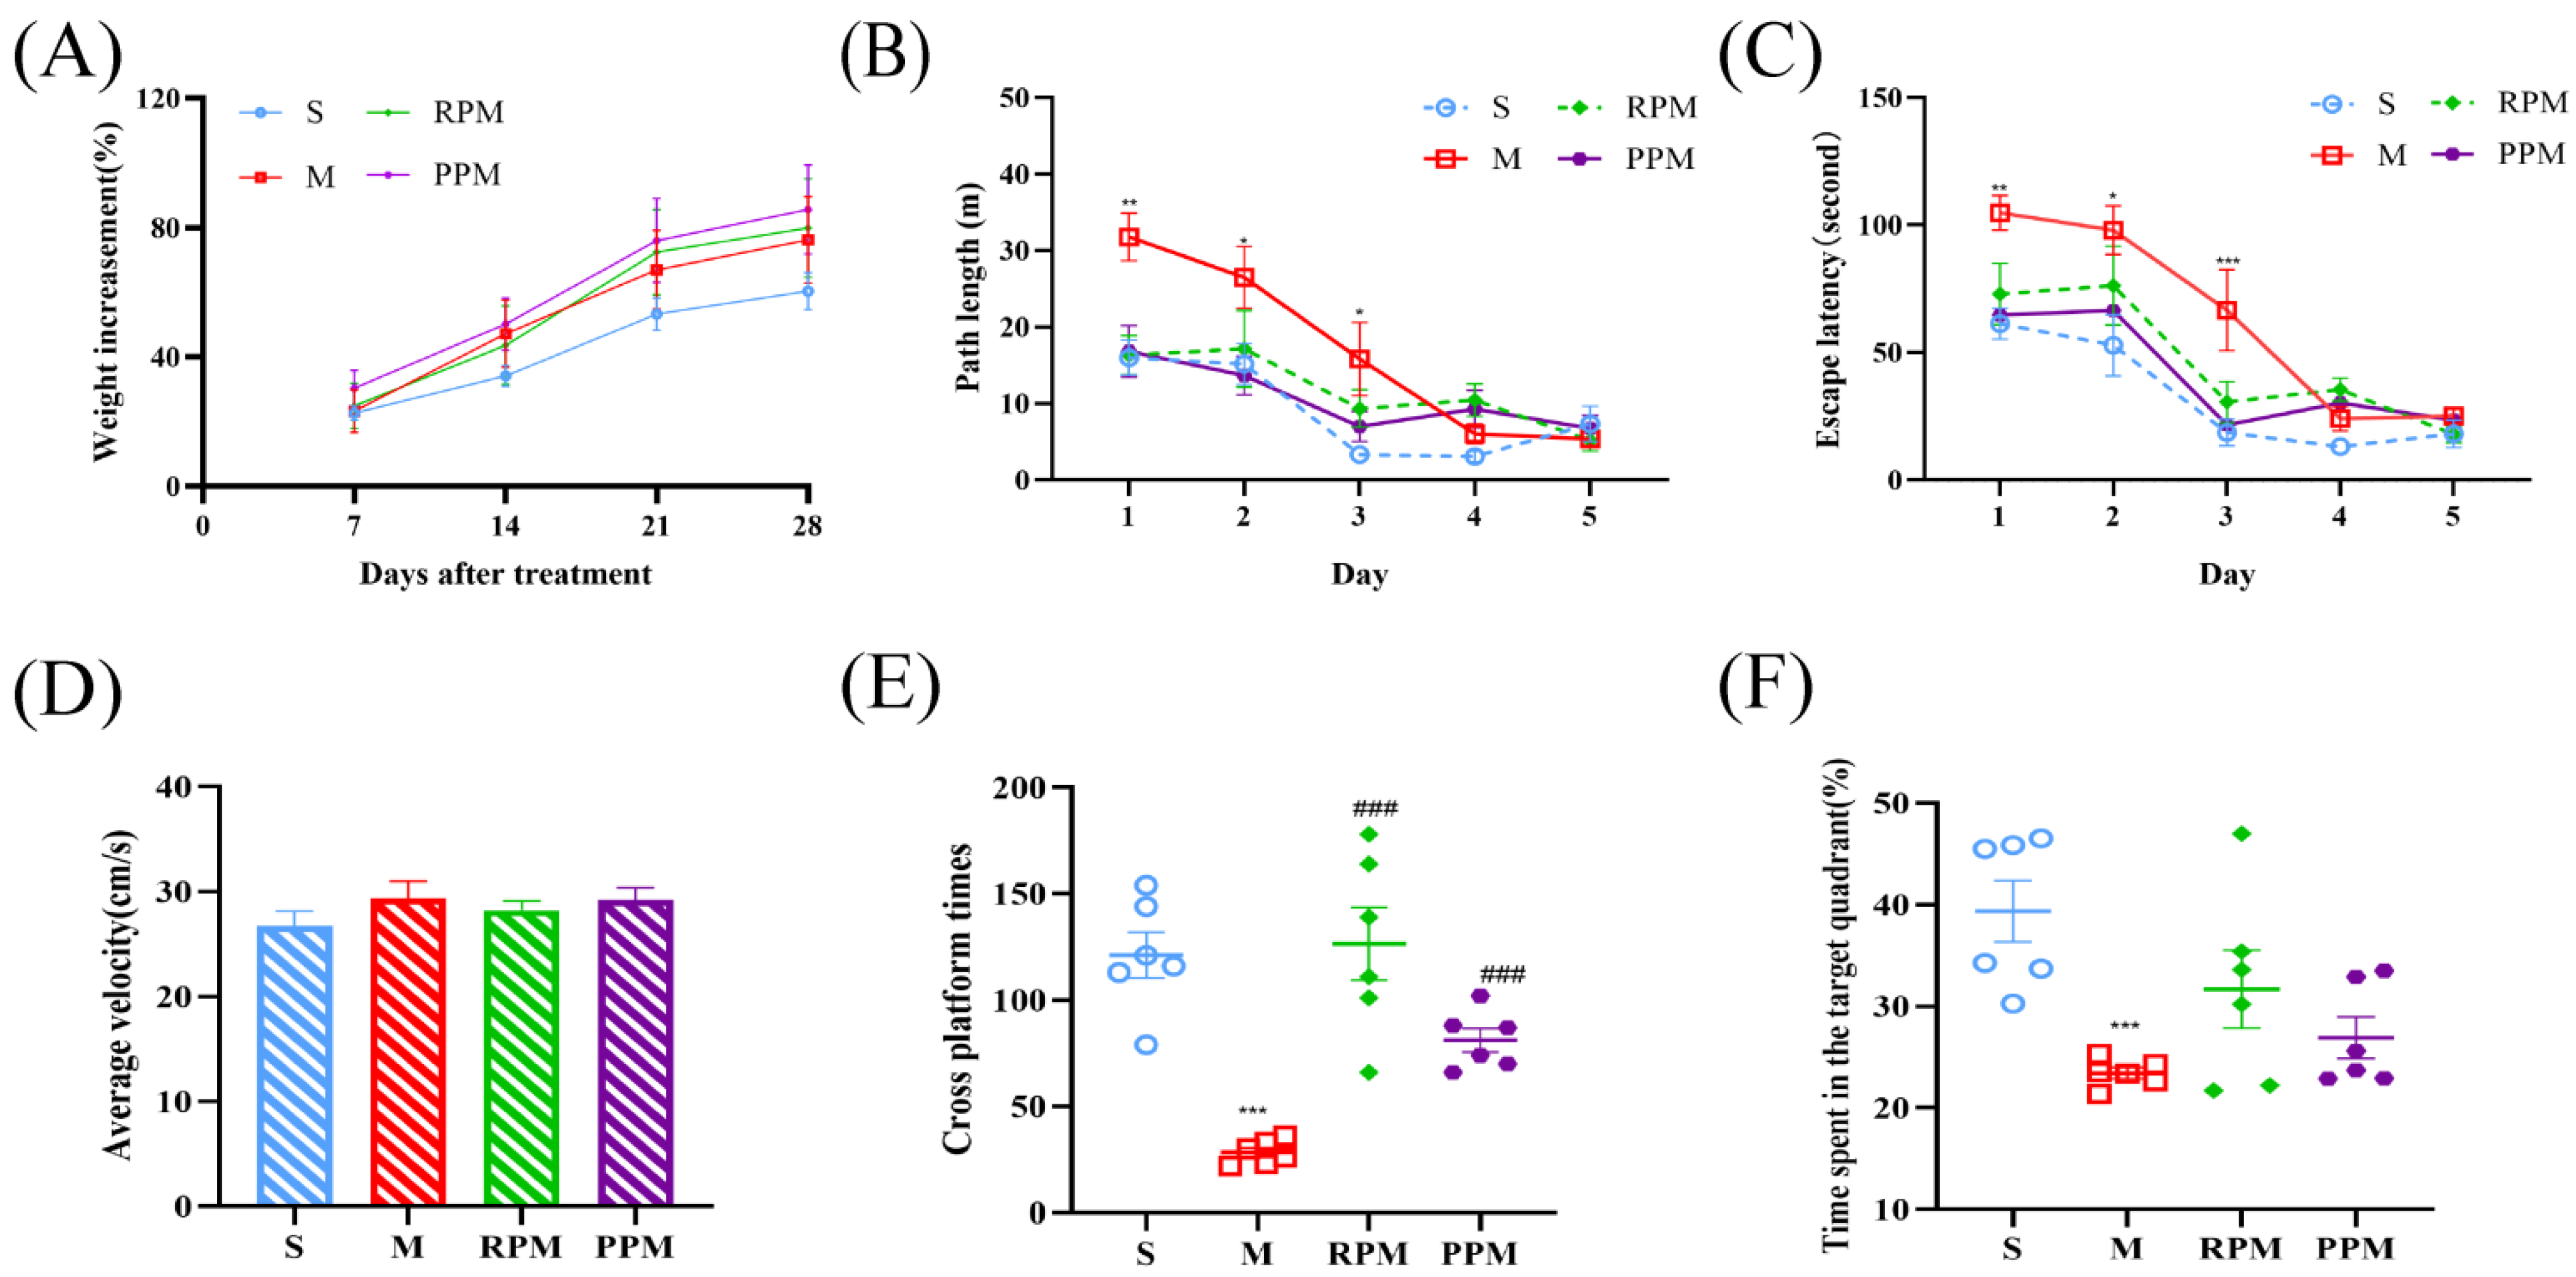
2.2. RPM and PPM Reduced the Histopathological Damage of VaD
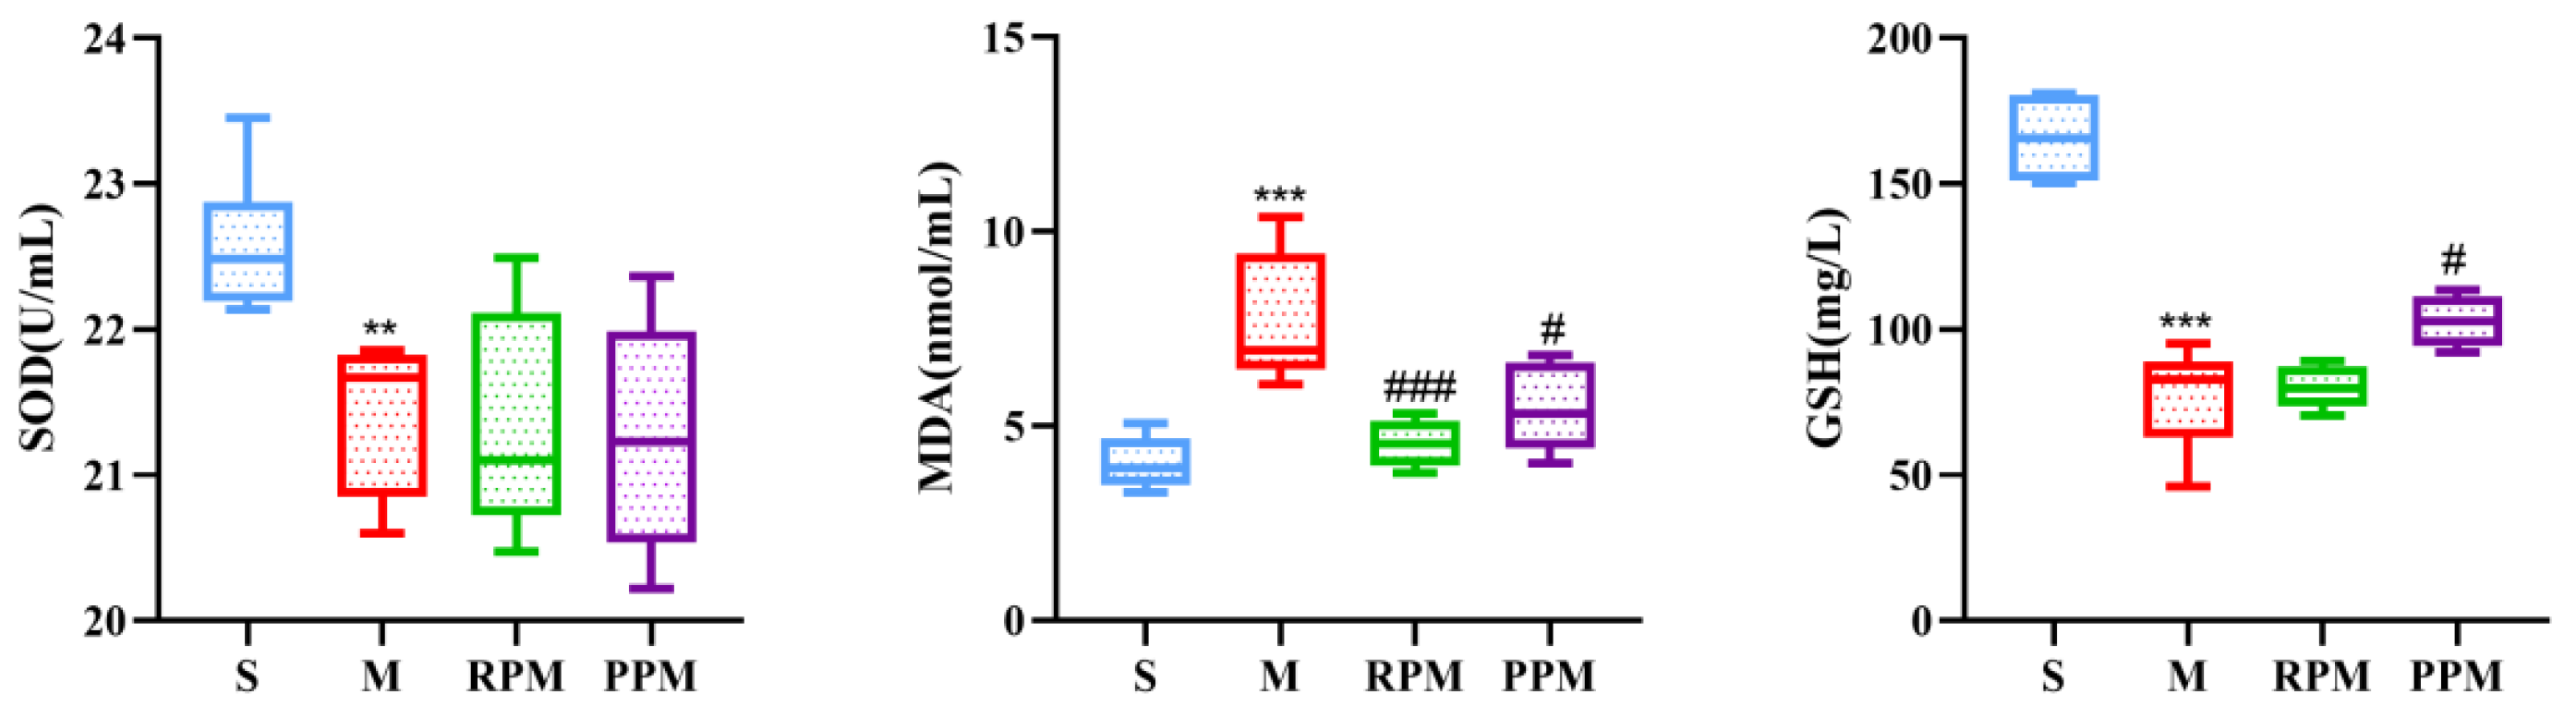
2.3. RPM and PPM Exhibits Anti−Oxidant Effects
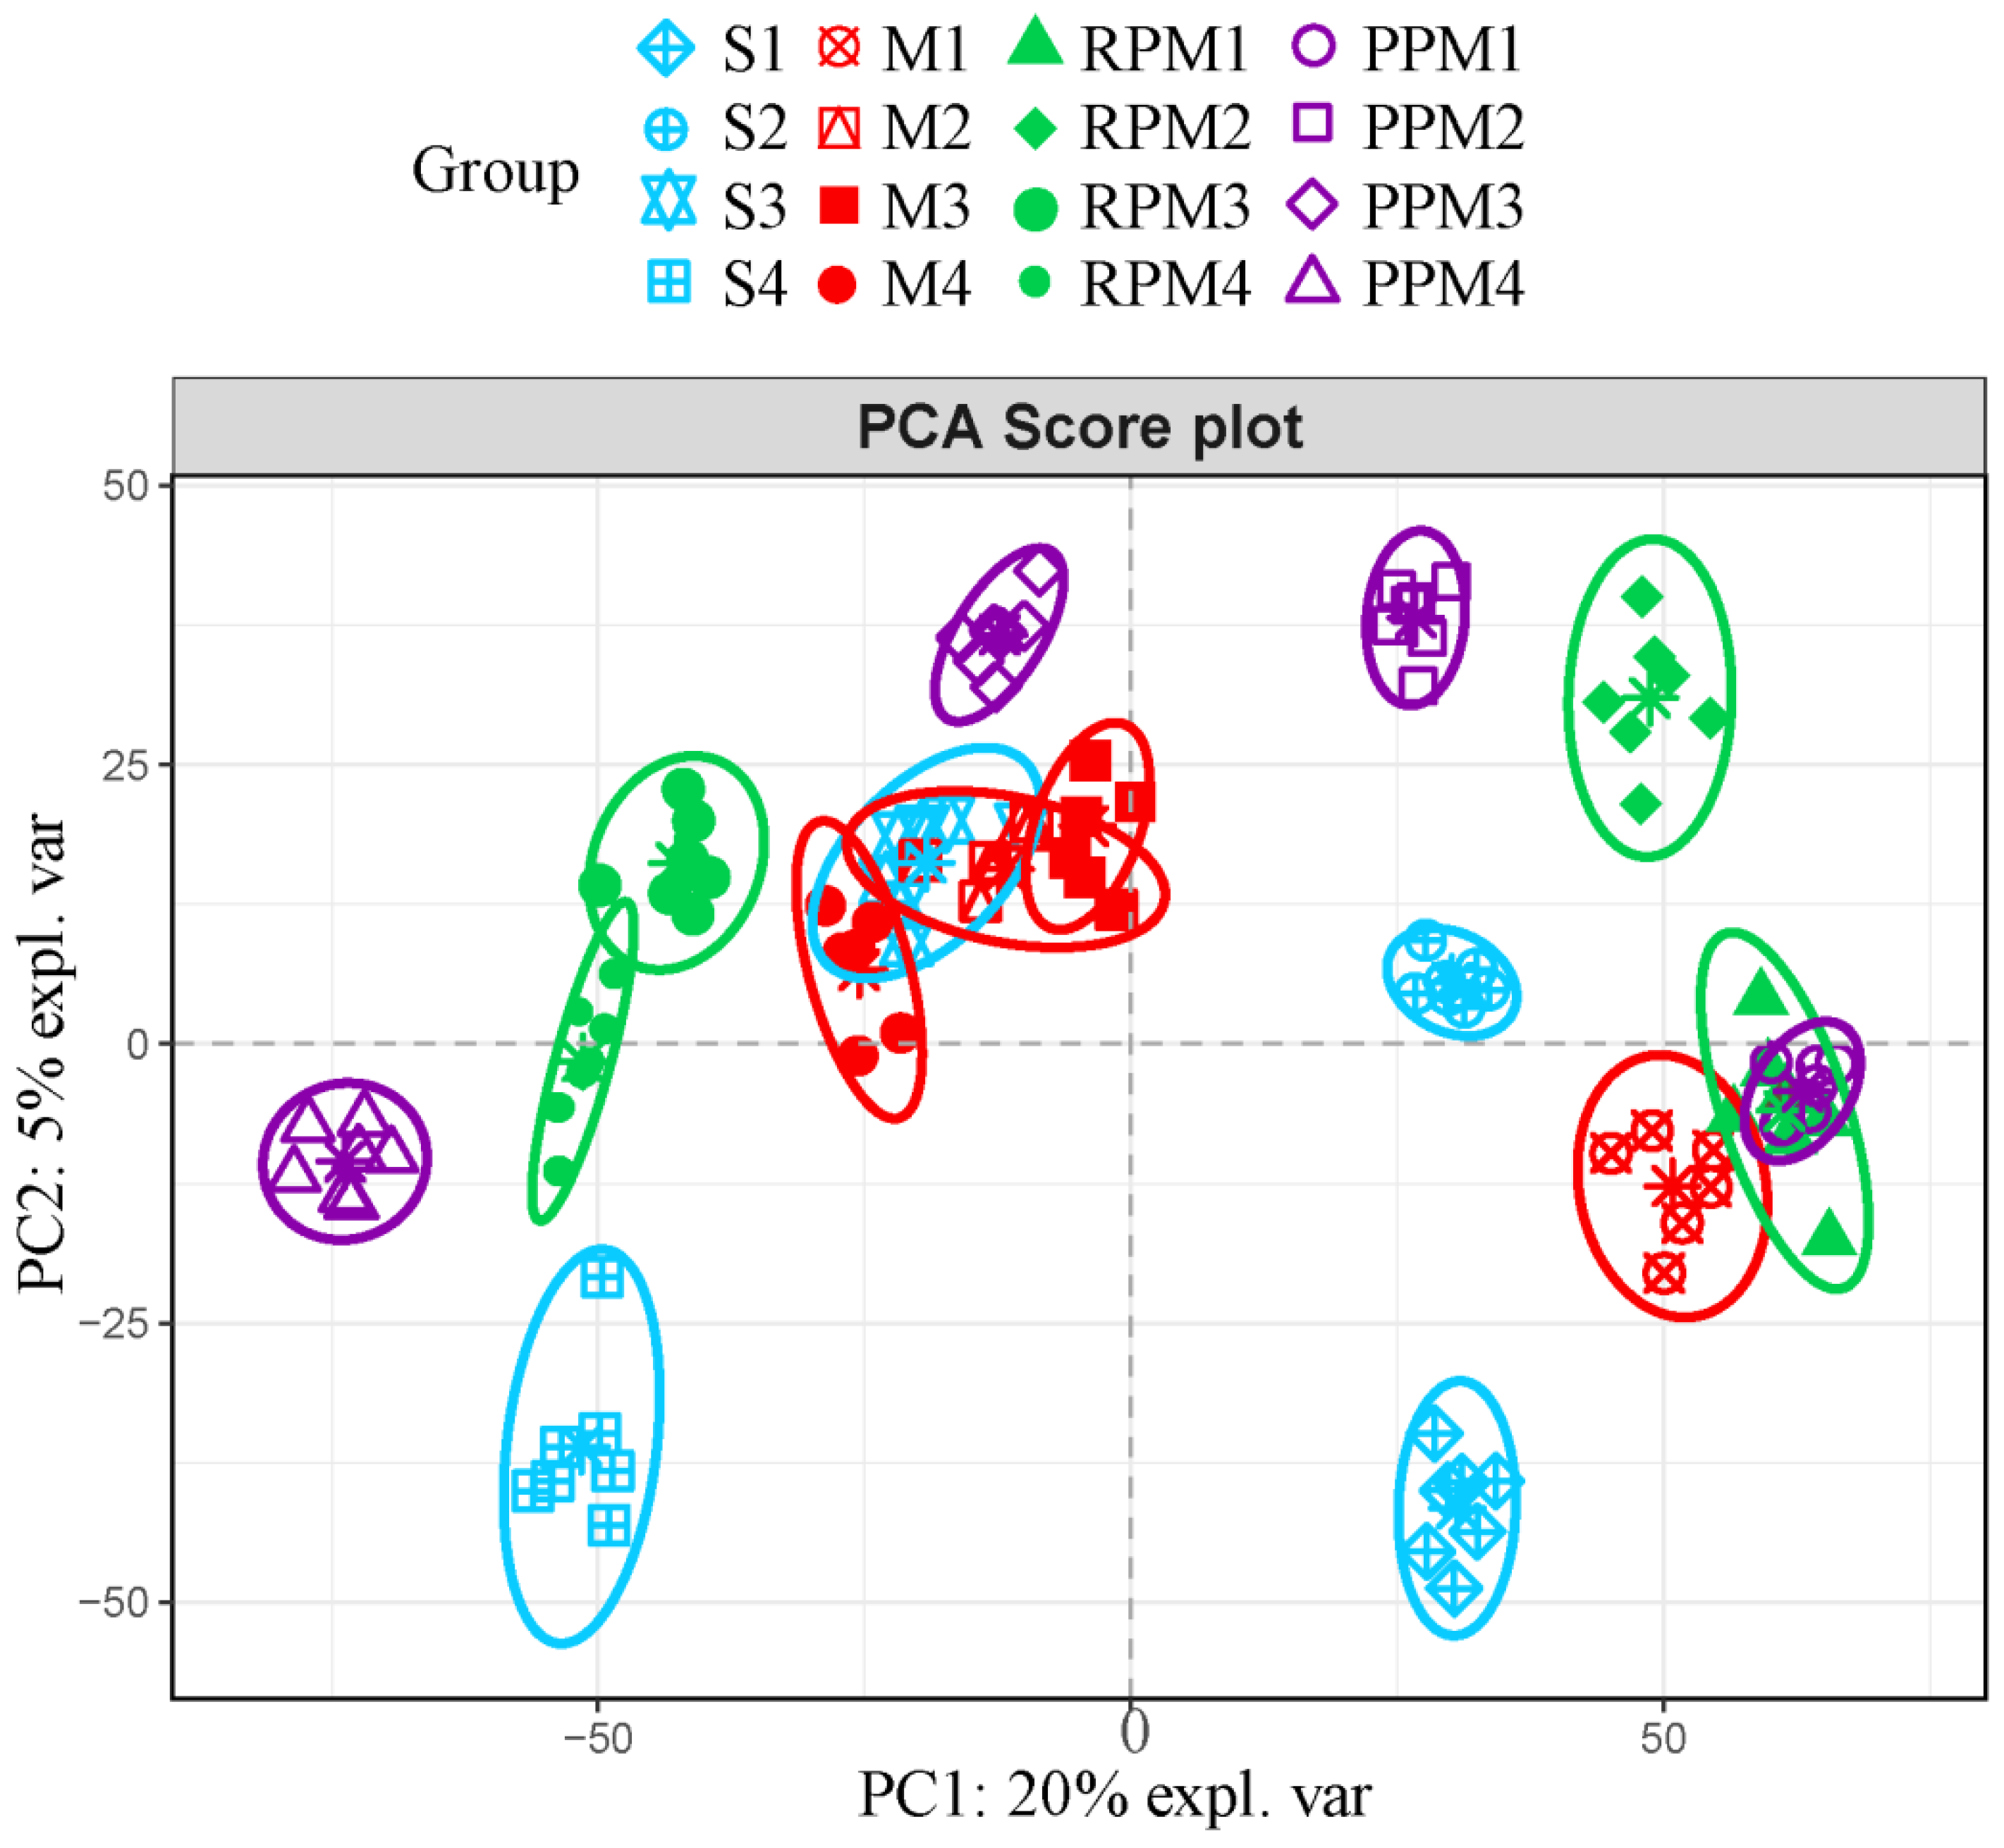
2.4. RPM and PPM Ameliorated Disordered Metabolism of VaD
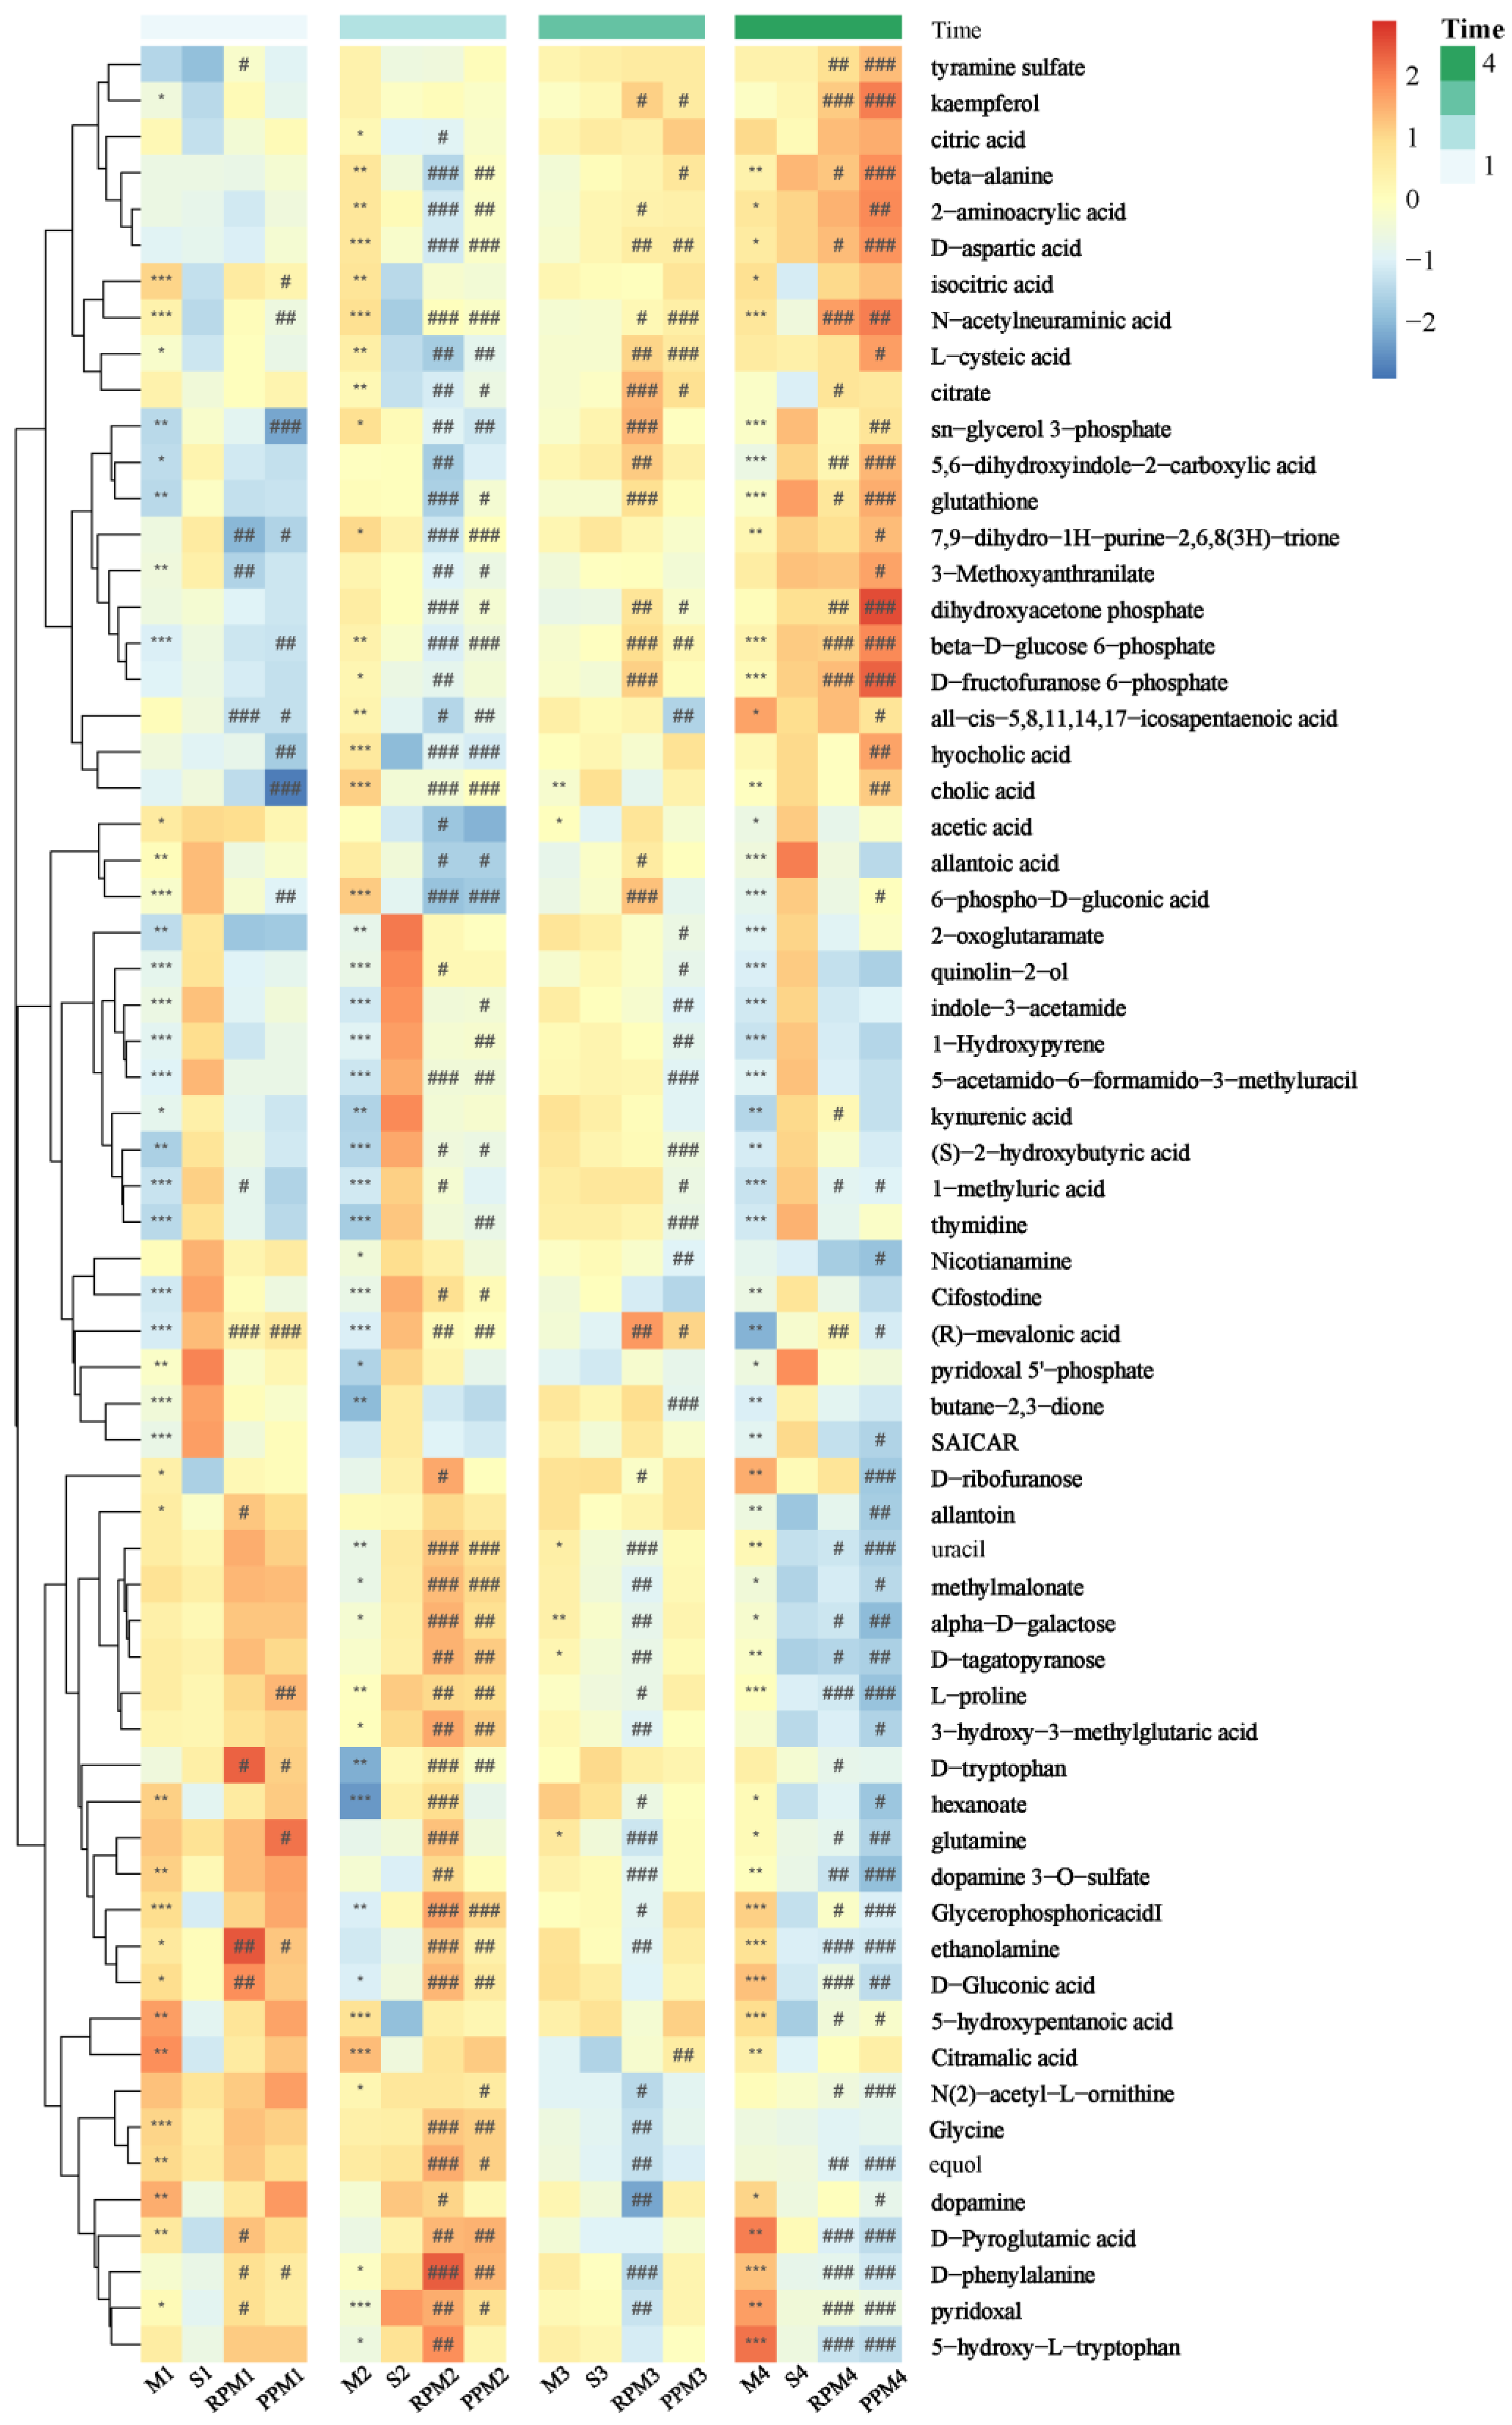
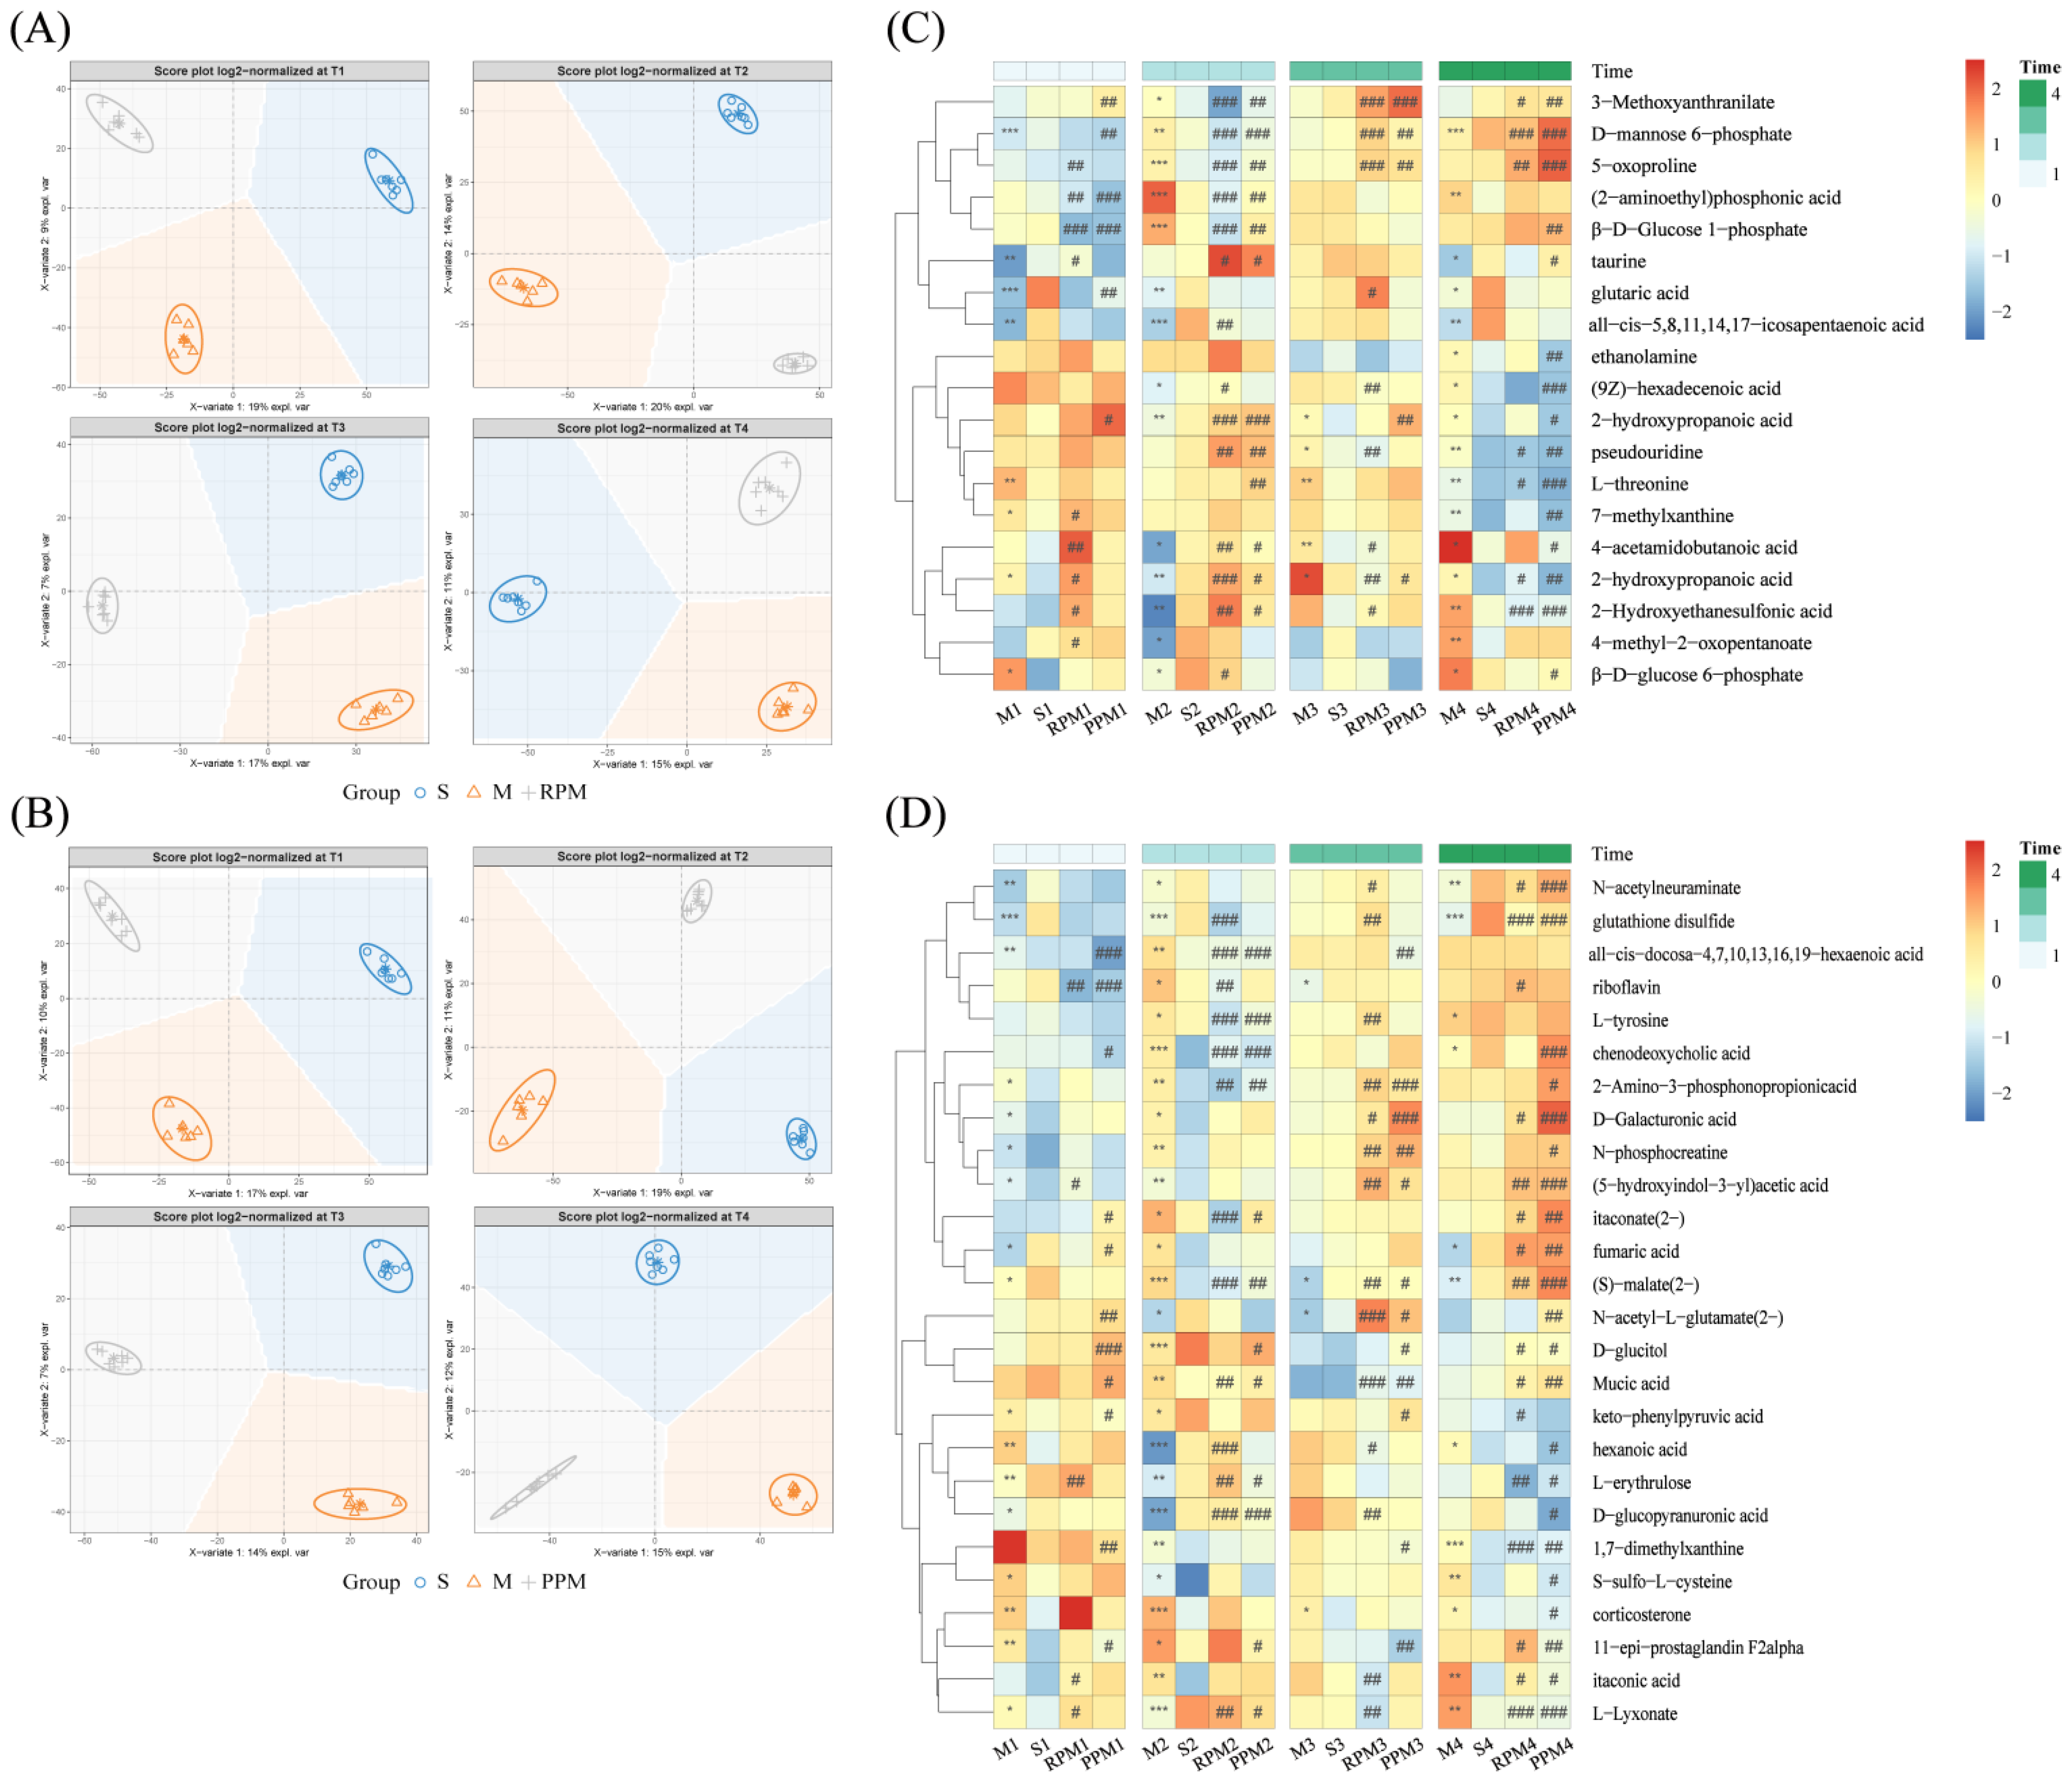
2.5. Differential Metabolites in Treatment Group
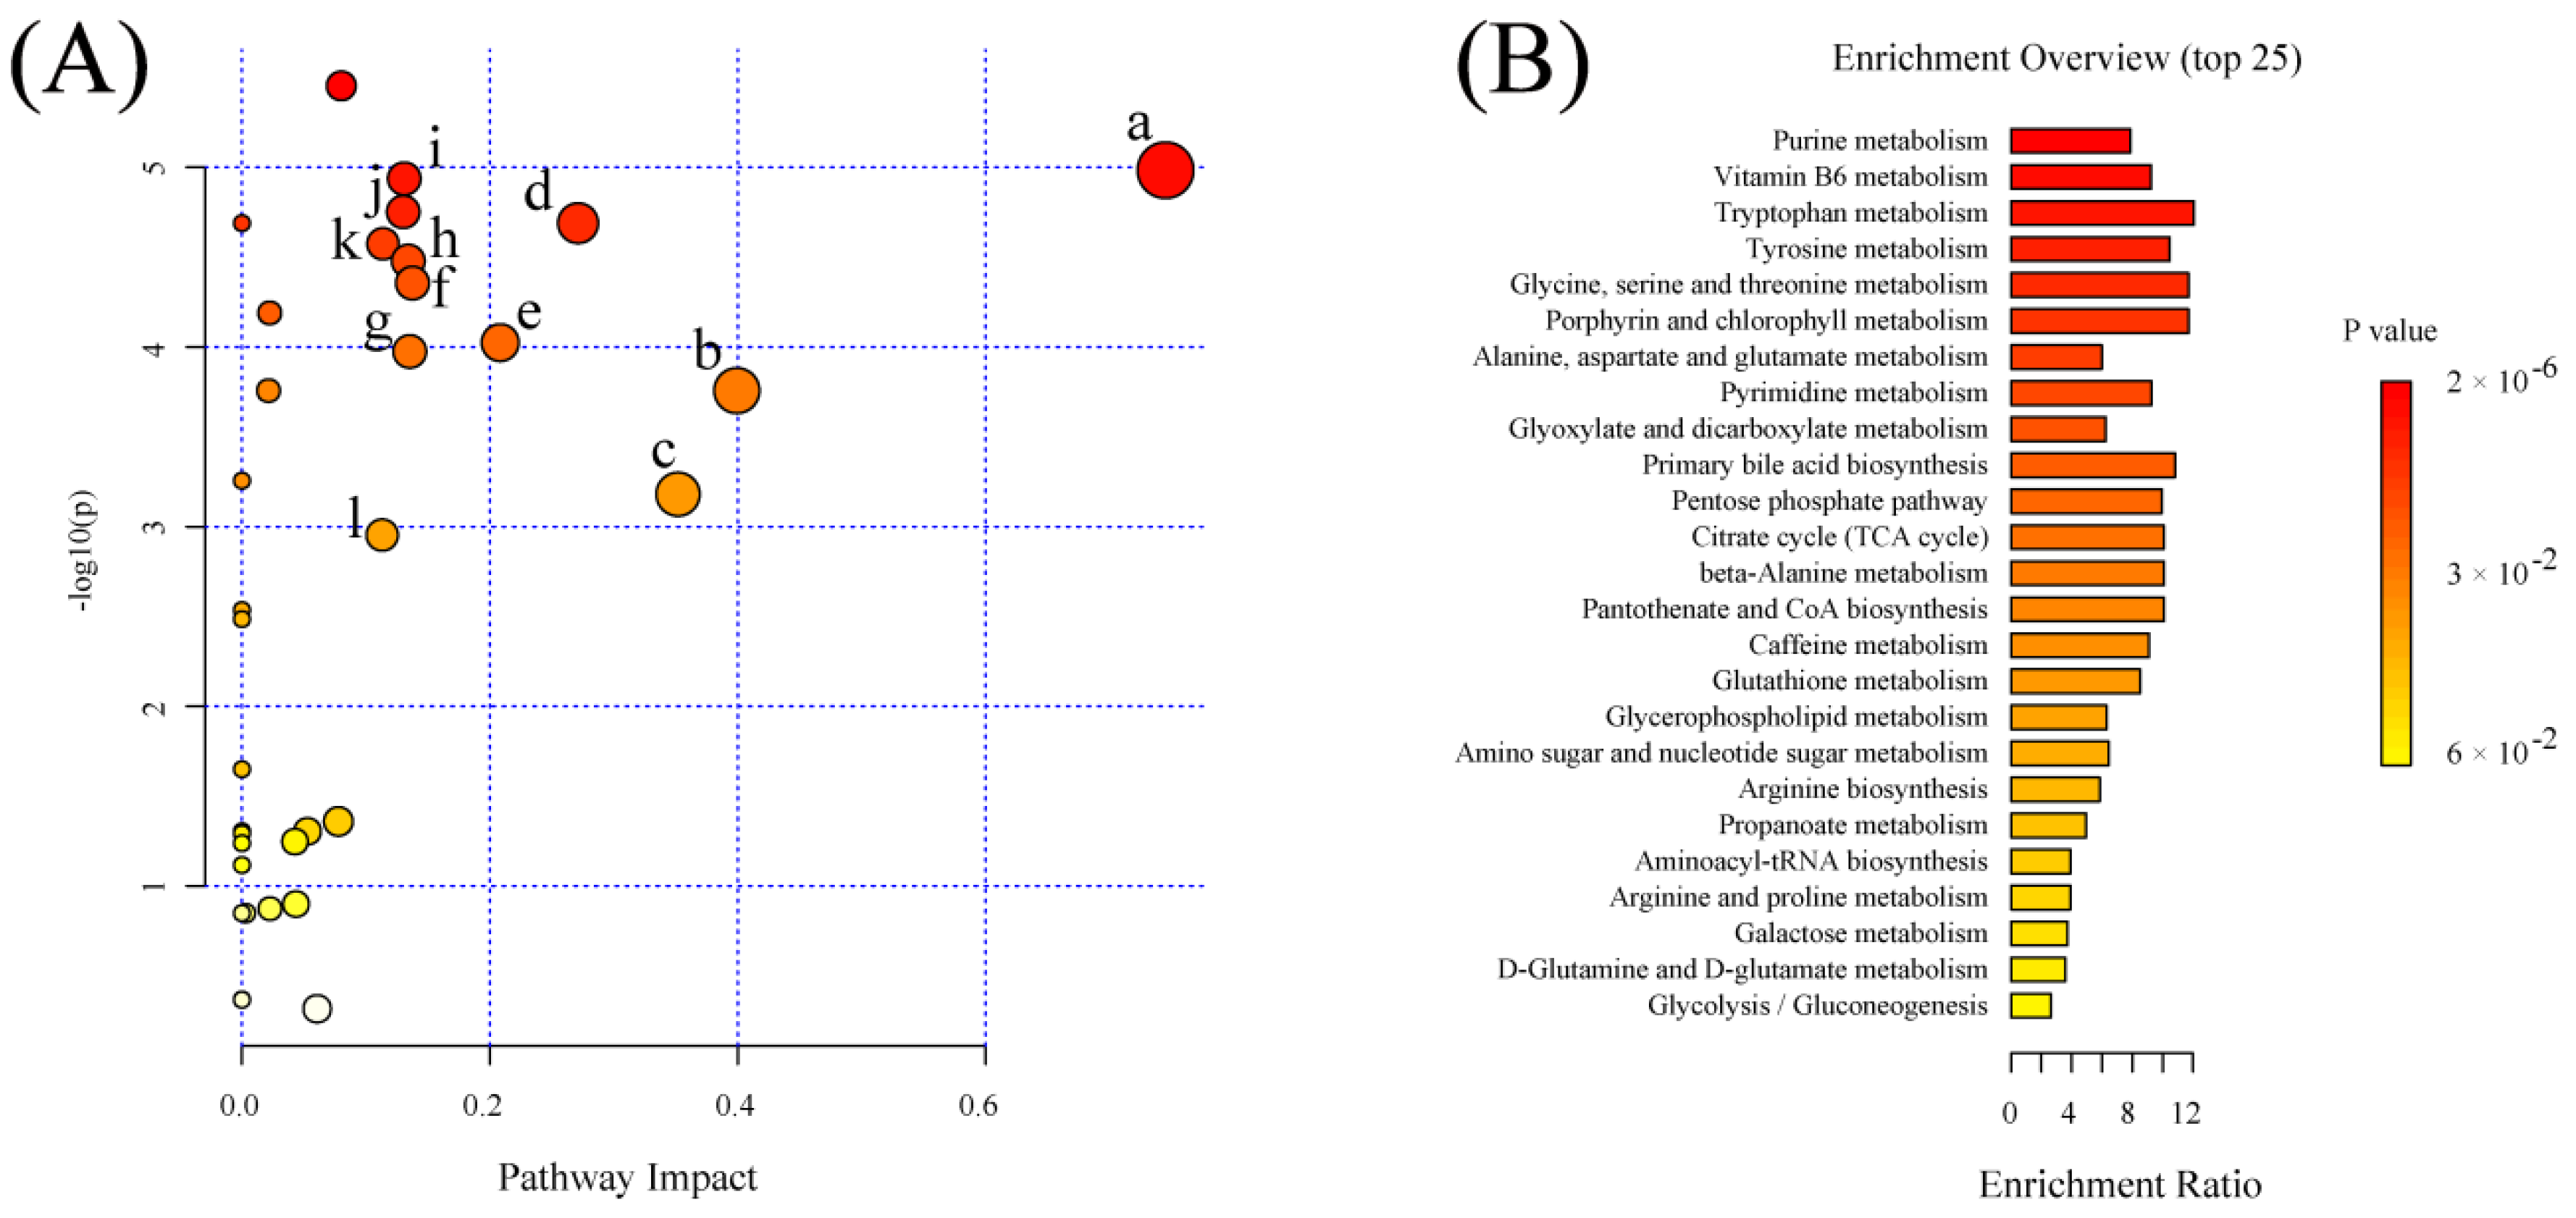
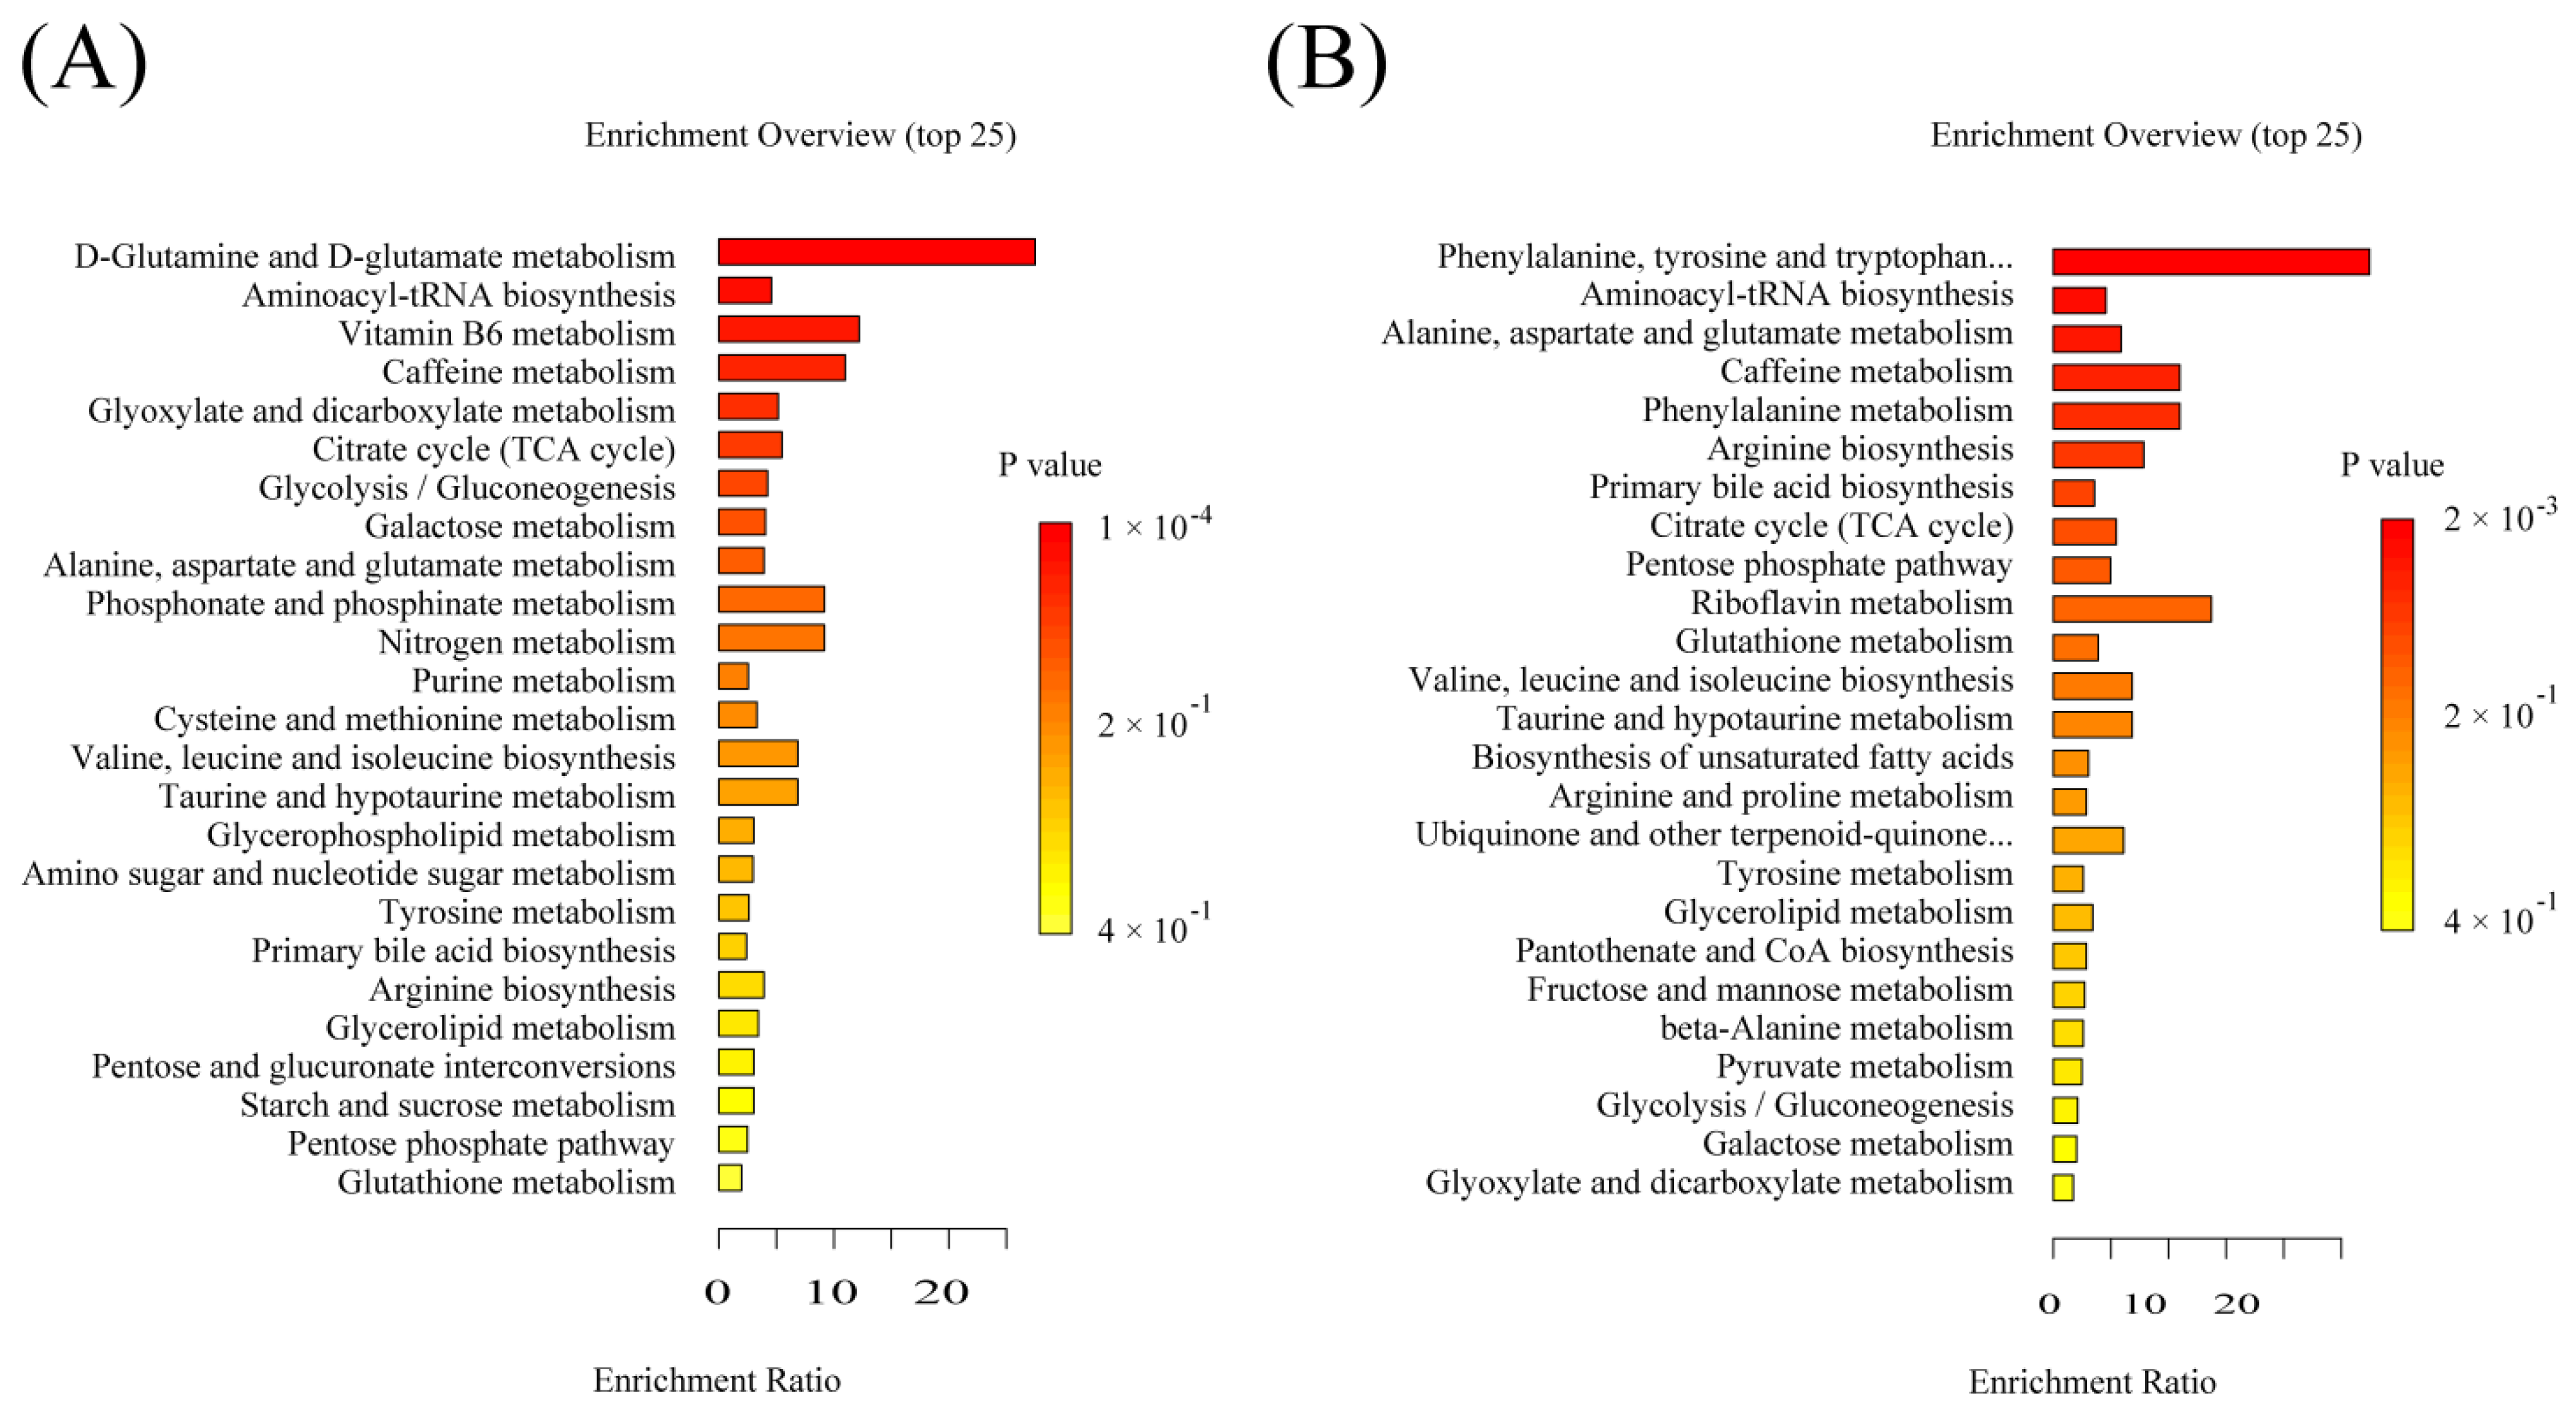
2.6. Significant Pathways Shared by RPM and PPM Treatment Enriched by MSEA
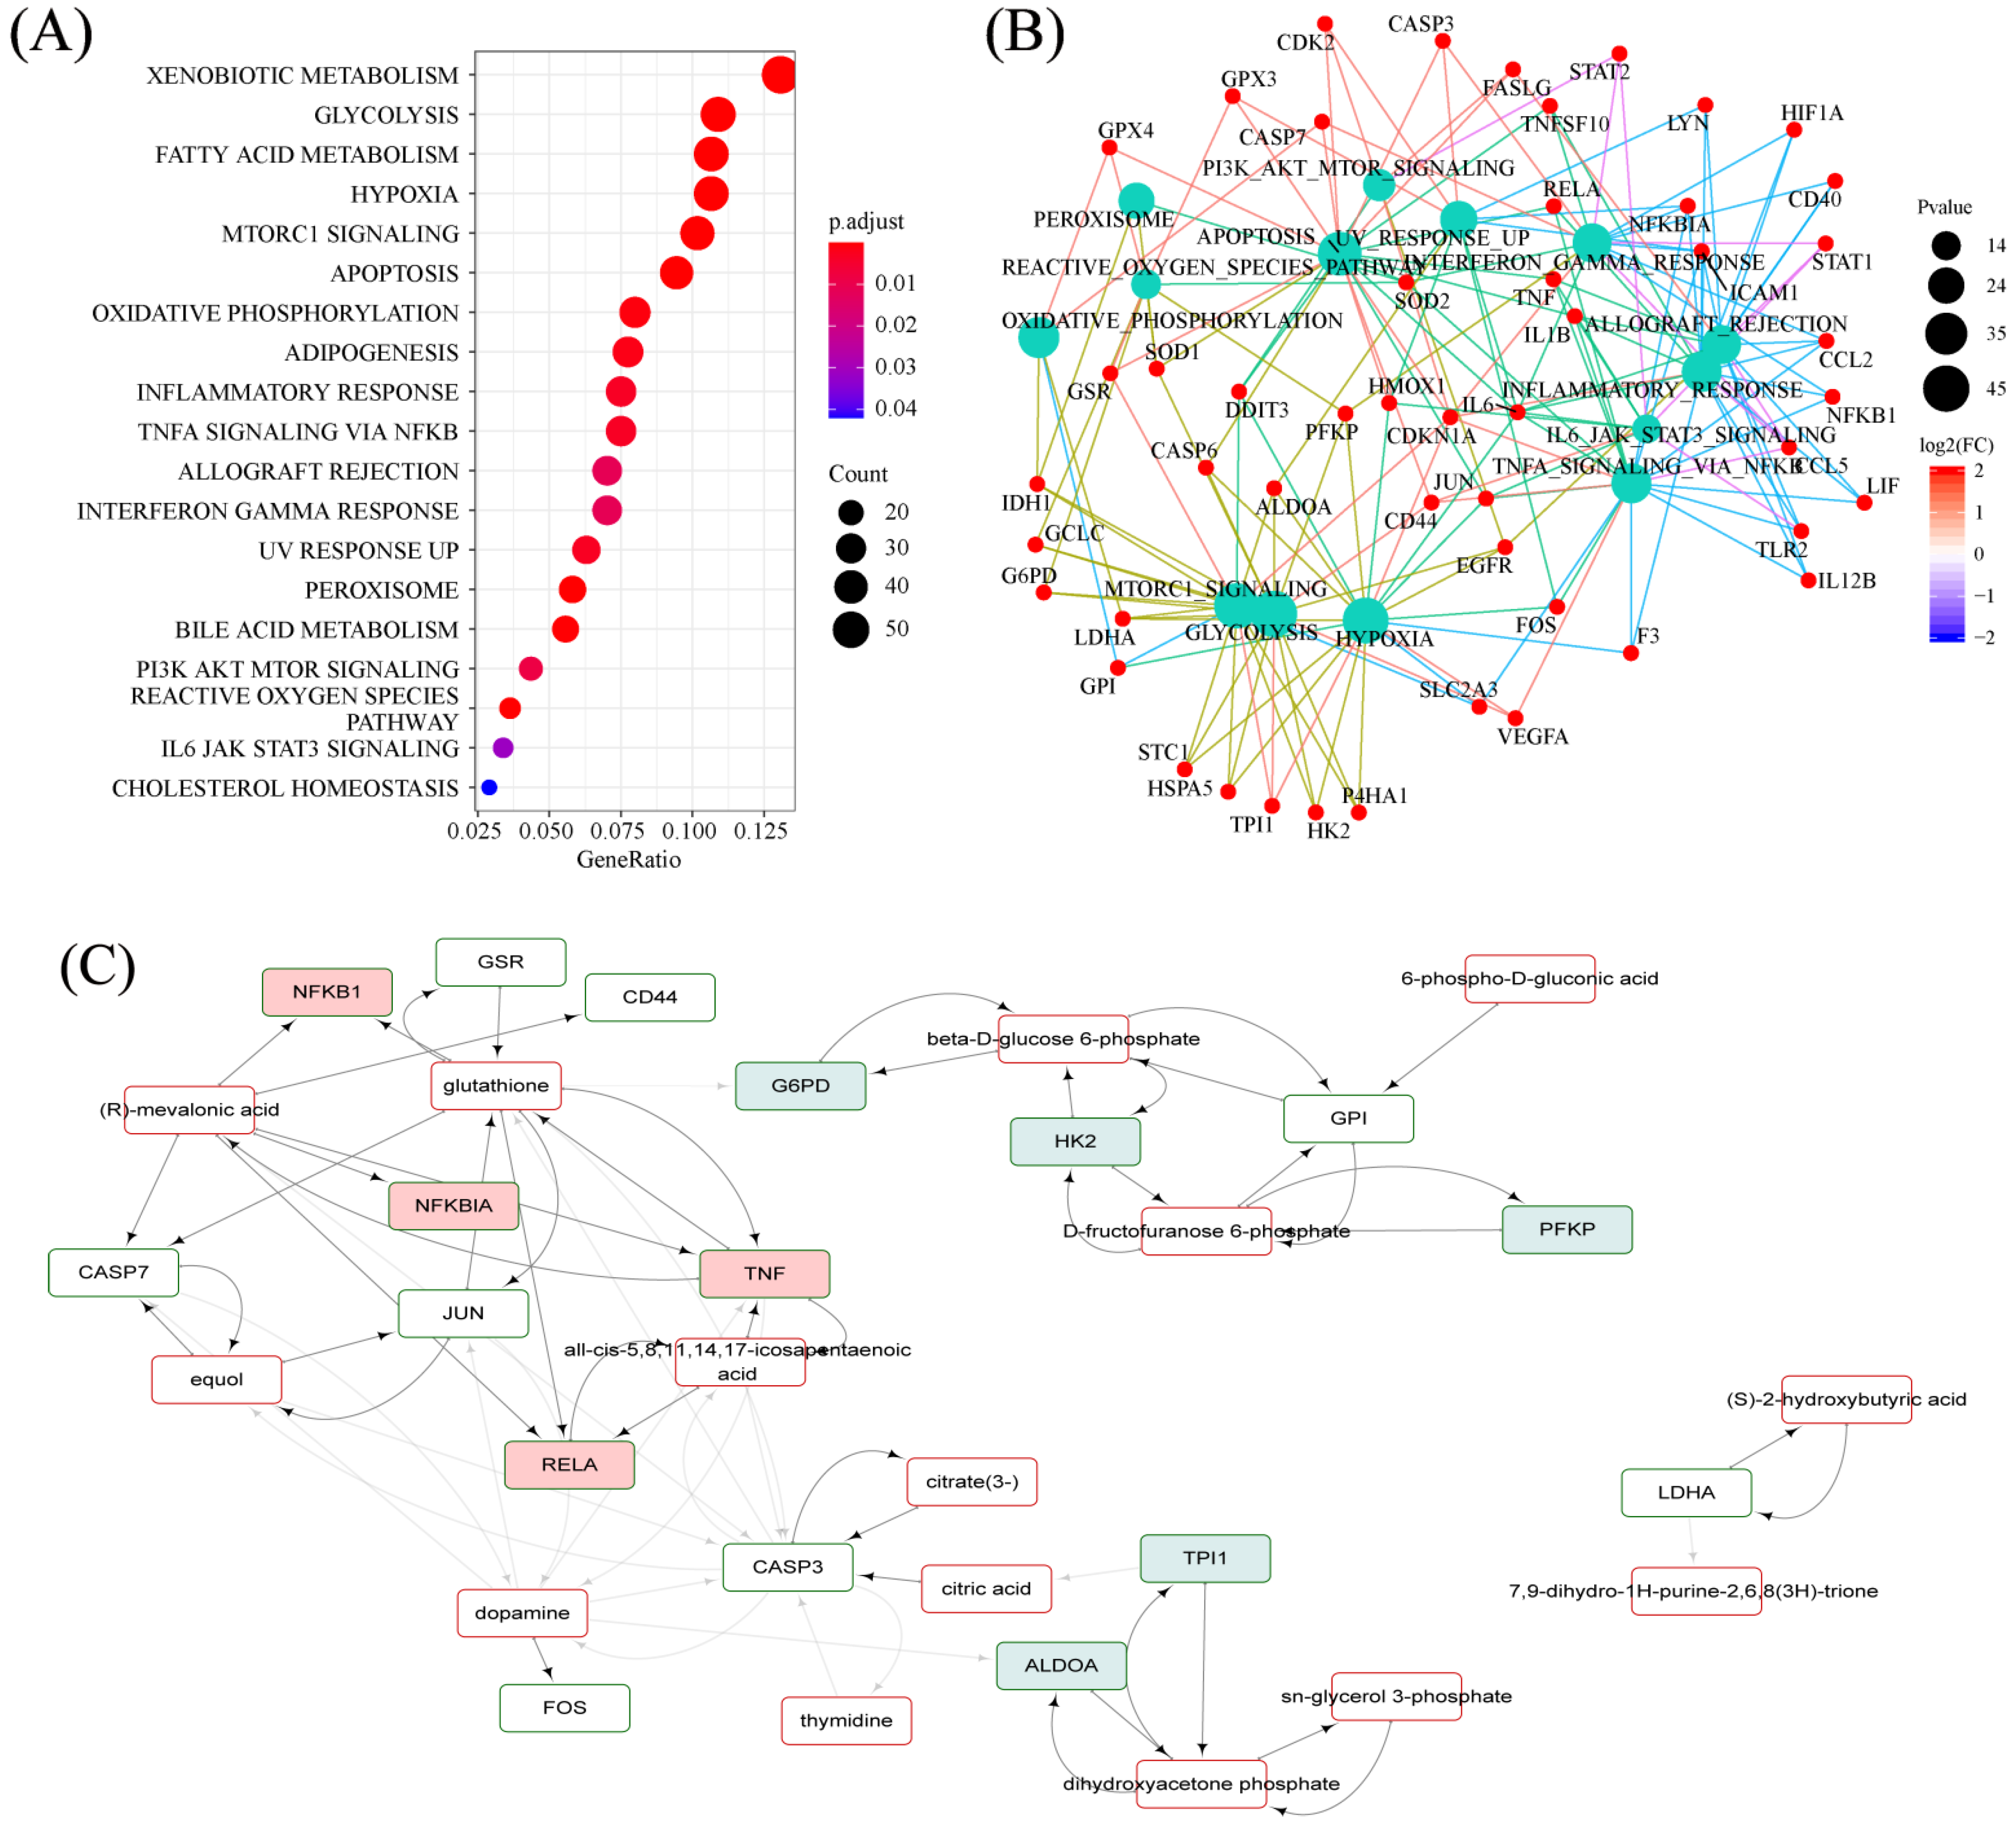
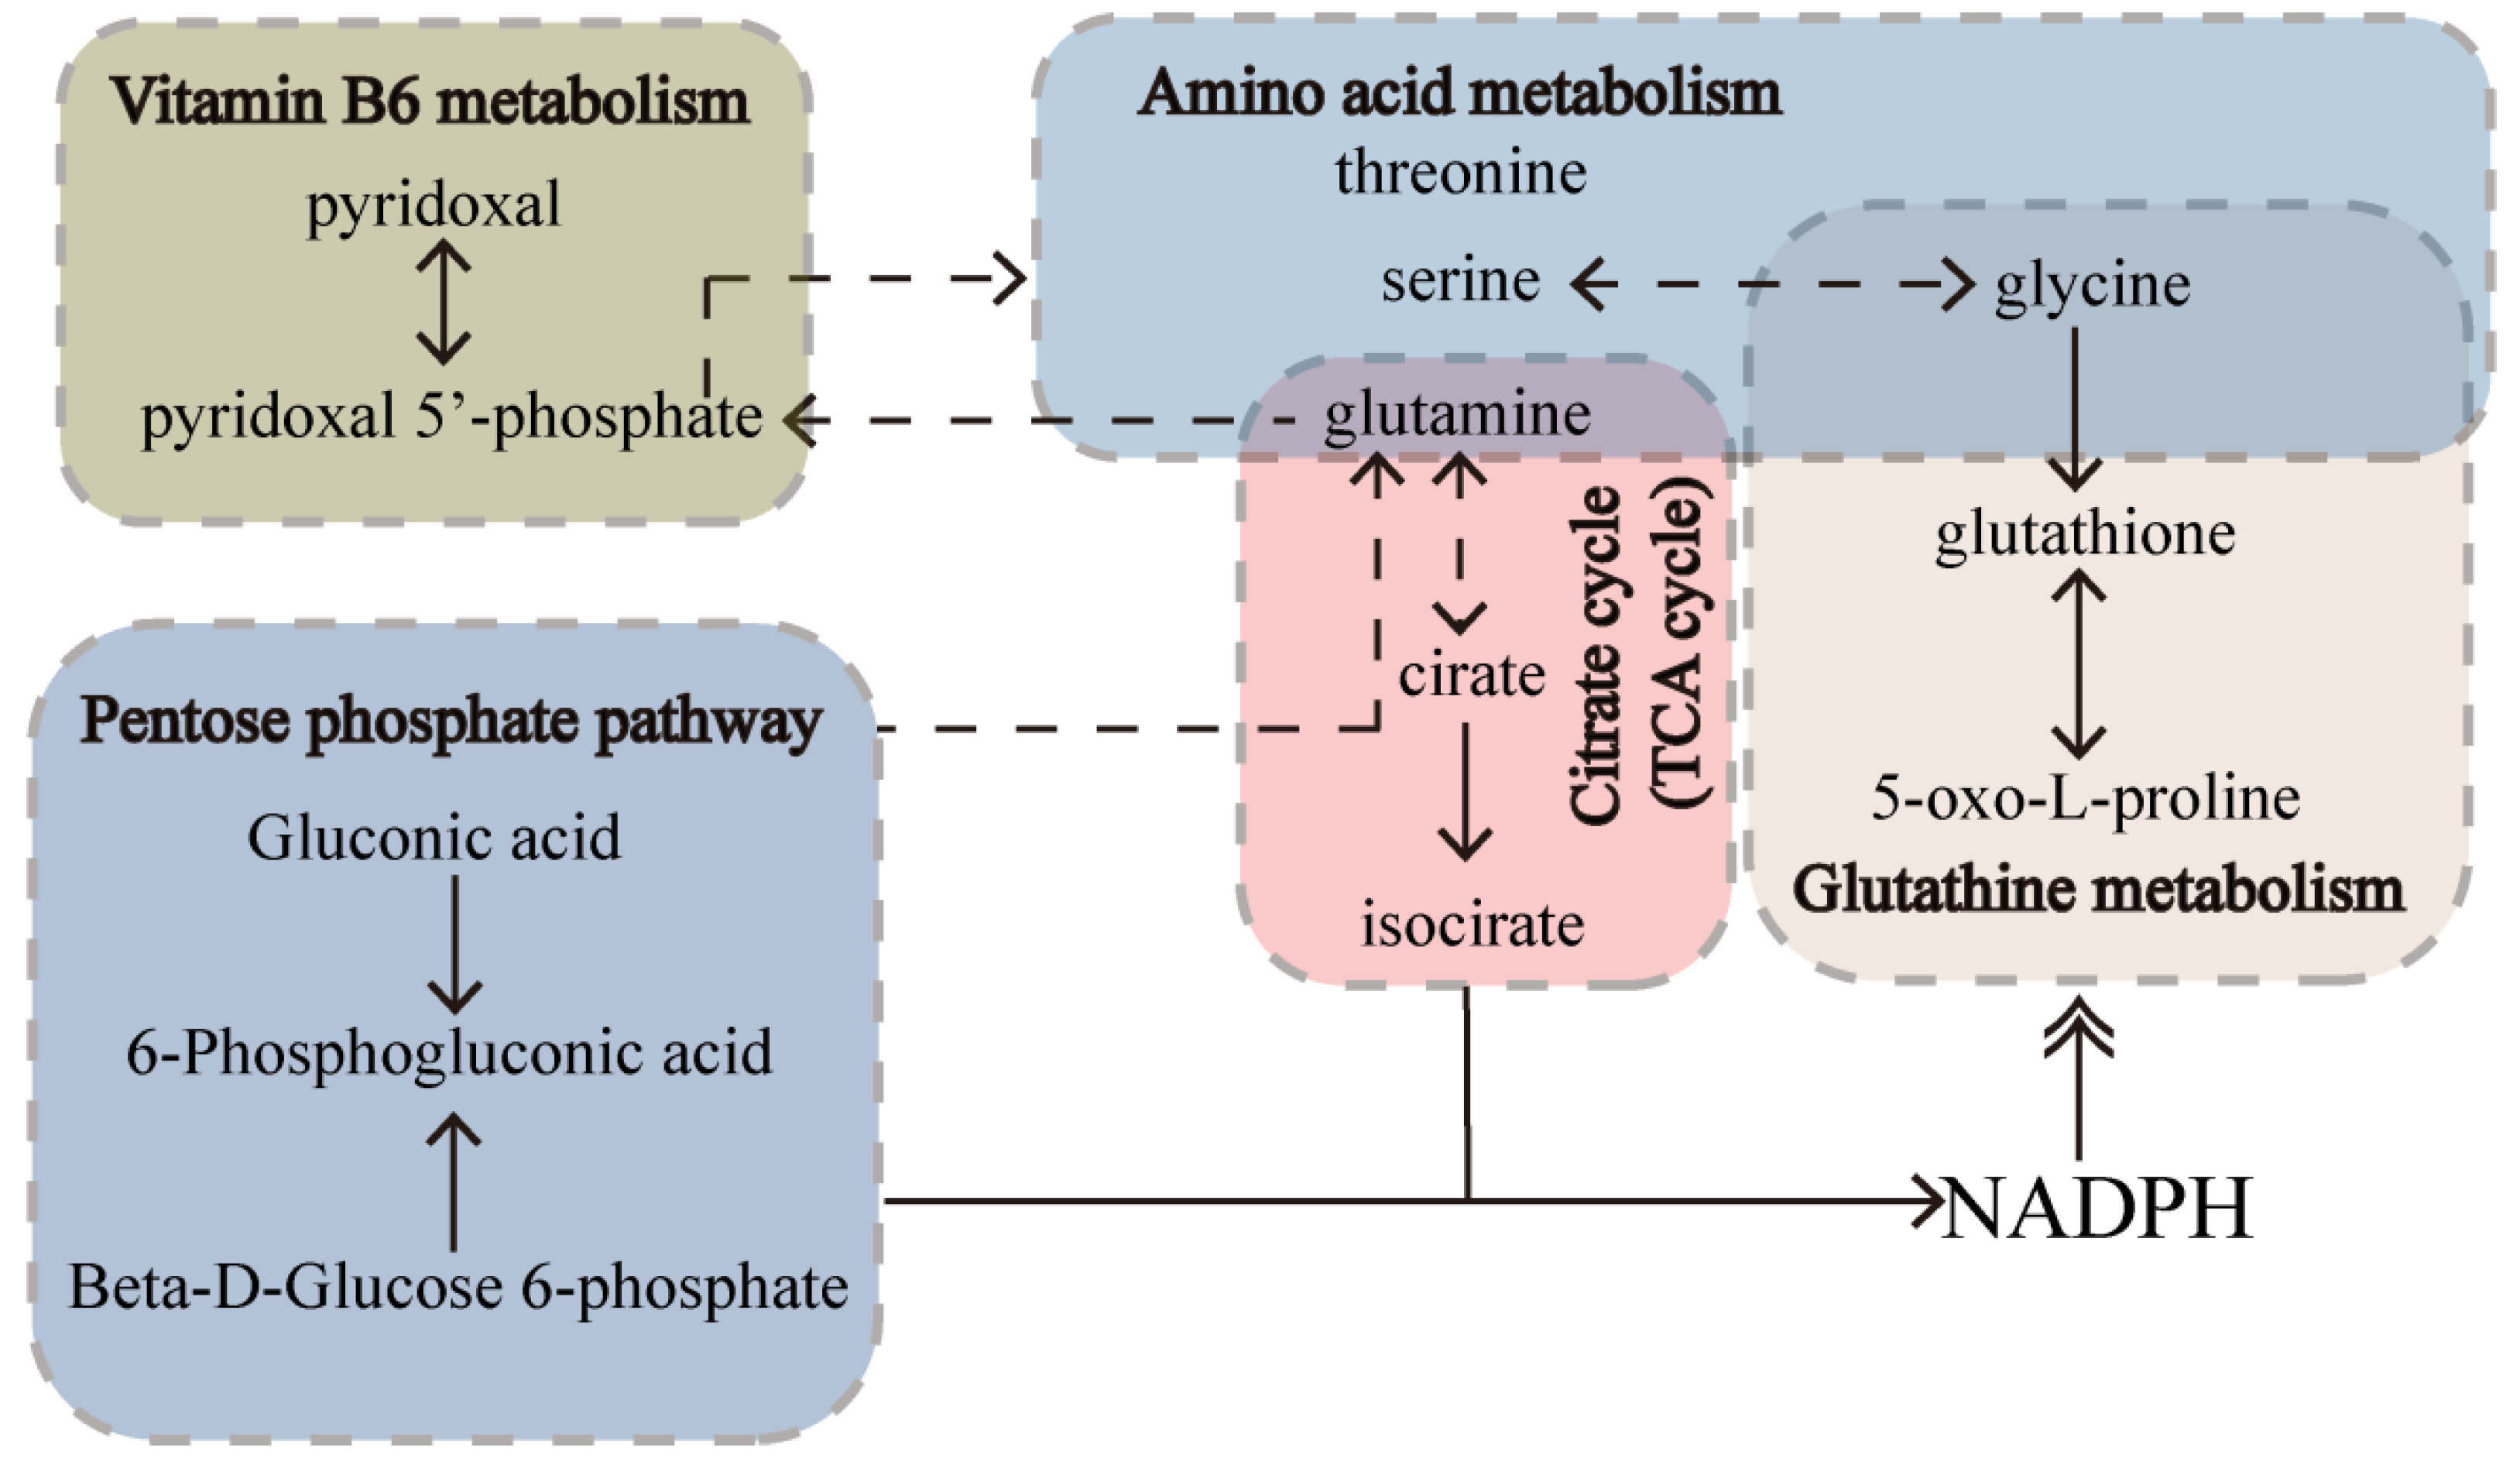
2.7. Hallmarks Implicated in the Efficacy of RPM and PPM on the Treatment of VaD
2.8. Specifically Changed Metabolites and Associated Pathways by RPM and PPM
2.8.1. Determination of RPM and PPM Specific Metabolites
2.8.2. Significant Pathways Specific to RPM and PPM Treatment Enriched by MSEA
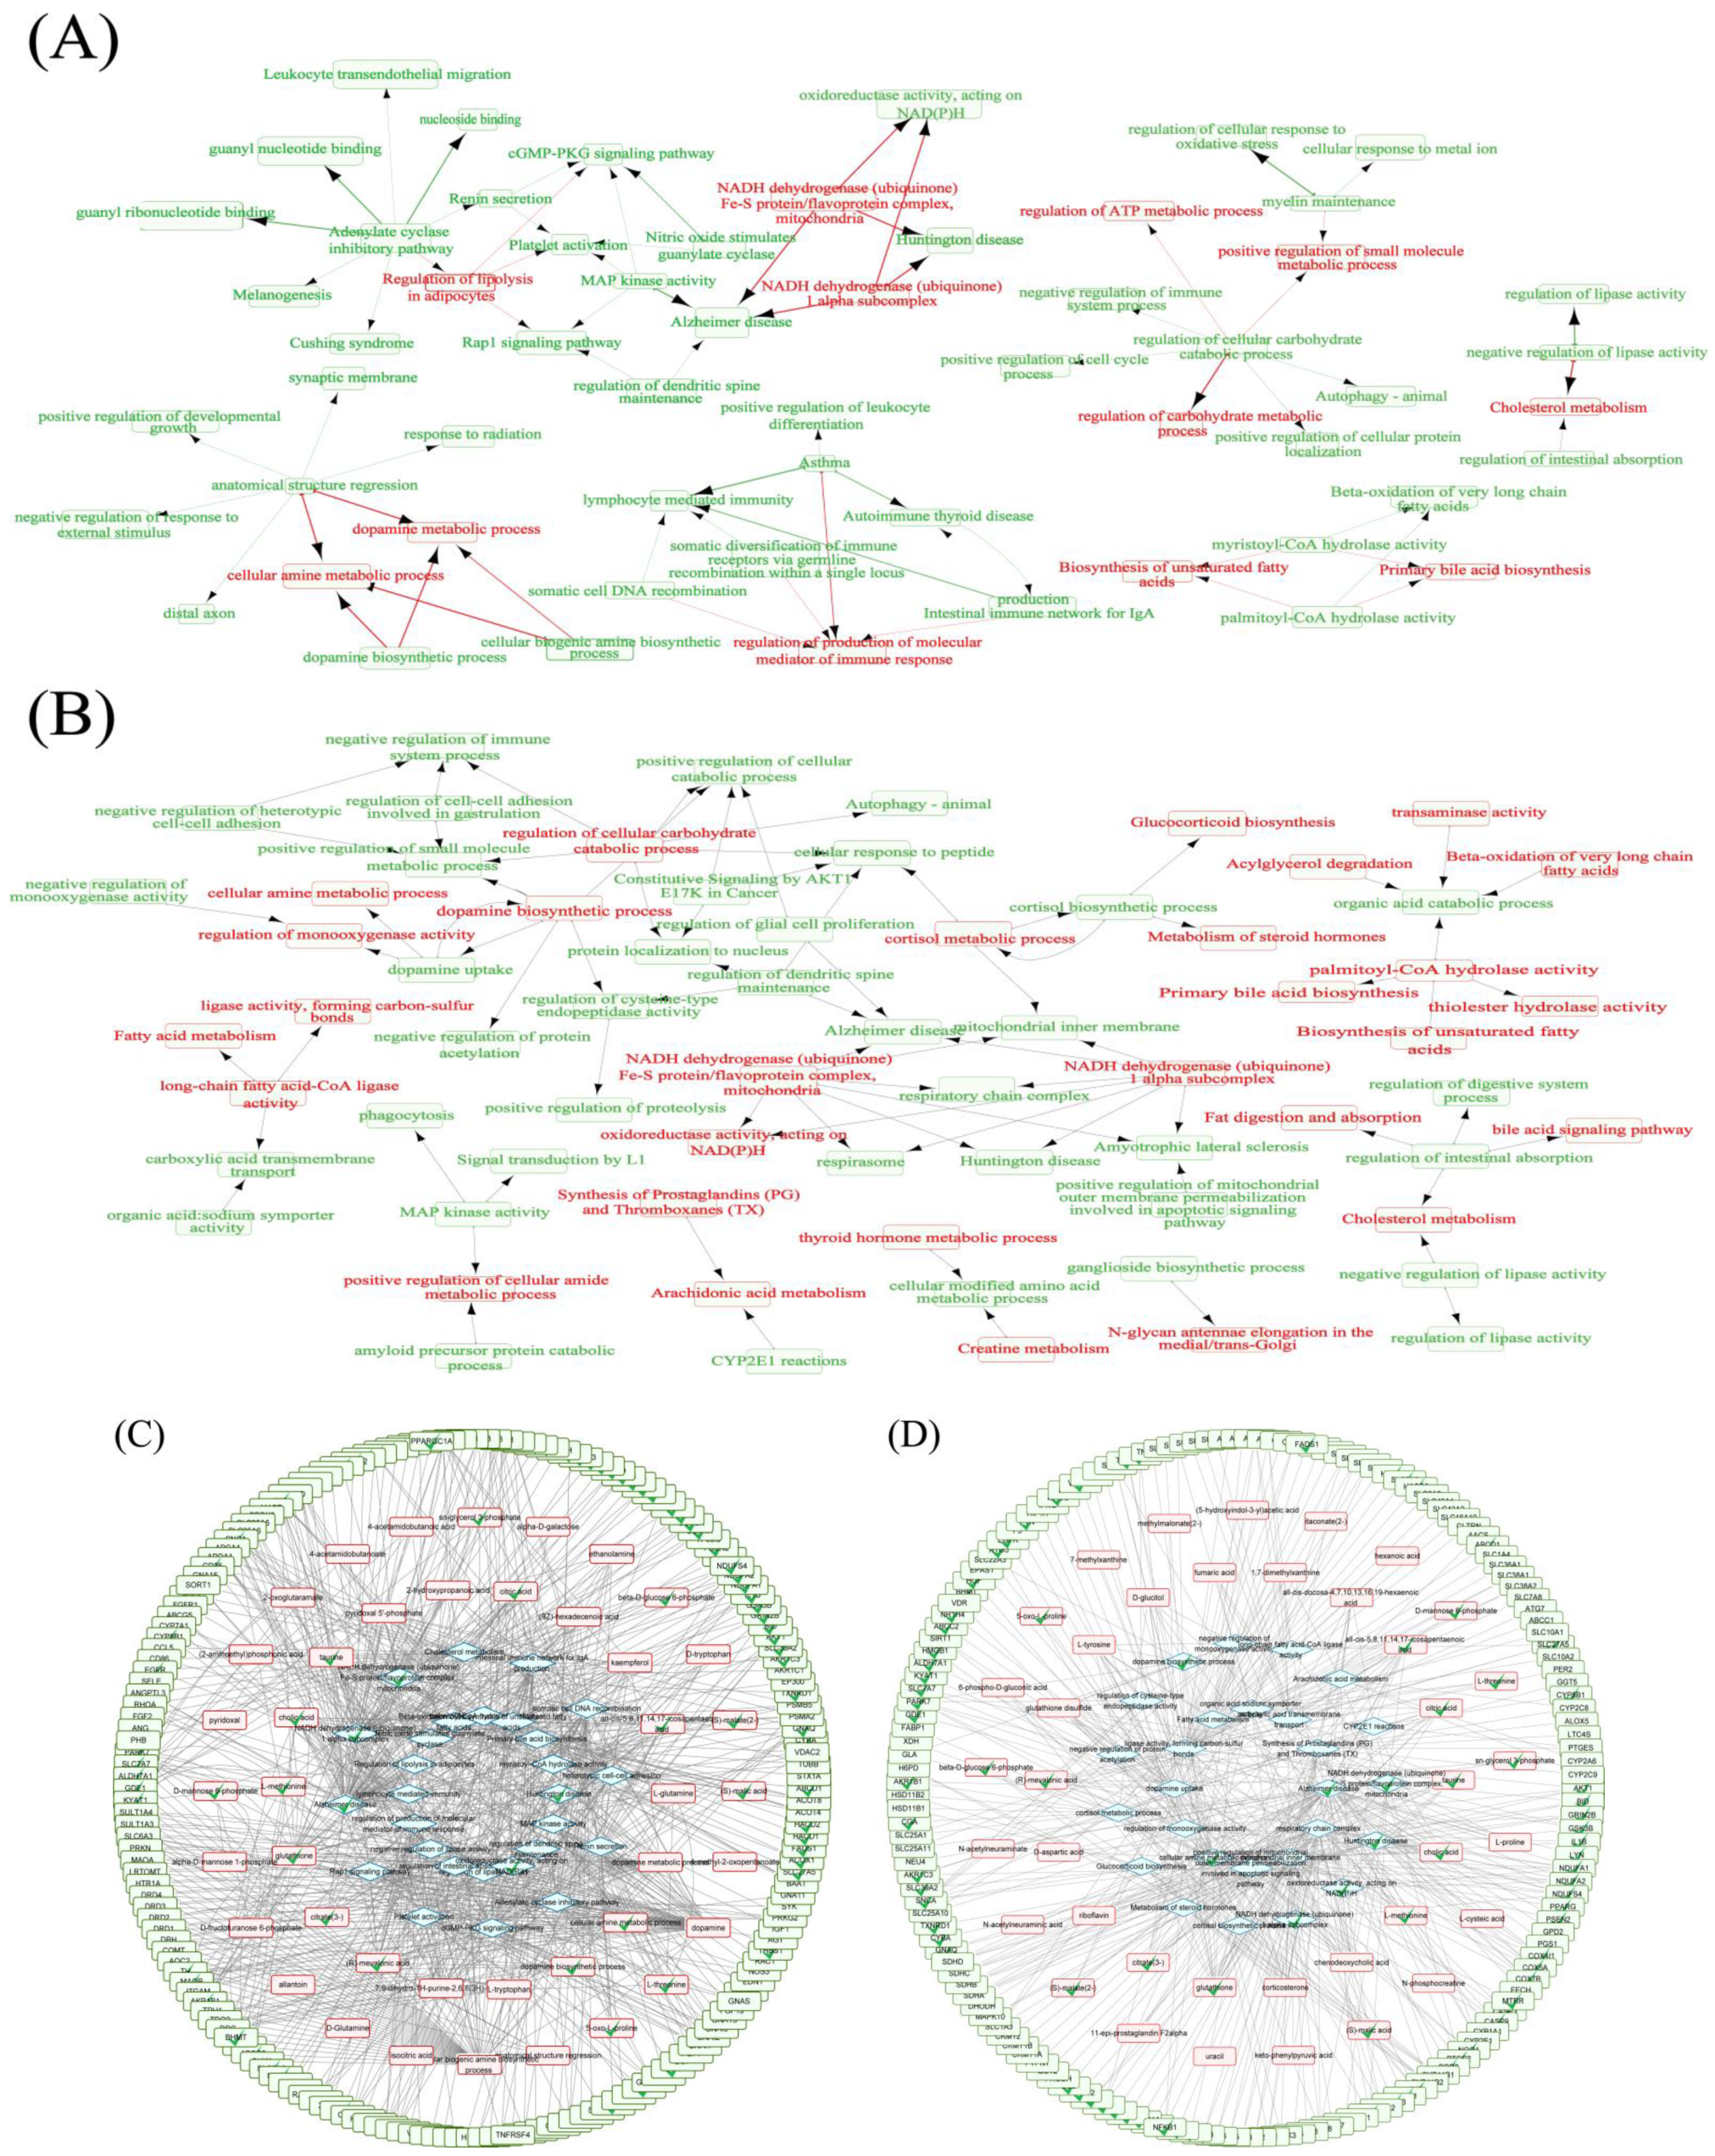
2.8.3. RPM and PPM Specific Mechanism in the Treatment of VaD
3. Discussion
4. Material and Methods
4.1. Drugs and Reagents
4.2. Preparation of PM Extracts
4.3. Animals and Experimental Procedure
4.4. Morris Water Maze Test
4.5. Sample Collection
4.6. Hematoxylin−Eosin and Nissl Staining
4.7. Oxidative Stress Indexes
4.8. Sample Preparation for LC−MS Analysis
4.9. LC−MS Analysis
4.10. Data Processing
4.11. Statistic Analysis
5. Conclusions
Supplementary Materials
Author Contributions
Funding
Institutional Review Board Statement
Informed Consent Statement
Data Availability Statement
Acknowledgments
Conflicts of Interest
Abbreviations
| PM | Radix Polygoni Multiflori |
| RPM | Raw Radix Polygoni Multiflori |
| PPM | Processed Radix Polygoni Multiflori |
| VaD | Vascular dementia |
| AD | Alzheimer’s disease |
| LC−MS | Liquid phase−tandem mass spectrometry |
| HE | Hematoxylin−Eosin |
| PCA | Principal component analysis |
| PLSDA | Partial least squares discriminant analysis |
| VIP | Variable Importance of Projection |
| Hcy | Homocysteine |
| MDA | Malondialdehyde |
| SOD | Superoxide dismutase |
| GSH | Glutathione |
| PPP | Pentose phosphate pathways |
| CV | Coefficients of variation |
| SD | Sprague−Dawley |
| 2−VO | 2−vessel occlusion |
| DG | Dentate gyrus |
| CA | Cornu Ammonis |
| MWM | Morris Water Maze Test |
| BDNF | Brain−derived neurotrophic factor |
| TCM | Traditional Chinese medicine |
| DHAP | Dihydroxyacetone phosphate |
| MSEA | Metabolite set enrichment analysis |
References
- Lauriola, M.; D’Onofrio, G.; Ciccone, F.; Germano, C.; Cascavilla, L.; Paris, F.; Greco, A. Relationship of homocysteine plasma levels with mild cognitive impairment, Alzheimer’s disease, vascular dementia, psychobehavioral, and functional complications. J. Alzheimer s Dis. 2021, 82, 235–248. [Google Scholar] [CrossRef] [PubMed]
- Román, G.C. Facts, myths, and controversies in vascular dementia. J. Neurol. Sci. 2004, 226, 49–52. [Google Scholar] [CrossRef] [PubMed]
- Sinha, K.; Sun, C.; Kamari, R.; Bettermann, K. Current status and future prospects of pathophysiology-based neuroprotective drugs for the treatment of vascular dementia. Drug Discov. Today 2020, 25, 793–799. [Google Scholar] [CrossRef] [PubMed]
- Iadecola, C. The pathobiology of vascular dementia. Neuron 2013, 80, 844–866. [Google Scholar] [CrossRef] [Green Version]
- Xiwu, Z.; Anran, L.; Jinjin, D. Research Progress on Pathogenesis and Treatment of Vascular Dementia Based on lntegrated Traditional Chinese and Western Medicine. Chin. J. Exp. Tradit. 2022, 17, 1–15. [Google Scholar]
- Feixue, W.; Xiaobo, H.; Hui, P.; Hao, L. Inheritance and Development of Pathogenesis Theory of Vascular Dementia in Traditional Chinese Medicine. World Chin. Med. 2022, 17, 221–224+228. [Google Scholar]
- Li, M.H.; Ruan, L.Y.; Chen, C.; Xing, Y.X.; Hong, W.; Du, R.H.; Wang, J.-S. Protective effects of Polygonum multiflorum on ischemic stroke rat model analysed by 1H NMR metabolic profiling. J. Pharm. Biomed. Anal. 2018, 155, 91–103. [Google Scholar] [CrossRef]
- Mingzhan, L.; Binbin, Z.; Guanghui, L.; Lin, Z.; Xiomei, Y.; Yanjie, W. Study on the Action Mechanism of the Treatment Principle of Tonifying Kidney and Promoting Blood Circulation with Vascular Dementia Based on Data Mining and Network Pharmacology. J. Liaoning Univ. TCM 2022, 24, 139–147. [Google Scholar]
- Wang, Y.; Huang, L.-q.; Tang, X.-c.; Zhang, H.-y. Retrospect and prospect of active principles from Chinese herbs in the treatment of dementia. Acta Pharmacol. Sin. 2010, 31, 649–664. [Google Scholar] [CrossRef] [Green Version]
- Tang, J.-F.; Li, W.-X.; Zhang, F.; Li, Y.-H.; Cao, Y.-J.; Zhao, Y.; Li, X.-L.; Ma, Z.-J. Discrimination of Radix Polygoni Multiflori from different geographical areas by UPLC-QTOF/MS combined with chemometrics. Chin. Med. 2017, 12, 1–12. [Google Scholar] [CrossRef] [Green Version]
- National Pharmacopoeia Committee. Pharmacopoeia of the People s Republic of China 2020; China Medical Science Press: Beijing, China, 2020. [Google Scholar]
- Lv, L.S.; Gu, X.H.; Tang, J.; Ho, C.T. Antioxidant activity of stilbene glycoside from Polygonum multiflorum Thunb in vivo. Food Chem. 2007, 104, 1678–1681. [Google Scholar] [CrossRef]
- Lin, H.W.; Sun, M.X.; Wang, Y.H.; Yang, L.M.; Yang, Y.R.; Huang, N.; Xuan, L.J.; Xu, Y.M.; Bai, D.L.; Zheng, Y.T. Anti-HIV activities of the compounds isolated from Polygonum cuspidatum and Polygonum multiflorum. Planta Med. 2010, 76, 889–892. [Google Scholar] [CrossRef] [Green Version]
- Park, S.Y.; Jin, M.L.; Chae, S.Y.; Ko, M.J.; Choi, Y.H.; Park, G.; Choi, Y.-W. Novel compound from Polygonum multiflorum inhibits inflammatory response in LPS-stimulated microglia by upregulating AMPK/Nrf2 pathways. Neurochem. Int. 2016, 100, 21–29. [Google Scholar] [CrossRef]
- Park, H.J.; Zhang, N.; Park, D.K. Topical application of Polygonum multiflorum extract induces hair growth of resting hair follicles through upregulating Shh and β-catenin expression in C57BL/6 mice. J. Ethnopharmacol. 2011, 135, 369–375. [Google Scholar] [CrossRef]
- Li, X.; Matsumoto, K.; Murakami, Y.; Tezuka, Y.; Wu, Y.; Kadota, S. Neuroprotective effects of Polygonum multiflorum on nigrostriatal dopaminergic degeneration induced by paraquat and maneb in mice. Pharmacol. Biochem. Behav. 2005, 82, 345–352. [Google Scholar] [CrossRef]
- Bounda, G.A.; Feng, Y.U. Review of clinical studies of Polygonum multiflorum Thunb. and its isolated bioactive compounds. Pharmacogn. Res. 2015, 7, 225. [Google Scholar]
- Ho, J.W.; Jie, M. Pharmacological activity of cardiovascular agents from herbal medicine. Pharmacol. Biochem. Behav. 2007, 5, 273–277. [Google Scholar] [CrossRef]
- Ho, T.T.; Murthy, H.N.; Dalawai, D.; Bhat, M.A.; Paek, K.Y.; Park, S.Y. Attributes of Polygonum multiflorum to transfigure red biotechnology. Appl. Microbiol. Biotechnol. 2019, 103, 3317–3326. [Google Scholar] [CrossRef]
- Li, Y.; Liang, W.; Guo, C.; Chen, X.; Huang, Y.; Wang, H.; Song, L.; Zhang, D.; Zhan, W.; Lin, Z.J.; et al. Renshen Shouwu extract enhances neurogenesis and angiogenesis via inhibition of TLR4/NF-κB/NLRP3 signaling pathway following ischemic stroke in rats. J. Ethnopharmacol. 2020, 253, 112616. [Google Scholar] [CrossRef] [PubMed]
- Kim, J.H.; He, M.T.; Kim, S.C.; Hwa, K.P.; Cho, K.M.; Cho, E.J. Protective Effect of Processed Polygoni multiflori Radix and Its Major Substance during Scopolamine-Induced Cognitive Dysfunction. Processes 2021, 9, 342. [Google Scholar] [CrossRef]
- Schmidt Kastner, R.; Freund, T. Selective vulnerability of the hippocampus in brain ischemia. Neuroscience 1991, 40, 599–636. [Google Scholar] [CrossRef] [PubMed]
- Wang, P.F.; Zhou, Y.; Fang, H.; Lin, S.; Wang, Y.C.; Liu, Y.; Xia, J.; Eslick, G.D.; Yang, Q.W. Treatment of acute cerebral ischemia using animal models: A meta-analysis. Transl. Neurosci. 2015, 6, 47–58. [Google Scholar] [CrossRef] [PubMed] [Green Version]
- Li, L.; Wang, Y.; Xiu, Y.; Liu, S. Chemical differentiation and quantitative analysis of different types of Panax genus stem-leaf based on a UPLC-Q-exactive orbitrap/MS combined with multivariate statistical analysis approach. J. Anal. Methods Chem. 2018, 2018, 1–16. [Google Scholar] [CrossRef] [PubMed] [Green Version]
- Redish, A.D.; Touretzky, D.S. The role of the hippocampus in solving the Morris water maze. Neural Comput. 1998, 10, 73–111. [Google Scholar] [CrossRef]
- Serra, J.A.; Domínguez, R.O.; Marschoff, E.R.; Guareschi, E.M.; Famulari, A.L.; Boveris, A. Systemic oxidative stress associated with the neurological diseases of aging. Neurochem. Res. 2009, 34, 2122–2132. [Google Scholar] [CrossRef]
- Cervellati, C.; Romani, A.; Seripa, D.; Cremonini, E.; Bosi, C.; Magon, S.; Passaro, A.; Bergamini, C.M.; Pilotto, A.; Zuliani, G. Oxidative balance, homocysteine, and uric acid levels in older patients with Late Onset Alzheimer s Disease or Vascular Dementia. J. Neurol. Sci. 2014, 337, 156–161. [Google Scholar] [CrossRef]
- Choudhari, S.K.; Chaudhary, M.; Gadbail, A.R.; Sharma, A.; Tekade, S. Oxidative and antioxidative mechanisms in oral cancer and precancer: A review. Oral Oncol. 2014, 50, 10–18. [Google Scholar] [CrossRef]
- Niki, E. Biomarkers of lipid peroxidation in clinical material. Biochim. Biophys. Acta 2014, 1840, 809–817. [Google Scholar] [CrossRef]
- Jiang, Y.; Zhu, Z.; Shi, J.; An, Y.; Zhang, K.; Wang, Y.; Li, S.; Jin, L.; Ye, W.; Cui, M.; et al. Metabolomics in the development and progression of dementia: A systematic review. Front. Neurosci. 2019, 13, 343. [Google Scholar] [CrossRef] [Green Version]
- Bonetti, F.; Brombo, G.; Zuliani, G. The role of B group vitamins and choline in cognition and brain aging. In Nutrition and Functional Foods for Healthy Aging; Academic Press: Cambridge, MA, USA, 2017; pp. 139–158. [Google Scholar]
- Magnúsdóttir, S.; Ravcheev, D.; de Crécy Lagard, V.; Thiele, I.J.F.I.G. Systematic genome assessment of B-vitamin biosynthesis suggests co-operation among gut microbes. Front. Genet. 2015, 6, 148. [Google Scholar] [CrossRef] [Green Version]
- Wilson, M.P.; Plecko, B.; Mills, P.B.; Clayton, P. Disorders affecting vitamin B6 metabolism. J. Inherit. Metab. Dis. 2019, 42, 629–646. [Google Scholar] [CrossRef] [PubMed] [Green Version]
- Le Deunff, E. From aspartate to ethylene: Central role of N, C, and S shuttles by aminotransferases during biosynthesis of a major plant growth hormone. In Progress in Botany; Springer: Berlin/Heidelberg, Germany, 2018; pp. 253–293. [Google Scholar]
- Kuehne, A.; Emmert, H.; Soehle, J.; Winnefeld, M.; Fischer, F.; Wenck, H.; Gallinat, S.; Terstegen, L.; Lucius, R.; Hildebrand, J.; et al. Acute activation of oxidative pentose phosphate pathway as first-line response to oxidative stress in human skin cells. Mol. Cell 2015, 59, 359–371. [Google Scholar] [CrossRef] [PubMed] [Green Version]
- Ben Yoseph, O.; Boxer, P.A.; Ross, B.D. Assessment of the role of the glutathione and pentose phosphate pathways in the protection of primary cerebrocortical cultures from oxidative stress. J. Neurochem. 1996, 66, 2329–2337. [Google Scholar] [CrossRef] [PubMed]
- Piazza, I.; Kochanowski, K.; Cappelletti, V.; Fuhrer, T.; Noor, E.; Sauer, U.; Picotti, P.J.C. A map of protein-metabolite interactions reveals principles of chemical communication. Cell 2018, 172, 358–372.e23. [Google Scholar] [CrossRef] [PubMed]
- Zhang, S.; Lachance, B.B.; Mattson, M.P.; Jia, X. Glucose metabolic crosstalk and regulation in brain function and diseases. Prog. Neurobiol. 2021, 204, 102089. [Google Scholar] [CrossRef]
- Lee, E.C.; Hong, D.-Y.; Lee, D.-H.; Park, S.-W.; Lee, J.Y.; Jeong, J.H.; Kim, E.-Y.; Chung, H.-M.; Hong, K.-S.; Park, S.-P.; et al. Inflammation and Rho-Associated Protein Kinase-Induced Brain Changes in Vascular Dementia. Biomedicines 2022, 10, 446. [Google Scholar] [CrossRef]
- Aoyama, K. Glutathione in the Brain. Int. J. Mol. Sci. 2021, 22, 5010. [Google Scholar] [CrossRef]
- Friso, S.; Jacques, P.F.; Wilson, P.W.; Rosenberg, I.H.; Selhub, J.J.C. Low circulating vitamin B6 is associated with elevation of the inflammation marker C-reactive protein independently of plasma homocysteine levels. Circulation 2001, 103, 2788–2791. [Google Scholar] [CrossRef] [Green Version]
- Zhang, P.; Tsuchiya, K.; Kinoshita, T.; Kushiyama, H.; Suidasari, S.; Hatakeyama, M.; Imura, H.; Kato, N.; Suda, T. Vitamin B6 prevents IL-1β protein production by inhibiting NLRP3 inflammasome activation. J. Biol. Chem. 2016, 291, 24517–24527. [Google Scholar] [CrossRef] [Green Version]
- Dong, Y.; Li, X.; Liu, Y.; Gao, J.; Tao, J. The molecular targets of taurine confer anti-hyperlipidemic effects. Life Sci. 2021, 278, 119579. [Google Scholar] [CrossRef]
- Schaffer, S.; Kim, H.W. Effects and mechanisms of taurine as a therapeutic agent. Biomol. Ther. 2018, 26, 225. [Google Scholar] [CrossRef]
- Rehman, T.; Shabbir, M.A.; Inam Ur Raheem, M.; Manzoor, M.F.; Ahmad, N.; Liu, Z.W.; Ahmad, M.H.; Siddeeg, A.; Abid, M.; Aadil, R.M.; et al. Cysteine and homocysteine as biomarker of various diseases. Food Sci. Nutr. 2020, 8, 4696–4707. [Google Scholar] [CrossRef] [PubMed]
- Komorniak, N.; Szczuko, M.; Kowalewski, B.; Stachowska, E. Nutritional deficiencies, bariatric surgery, and serum homocysteine level: Review of current literature. Obes. Surg. 2019, 29, 3735–3742. [Google Scholar] [CrossRef] [PubMed] [Green Version]
- Stanger, O.; Fowler, B.; Piertzik, K.; Huemer, M.; Haschke-Becher, E.; Semmler, A.; Lorenzl, S.; Linnebank, M. Homocysteine, folate and vitamin B12 in neuropsychiatric diseases: Review and treatment recommendations. Expert Rev. Neurother. 2009, 9, 1393–1412. [Google Scholar] [CrossRef] [PubMed]
- Udhayabanu, T.; Manole, A.; Rajeshwari, M.; Varalakshmi, P.; Houlden, H.; Ashokkumar, B. Riboflavin responsive mitochondrial dysfunction in neurodegenerative diseases. J. Clin. Med. 2017, 6, 52. [Google Scholar] [CrossRef] [Green Version]
- Bang, J.; Jeon, W.K.; Lee, I.S.; Han, J.-S.; Kim, B.-Y. Biphasic functional regulation in hippocampus of rat with chronic cerebral hypoperfusion induced by permanent occlusion of bilateral common carotid artery. PLoS ONE 2013, 8, e70093. [Google Scholar] [CrossRef] [PubMed]
- Du, S.Q.; Wang, X.R.; Zhu, W.; Ye, Y.; Yang, J.W.; Ma, S.M.; Ji, C.S.; Liu, C.Z. Acupuncture inhibits TXNIP-associated oxidative stress and inflammation to attenuate cognitive impairment in vascular dementia rats. CNS Neurosci. Ther. 2018, 24, 39–46. [Google Scholar] [CrossRef]


| Group | Path Length (m) | Time Spent in the Target Quadrant (%) | ||||
|---|---|---|---|---|---|---|
| Day 1 | Day 2 | Day 3 | Day 4 | Day 5 | ||
| S | 15.99 ± 2.26 | 15.13 ± 2.66 | 3.32 ± 0.87 | 3.05 ± 0.69 | 7.33 ± 2.32 | 39.37 ± 3.01 |
| M | 31.77 ± 3.13 ** | 26.49 ± 4.01 * | 15.82 ± 4.79 * | 6.02 ± 1.28 | 5.37 ± 1.15 | 23.43 ± 0.56 *** |
| RPM | 16.32 ± 2.55 | 17.15 ± 4.89 | 9.33 ± 2.47 | 10.45 ± 2.09 | 5.15 ± 1.38 | 31.70 ± 3.85 |
| PPM | 16.81 ± 3.38 | 13.64 ± 2.51 | 7.00 ± 1.99 | 9.26 ± 2.47 | 6.75 ± 1.68 | 26.92 ± 2.03 |
| Group | Escape Latency (Second) | Average Velocity (cm/s) | Cross Platform Times | ||||
|---|---|---|---|---|---|---|---|
| Day 1 | Day 2 | Day 3 | Day 4 | Day 5 | |||
| S | 61.31 ± 6.16 | 52.82 ± 12.03 | 18.62 ± 5.19 | 13.00 ± 2.60 | 18.06 ± 5.39 | 26.72 ± 1.44 | 121.2 ± 10.76 |
| M | 104.8 ± 6.78 ** | 98.00 ± 9.54 * | 66.55 ± 15.83 *** | 24.05 ± 0.69 | 25.05 ± 3.16 | 29.35 ± 1.66 | 28.33 ± 2.29 *** |
| RPM | 72.99 ± 11.99 | 74.21 ± 15.43 | 30.53 ± 8.08 | 35.47 ± 4.53 | 17.83 ± 3.28 | 28.26 ± 0.86 | 126.5 ± 17.09 ### |
| PPM | 70.41 ± 12.21 | 66.41 ± 11.02 | 21.57 ± 4.33 | 30.19 ± 7.53 | 23.49 ± 5.30 | 29.23 ± 1.14 | 81.17 ± 5.54 ### |
| Pathway Name | Matched Metabolites | Raw p (×10−3) | −log10(p) | FDR (×10−3) | Impact |
|---|---|---|---|---|---|
| Vitamin B6 metabolism | 2/9 | 0.010 | 4.984 | 0.116 | 0.745 |
| beta−Alanine metabolism | 2/21 | 0.175 | 3.757 | 0.425 | 0.399 |
| Glutathione metabolism | 3/28 | 0.660 | 3.180 | 1.403 | 0.351 |
| Glycine, serine and threonine metabolism | 1/34 | 0.020 | 4.689 | 0.116 | 0.271 |
| Pentose phosphate pathway | 3/21 | 0.095 | 4.024 | 0.292 | 0.208 |
| Glyoxylate and dicarboxylate metabolism | 5/32 | 0.044 | 4.356 | 0.166 | 0.138 |
| Citrate cycle (TCA cycle) | 2/20 | 0.106 | 3.975 | 0.300 | 0.135 |
| Pyrimidine metabolism | 4/39 | 0.033 | 4.479 | 0.141 | 0.134 |
| Tryptophan metabolism | 1/41 | 0.012 | 4.937 | 0.116 | 0.131 |
| Tyrosine metabolism | 2/42 | 0.018 | 4.752 | 0.116 | 0.130 |
| Alanine, aspartate and glutamate metabolism | 4/28 | 0.027 | 4.575 | 0.129 | 0.114 |
| Glycerophospholipid metabolism | 3/36 | 1.114 | 2.953 | 2.229 | 0.113 |
Publisher’s Note: MDPI stays neutral with regard to jurisdictional claims in published maps and institutional affiliations. |
© 2022 by the authors. Licensee MDPI, Basel, Switzerland. This article is an open access article distributed under the terms and conditions of the Creative Commons Attribution (CC BY) license (https://creativecommons.org/licenses/by/4.0/).
Share and Cite
Wu, F.; Li, Y.; Liu, W.; Xiao, R.; Yao, B.; Gao, M.; Xu, D.; Wang, J. Comparative Investigation of Raw and Processed Radix Polygoni Multiflori on the Treatment of Vascular Dementia by Liquid Chromatograph−Mass Spectrometry Based Metabolomic Approach. Metabolites 2022, 12, 1297. https://doi.org/10.3390/metabo12121297
Wu F, Li Y, Liu W, Xiao R, Yao B, Gao M, Xu D, Wang J. Comparative Investigation of Raw and Processed Radix Polygoni Multiflori on the Treatment of Vascular Dementia by Liquid Chromatograph−Mass Spectrometry Based Metabolomic Approach. Metabolites. 2022; 12(12):1297. https://doi.org/10.3390/metabo12121297
Chicago/Turabian StyleWu, Fengye, Yunlin Li, Wenya Liu, Ran Xiao, Benxing Yao, Mingzhe Gao, Di Xu, and Junsong Wang. 2022. "Comparative Investigation of Raw and Processed Radix Polygoni Multiflori on the Treatment of Vascular Dementia by Liquid Chromatograph−Mass Spectrometry Based Metabolomic Approach" Metabolites 12, no. 12: 1297. https://doi.org/10.3390/metabo12121297