

Identification of a Chromosome 1 Substitution Line B6-Chr1BLD as a Novel Hyperlipidemia Model via Phenotyping Screening
 and
and 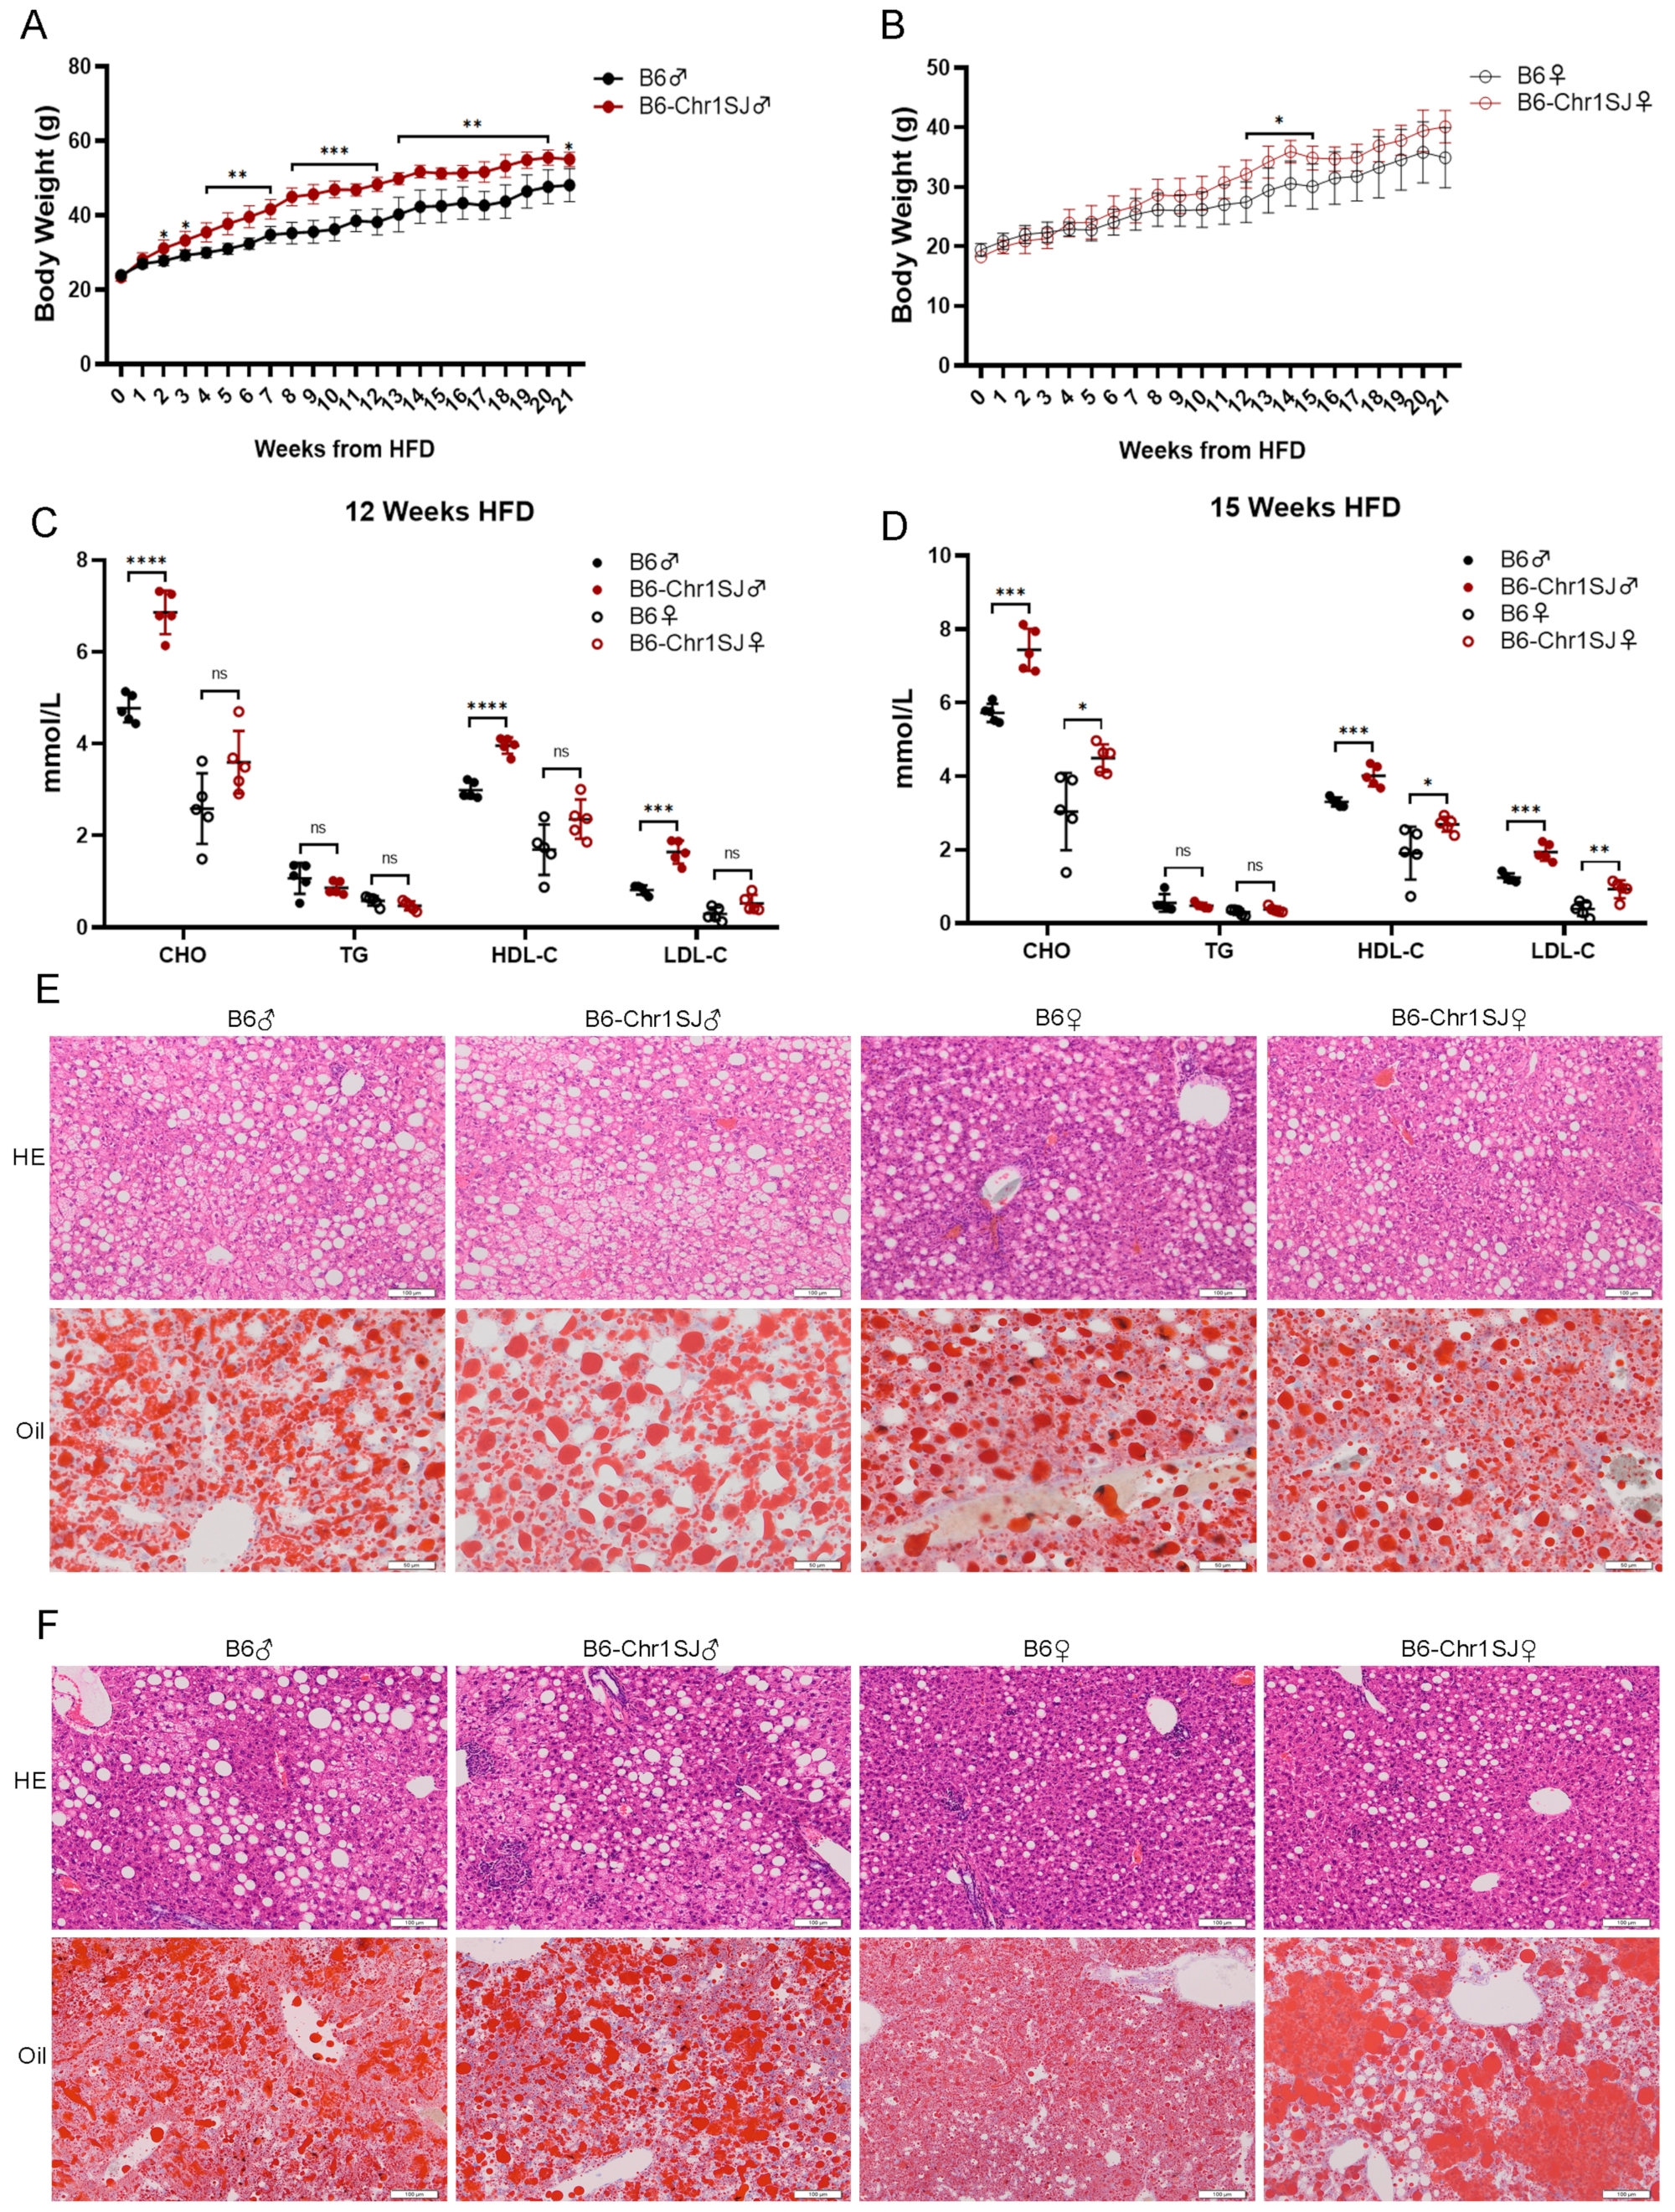
Abstract
:1. Introduction
2. Materials and Methods
2.1. Animal Studies
2.2. Experimental Design
2.3. Serum Analysis
2.4. H&E Staining
2.5. Oil Red O Staining
2.6. Transcriptomics Analysis
2.7. SNP Analysis
2.8. Statistics
3. Results
3.1. HFD-fed B6-Chr1SJ Line Showed Significant Abnormalities in Body Weight, Lipid Metabolism and Liver Lesions
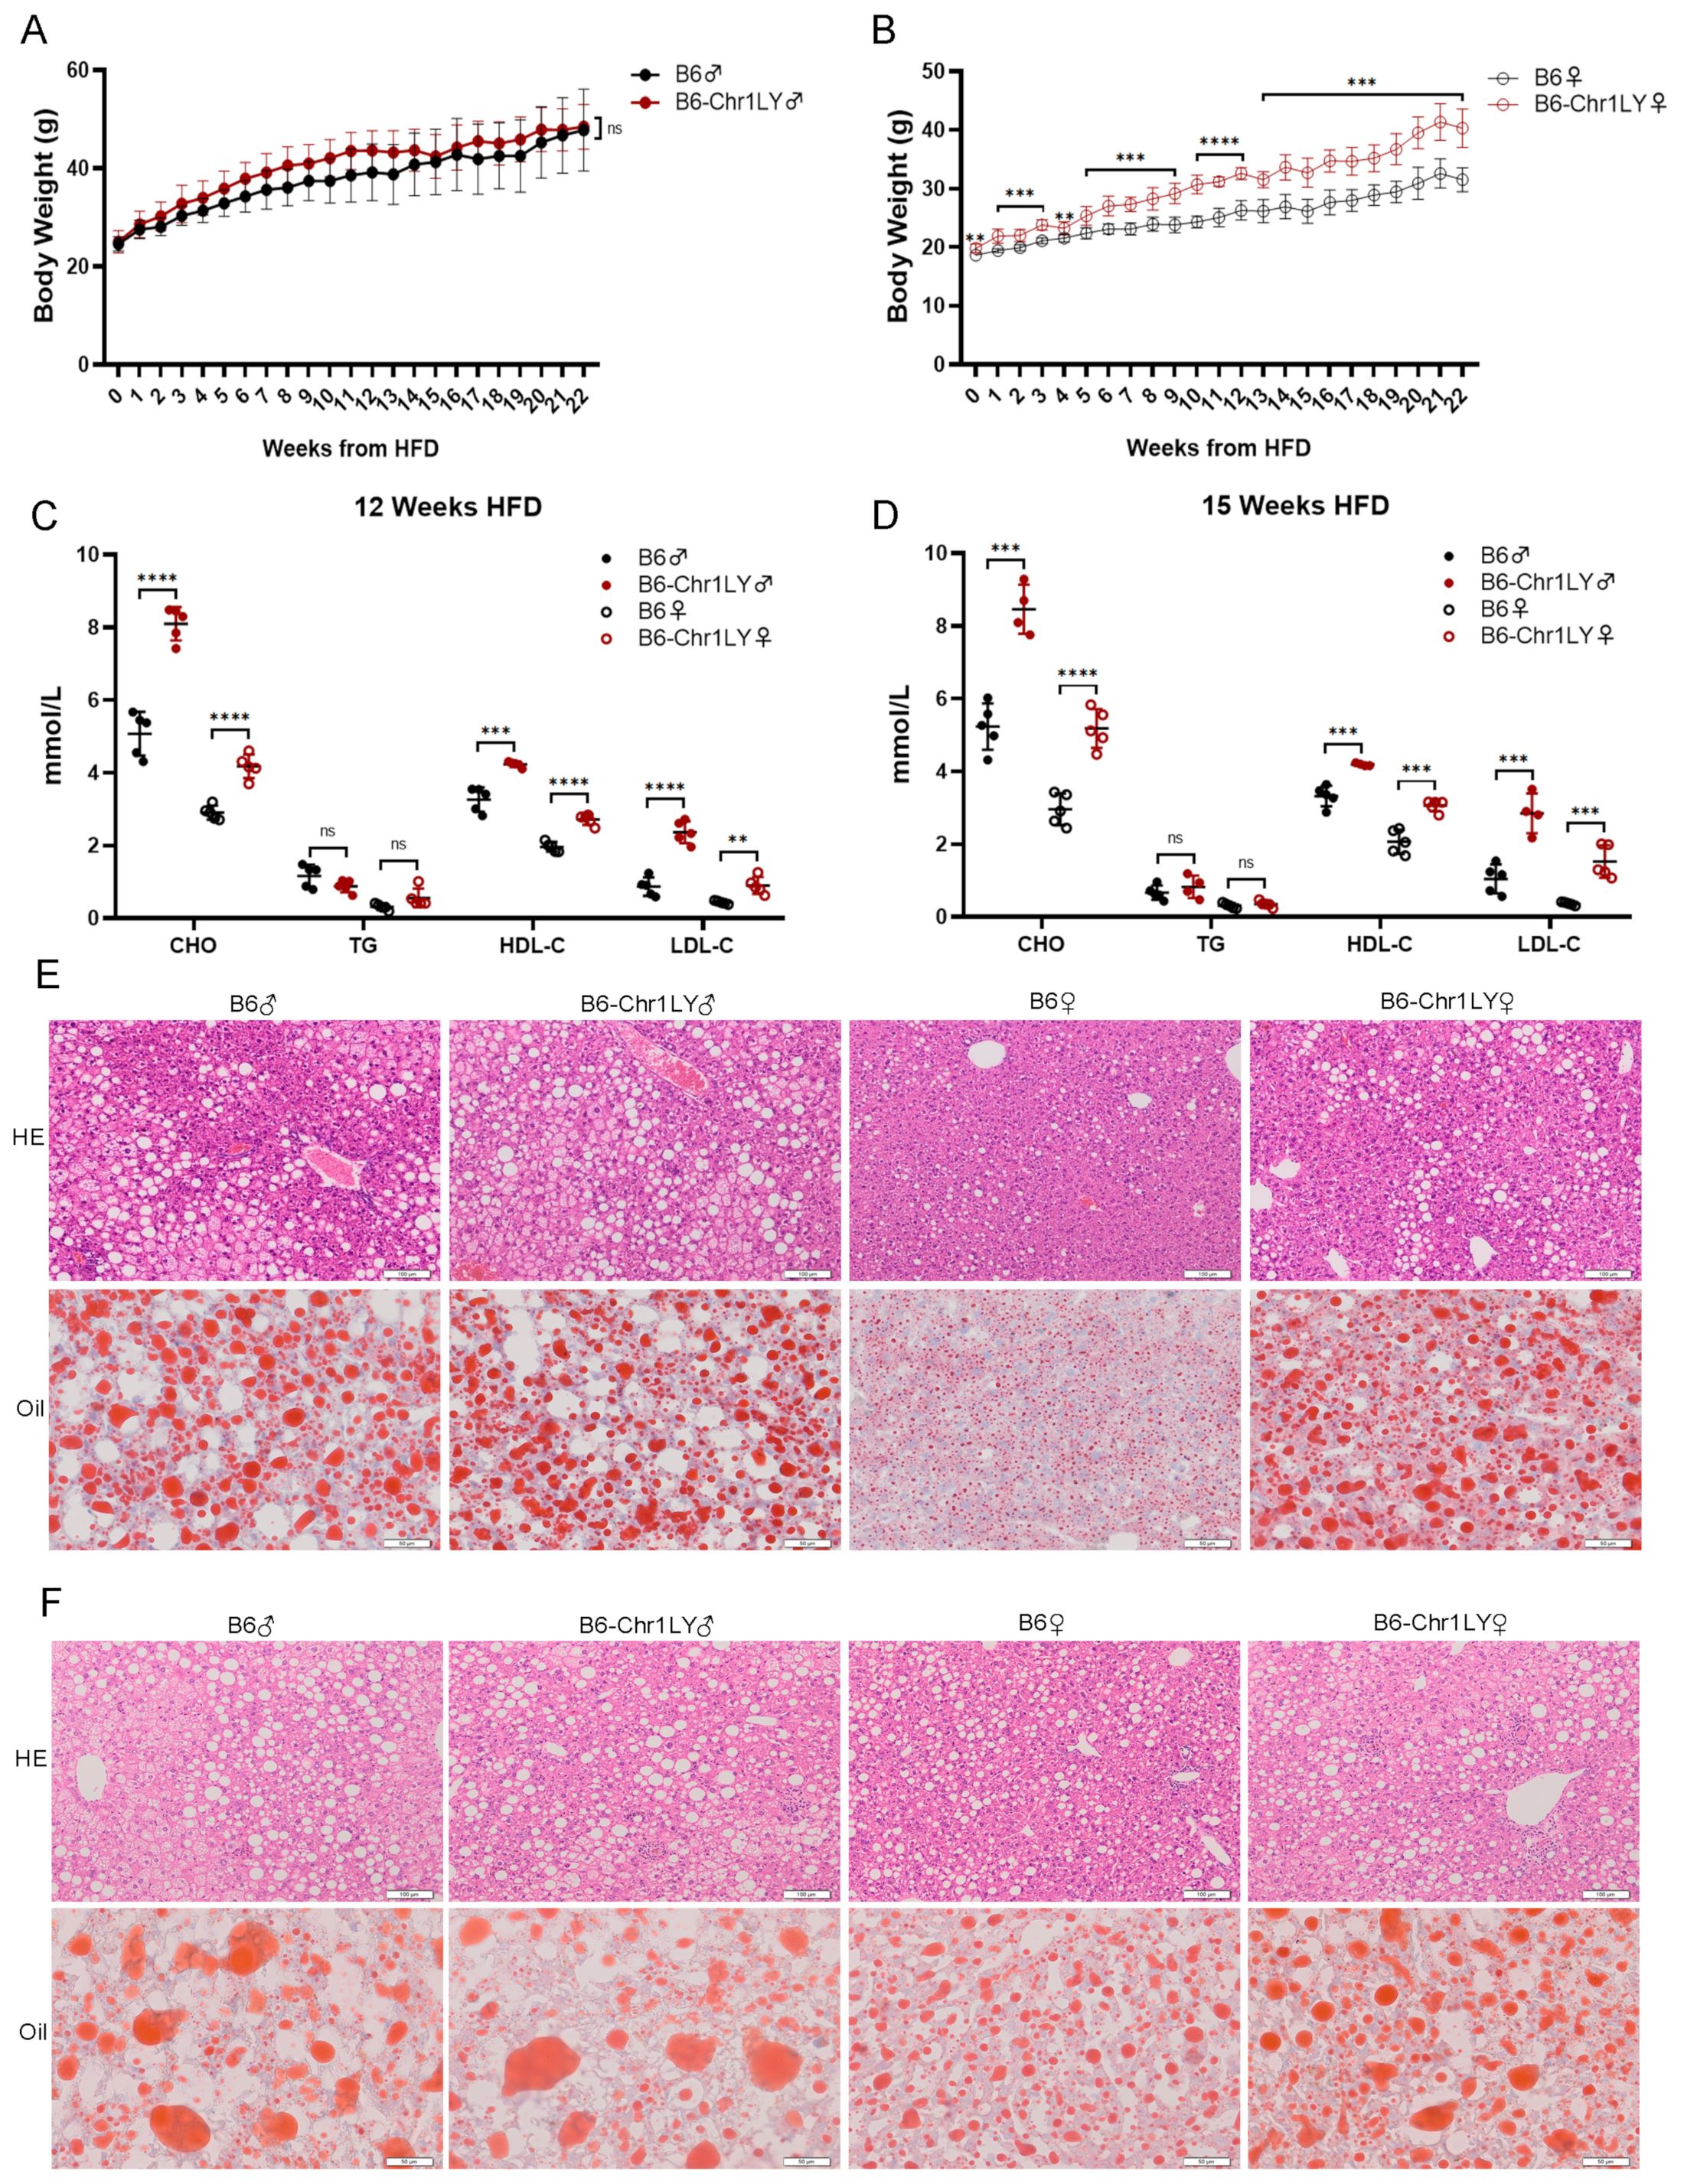
3.2. HFD-fed B6-Chr1LY Line Showed Significant Abnormalities in Body Weight, Lipid Metabolism and Liver Lesions
3.3. HFD-fed B6-Chr1ZZ2 Line Showed Significant Abnormalities in Body Weight, Lipid Metabolism and Liver Lesions
3.4. HFD-fed B6-Chr1BLD Line Showed Significant Abnormalities in Body Weight, Lipid Metabolism and Liver Lesions
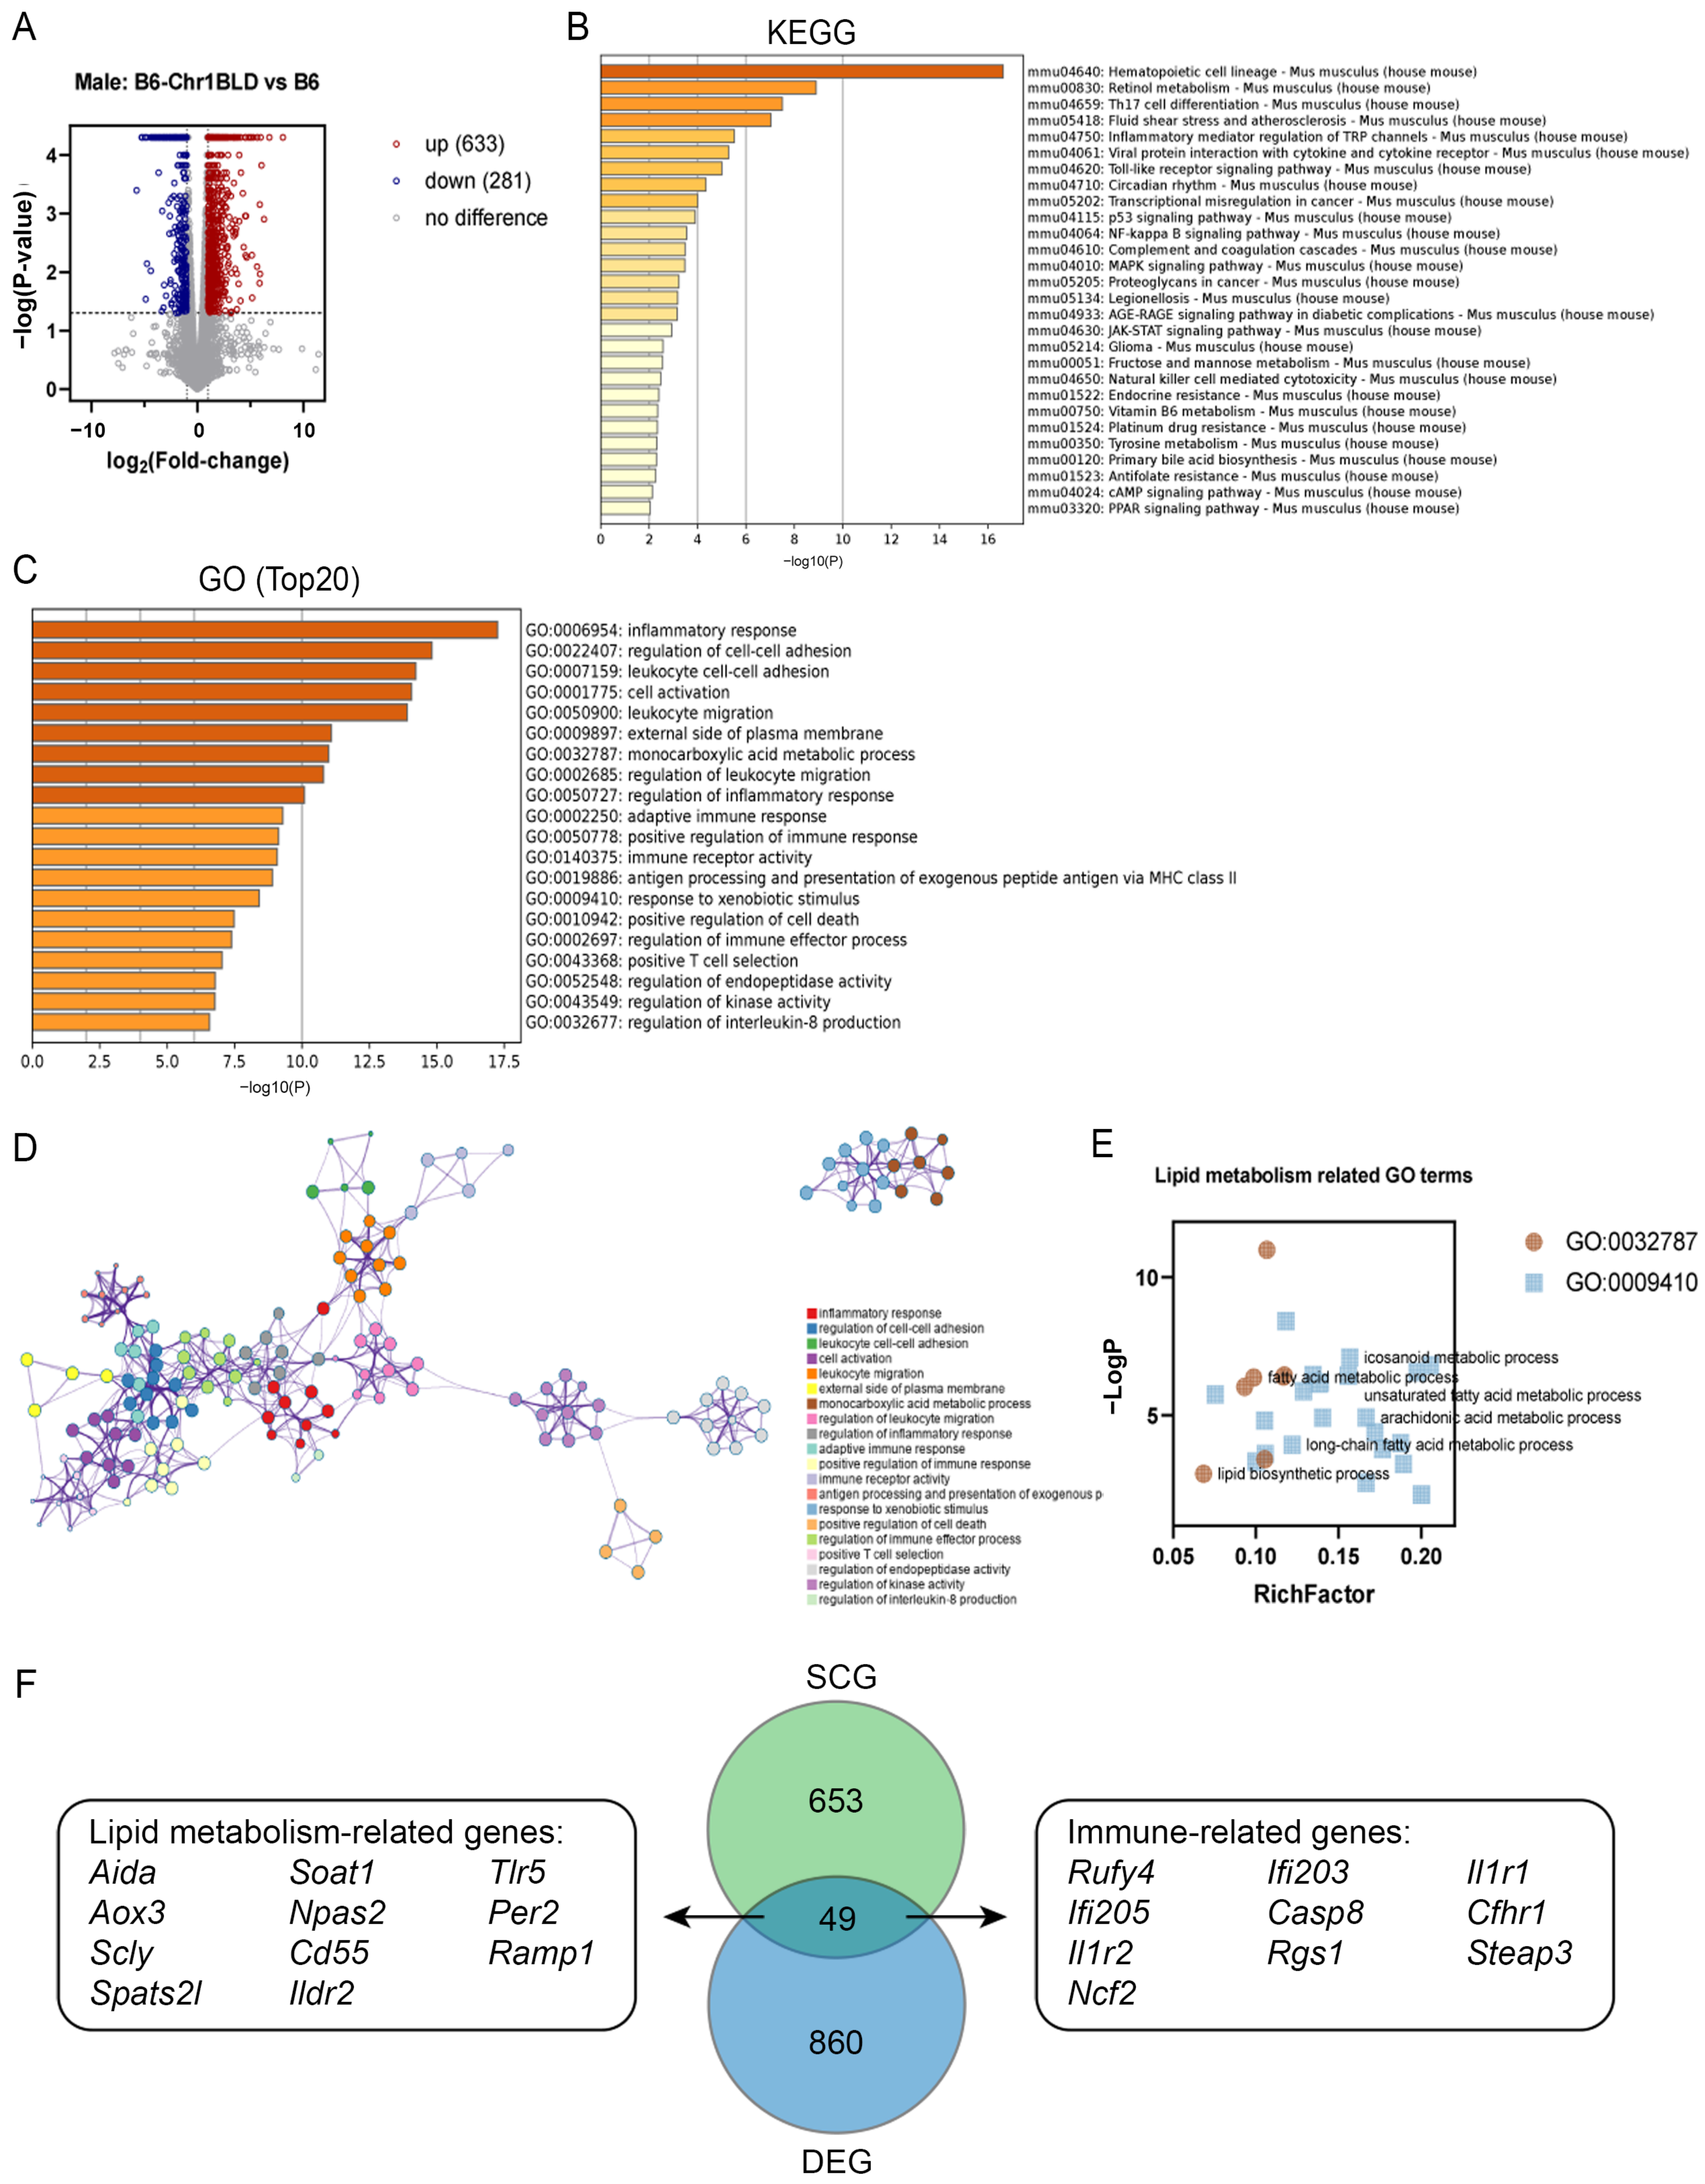
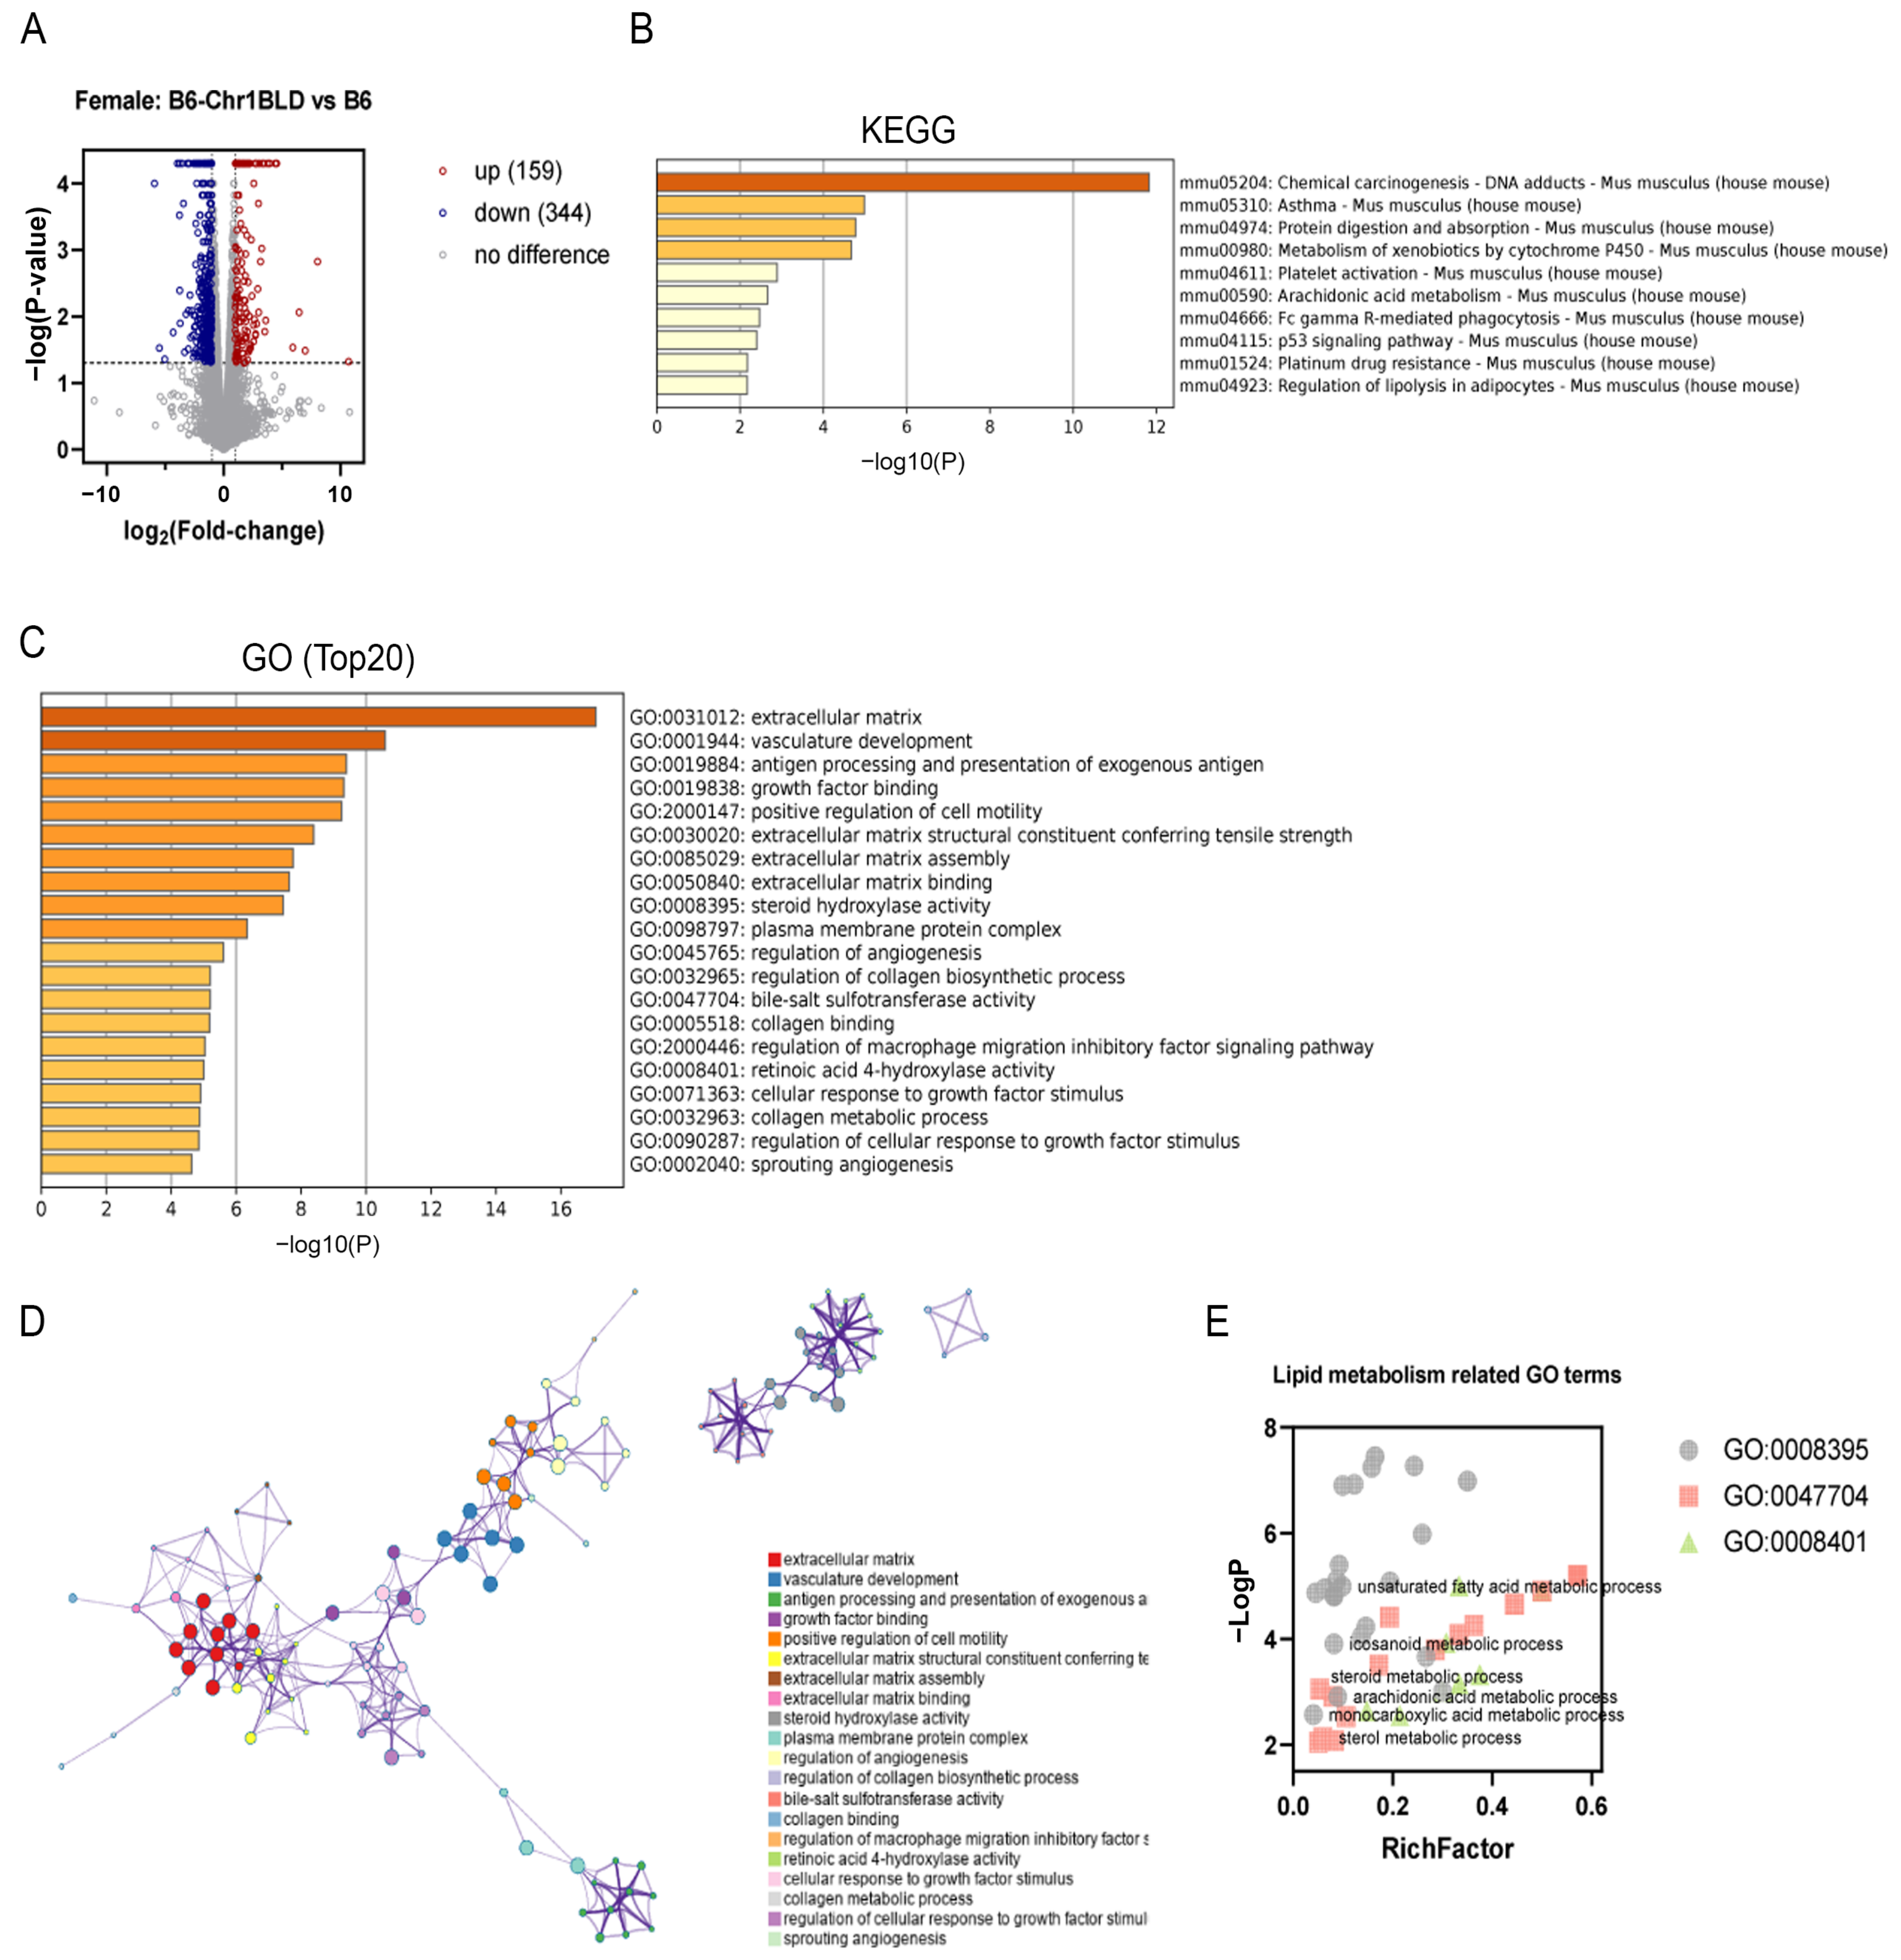
3.5. Single Nucleotide Polymorphism (SNP) Analysis and Transcriptomics Analysis of B6-Chr1BLD Mice
4. Discussion
5. Conclusions
Author Contributions
Funding
Institutional Review Board Statement
Informed Consent Statement
Data Availability Statement
Conflicts of Interest
References
- Otunola, G.; Oloyede, O.; Oladiji, T.; Afolayan, A. Effects of diet-induced hypercholesterolemia on the lipid profile and some enzyme activities in female Wistar rats. Afr. J. Biochem. Res. 2010, 4, 149–154. [Google Scholar]
- Kasiske, B.L.; O’Donnell, M.P.; Schmitz, P.G.; Kim, Y.; Keane, W.F. Renal injury of diet-induced hypercholesterolemia in rats. Kidney Int. 1990, 37, 880–891. [Google Scholar] [CrossRef] [PubMed] [Green Version]
- Cases, A.; Coll, E. Dyslipidemia and the progression of renal disease in chronic renal failure patients. Kidney Int. Suppl. 2005, 68, S87–S93. [Google Scholar] [CrossRef] [PubMed] [Green Version]
- Gai, Z.; Wang, T.; Visentin, M.; Kullak-Ublick, G.A.; Fu, X.; Wang, Z. Lipid Accumulation and Chronic Kidney Disease. Nutrients 2019, 11, 722. [Google Scholar] [CrossRef] [PubMed] [Green Version]
- Ference, B.A.; Ginsberg, H.N.; Graham, I.; Ray, K.K.; Packard, C.J.; Bruckert, E.; Hegele, R.A.; Krauss, R.M.; Raal, F.J.; Schunkert, H.; et al. Low-density lipoproteins cause atherosclerotic cardiovascular disease. 1. Evidence from genetic, epidemiologic, and clinical studies. A consensus statement from the European Atherosclerosis Society Consensus Panel. Eur. Heart J. 2017, 38, 2459–2472. [Google Scholar] [CrossRef] [Green Version]
- Ference, B.A.; Yoo, W.; Alesh, I.; Mahajan, N.; Mirowska, K.K.; Mewada, A.; Kahn, J.; Afonso, L.; Williams, K.A., Jr.; Flack, J.M. Effect of long-term exposure to lower low-density lipoprotein cholesterol beginning early in life on the risk of coronary heart disease: A Mendelian randomization analysis. J. Am. Coll. Cardiol. 2012, 60, 2631–2639. [Google Scholar] [CrossRef] [Green Version]
- Scicali, R.; Giral, P.; D’Erasmo, L.; Cluzel, P.; Redheuil, A.; Di Pino, A.; Rabuazzo, A.M.; Piro, S.; Arca, M.; Béliard, S.; et al. High TG to HDL ratio plays a significant role on atherosclerosis extension in prediabetes and newly diagnosed type 2 diabetes subjects. Diabetes Metab. Res. Rev. 2021, 37, e3367. [Google Scholar] [CrossRef]
- Calle, E.E.; Rodriguez, C.; Walker-Thurmond, K.; Thun, M.J. Overweight, obesity, and mortality from cancer in a prospectively studied cohort of U.S. adults. N. Engl. J. Med. 2003, 348, 1625–1638. [Google Scholar] [CrossRef] [Green Version]
- Huang, J.; Li, L.; Lian, J.; Schauer, S.; Vesely, P.W.; Kratky, D.; Hoefler, G.; Lehner, R. Tumor-Induced Hyperlipidemia Contributes to Tumor Growth. Cell Rep. 2016, 15, 336–348. [Google Scholar] [CrossRef] [Green Version]
- Buss, L.A.; Dachs, G.U. The Role of Exercise and Hyperlipidaemia in Breast Cancer Progression. Exerc. Immunol. Rev. 2018, 24, 10–25. [Google Scholar]
- Wang, F.; Cen, Z.; Liu, Z.; Gan, J.; Zhang, X.; Cui, Q.; Gong, S.; Chang, P.; Chen, P. High-Fat Diet-Induced Fatty Liver Is Associated with Immunosuppressive Response during Sepsis in Mice. Oxid. Med. Cell Longev. 2021, 2021, 5833857. [Google Scholar] [CrossRef]
- Rabinovich-Nikitin, I.; Dhingra, R.; Kirshenbaum, L.A. Activation of Mitophagy in High-Fat Diet-Induced Diabetic Cardiomyopathy. Circ. Res. 2019, 124, 1288–1290. [Google Scholar] [CrossRef]
- Van Driel, M.S.; van Neerven, S.M.; Vermeulen, L. High-Fat Diet Impacts on Tumor Development in the Gut. Trends Cancer 2021, 7, 664–665. [Google Scholar] [CrossRef]
- Recena Aydos, L.; Aparecida do Amaral, L.; Serafim de Souza, R.; Jacobowski, A.C.; Freitas Dos Santos, E.; Rodrigues Macedo, M.L. Nonalcoholic Fatty Liver Disease Induced by High-Fat Diet in C57bl/6 Models. Nutrients 2019, 11, 67. [Google Scholar] [CrossRef] [Green Version]
- Gwon, M.H.; Im, Y.S.; Seo, A.R.; Kim, K.Y.; Moon, H.R.; Yun, J.M. Phenethyl Isothiocyanate Protects against High Fat/Cholesterol Diet-Induced Obesity and Atherosclerosis in C57BL/6 Mice. Nutrients 2020, 12, 3657. [Google Scholar] [CrossRef]
- Zhang, X.; Qi, R.; Xian, X.; Yang, F.; Blackstein, M.; Deng, X.; Fan, J.; Ross, C.; Karasinska, J.; Hayden, M.R.; et al. Spontaneous atherosclerosis in aged lipoprotein lipase-deficient mice with severe hypertriglyceridemia on a normal chow diet. Circ. Res. 2008, 102, 250–256. [Google Scholar] [CrossRef]
- Wang, Y.; Sternfeld, L.; Yang, F.; Rodriguez, J.A.; Ross, C.; Hayden, M.R.; Carriere, F.; Liu, G.; Hofer, W.; Schulz, I. Enhanced susceptibility to pancreatitis in severe hypertriglyceridaemic lipoprotein lipase-deficient mice and agonist-like function of pancreatic lipase in pancreatic cells. Gut 2009, 58, 422–430. [Google Scholar] [CrossRef]
- Andersson, I.J.; Ljungberg, A.; Svensson, L.; Gan, L.M.; Oscarsson, J.; Bergström, G. Increased atherosclerotic lesion area in apoE deficient mice overexpressing bovine growth hormone. Atherosclerosis 2006, 188, 331–340. [Google Scholar] [CrossRef]
- Lane-Donovan, C.; Wong, W.M.; Durakoglugil, M.S.; Wasser, C.R.; Jiang, S.; Xian, X.; Herz, J. Genetic Restoration of Plasma ApoE Improves Cognition and Partially Restores Synaptic Defects in ApoE-Deficient Mice. J. Neurosci. 2016, 36, 10141–10150. [Google Scholar] [CrossRef] [Green Version]
- Wientgen, H.; Thorngate, F.E.; Omerhodzic, S.; Rolnitzky, L.; Fallon, J.T.; Williams, D.L.; Fisher, E.A. Subphysiologic apolipoprotein E (ApoE) plasma levels inhibit neointimal formation after arterial injury in ApoE-deficient mice. Arterioscler. Thromb. Vasc. Biol. 2004, 24, 1460–1465. [Google Scholar] [CrossRef] [Green Version]
- Gregorová, S.; Divina, P.; Storchova, R.; Trachtulec, Z.; Fotopulosova, V.; Svenson, K.L.; Donahue, L.R.; Paigen, B.; Forejt, J. Mouse consomic strains: Exploiting genetic divergence between Mus m. musculus and Mus m. domesticus subspecies. Genome. Res. 2008, 18, 509–515. [Google Scholar] [CrossRef] [PubMed] [Green Version]
- Nadeau, J.H.; Singer, J.B.; Matin, A.; Lander, E.S. Analysing complex genetic traits with chromosome substitution strains. Nat. Genet. 2000, 24, 221–225. [Google Scholar] [CrossRef] [PubMed]
- Takada, T.; Mita, A.; Maeno, A.; Sakai, T.; Shitara, H.; Kikkawa, Y.; Moriwaki, K.; Yonekawa, H.; Shiroishi, T. Mouse inter-subspecific consomic strains for genetic dissection of quantitative complex traits. Genome. Res. 2008, 18, 500–508. [Google Scholar] [CrossRef] [PubMed] [Green Version]
- Laurie, C.C.; Nickerson, D.A.; Anderson, A.D.; Weir, B.S.; Livingston, R.J.; Dean, M.D.; Smith, K.L.; Schadt, E.E.; Nachman, M.W. Linkage disequilibrium in wild mice. PLoS Genet. 2007, 3, e144. [Google Scholar] [CrossRef] [PubMed]
- Salcedo, T.; Geraldes, A.; Nachman, M.W. Nucleotide variation in wild and inbred mice. Genetics 2007, 177, 2277–2291. [Google Scholar] [CrossRef] [Green Version]
- Orozco, L.D.; Cokus, S.J.; Ghazalpour, A.; Ingram-Drake, L.; Wang, S.; van Nas, A.; Che, N.; Araujo, J.A.; Pellegrini, M.; Lusis, A.J. Copy number variation influences gene expression and metabolic traits in mice. Hum. Mol. Genet. 2009, 18, 4118–4129. [Google Scholar] [CrossRef] [Green Version]
- Leduc, M.S.; Lyons, M.; Darvishi, K.; Walsh, K.; Sheehan, S.; Amend, S.; Cox, A.; Orho-Melander, M.; Kathiresan, S.; Paigen, B.; et al. The mouse QTL map helps interpret human genome-wide association studies for HDL cholesterol. J. Lipid. Res. 2011, 52, 1139–1149. [Google Scholar] [CrossRef] [Green Version]
- Samani, N.J.; Braund, P.S.; Erdmann, J.; Götz, A.; Tomaszewski, M.; Linsel-Nitschke, P.; Hajat, C.; Mangino, M.; Hengstenberg, C.; Stark, K.; et al. The novel genetic variant predisposing to coronary artery disease in the region of the PSRC1 and CELSR2 genes on chromosome 1 associates with serum cholesterol. J. Mol. Med. 2008, 86, 1233–1241. [Google Scholar] [CrossRef]
- Kovács, P.; Klöting, I. Quantitative trait loci on chromosomes 1 and 4 affect lipid phenotypes in the rat. Arch. Biochem. Biophys 1998, 354, 139–143. [Google Scholar] [CrossRef]
- Parkman, J.K.; Denvir, J.; Mao, X.; Dillon, K.D.; Romero, S.; Saxton, A.M.; Kim, J.H. Congenic mice demonstrate the presence of QTLs conferring obesity and hypercholesterolemia on chromosome 1 in the TALLYHO mouse. Mamm. Genome. 2017, 28, 487–497. [Google Scholar] [CrossRef]
- Xiao, J.; Liang, Y.; Li, K.; Zhou, Y.; Cai, W.; Zhou, Y.; Zhao, Y.; Xing, Z.; Chen, G.; Jin, L. A novel strategy for genetic dissection of complex traits: The population of specific chromosome substitution strains from laboratory and wild mice. Mamm. Genome. 2010, 21, 370–376. [Google Scholar] [CrossRef]
- Xu, F.; Chao, T.; Liang, Y.; Li, K.; Hu, S.; Wang, M.; Zhou, Y.; Xu, H.; Xiao, J. Genome Sequencing of Chromosome 1 Substitution Lines Derived from Chinese Wild Mice Revealed a Unique Resource for Genetic Studies of Complex Traits. G3 2016, 6, 3571–3580. [Google Scholar] [CrossRef]
- Xu, F.; Hu, S.; Chao, T.; Wang, M.; Li, K.; Zhou, Y.; Xu, H.; Xiao, J. Sequence analysis of chromosome 1 revealed different selection patterns between Chinese wild mice and laboratory strains. Mol. Genet. Genom. 2017, 292, 1111–1121. [Google Scholar] [CrossRef]
- Xu, F.; Chao, T.; Zhang, Y.; Hu, S.; Zhou, Y.; Xu, H.; Xiao, J.; Li, K. Chromosome 1 Sequence Analysis of C57BL/6J-Chr1(KM) Mouse Strain. Int. J. Genom. 2017, 2017, 1712530. [Google Scholar] [CrossRef] [Green Version]
- Xu, F.; Wang, M.; Hu, S.; Zhou, Y.; Collyer, J.; Li, K.; Xu, H.; Xiao, J. Candidate Regulators of Dyslipidemia in Chromosome 1 Substitution Lines Using Liver Co-Expression Profiling Analysis. Front. Genet. 2019, 10, 1258. [Google Scholar] [CrossRef] [Green Version]
- Pertea, M.; Kim, D.; Pertea, G.M.; Leek, J.T.; Salzberg, S.L. Transcript-level expression analysis of RNA-seq experiments with HISAT, StringTie and Ballgown. Nat. Protoc. 2016, 11, 1650–1667. [Google Scholar] [CrossRef]
- Kim, D.; Langmead, B.; Salzberg, S.L. HISAT: A fast spliced aligner with low memory requirements. Nat. Methods 2015, 12, 357–360. [Google Scholar] [CrossRef] [Green Version]
- Pertea, M.; Pertea, G.M.; Antonescu, C.M.; Chang, T.C.; Mendell, J.T.; Salzberg, S.L. StringTie enables improved reconstruction of a transcriptome from RNA-seq reads. Nat. Biotechnol. 2015, 33, 290–295. [Google Scholar] [CrossRef] [Green Version]
- Trapnell, C.; Roberts, A.; Goff, L.; Pertea, G.; Kim, D.; Kelley, D.R.; Pimentel, H.; Salzberg, S.L.; Rinn, J.L.; Pachter, L. Differential gene and transcript expression analysis of RNA-seq experiments with TopHat and Cufflinks. Nat. Protoc. 2012, 7, 562–578. [Google Scholar] [CrossRef] [Green Version]
- Zhou, Y.; Zhou, B.; Pache, L.; Chang, M.; Khodabakhshi, A.H.; Tanaseichuk, O.; Benner, C.; Chanda, S.K. Metascape provides a biologist-oriented resource for the analysis of systems-level datasets. Nat. Commun. 2019, 10, 1523. [Google Scholar] [CrossRef]
- Li, H.; Durbin, R. Fast and accurate short read alignment with Burrows-Wheeler transform. Bioinformatics 2009, 25, 1754–1760. [Google Scholar] [CrossRef] [PubMed] [Green Version]
- Li, H.; Handsaker, B.; Wysoker, A.; Fennell, T.; Ruan, J.; Homer, N.; Marth, G.; Abecasis, G.; Durbin, R. The Sequence Alignment/Map format and SAMtools. Bioinformatics 2009, 25, 2078–2079. [Google Scholar] [CrossRef] [PubMed]
- McKenna, A.; Hanna, M.; Banks, E.; Sivachenko, A.; Cibulskis, K.; Kernytsky, A.; Garimella, K.; Altshuler, D.; Gabriel, S.; Daly, M.; et al. The Genome Analysis Toolkit: A MapReduce framework for analyzing next-generation DNA sequencing data. Genome. Res. 2010, 20, 1297–1303. [Google Scholar] [CrossRef] [PubMed] [Green Version]
- Wang, K.; Li, M.; Hakonarson, H. ANNOVAR: Functional annotation of genetic variants from high-throughput sequencing data. Nucleic. Acids Res. 2010, 38, e164. [Google Scholar] [CrossRef] [PubMed]
- Assmann, G.; Gotto, A.M., Jr. HDL cholesterol and protective factors in atherosclerosis. Circulation 2004, 109, III-8–III-14. [Google Scholar] [CrossRef] [Green Version]
- Sun, X.; Seidman, J.S.; Zhao, P.; Troutman, T.D.; Spann, N.J.; Que, X.; Zhou, F.; Liao, Z.; Pasillas, M.; Yang, X.; et al. Neutralization of Oxidized Phospholipids Ameliorates Non-alcoholic Steatohepatitis. Cell Metab. 2020, 31, 189–206.e188. [Google Scholar] [CrossRef]
- Li, Y.; Xu, J.; Lu, Y.; Bian, H.; Yang, L.; Wu, H.; Zhang, X.; Zhang, B.; Xiong, M.; Chang, Y.; et al. DRAK2 aggravates nonalcoholic fatty liver disease progression through SRSF6-associated RNA alternative splicing. Cell Metab. 2021, 33, 2004–2020.e2009. [Google Scholar] [CrossRef]
- Wang, X.; Zheng, Z.; Caviglia, J.M.; Corey, K.E.; Herfel, T.M.; Cai, B.; Masia, R.; Chung, R.T.; Lefkowitch, J.H.; Schwabe, R.F.; et al. Hepatocyte TAZ/WWTR1 Promotes Inflammation and Fibrosis in Nonalcoholic Steatohepatitis. Cell Metab. 2016, 24, 848–862. [Google Scholar] [CrossRef] [Green Version]
- Beyene, H.B.; Olshansky, G.; AA, T.S.; Giles, C.; Huynh, K.; Cinel, M.; Mellett, N.A.; Cadby, G.; Hung, J.; Hui, J.; et al. High-coverage plasma lipidomics reveals novel sex-specific lipidomic fingerprints of age and BMI: Evidence from two large population cohort studies. PLoS Biol. 2020, 18, e3000870. [Google Scholar] [CrossRef]
- Bakx, J.C.; van den Hoogen, H.J.; Deurenberg, P.; van Doremalen, J.; van den Bosch, W.J. Changes in serum total cholesterol levels over 18 years in a cohort of men and women: The Nijmegen Cohort Study. Prev. Med. 2000, 30, 138–145. [Google Scholar] [CrossRef]
- Yiu, J.H.C.; Chan, K.S.; Cheung, J.; Li, J.; Liu, Y.; Wang, Y.; Fung, W.W.L.; Cai, J.; Cheung, S.W.M.; Dorweiler, B.; et al. Gut Microbiota-Associated Activation of TLR5 Induces Apolipoprotein A1 Production in the Liver. Circ. Res. 2020, 127, 1236–1252. [Google Scholar] [CrossRef]
- Weigert, J.; Neumeier, M.; Bauer, S.; Mages, W.; Schnitzbauer, A.A.; Obed, A.; Gröschl, B.; Hartmann, A.; Schäffler, A.; Aslanidis, C.; et al. Small-interference RNA-mediated knock-down of aldehyde oxidase 1 in 3T3-L1 cells impairs adipogenesis and adiponectin release. FEBS Lett. 2008, 582, 2965–2972. [Google Scholar] [CrossRef]
- O’Neil, D.; Mendez-Figueroa, H.; Mistretta, T.A.; Su, C.; Lane, R.H.; Aagaard, K.M. Dysregulation of Npas2 leads to altered metabolic pathways in a murine knockout model. Mol. Genet. Metab. 2013, 110, 378–387. [Google Scholar] [CrossRef] [Green Version]
- Grimaldi, B.; Bellet, M.M.; Katada, S.; Astarita, G.; Hirayama, J.; Amin, R.H.; Granneman, J.G.; Piomelli, D.; Leff, T.; Sassone-Corsi, P. PER2 controls lipid metabolism by direct regulation of PPARγ. Cell. Metab. 2010, 12, 509–520. [Google Scholar] [CrossRef] [Green Version]
- Torres, D.J.; Pitts, M.W.; Hashimoto, A.C.; Berry, M.J. Agrp-Specific Ablation of Scly Protects against Diet-Induced Obesity and Leptin Resistance. Nutrients 2019, 11, 1693. [Google Scholar] [CrossRef] [Green Version]
- Lewis, R.D.; Perry, M.J.; Guschina, I.A.; Jackson, C.L.; Morgan, B.P.; Hughes, T.R. CD55 deficiency protects against atherosclerosis in ApoE-deficient mice via C3a modulation of lipid metabolism. Am. J. Pathol. 2011, 179, 1601–1607. [Google Scholar] [CrossRef] [Green Version]
- Davis, R.B.; Ding, S.; Nielsen, N.R.; Pawlak, J.B.; Blakeney, E.S.; Caron, K.M. Calcitonin-Receptor-Like Receptor Signaling Governs Intestinal Lymphatic Innervation and Lipid Uptake. ACS Pharmacol. Transl. Sci. 2019, 2, 114–121. [Google Scholar] [CrossRef]
- Kulyté, A.; Aman, A.; Strawbridge, R.J.; Arner, P.; Dahlman, I.A. Genome-Wide Association Study Identifies Genetic Loci Associated With Fat Cell Number and Overlap With Genetic Risk Loci for Type 2 Diabetes. Diabetes 2022, 71, 1350–1362. [Google Scholar] [CrossRef]
- Watanabe, K.; Watson, E.; Cremona, M.L.; Millings, E.J.; Lefkowitch, J.H.; Fischer, S.G.; LeDuc, C.A.; Leibel, R.L. ILDR2: An endoplasmic reticulum resident molecule mediating hepatic lipid homeostasis. PLoS ONE 2013, 8, e67234. [Google Scholar] [CrossRef] [Green Version]
- Luo, H.; Jiang, M.; Lian, G.; Liu, Q.; Shi, M.; Li, T.Y.; Song, L.; Ye, J.; He, Y.; Yao, L.; et al. AIDA Selectively Mediates Downregulation of Fat Synthesis Enzymes by ERAD to Retard Intestinal Fat Absorption and Prevent Obesity. Cell. Metab. 2018, 27, 843–853.e846. [Google Scholar] [CrossRef] [Green Version]
- Wu, N.; Li, R.Q.; Li, L. SOAT1 deficiency attenuates atherosclerosis by regulating inflammation and cholesterol transportation via HO-1 pathway. Biochem. Biophys. Res. Commun. 2018, 501, 343–350. [Google Scholar] [CrossRef] [PubMed]
- Lu, Z.; Yuan, Z.; Miyoshi, T.; Wang, Q.; Su, Z.; Chang, C.C.; Shi, W. Identification of Soat1 as a quantitative trait locus gene on mouse chromosome 1 contributing to hyperlipidemia. PLoS ONE 2011, 6, e25344. [Google Scholar] [CrossRef] [PubMed]
- Moghbeli, M.; Khedmatgozar, H.; Yadegari, M.; Avan, A.; Ferns, G.A.; Ghayour Mobarhan, M. Cytokines and the immune response in obesity-related disorders. Adv. Clin. Chem. 2021, 101, 135–168. [Google Scholar] [CrossRef] [PubMed]
- Tilg, H.; Adolph, T.E.; Dudek, M.; Knolle, P. Non-alcoholic fatty liver disease: The interplay between metabolism, microbes and immunity. Nat. Metab. 2021, 3, 1596–1607. [Google Scholar] [CrossRef] [PubMed]
- Schaftenaar, F.; Frodermann, V.; Kuiper, J.; Lutgens, E. Atherosclerosis: The interplay between lipids and immune cells. Curr. Opin. Lipidol. 2016, 27, 209–215. [Google Scholar] [CrossRef]
- Terawaki, S.; Camosseto, V.; Pierre, P.; Gatti, E. RUFY4: Immunity piggybacking on autophagy? Autophagy 2016, 12, 598–600. [Google Scholar] [CrossRef] [Green Version]
- Mondini, M.; Costa, S.; Sponza, S.; Gugliesi, F.; Gariglio, M.; Landolfo, S. The interferon-inducible HIN-200 gene family in apoptosis and inflammation: Implication for autoimmunity. Autoimmunity 2010, 43, 226–231. [Google Scholar] [CrossRef]
- Gehrke, N.; Hövelmeyer, N.; Waisman, A.; Straub, B.K.; Weinmann-Menke, J.; Wörns, M.A.; Galle, P.R.; Schattenberg, J.M. Hepatocyte-specific deletion of IL1-RI attenuates liver injury by blocking IL-1 driven autoinflammation. J. Hepatol. 2018, 68, 986–995. [Google Scholar] [CrossRef]
- Newton, K.; Wickliffe, K.E.; Maltzman, A.; Dugger, D.L.; Reja, R.; Zhang, Y.; Roose-Girma, M.; Modrusan, Z.; Sagolla, M.S.; Webster, J.D.; et al. Activity of caspase-8 determines plasticity between cell death pathways. Nature 2019, 575, 679–682. [Google Scholar] [CrossRef]
- Li, X.; Zong, J.; Si, S. Complement Factor H related protein 1 and immune inflammatory disorders. Mol. Immunol. 2022, 145, 43–49. [Google Scholar] [CrossRef]
- Boraschi, D.; Italiani, P.; Weil, S.; Martin, M.U. The family of the interleukin-1 receptors. Immunol. Rev. 2018, 281, 197–232. [Google Scholar] [CrossRef]
- Feng, Z.; Zhou, J.; Liu, Y.; Xia, R.; Li, Q.; Yan, L.; Chen, Q.; Chen, X.; Jiang, Y.; Chao, G.; et al. Epithelium- and endothelium-derived exosomes regulate the alveolar macrophages by targeting RGS1 mediated calcium signaling-dependent immune response. Cell Death Differ. 2021, 28, 2238–2256. [Google Scholar] [CrossRef]
- Zhang, F.; Tao, Y.; Zhang, Z.; Guo, X.; An, P.; Shen, Y.; Wu, Q.; Yu, Y.; Wang, F. Metalloreductase Steap3 coordinates the regulation of iron homeostasis and inflammatory responses. Haematologica 2012, 97, 1826–1835. [Google Scholar] [CrossRef]
- Li, M.; Xin, S.; Gu, R.; Zheng, L.; Hu, J.; Zhang, R.; Dong, H. Novel Diagnostic Biomarkers Related to Oxidative Stress and Macrophage Ferroptosis in Atherosclerosis. Oxid. Med. Cell Longev. 2022, 2022, 8917947. [Google Scholar] [CrossRef]
- Nelson, R.H. Hyperlipidemia as a risk factor for cardiovascular disease. Prim. Care. 2013, 40, 195–211. [Google Scholar] [CrossRef] [Green Version]
- Kopin, L.; Lowenstein, C. Dyslipidemia. Ann. Intern. Med. 2017, 167, Itc81–Itc96. [Google Scholar] [CrossRef]
- Moosmann, B.; Behl, C. Selenoprotein synthesis and side-effects of statins. Lancet 2004, 363, 892–894. [Google Scholar] [CrossRef]
- Stolk, M.F.; Becx, M.C.; Kuypers, K.C.; Seldenrijk, C.A. Severe hepatic side effects of ezetimibe. Clin. Gastroenterol. Hepatol. 2006, 4, 908–911. [Google Scholar] [CrossRef]
- Drummer, C.I.V.; Saaoud, F.; Sun, Y.; Atar, D.; Xu, K.; Lu, Y.; Shao, Y.; Johnson, C.; Liu, L.; Shen, H.; et al. Hyperlipidemia May Synergize with Hypomethylation in Establishing Trained Immunity and Promoting Inflammation in NASH and NAFLD. J. Immunol. Res. 2021, 2021, 3928323. [Google Scholar] [CrossRef]
- Zheng, F.; Cai, Y. Concurrent exercise improves insulin resistance and nonalcoholic fatty liver disease by upregulating PPAR-γ and genes involved in the beta-oxidation of fatty acids in ApoE-KO mice fed a high-fat diet. Lipids Health Dis. 2019, 18, 6. [Google Scholar] [CrossRef] [Green Version]
- Miao, J.; Zang, X.; Cui, X.; Zhang, J. Autophagy, Hyperlipidemia, and Atherosclerosis. Adv. Exp. Med. Biol. 2020, 1207, 237–264. [Google Scholar] [CrossRef] [PubMed]
- Zhou, X.; Zhang, W.; Liu, X.; Zhang, W.; Li, Y. Interrelationship between diabetes and periodontitis: Role of hyperlipidemia. Arch. Oral. Biol. 2015, 60, 667–674. [Google Scholar] [CrossRef] [PubMed]
- Imai, Y.; Dobrian, A.D.; Morris, M.A.; Taylor-Fishwick, D.A.; Nadler, J.L. Lipids and immunoinflammatory pathways of beta cell destruction. Diabetologia 2016, 59, 673–678. [Google Scholar] [CrossRef] [Green Version]
- Kim, K.H.; Yoon, J.M.; Choi, A.H.; Kim, W.S.; Lee, G.Y.; Kim, J.B. Liver X receptor ligands suppress ubiquitination and degradation of LXRalpha by displacing BARD1/BRCA1. Mol. Endocrinol. 2009, 23, 466–474. [Google Scholar] [CrossRef] [PubMed]
- Wang, J.Q.; Li, L.L.; Hu, A.; Deng, G.; Wei, J.; Li, Y.F.; Liu, Y.B.; Lu, X.Y.; Qiu, Z.P.; Shi, X.J.; et al. Inhibition of ASGR1 decreases lipid levels by promoting cholesterol excretion. Nature 2022, 608, 413–420. [Google Scholar] [CrossRef]
- Wang, B.L.; Zhang, C.W.; Wang, L.; Tang, K.L.; Tanaka, N.; Gonzalez, F.J.; Xu, Y.; Fang, Z.Z. Lipidomics reveal aryl hydrocarbon receptor (Ahr)-regulated lipid metabolic pathway in alpha-naphthyl isothiocyanate (ANIT)-induced intrahepatic cholestasis. Xenobiotica 2019, 49, 591–601. [Google Scholar] [CrossRef]
- Westerberg, R.; Månsson, J.E.; Golozoubova, V.; Shabalina, I.G.; Backlund, E.C.; Tvrdik, P.; Retterstøl, K.; Capecchi, M.R.; Jacobsson, A. ELOVL3 is an important component for early onset of lipid recruitment in brown adipose tissue. J. Biol. Chem. 2006, 281, 4958–4968. [Google Scholar] [CrossRef] [Green Version]
- Fang, S.; Feng, J.; Zhang, H.; Li, P.; Zhang, Y.; Zeng, Y.; Cai, Y.; Lin, X.; Xue, Y.; Guan, M. MiR-455 targeting SOCS3 improve liver lipid disorders in diabetic mice. Adipocyte 2020, 9, 179–188. [Google Scholar] [CrossRef] [Green Version]
- Aherrahrou, R.; Kulle, A.E.; Alenina, N.; Werner, R.; Vens-Cappell, S.; Bader, M.; Schunkert, H.; Erdmann, J.; Aherrahrou, Z. CYP17A1 deficient XY mice display susceptibility to atherosclerosis, altered lipidomic profile and atypical sex development. Sci. Rep. 2020, 10, 8792. [Google Scholar] [CrossRef]
- Evangelakos, I.; Schwinge, D.; Worthmann, A.; John, C.; Roeder, N.; Pertzborn, P.; Behrens, J.; Schramm, C.; Scheja, L.; Heeren, J. Oxysterol 7-α Hydroxylase (CYP7B1) Attenuates Metabolic-Associated Fatty Liver Disease in Mice at Thermoneutrality. Cells 2021, 10, 2656. [Google Scholar] [CrossRef]
- Clifford, B.L.; Sedgeman, L.R.; Williams, K.J.; Morand, P.; Cheng, A.; Jarrett, K.E.; Chan, A.P.; Brearley-Sholto, M.C.; Wahlström, A.; Ashby, J.W.; et al. FXR activation protects against NAFLD via bile-acid-dependent reductions in lipid absorption. Cell Metab. 2021, 33, 1671–1684.e1674. [Google Scholar] [CrossRef]
- Senga, S.; Kobayashi, N.; Kawaguchi, K.; Ando, A.; Fujii, H. Fatty acid-binding protein 5 (FABP5) promotes lipolysis of lipid droplets, de novo fatty acid (FA) synthesis and activation of nuclear factor-kappa B (NF-κB) signaling in cancer cells. Biochim. Biophys. Acta. Mol. Cell. Biol. Lipids 2018, 1863, 1057–1067. [Google Scholar] [CrossRef]
- Basu, D.; Goldberg, I.J. Regulation of lipoprotein lipase-mediated lipolysis of triglycerides. Curr. Opin. Lipidol. 2020, 31, 154–160. [Google Scholar] [CrossRef]
- Xu, D.; Wang, Z.; Xia, Y.; Shao, F.; Xia, W.; Wei, Y.; Li, X.; Qian, X.; Lee, J.H.; Du, L.; et al. The gluconeogenic enzyme PCK1 phosphorylates INSIG1/2 for lipogenesis. Nature 2020, 580, 530–535. [Google Scholar] [CrossRef]
- Barros, R.P.; Gustafsson, J. Estrogen receptors and the metabolic network. Cell. Metab. 2011, 14, 289–299. [Google Scholar] [CrossRef] [Green Version]
- Morselli, E.; Santos, R.S.; Gao, S.; Ávalos, Y.; Criollo, A.; Palmer, B.F.; Clegg, D.J. Impact of estrogens and estrogen receptor-α in brain lipid metabolism. Am. J. Physiol. Endocrinol. Metab. 2018, 315, E7–E14. [Google Scholar] [CrossRef] [Green Version]
- Tomaszewski, M.; Charchar, F.J.; Maric, C.; Kuzniewicz, R.; Gola, M.; Grzeszczak, W.; Samani, N.J.; Zukowska-Szczechowska, E. Association between lipid profile and circulating concentrations of estrogens in young men. Atherosclerosis 2009, 203, 257–262. [Google Scholar] [CrossRef] [Green Version]
- Wolever, T.M.; Jenkins, D.J.; Mueller, S.; Patten, R.; Relle, L.K.; Boctor, D.; Ransom, T.P.; Chao, E.S.; McMillan, K.; Fulgoni, V., 3rd. Psyllium reduces blood lipids in men and women with hyperlipidemia. Am. J. Med. Sci. 1994, 307, 269–273. [Google Scholar] [CrossRef]
- Li, Z.; Zhu, G.; Chen, G.; Luo, M.; Liu, X.; Chen, Z.; Qian, J. Distribution of lipid levels and prevalence of hyperlipidemia: Data from the NHANES 2007-2018. Lipids Health Dis. 2022, 21, 111. [Google Scholar] [CrossRef]
- Czubryt, M.P.; Espira, L.; Lamoureux, L.; Abrenica, B. The role of sex in cardiac function and disease. Can. J. Physiol. Pharmacol. 2006, 84, 93–109. [Google Scholar] [CrossRef]
- Korolenko, T.A.; Cherkanova, M.S.; Korolenko, E.C. Effect of atorvastatin on activities of matrix metalloproteinases and chitotriosidase in male and female mice with experimental hyperlipidemia. Bull. Exp. Biol. Med. 2009, 148, 369–373. [Google Scholar] [CrossRef]
- Ballantyne, C.M.; Grundy, S.M.; Oberman, A.; Kreisberg, R.A.; Havel, R.J.; Frost, P.H.; Haffner, S.M. Hyperlipidemia: Diagnostic and therapeutic perspectives. J. Clin. Endocrinol. Metab. 2000, 85, 2089–2112. [Google Scholar] [CrossRef] [PubMed]
- Hegele, R.A.; Ginsberg, H.N.; Chapman, M.J.; Nordestgaard, B.G.; Kuivenhoven, J.A.; Averna, M.; Borén, J.; Bruckert, E.; Catapano, A.L.; Descamps, O.S.; et al. The polygenic nature of hypertriglyceridaemia: Implications for definition, diagnosis, and management. Lancet Diabetes Endocrinol. 2014, 2, 655–666. [Google Scholar] [CrossRef] [PubMed] [Green Version]
- Weinstock, P.H.; Bisgaier, C.L.; Aalto-Setälä, K.; Radner, H.; Ramakrishnan, R.; Levak-Frank, S.; Essenburg, A.D.; Zechner, R.; Breslow, J.L. Severe hypertriglyceridemia, reduced high density lipoprotein, and neonatal death in lipoprotein lipase knockout mice. Mild hypertriglyceridemia with impaired very low density lipoprotein clearance in heterozygotes. J. Clin. Investig. 1995, 96, 2555–2568. [Google Scholar] [CrossRef] [PubMed]
- Ason, B.; van der Hoorn, J.W.A.; Chan, J.; Lee, E.; Pieterman, E.J.; Nguyen, K.K.; Di, M.; Shetterly, S.; Tang, J.; Yeh, W.-C.; et al. PCSK9 inhibition fails to alter hepatic LDLR, circulating cholesterol, and atherosclerosis in the absence of ApoE. J. Lipid. Res. 2014, 55, 2370–2379. [Google Scholar] [CrossRef] [Green Version]
- Zadelaar, S.; Kleemann, R.; Verschuren, L.; de Vries-Van der Weij, J.; van der Hoorn, J.; Princen, H.M.; Kooistra, T. Mouse models for atherosclerosis and pharmaceutical modifiers. Arterioscler Thromb Vasc. Biol. 2007, 27, 1706–1721. [Google Scholar] [CrossRef]


Publisher’s Note: MDPI stays neutral with regard to jurisdictional claims in published maps and institutional affiliations. |
© 2022 by the authors. Licensee MDPI, Basel, Switzerland. This article is an open access article distributed under the terms and conditions of the Creative Commons Attribution (CC BY) license (https://creativecommons.org/licenses/by/4.0/).
Share and Cite
Li, X.; Sun, M.; Qi, H.; Ju, C.; Chen, Z.; Gao, X.; Lin, Z. Identification of a Chromosome 1 Substitution Line B6-Chr1BLD as a Novel Hyperlipidemia Model via Phenotyping Screening. Metabolites 2022, 12, 1276. https://doi.org/10.3390/metabo12121276
Li X, Sun M, Qi H, Ju C, Chen Z, Gao X, Lin Z. Identification of a Chromosome 1 Substitution Line B6-Chr1BLD as a Novel Hyperlipidemia Model via Phenotyping Screening. Metabolites. 2022; 12(12):1276. https://doi.org/10.3390/metabo12121276
Chicago/Turabian StyleLi, Xu, Minli Sun, Hao Qi, Cunxiang Ju, Zhong Chen, Xiang Gao, and Zhaoyu Lin. 2022. "Identification of a Chromosome 1 Substitution Line B6-Chr1BLD as a Novel Hyperlipidemia Model via Phenotyping Screening" Metabolites 12, no. 12: 1276. https://doi.org/10.3390/metabo12121276