
Quantitative Analyses and Validation of Phospholipids and Sphingolipids in Ischemic Rat Brains


Abstract
:1. Introduction
2. Materials and Methods
2.1. Chemicals
2.2. Animal Handling and Tissue Collection
2.3. Tissue Lipid Extraction
2.4. Hydrophilic Interaction Chromatography–Tandem Mass Spectrometry
2.5. Data Analysis
3. Results
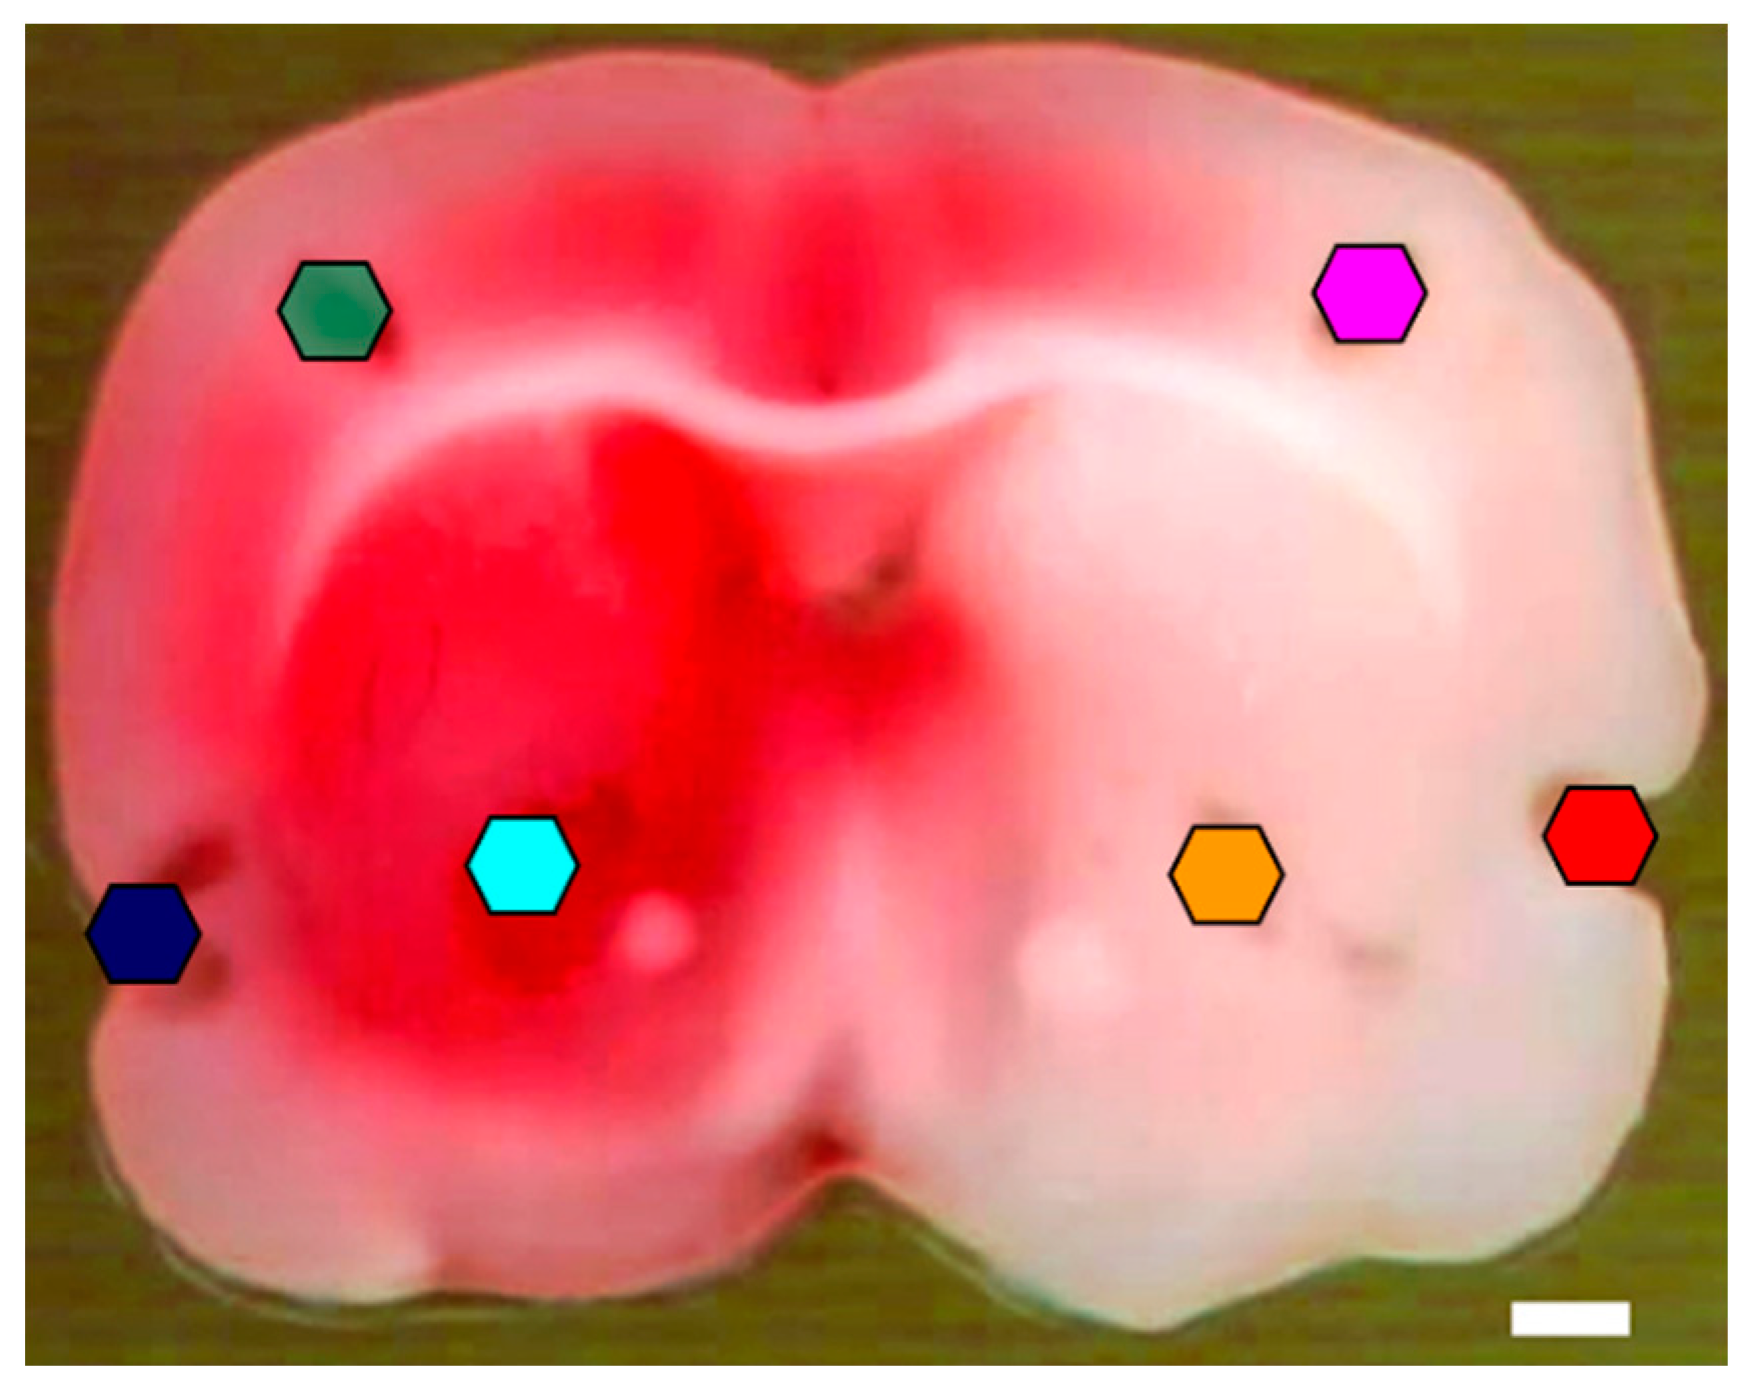
3.1. Histology
3.2. HILIC-MS/MS
3.3. Multivariate Analysis of PL and SL Information in the Brain Tissue
3.3.1. Partial Least Square Discriminant Analysis (PLS-DA)
3.3.2. Orthogonal Partial Least Square Discriminate Analyses (OPLS-DA), Volcano Plot Analyses, Modeling, and Validation of Lipid Markers
Normal versus Ischemic Brain Parenchyma
Temporal Cortex
Parietal Cortex
Striatum
4. Discussion
Supplementary Materials
Author Contributions
Funding
Institutional Review Board Statement
Data Availability Statement
Conflicts of Interest
References
- Janardhan, V.; Qureshi, A.I. Mechanisms of ischemic brain injury. Curr. Cardiol. Rep. 2004, 6, 117–123. [Google Scholar] [CrossRef] [PubMed]
- Durukan, A.; Tatlisumak, T. Acute ischemic stroke: Overview of major experimental rodent models, pathophysiology, and therapy of focal cerebral ischemia. Pharmacol. Biochem. Behav. 2007, 87, 179–197. [Google Scholar] [CrossRef] [PubMed]
- Essa, H.; Hill, A.M.; Lip, G.Y.H. Atrial Fibrillation and Stroke. Card. Electrophysiol. Clin. 2021, 13, 243–255. [Google Scholar] [CrossRef] [PubMed]
- Barone, F.C.; Feuerstein, G.Z. Inflammatory mediators and stroke: New opportunities for novel therapeutics. J. Cereb. Blood Flow Metab. 1999, 19, 819–834. [Google Scholar] [CrossRef] [PubMed] [Green Version]
- Yamasaki, Y.; Matsuura, N.; Shozuhara, H.; Onodera, H.; Itoyama, Y.; Kogure, K. Interleukin-1 as a pathogenetic mediator of ischemic brain damage in rats. Stroke 1995, 26, 676–680; discussion 681. [Google Scholar] [CrossRef]
- Kogure, K.; Yamasaki, Y.; Matsuo, Y.; Kato, H.; Onodera, H. Inflammation of the brain after ischemia. Acta Neurochir. Suppl. 1996, 66, 40–43. [Google Scholar]
- Tzeng, S.F.; Hsiao, H.Y.; Mak, O.T. Prostaglandins and cyclooxygenases in glial cells during brain inflammation. Curr. Drug Targets Inflamm. Allergy 2005, 4, 335–340. [Google Scholar] [CrossRef]
- Candelario-Jalil, E.; Mhadu, N.H.; González-Falcón, A.; García-Cabrera, M.; Muñoz, E.; León, O.S.; Fiebich, B.L. Effects of the cyclooxygenase-2 inhibitor nimesulide on cerebral infarction and neurological deficits induced by permanent middle cerebral artery occlusion in the rat. J. Neuroinflamm. 2005, 2, 3–13. [Google Scholar] [CrossRef] [Green Version]
- Candelario-Jalil, E.; González-Falcón, A.; García-Cabrera, M.; León, O.S.; Fiebich, B.L. Post-ischaemic treatment with the cyclooxygenase-2 inhibitor nimesulide reduces blood-brain barrier disruption and leukocyte infiltration following transient focal cerebral ischaemia in rats. J. Neurochem. 2007, 100, 1108–1120. [Google Scholar] [CrossRef] [Green Version]
- Candelario-Jalil, E.; Taheri, S.; Yang, Y.; Sood, R.; Grossetete, M.; Estrada, E.Y.; Fiebich, B.L.; Rosenberg, G.A. Cyclooxygenase inhibition limits blood-brain barrier disruption following intracerebral injection of tumor necrosis factor-alpha in the rat. J. Pharmacol. Exp. Ther. 2007, 323, 488–498. [Google Scholar] [CrossRef]
- Candelario-Jalil, E. Nimesulide as a promising neuroprotectant in brain ischemia: New experimental evidences. Pharmacol. Res. 2008, 57, 266–273. [Google Scholar] [CrossRef] [PubMed]
- Yagami, T.; Ueda, K.; Hata, S.; Kuroda, T.; Itoh, N.; Sakaguchi, G.; Okamura, N.; Sakaeda, T.; Fujimoto, M. S-2474, a novel nonsteroidal anti-inflammatory drug, rescues cortical neurons from human group IIA secretory phospholipase A(2)-induced apoptosis. Neuropharmacology 2005, 49, 174–184. [Google Scholar] [CrossRef] [PubMed]
- Wang, H.Y.; Liu, C.B.; Wu, H.W.; Kuo, J.S. Direct profiling of phospholipids and lysophospholipids in rat brain sections after ischemic stroke. Rapid Commun. Mass Spectrom. 2010, 24, 2057–2064. [Google Scholar] [CrossRef]
- Koizumi, S.; Yamamoto, S.; Hayasaka, T.; Konishi, Y.; Yamaguchi-Okada, M.; Goto-Inoue, N.; Sugiura, Y.; Setou, M.; Namba, H. Imaging mass spectrometry revealed the production of lyso-phosphatidylcholine in the injured ischemic rat brain. Neuroscience 2010, 168, 219–225. [Google Scholar] [CrossRef] [PubMed]
- Wang, H.Y.; Wu, H.W.; Tsai, P.J.; Liu, C.B. MALDI-mass spectrometry imaging of desalted rat brain sections reveals ischemia-mediated changes of lipids. Anal. Bioanal. Chem. 2012, 404, 113–124. [Google Scholar] [CrossRef] [PubMed]
- Shanta, S.R.; Choi, C.S.; Lee, J.H.; Shin, C.Y.; Kim, Y.J.; Kim, K.H.; Kim, K.P. Global changes in phospholipids identified by MALDI MS in rats with focal cerebral ischemia. J. Lipid. Res. 2012, 53, 1823–1831. [Google Scholar] [CrossRef] [PubMed] [Green Version]
- Spratt, N.J.; Fernandez, J.; Chen, M.; Rewell, S.; Cox, S.; van Raay, L.; Hogan, L.; Howells, D.W. Modification of the method of thread manufacture improves stroke induction rate and reduces mortality after thread-occlusion of the middle cerebral artery in young or aged rats. J. Neurosci. Methods 2006, 155, 285–290. [Google Scholar] [CrossRef]
- Paxinos, G.; Watson, C. The Rat Brain in Stereotaxic Coordinates, 3rd ed.; Academic Press, Inc.: San Diego, CA, USA, 1997. [Google Scholar]
- Bligh, E.G.; Dyer, W.J. A rapid method of total lipid extraction and purification. Can. J. Biochem. Physiol. 1959, 37, 911–917. [Google Scholar] [CrossRef]
- Ivanova, P.T.; Milne, S.B.; Byrne, M.O.; Xiang, Y.; Brown, H.A. Glycerophospholipid identification and quantitation by electrospray ionization mass spectrometry. Methods Enzymol. 2007, 432, 21–57. [Google Scholar] [CrossRef]
- Schwalbe-Herrmann, M.; Willmann, J.; Leibfritz, D. Separation of phospholipid classes by hydrophilic interaction chromatography detected by electrospray ionization mass spectrometry. J. Chromatogr. A 2010, 1217, 5179–5183. [Google Scholar] [CrossRef]
- Duncan, M.W.; Gale, P.J.; Yergey, A.L. The Principles of Quantitative Mass Spectrometry; Rockpool Production LLC.: Denver, CO, USA, 2006. [Google Scholar]
- Xia, Y.Q.; Jemal, M. Phospholipids in liquid chromatography/mass spectrometry bioanalysis: Comparison of three tandem mass spectrometric techniques for monitoring plasma phospholipids, the effect of mobile phase composition on phospholipids elution and the association of phospholipids with matrix effects. Rapid Commun. Mass Spectrom. 2009, 23, 2125–2138. [Google Scholar] [CrossRef] [PubMed]
- Hsu, F.F.; Turk, J.; Stewart, M.E.; Downing, D.T. Structural studies on ceramides as lithiated adducts by low energy collisional-activated dissociation tandem mass spectrometry with electrospray ionization. J. Am. Soc. Mass Spectrom. 2002, 13, 680–695. [Google Scholar] [CrossRef] [Green Version]
- Pang, Z.; Chong, J.; Zhou, G.; de Lima Morais, D.A.; Chang, L.; Barrette, M.; Gauthier, C.; Jacques, P.E.; Li, S.; Xia, J. MetaboAnalyst 5.0: Narrowing the gap between raw spectra and functional insights. Nucleic Acids Res. 2021, 49, W388–W396. [Google Scholar] [CrossRef] [PubMed]
- Ting, K.M. Confusion Matrix. In Encyclopedia of Machine Learning; Sammut, C., Webb, G.I., Eds.; Springer: Boston, MA, USA, 2010; p. 209. [Google Scholar] [CrossRef]
- Lands, W.E. Metabolism of glycerolipides; a comparison of lecithin and triglyceride synthesis. J. Biol. Chem. 1958, 231, 883–888. [Google Scholar] [CrossRef]
- Wang, B.; Tontonoz, P. Phospholipid Remodeling in Physiology and Disease. Annu. Rev. Physiol. 2019, 81, 165–188. [Google Scholar] [CrossRef]
- Mulder, I.A.; Ogrinc Potocnik, N.; Broos, L.A.M.; Prop, A.; Wermer, M.J.H.; Heeren, R.M.A.; van den Maagdenberg, A. Distinguishing core from penumbra by lipid profiles using Mass Spectrometry Imaging in a transgenic mouse model of ischemic stroke. Sci. Rep. 2019, 9, 1090. [Google Scholar] [CrossRef] [Green Version]
- Nielsen, M.M.; Lambertsen, K.L.; Clausen, B.H.; Meyer, M.; Bhandari, D.R.; Larsen, S.T.; Poulsen, S.S.; Spengler, B.; Janfelt, C.; Hansen, H.S. Mass spectrometry imaging of biomarker lipids for phagocytosis and signalling during focal cerebral ischaemia. Sci. Rep. 2016, 6, 39571. [Google Scholar] [CrossRef] [Green Version]
- Wang, Z.; Cai, Y.; Wang, Y.; Zhou, X.; Zhang, Y.; Lu, H. Improved MALDI imaging MS analysis of phospholipids using graphene oxide as new matrix. Sci. Rep. 2017, 7, 44466. [Google Scholar] [CrossRef] [Green Version]
- Bowman, A.P.; Bogie, J.F.J.; Hendriks, J.J.A.; Haidar, M.; Belov, M.; Heeren, R.M.A.; Ellis, S.R. Evaluation of lipid coverage and high spatial resolution MALDI-imaging capabilities of oversampling combined with laser post-ionisation. Anal. Bioanal. Chem. 2020, 412, 2277–2289. [Google Scholar] [CrossRef]


| Normal vs. Ischemic Brain Parenchyma | ||||||
|---|---|---|---|---|---|---|
| Lipid Species | t-Statistic | p Value | −Log (p) | FDR | FDR of Lipid Markers by S-Plot | FDR of Lipid Markers by Volcano Plot |
| LPC18:1 | 2.1542 | 0.0468 | 1.3296 | 0.093625 | ||
| LPC22:6 | 6.3667 | 9 × 10⁻⁶ | 5.0293 | 0.000318 | 0.000318 | 0.000318 |
| LPE18:0 | 2.2424 | 0.0395 | 1.4039 | 0.089423 | 0.089423 | |
| LPE20:4 | 3.9538 | 0.0011 | 2.9441 | 0.012889 | 0.012889 | 0.012889 |
| LPE22:6 | 5.0757 | 0.0001 | 3.9493 | 0.001910 | 0.001910 | 0.001910 |
| PC16:0/16:0 | −3.376 | 0.0039 | 2.4145 | 0.021820 | ||
| PC16:0/18:0 | 2.8979 | 0.0105 | 1.9793 | 0.032414 | ||
| PC16:0/18:1 | −3.1538 | 0.0061 | 2.2114 | 0.027730 | ||
| PC16:0/22:6 | −2.3093 | 0.0346 | 1.4608 | 0.084052 | ||
| PC18:0/18:2 | −3.5085 | 0.0029 | 2.5359 | 0.021820 | 0.0218 | |
| PC20:4/22:6 | 3.0017 | 0.0085 | 2.0731 | 0.031922 | 0.0319 | |
| PE16:0/22:6 | −2.6302 | 0.0182 | 1.7402 | 0.047575 | ||
| PE18:0/20:4 | −3.1253 | 0.0065 | 2.1854 | 0.027730 | ||
| PE18:0/22:6 | −2.1648 | 0.0459 | 1.3385 | 0.093625 | ||
| SM16:0 | −3.4618 | 0.0032 | 2.4932 | 0.021820 | 0.021820 | |
| SM18:0 | −2.9298 | 0.0098 | 2.0081 | 0.032414 | 0.032414 | |
| SM20:0 | −2.8117 | 0.0125 | 1.9019 | 0.035516 | 0.035516 | |
| Sum of FDR | 0.6766 | 0.0151 | 0.2480 | |||
| S-plot-identified Lipid Markers | Volcano-plot-identified Lipid Markers | |||||||||||
|---|---|---|---|---|---|---|---|---|---|---|---|---|
| Accu | Prec | Sens | Spec | FPR | FNR | Accu | Prec | Sens | Spec | FPR | FNR | |
| Normal vs. Ischemia | 1.0000 | 1.0000 | 1.0000 | 1.0000 | 0.0000 | 0.0000 | 0.9839 | 1.0000 | 0.9677 | 1.0000 | 0.0000 | 0.0323 |
| N-TCX vs. I-TCX | 1.0000 | 1.0000 | 1.0000 | 1.0000 | 0.0000 | 0.0000 | 0.9375 | 1.0000 | 0.8750 | 1.0000 | 0.0000 | 0.1250 |
| N-PCX vs. I-PCX | 1.0000 | 1.0000 | 1.0000 | 1.0000 | 0.0000 | 0.0000 | 0.9375 | 0.8889 | 1.0000 | 0.8750 | 0.1250 | 0.0000 |
| N-ST vs. I-ST | 1.0000 | 1.0000 | 1.0000 | 1.0000 | 0.0000 | 0.0000 | 1.0000 | 1.0000 | 1.0000 | 1.0000 | 0.0000 | 0.0000 |
| N-TCX vs. I-TCX | ||||||
|---|---|---|---|---|---|---|
| Lipid Species | t-Statistic | p Value | −Log (p) | FDR | FDR of Lipid Markers by S-Plot | FDR of Lipid Markers by Volcano Plot |
| Cer18:1 | 3.2239 | 0.009115 | 2.0402 | 0.011478 | 0.011478 | |
| Cer22:0 | −8.2726 | 8.77 × 10⁻⁶ | 5.057 | 2.48 × 10⁻⁵ | 2.48 × 10⁻⁵ | 2.48 × 10⁻⁵ |
| Cer24:0 | 2.2796 | 0.045819 | 1.339 | 0.055638 | ||
| LPC16:0 | 11.6320 | 3.91 × 10⁻⁷ | 6.4073 | 1.66 × 10⁻⁶ | 1.66 × 10⁻⁶ | 1.66 × 10⁻⁶ |
| LPC18:0 | 5.4214 | 0.000292 | 3.534 | 0.000473 | 0.000473 | 0.000473 |
| LPC18:1 | 4.8972 | 0.000626 | 3.2036 | 0.000967 | 0.000967 | 0.000967 |
| LPC20:4 | 6.4867 | 7.01 × 10⁻⁵ | 4.1541 | 0.000149 | 0.000149 | 0.000149 |
| LPC22:6 | 6.1361 | 0.000110 | 3.9573 | 0.000216 | 0.000216 | 0.000216 |
| LPE16:0 | 9.5923 | 2.32 × 10⁻⁶ | 5.6336 | 7.90 × 10⁻⁶ | 7.90 × 10⁻⁶ | 7.90 × 10⁻⁶ |
| LPE18:0 | 17.2700 | 8.96 × 10⁻⁹ | 8.0476 | 9.88 × 10⁻⁸ | 9.88 × 10⁻⁸ | 9.88 × 10⁻⁸ |
| LPE20:4 | 7.9117 | 1.30 × 10⁻⁵ | 4.8869 | 3.15 × 10⁻⁵ | 3.15 × 10⁻⁵ | 3.15 × 10⁻⁵ |
| LPE22:6 | 4.4734 | 0.001191 | 2.924 | 0.001687 | 0.001687 | |
| PC16:0/16:0 | −19.5290 | 2.71 × 10⁻⁹ | 8.5672 | 9.21 × 10⁻⁸ | 9.21 × 10⁻⁸ | |
| PC16:0/18:0 | 6.1086 | 0.000114 | 3.9416 | 0.000216 | 0.000216 | |
| PC16:0/18:1 | −10.0410 | 1.53 × 10⁻⁶ | 5.815 | 5.78 × 10⁻⁶ | 5.78 × 10⁻⁶ | |
| PC16:0/20:4 | −5.6134 | 0.000224 | 3.6507 | 0.00038 | 0.00038 | |
| PC16:0/22:6 | −16.8140 | 1.16 × 10⁻⁸ | 7.9349 | 9.88 × 10⁻⁸ | 9.88 × 10⁻⁸ | 9.88 × 10⁻⁸ |
| PC18:0/18:1 | −7.5211 | 2.01 × 10⁻⁵ | 4.6961 | 4.56 × 10⁻⁵ | 4.56 × 10⁻⁵ | |
| PC18:0/18:2 | −13.0870 | 1.29 × 10⁻⁷ | 6.8904 | 7.29 × 10⁻⁷ | 7.29 × 10⁻⁷ | 7.29 × 10⁻⁷ |
| PC18:0/20:4 | −6.0154 | 0.000129 | 3.888 | 0.000232 | 0.000232 | |
| PC18:0/22:6 | −4.7915 | 0.000733 | 3.1349 | 0.001084 | 0.001084 | |
| PE16:0/18:1 | −3.5068 | 0.005662 | 2.2471 | 0.007404 | 0.007404 | |
| PE16:0/22:6 | −8.0183 | 1.15 × 10⁻⁵ | 4.9377 | 3.02 × 10⁻⁵ | 3.02 × 10⁻⁵ | 3.02 × 10⁻⁵ |
| PE18:0/18:1 | −11.7640 | 3.52 × 10⁻⁷ | 6.4533 | 1.66 × 10⁻⁶ | 1.66 × 10⁻⁶ | 1.66 × 10⁻⁶ |
| PE18:0/18:2 | −9.4471 | 2.67 × 10⁻⁶ | 5.5734 | 8.25 × 10⁻⁶ | 8.25 × 10⁻⁶ | 8.25 × 10⁻⁶ |
| PE18:0/20:4 | −17.1760 | 9.45 × 10⁻⁹ | 8.0245 | 9.88 × 10⁻⁸ | 9.88 × 10⁻⁸ | 9.88 × 10⁻⁸ |
| PE18:0/22:6 | −13.3840 | 1.04 × 10⁻⁷ | 6.983 | 7.07 × 10⁻⁷ | 7.07 × 10⁻⁷ | |
| SM18:0 | −4.3894 | 0.001357 | 2.8673 | 0.001846 | 0.001846 | 0.001846 |
| Sum of FDR | 0.0819 | 0.0074 | 0.0226 | |||
| N-PCX vs. I-PCX | ||||||
|---|---|---|---|---|---|---|
| Lipid Species | t-Statistic | p Value | −Log (p) | FDR | FDR of Lipid Marker by S-Plot | FDR of Lipid Marker by Volcano Plot |
| Cer16:0 | 4.2181 | 0.001777 | 2.7503 | 0.005035 | 0.005035 | 0.005035 |
| Cer24:0 | 4.0590 | 0.002290 | 2.6401 | 0.005990 | 0.005990 | |
| LPC18:0 | 3.3297 | 0.007622 | 2.1179 | 0.014397 | 0.014397 | |
| LPC18:1 | 3.4011 | 0.006758 | 2.1702 | 0.013516 | 0.013516 | |
| LPC20:4 | 3.6626 | 0.004370 | 2.3595 | 0.009287 | 0.009287 | |
| LPC22:6 | 3.6989 | 0.004116 | 2.3856 | 0.009287 | 0.009287 | |
| LPE18:1 | 2.8200 | 0.018159 | 1.7409 | 0.028064 | ||
| LPE22:6 | 7.6249 | 1.79 × 10⁻⁵ | 4.7475 | 9.59 × 10⁻⁵ | 9.59 × 10⁻⁵ | 9.59 × 10⁻⁵ |
| PC16:0/16:0 | −11.191 | 5.62 × 10⁻⁷ | 6.2506 | 1.91 × 10⁻⁵ | 1.91 × 10⁻⁵ | |
| PC16:0/18:0 | 3.7907 | 0.003539 | 2.4511 | 0.008596 | ||
| PC16:0/18:1 | −4.4726 | 0.001193 | 2.9235 | 0.003686 | 0.003686 | |
| PC16:0/20:4 | −8.6856 | 5.69 × 10⁻⁶ | 5.2448 | 9.59 × 10⁻⁵ | 9.59 × 10⁻⁵ | |
| PC16:0/22:6 | −8.2117 | 9.36 × 10⁻⁶ | 5.0287 | 9.59 × 10⁻⁵ | 9.59 × 10⁻⁵ | |
| PC18:0/18:1 | 7.7529 | 1.55 × 10⁻⁵ | 4.8101 | 9.59 × 10⁻⁵ | 9.59 × 10⁻⁵ | |
| PC18:0/18:2 | −7.5378 | 1.98 × 10⁻⁵ | 4.7044 | 9.59 × 10⁻⁵ | 9.59 × 10⁻⁵ | 9.59 × 10⁻⁵ |
| PC18:0/20:4 | −2.3739 | 0.039018 | 1.4087 | 0.057679 | ||
| PC20:4/22:6 | 6.0987 | 0.000116 | 3.936 | 0.000493 | 0.000493 | 0.000493 |
| PE16:0/18:1 | −2.9743 | 0.013943 | 1.8557 | 0.022574 | ||
| PE16:0/22:6 | −3.0933 | 0.011379 | 1.9439 | 0.019345 | ||
| PE18:0/18:2 | −2.2984 | 0.044375 | 1.3529 | 0.062864 | ||
| PE18:0/20:4 | −5.3838 | 0.000308 | 3.5108 | 0.001165 | 0.001165 | |
| PE18:0/22:6 | −3.1678 | 0.010025 | 1.9989 | 0.017940 | ||
| SM18:0 | −7.6222 | 1.79 × 10⁻⁵ | 4.7462 | 9.59 × 10⁻⁵ | 9.59 × 10⁻⁵ | 9.59 × 10⁻⁵ |
| SM20:0 | −4.4753 | 0.001188 | 2.9253 | 0.003686 | 0.003686 | 0.003686 |
| Sum of FDR | 0.2842 | 0.0147 | 0.0620 | |||
| N-ST vs. I-ST | ||||||
|---|---|---|---|---|---|---|
| Lipid Species | t-Statistic | p Value | −Log (p) | FDR | FDR of Lipid Marker by S-Plot | FDR of Lipid Markers by Volcano Plot |
| Cer22:0 | −3.2757 | 0.008349 | 2.0784 | 0.014941 | ||
| LPC16:0 | 8.4571 | 7.21 × 10⁻⁶ | 5.1418 | 7.89 × 10⁻⁵ | 7.89 × 10⁻⁵ | 7.89 × 10⁻⁵ |
| LPC18:0 | 3.0214 | 0.012864 | 1.8906 | 0.021869 | ||
| LPC18:1 | 6.6302 | 5.85 × 10⁻⁵ | 4.2326 | 0.000249 | 0.000249 | 0.000249 |
| LPC20:4 | 3.7674 | 0.003677 | 2.4345 | 0.007354 | 0.007354 | |
| LPC22:6 | 8.2199 | 9.28 × 10⁻⁶ | 5.0326 | 7.89 × 10⁻⁵ | 7.89 × 10⁻⁵ | 7.89 × 10⁻⁵ |
| LPE18:0 | 2.5818 | 0.027330 | 1.5634 | 0.042237 | 0.042237 | |
| LPE18:1 | 5.936 | 0.000144 | 3.8419 | 0.000544 | 0.000544 | 0.000544 |
| LPE20:4 | 6.8193 | 4.63 × 10⁻⁵ | 4.3345 | 0.000225 | 0.000225 | 0.000225 |
| LPE22:6 | 14.379 | 5.25 × 10⁻⁸ | 7.2802 | 1.78 × 10⁻⁶ | 1.78 × 10⁻⁶ | 1.78 × 10⁻⁶ |
| PC16:0/18:0 | 10.106 | 1.44 × 10⁻⁶ | 5.8409 | 2.45 × 10⁻⁵ | 2.45 × 10⁻⁵ | 2.45 × 10⁻⁵ |
| PC16:0/22:6 | 3.8079 | 0.003441 | 2.4633 | 0.007313 | ||
| PC18:0/18:1 | 5.6514 | 0.000212 | 3.6736 | 0.000712 | 0.000712 | |
| PC18:0/18:2 | −2.7602 | 0.020122 | 1.6963 | 0.032578 | ||
| PC18:0/20:4 | 3.9916 | 0.002553 | 2.593 | 0.006199 | 0.006199 | |
| PC20:4/22:6 | 5.5914 | 0.000230 | 3.6374 | 0.000712 | 0.000712 | 0.000712 |
| PE16:0/18:1 | −5.268 | 0.000364 | 3.4391 | 0.001031 | 0.001031 | |
| PE16:0/22:6 | −7.0886 | 3.34 × 10⁻⁵ | 4.4762 | 0.000213 | 0.000213 | |
| PE18:0/18:2 | −2.4867 | 0.032172 | 1.4925 | 0.047558 | ||
| PE18:0/20:4 | −3.5899 | 0.004930 | 2.3071 | 0.009313 | ||
| SM16:0 | −6.991 | 3.76 × 10⁻⁵ | 4.4252 | 0.000213 | 0.000213 | 0.000213 |
| SM18:0 | −4.9257 | 0.000600 | 3.222 | 0.001569 | 0.001569 | 0.001569 |
| SM24:1 | −3.8796 | 0.003061 | 2.5142 | 0.006938 | 0.006938 | |
| Sum of FDR | 0.2020 | 0.0119 | 0.0602 | |||
Publisher’s Note: MDPI stays neutral with regard to jurisdictional claims in published maps and institutional affiliations. |
© 2022 by the authors. Licensee MDPI, Basel, Switzerland. This article is an open access article distributed under the terms and conditions of the Creative Commons Attribution (CC BY) license (https://creativecommons.org/licenses/by/4.0/).
Share and Cite
Huang, C.-Y.; Tsai, P.-J.; Wu, H.-W.; Chen, I.-T.; Wang, H.-Y.J. Quantitative Analyses and Validation of Phospholipids and Sphingolipids in Ischemic Rat Brains. Metabolites 2022, 12, 1075. https://doi.org/10.3390/metabo12111075
Huang C-Y, Tsai P-J, Wu H-W, Chen I-T, Wang H-YJ. Quantitative Analyses and Validation of Phospholipids and Sphingolipids in Ischemic Rat Brains. Metabolites. 2022; 12(11):1075. https://doi.org/10.3390/metabo12111075
Chicago/Turabian StyleHuang, Chiung-Yin, Ping-Ju Tsai, Hsuan-Wen Wu, I-Ting Chen, and Hay-Yan J. Wang. 2022. "Quantitative Analyses and Validation of Phospholipids and Sphingolipids in Ischemic Rat Brains" Metabolites 12, no. 11: 1075. https://doi.org/10.3390/metabo12111075