Review

Mass Spectrometry-Based Zebrafish Toxicometabolomics: A Review of Analytical and Data Quality Challenges

by
Katyeny Manuela da Silva
1,*,
Elias Iturrospe
1,2,
Chloe Bars
3,
Dries Knapen
4,
Steven Van Cruchten
3,
Adrian Covaci
1 and
Alexander L. N. van Nuijs
1,*
1
Toxicological Center, Department of Pharmaceutical Sciences, Faculty of Pharmaceutical, Biomedical and Veterinary Sciences, Campus Drie Eiken, University of Antwerp, Universiteitsplein 1, 2610 Antwerp, Belgium
2
Department of In Vitro Toxicology and Dermato-Cosmetology, Faculty of Medicine and Pharmacy, Campus Jette, Free University of Brussels, Laarbeeklaan 103, 1090 Brussels, Belgium
3
Comparative Perinatal Development, Department of Veterinary Sciences, Faculty of Pharmaceutical, Biomedical and Veterinary Sciences, Campus Drie Eiken, University of Antwerp, Universiteitsplein 1, 2610 Antwerp, Belgium
4
Zebrafishlab, Veterinary Physiology and Biochemistry, Department of Veterinary Sciences, Faculty of Pharmaceutical, Biomedical and Veterinary Sciences, Campus Drie Eiken, University of Antwerp, Universiteitsplein 1, 2610 Antwerp, Belgium
*
Authors to whom correspondence should be addressed.
Metabolites 2021, 11(9), 635; https://doi.org/10.3390/metabo11090635
Submission received: 30 August 2021 / Revised: 13 September 2021 / Accepted: 14 September 2021 / Published: 17 September 2021
(This article belongs to the Special Issue Zebrafish: A Model for the Study of Human Metabolism Diseases)

Abstract

:
Metabolomics has achieved great progress over the last 20 years, and it is currently considered a mature research field. As a result, the number of applications in toxicology, biomarker, and drug discovery has also increased. Toxicometabolomics has emerged as a powerful strategy to provide complementary information to study molecular-level toxic effects, which can be combined with a wide range of toxicological assessments and models. The zebrafish model has gained importance in recent decades as a bridging tool between in vitro assays and mammalian in vivo studies in the field of toxicology. Furthermore, as this vertebrate model is a low-cost system and features highly conserved metabolic pathways found in humans and mammalian models, it is a promising tool for toxicometabolomics. This short review aims to introduce zebrafish researchers interested in understanding the effects of chemical exposure using metabolomics to the challenges and possibilities of the field, with a special focus on toxicometabolomics-based mass spectrometry. The overall goal is to provide insights into analytical strategies to generate and identify high-quality metabolomic experiments focusing on quality management systems (QMS) and the importance of data reporting and sharing.

1. Introduction

Chemical safety is an emerging global concern due to the continuous growth of chemicals being produced and released into the environment. Therefore, toxicological assessments of short- and long-term exposure are crucial to evaluate the effects (inter alia latent and transgenerational) of a wide range of chemicals on human and environmental health [1]. As a result, in silico, in vitro and in vivo toxicological models are needed, as both short-term toxicity and transgenerational studies in humans are challenging, especially due to ethical constraints and critical confounding factors such as diet, different social exposures, and long lifespan (e.g., studies of toxic effects of low-dose and mixtures of chemicals) [2,3].
In this regard, the zebrafish (Danio rerio) (embryos, larvae, and adult fish) is a medium-to-high-throughput vertebrate toxicological model that is routinely used to provide relevant information regarding the acute and long-term effects of xenobiotics [4,5,6]. It encompasses multicellular biochemical processes and the conservation of several metabolic and physiological processes also found in mammals (e.g., mitochondrial metabolism, the role of lipid and glucose metabolism in embryonic development, endocrine axes regulating energy metabolism, physiology of the digestive system, etc.), illustrating the translational relevance of the model to study the effects of chemicals on metabolic pathways [4,7,8].
In the last 20 years, metabolomics, the study of small endogenous organic molecules (<1500 Da) in biological samples or organisms to find key metabolites in various biological processes, has been used as a promising alternative and/or additional tool to traditional toxicological assays [9,10]. Metabolic changes are dependent on several factors such as diet, sex, and disease [10]. Thus, a high degree of controlled conditions in toxicological models makes them suitable platforms for metabolomics with a wide range of applications, including chemical grouping, the discovery of points of departure from benchmarking dosing, and cross-species extrapolation of toxicity pathways [9,11]. For instance, metabolites and hence pathways affected by xenobiotic exposure can provide data to support the development of adverse outcome pathways (AOP). On the one hand, metabolite levels could provide relevant mechanistic information underlying key events at the molecular level [12]. However, in certain toxicological scenarios, specific metabolites could also be essential causally linked components of a particular toxicity pathway and thus be directly relevant as key events of the pathway. Read-across and grouping approaches based on structural similarity using metabolomics have been successfully applied to reduce the risk of uncertainty in the characterization of the toxicity profile of analog chemicals (e.g., 3-aminopropanol and 2-aminoethanol) [13].
The combination of the zebrafish model and metabolomics has shown promising results for toxicological and ecotoxicological applications (e.g., to study the effect of endocrine-disrupting chemicals) and for investigations on the mechanisms of metabolic diseases [4,9,14]. For instance, Ortiz-Villanueva et al. applied an untargeted metabolomics approach to investigate the effect of three endocrine disruptors (bisphenol A, perfluorooctane sulfonate and tributyltin) at sublethal doses on zebrafish embryos and found that similar biochemical pathways were affected by these three chemicals [15]. Similarly, perfluoroethercarboxylic acids (PFECA), a new generation of per- and polyfluoroalkyl substances (PFAS), were found to have similar metabolic profiles associated with the toxicity of discontinued PFAS in zebrafish embryos [16]. Further discussion of omics approaches for zebrafish as a screening model can be found in a recent review article by Lai et al. [5]. In this study, Lai et al. divided the experimental approaches for environmental toxicant studies into two major studies: transgenerational (epigenomics) and non-transgenerational studies (transcriptomics, proteomics, and metabolomics) showing how metabolomics experiments can generate complementary toxicity information that should be confirmed by functional studies and molecular biological experiments for validation.
The number of studies including metabolomics in zebrafish has sharply increased since 2011 (from four studies in 2011 to seventy in 2020 found in the PubMed database (https://pubmed.ncbi.nlm.nih.gov/, accessed on 13 July 2021), with many of them already indexed to the Zebrafish Information Network (ZFIN) (https://zfin.org/, accessed on 13 July 2021). Due to the complexity of data acquisition, processing, and interpretation, in addition to an appropriate study design, a quality management system (QMS) needs to be included and assessed during the entire metabolomics workflow. The current manuscript will address the analytical challenges and QMS of the zebrafish model (embryo, larvae, and adult fish) to demonstrate its application from a metabolomics perspective. Information was collected from recent literature indexed to PubMed and ZFIN search engines using combinations of the following keywords: metabolomics, lipidomics, zebrafish, and Danio Rerio. Recent articles (>2017) focusing on mass spectrometry toxicological applications using zebrafish were given preference. In addition, general metabolomics studies focusing on QMS and data analysis applications were included to introduce zebrafish researchers to the field and expand research on zebrafish toxicometabolomics.

2. Experimental Design

2.1. Sample Collection

Different standardized fish toxicity test guidelines are available that could be useful for designing experiments allowing the collection of samples for metabolomics analyses. For example, Section 2 of the OECD’s (Organisation for Economic Co-operation and Development) Test Guidelines lists a number of different frequently used fish test guidelines (e.g., TGs 236, 210, 229, 234, and 203), often specifically tailored to the zebrafish as the model organism. Combined, these available test guidelines provide opportunities for studying both acute and chronic effects in all zebrafish life stages, ranging from embryos to larvae, juveniles, and adults, as well as transgenerational assays. For example, the Fish Embryo Acute Toxicity (FET) Test (TG 236) outlines an acute embryonic exposure design from 0–96 hpf, which covers the organogenesis period [17]. For zebrafish metabolomics studies, short-term exposure effects could be assessed in terms of hours (e.g., 2.5–4 h; as described in, e.g., TG 236 in embryos and TG 203 in adult fish) or medium- to long-term exposures in the larval period (e.g., 3–7 days) [15,18,19,20,21,22,23,24]. For chronic exposure, test guidelines are available for larval fish up to 30 days (e.g., TG 210) and for adult fish up to 20 or 60 days (e.g., TGs 229 and 234), when individually dissected fish tissues (e.g., liver, brain, intestinal samples, gonads) or blood samples could be analyzed [25,26,27].

2.1.1. Euthanasia

A number of recent zebrafish metabolomics studies report ice as the anesthetic [21,28,29,30] and/or euthanasia [31] technique for adult zebrafish, larvae, and embryos. Euthanasia by rapid cooling is at present not allowed in the EU legislation, but, for example, in the United States, rapid chilling (2 to 4 °C, for 10–20 s) until loss of orientation and operculum movements followed by holding times in ice-chilled water is acceptable for euthanasia of zebrafish according to the Guidelines for the Euthanasia of Animals of the American Veterinary Medical Association (AVMA). While adults can be held for a minimum of 10 min in ice-chilled water, larvae of 4–7 days post-fertilization (dpf) should be kept for at least 20 min. However, rapid chilling alone has been shown not to be a reliable method for euthanasia of embryos < 3 dpf [32].
A second commonly used method is euthanasia with an overdose of tricaine methanesulfonate (MS-222) [33,34,35,36]. MS-222 is an anesthetic approved by the United States Food and Drug Administration (FDA) for temporary immobilization that is also used for euthanasia of fish by immersion in an MS-222 buffered solution (e.g., 200 mg/L, pH 7–7.5) [32,37]. The use of MS-222 to minimize suffering through suppression of the nervous system (inhibition of sodium channels) is accepted when the fish is kept for at least 5 min in the solution following the cessation of opercular movement and/or vestibulo-ocular reflex (EU Recommendation 2007/526/EC) [37]. However, similar to rapid cooling, MS-222 has been shown to be unreliable for euthanasia of early life stages [32]. Furthermore, MS-222 is rapidly metabolized and it can also cause changes in endogenous metabolites (e.g., increased glucose, catecholamines, and cortisol levels [37,38]). Therefore, more studies comparing MS-222 and rapid chilling methods for anesthesia and/or euthanasia are needed to understand their effects for metabolomics studies.
In addition to methodological considerations primarily intended for minimizing the potential effects of a selected euthanasia method on metabolomics profiles, ethical considerations have become important as well and should ideally be balanced against purely scientific arguments. While zebrafish embryos are not considered laboratory animals for ethical purposes in Europe (EU Directive 2010/63/EU; EU Directive 2012/707/EU) up to the free-feeding stage at 120 h post-fertilization (hpf), studies in adult fish require approval from an ethical committee according to international laws [39]. The method used for euthanasia must rapidly achieve unconsciousness and death with minimal pain and be performed by certified personnel capable of recognizing and confirming the death.

2.1.2. Metabolism Quenching

Sample collection and preparation should be performed as quickly as possible to reduce the effect of additional metabolism and compound biotransformation [40]. Thus, quenching strategies are essential to ensure that the detected metabolites reflect the metabolism of the organism at the time of sampling. Importantly, for highly metabolically active matrices, such as tissues, any remaining enzymatic activity should be stopped by snap-freezing the sample with liquid nitrogen immediately after collection [40].
Although some metabolites, such as adenosine triphosphate (ATP) and glucose-6-phosphate, can turnover in terms of seconds, which is almost impossible to avoid, sodium metabisulfite and/or butylated hydroxytoluene can be added to reduce metabolite degradation [41]. It is worth mentioning that enzymatic and non-enzymatic lipid transformations (hydrolysis, oxidation, interspecies conversion) during sample collection, storage, and analytical steps are common processes that can produce misleading results (e.g., air oxidation of 1-palmitoyl-2-arachidonoyl-sn-glycero-3-phosphocholine (PAPC) [42], hydrolysis of glycerophospholipids by phospholipases A1 and A2 can increase levels of lysoglycerophospholipids and free fatty acid species [41], extraction with methanol/ethanol can lead to the formation of exogenous phosphatidylmethanol and phosphatidylethanol species mediated by phospholipase D [41,43]). As suggested by Ulmer et al. in a recent review on strategies and consideration for addressing lipid changes, lipid stability studies should be included during analytical method development [41]. The strategies mentioned in this latter work to avoid degradation or turn-over of metabolites include sample handling at low temperature (e.g., cold room), snap-freezing directly after collection, the use of additives to reduce enzymatic activity (e.g., 5 mM phenylmethanesulfonyl fluoride before sample extraction) and antioxidants (e.g., butylated hydroxyanisole, ascorbic acid, transferrin, deferoxamine) [41]. Preferably, freeze–thaw cycles should be limited, and analysis should be performed on fresh samples. However, analysis of fresh samples is often not feasible. Therefore, samples should be stored at −80 °C for as little time as possible and thawed only once for analysis [44].

2.2. Normalization and Variability

As a result of the low sample volume, embryos and larvae are usually pooled by treatment (e.g., control vs. exposed) for metabolomics analysis. Several studies reported the number of pooled individuals per sample group (e.g., 30–400) instead of weight [16,20,21,22,45,46]. Alternatively, Bai et al. performed metabolomics analysis in 168 hpf larvae using the weight of 25 mg per pooled sample group [47]. Dreier et al. normalized lipid concentrations in pooled larval zebrafish samples (n = 12) by the protein content in a targeted lipidomics study [34]. The authors mentioned that this normalization was an important step due to the low accuracy of weighing low amounts of sample. Untargeted metabolomics methods in zebrafish organs, e.g., pooled livers, also employed protein normalization to calculate the solvent volume to reconstitute the dried extracts before instrumental analysis [48]. However, there is not necessarily a strong linear correlation between protein content and metabolites, which can result in unreliable data [49]. The addition of extraction solvent depending on the tissue weight (>5 mg) can be a good strategy for pooled organs since they can still be measured with good accuracy using analytical balances [49,50,51]. Additionally, importantly, recent studies show that male and female zebrafish organs have different biochemical profiles. Pooling the samples using a 1:1 ratio based on sex can be challenging as females tend to be larger and could have an impact on the overall weight of pooled samples [52]. Moreover, adult female livers have a higher lipid content than males which is related to female reproductive function, and this should be taken into consideration while focusing on this specific organ [53]. Therefore, organ samples from males and females should preferably be processed as different groups for metabolomics.
Complex organisms usually require more replicates than in vitro cell models to unveil meaningful biological information [44,54]. However, animals in controlled environments (e.g., standardized diet, day–night cycle times, temperature environment) require a smaller amount of replicates than epidemiological studies, but it is still advisable to keep the number of replicates to at least 6 per group [10,44]. For pooled embryos and larvae, a higher number of biological replicates should be considered to account for weight differences (e.g., Teng et al. used 8 replicates per group (one hundred embryos at 96 hpf) to evaluate the mechanisms of toxicity of a fungicide, flutolanil, on zebrafish development [24]). Nevertheless, pilot studies are crucial to estimate the variance originating from the analytical and pre-analytical workflows and to assess the need for a higher number of biological and/or technical replicates.
Trutschel et al. proposed an objective approach to determine variance at multiple levels of a metabolomics workflow with a pilot study using a hierarchical experimental design [55]. The authors used an experimental design with replicates at three levels (instrumental analysis; σ i n s t r 2 , sample preparation; σ p r e p 2 and biological σ b i o 2 ) to determine the minimum number of biological and technical (sample preparation and instrumental) replicates required to detect statistically significant features with a power hierarchical type of Student’s t-test. In addition, the authors also provided an R code to determine the achievable power if the number of biological and technical replicates is limited to a specific number based on pilot datasets.

2.3. Homogenization

Homogenization is a critical step for tissue samples [56]. Water and/or organic solvents are usually added to zebrafish samples and homogenization is usually performed using a bead beater with zirconium oxide beads (bead size 0.5 mm) for a few minutes (e.g., 4–6 min) [20,57,58]. For tissue samples, two beat cycles of 40 s at 6500 Hz followed by cooling in ice after each cycle can be sufficient to homogenize the samples [56]. For zebrafish samples, most studies do not describe in detail these latter parameters and their influence on the metabolite stability and sample homogenization. In addition to bead homogenization, the sample can also be kept in an ultrasound bath for 10–15 min [15,20]. This latter step should be carefully evaluated regarding the time, temperature, and frequency applied, since it can cause metabolite degradation [59].

2.4. Metabolite Extraction

Even in early development stages, zebrafish embryos and larvae contain a diverse and dynamic range of lipids (e.g., cholesterol, glycerophospholipids, triacylglycerols) and polar metabolites that are supplied by the yolk (e.g., amino acids and fatty acids) until approximately 120 hpf [60]. Extraction methods for untargeted metabolomics need to be tailored to capture the various chemical classes within the metabolome. However, there is no single extraction method that can cover the entire metabolome and lipidome. Some classes will be overlooked, while others will be enriched [61]. Depending on the goal of the study, the extraction can also be divided into “global” metabolomics [56], polar (primary) metabolomics [62], and lipidomics [63], which can be further subdivided and tailored for less abundant lipid classes, such as polyunsaturated fatty acids [64], steroids [65], or the epilipidome [66].
In addition, the extraction method is highly dependent on the sample matrix and the platform used for analysis. For instance, gas chromatography–mass spectrometry (GC-MS)-based metabolomics often require a derivatization step (e.g., oximation followed by silylation for a wide range of small polar metabolites [62] or single silylation for sterols [67]) after metabolite extraction to increase thermal stability and volatility. Sample preparation for zebrafish metabolomics using GC-MS has been recently reviewed by Yan et al. [68].
For liquid chromatography–mass spectrometry (LC-MS) analysis, liquid extraction (LE) is often used to extract and concentrate metabolites from zebrafish samples, as shown in Table 1. Single-phase extraction by adding more of the same solvent used for protein precipitation (e.g., methanol (MeOH) and/or acetonitrile (ACN) after removing the precipitate) is commonly applied [22,69]. However, to extract and dissolve non-polar lipids, a more apolar organic solvent, such as methyl tert-butyl ether (MTBE), dichloromethane (CH₂Cl₂), or chloroform (CHCl3), is usually required [34,70]. Single-phase methods are attractive because they reduce the time and complexity of the extraction, but they are also subject to a higher matrix effect and a smaller detection range due to the polarity diversity of the molecules in the metabolome (e.g., the LogP for citric acid is −1.64, while the predicted LogP (XLogP) for lysophosphatidylcholine (18:0) and triacylglycerol (48:0) are 6.6 and 22.1, respectively) [10,40,71,72].
In order to improve the efficiency of the extraction methods, two-phase LE or two-step LE can be used to increase the range of extracted molecules (e.g., LogP from −10 to up to 25). Popular two-phase extraction techniques for untargeted metabolomics include the classic Bligh and Dyer (CHCl3/MeOH/H2O, 2/2/1.8, v/v/v) and Matyash et al. (MTBE/MeOH/H2O, 10/3/2.5, v/v/v) extraction procedures [73,74]. The latter method replaces CHCl3 for the less toxic MTBE, which also causes a change in the location of the solvent layers (the organic layer is the upper phase for Matyash’s method) [10,75]. Two-phase extractions for a low amount of sample (e.g., 20 μL of plasma, 106 cells, 2.5 mg of tissue) have been successfully applied using the above-mentioned (adapted) Bligh and Dyer, and Matyash techniques to analyze each phase with different LC-MS methods selected based on the LogP of the metabolites [54,76,77]. The successful application of these methods shows that reproducible extractions for metabolomics can also be obtained with low sample amounts.
Sample preparation methods based on single-phase separation for zebrafish samples (Table 1) showed a clear tendency to favor polar metabolites detection, such as amino acids, tricarboxylic acid (TCA) cycle metabolites, with some of them also detecting polar lipids (e.g., acylcarnitines and some glycerophospholipids) [15,78], and interestingly, metabolites from the arachidonic acid metabolism, such as leukotriene B4 and prostaglandin E2 [78]. These latter compounds should be carefully evaluated with as much evidence as possible (reference standards, MS/MS spectra, retention time match, collision cross section values, isotopic pattern, mass defect) when detected by untargeted methods since they are usually present in low concentrations, and require specific analytical methods, including solid-phase extraction (SPE) extraction [35,79,80].
Strategies using a two-step solvent extraction showed promising results in terms of metabolite detection and data quality in untargeted methods for tissue samples [56]. Briefly, Want et al. extracted liver tissue samples using MeOH/H2O (1/1, v/v), followed by centrifugation and the supernatant removal. Subsequently, the solid precipitate was dissolved in CH2Cl2/MeOH (1/1, v/v) for the extraction of non-polar metabolites [56]. The application of two-step solvent extraction is an attractive approach for tissue samples, but it leads to an increased sample preparation time. The extraction requires two homogenization steps since the extract is centrifuged after the first extraction of the polar metabolites.
In addition to LE, SPE methods can be necessary to concentrate specific classes present in low concentrations, such as eicosanoids, oxylipins, and steroids [65,81]. Lebold et al., successfully applied an SPE method to fractionate three different lipid classes (i.e., sterols, fatty acids, and prenol lipids) in zebrafish embryos (24 hpf) using a modified polymer-based sorbent (strong anion exchange) [35]. Previously saponified samples with KOH were loaded onto the cartridges and the analytes were eluted with formic acid, ACN, and MeOH (5/47.5/47.5, v/v/v) based on hydrophobic (i.e., cholesterol), π–π bonding (i.e., α-tocopherol) and ionic interactions (i.e., polyunsaturated fatty acids (PUFAs)). SPE cartridges commonly used for lipid removal in fat-rich samples, such as Captiva-EMR (Agilent Technologies, Santa Clara, USA), can also be applied in a two-step method for extraction of polar and lipid metabolites. This latter cartridge traps lipids based on acyl chains, allowing small molecules to be eluted in a cleaner extract, which would allow higher concentration factors due to less interference of lipids. The second step includes the elution of lipids, in a different fraction, with a stronger organic solvent, such as CHCl3. However, its application for lipidomics and metabolomics workflow still needs to be evaluated, since most of the non-commercial applications are used for food analysis [82].
Table 1. Examples of recent studies using LC-MS metabolomics with zebrafish embryos, larvae, and tissues.
Collection TimeSample per
Replicate
Quenching/StorageExtraction SolventAnalysisReference
96 hpf *30 pooled
individuals
Snap-frozen with
liquid nitrogen and
stored at −80 °C
1 mL (MeOH/ACN/H2O,
40/40/20, v/v/v)
LC-HRMS
Mostly polar metabolites, e.g., amino acids, and
sugars
[20]
120 hpf20 pooled
individuals
Snap-frozen with dry ice and stored at −80 °C1.7 mL (MeOH/H2O/CHCl3,
9/5/3, v/v/v)
LC-HRMS
Mostly polar metabolites, e.g., amino acids and
organic acids
[15]
168 hpf50 mg
(25 mg for
metabolomics
and 25 mg for
lipidomics)
Not mentionedPolar metabolites: 800 μL of (MeOH/ACN/H2O, 2/2/1, v/v/v)
Lipids: 800 μL of −20 °C
CH₂Cl₂/MeOH (3/1, v/v)
LC-HRMS
Polar metabolites
and lipids
[47]
120 hpf15 pooled
individuals
Snap-frozen and stored at −80 °C590 μL (MeOH/ H2O/CHCl3, 15/15/29, v/v/v) +
10 uL of SPLASH LIPIDOMIX®)
2D-LC-HRMS
Lipids
[70]
52 hpf *10 pooled
individuals
Snap-frozen with liquid nitrogen and stored at −80 °C250 μL H2O for homogenization. Samples were freeze-dried and
extracted with 80% MeOH
(volume not specified).
LC-HRMS
Mostly polar metabolites, e.g., purine metabolism and some lipids of the arachidonic acid metabolism
[78]
144 hpf20 pooled
individuals
10 μL of 13 mM
sodium
metabisulfite
450 μL of cold MeOH.LC-MS/MS
Mostly polar metabolites, e.g., kynurenine pathway metabolites,
neurotransmitters
[18,19]
48 and
120 hpf
80 pooled
individuals
Stored at −80 °CEach 20 μL sample was extracted with 120 μL of cold 50% MeOH.LC-HRMS
Mostly polar metabolites, e.g., amino acids
[46]
120 hpf *12 pooled
individuals
Not mentionedSamples were homogenized
in 1 mL H2O +
unknown amount of CH₂Cl₂
LC-MS/MS
Lipids
[34]
24, 48,
72, and
120 hpf
15 pooled
individuals
Stored at −80 °C300 µL (MeOH/H2O, 80/20 v/v)LC-HRMS
Mostly polar metabolites, e.g., choline, betaine,
methionine, glucose, and TCA cycle metabolites.
[57]
144 hpf30 pooled
individuals
Snap-frozen in
liquid
nitrogen
1 mL MeOHLC-HRMS
Polar metabolites, e.g., nucleosides, amino acids, and some lipid classes, e.g., sterol lipids,
glycerophospholipids,
sphingolipids
[22]
172 hpf *200 pooled individuals
(50 mg)
Snap-frozen in
liquid
nitrogen
400 µL (MeOH/H2O, 4/1, v/v)LC-HRMS
Polar metabolites, e.g., amino acids lipids, e.g., glycerophospholipids,
arachidonic acid
metabolism
[69]
24, 48,
72, and
120 hpf
10–15 pooled individualsStored at −80 °CSaponification with alcoholic KOH with 1% ascorbic acid. The pH was adjusted to 2.5 with 12 mol/L HCl. Addition of 2.0 mL of hexane.
Removed organic supernatant.
LC-HRMS(/MS)
Docosahexaenoic acid, eicosapentaenoic acid,
Arachidonic acid, and Linoleic acid
[57]
24 hpf10 pooled
individuals
Snap-frozen in
liquid nitrogen and stored at −80 °C
SPE: Added samples to 2 mL 1% ascorbic acid in EtOH and 1 mL H2O. Saponification with 300 µL saturated KOH. Neutralization with
3 mol/L HCl to pH 7.5.
Lipids were extracted/separated with Strata-X-A 33 mm Polymeric Strong Anion Exchange cartridges (200 mg/3 mL, Phenomenex) using different combinations of organic solvents: MeOH for Cholesterol, ACN for α-tocopherol, FA/ MeOH/ACN (5/47.5/47.5, v/v/v)
for PUFAs.
LC-Single Quadrupole (MS)
Free fatty acids
Commercial Amplex Red
Assay Kit (Life Technologies, Carlsbad, CA)
Cholesterol
LC-Electrochemical Detection
α-tocopherol
[35]
24 and
36 hpf
200 and 100 pooled
individuals
Snap-frozen in
liquid nitrogen and stored at −80 °C
3 mL 66% MeOHLC-HRMS(MS)
Hydroxy-fatty acids, e.g., 7-HDHA, 10-HDHA, 14-HDHA, and
17-HDHA
[35]
72 and 168 hpf15 pooled
individuals
Stored at −80 °C8 μL/mg cold MeOH and
3.2 μL/mg H2O.
Added remaining solvents
(8 μL/mg CHCl3 and 4 μL/mg H2O) to the homogenates.
Final ratio: MeOH/H2O/CHCl3 (2/1.8/2, v/v/v).
Dilution of upper layer 10-fold and transfer to 1.5 mL vial.
LC-MS/MS
22 amino acids
+ 22 polar metabolites (e.g., urea, betaine,
uridine, inosine,
xanthine)
[50]
Adult zebrafish **Intestines
(6 pooled
individuals)
50 mg
Not mentioned400 μL of MeOH/H2O (4/1, v/v)LC-HRMS
Polar metabolites and lipids, e.g., fatty acids, glycerophospholipids, carnitines
[29]
90 dpfLiver
(4 pooled
individuals)
Snap-frozen and stored at −80 °CHomogenized in approximately
1.2 mL of MeOH/H2O (4/1, v/v).
Split into two fractions at a ratio
of 5/1 (v/v) to analyze metabolites and lipids, respectively.
Added MTBE, MeOH, and H2O to a final ratio of MTBE/MeOH/H2O (20/6/7, v/v/v) to the lipid fraction.
LC-HRMS
Polar metabolites and
lipids
[48]
Adult zebrafish **Liver
(8 pooled
individuals)
Snap-frozen in
liquid nitrogen and stored at −80 °C
Homogenized with 800 μL of MeOH and 200 μL of H2O.
Collected 750 μL after
centrifugation.
Added another 200 μL H2O and
400 μL CHCl3.
LC-HRMS
Mostly
glycerophospholipids, amino acids, and
fatty acids.
[83]
* Approximated value. ** Exact fish age during collection not specified.

2.5. Instrumental Analysis

The analysis of metabolites can be performed using untargeted, semi-targeted/quantitative, and/or targeted/quantitative approaches. In most cases, an untargeted method can be used as a first screening approach (e.g., hypothesis-generating), as this technique is less biased towards certain metabolite classes [10]. Untargeted methods can also be combined with semi-targeted approaches if there is prior knowledge of which metabolic pathways may be affected by a specific (exposure) condition. Once the metabolites of interest have been annotated, a targeted method (hypothesis-driven) can be used in order to detect changes in the concentration of specific metabolites using reference standards [10]. Metabolomics studies can be carried out using different analytical platforms including GC-MS, nuclear magnetic resonance (NMR), LC-MS, or a combination of them (e.g., 1H-NMR with LC-Orbitrap(MS)) [84]). An example of a multi-analytical platform used to study metabolite differences in zebrafish liver is the work of Ong et al. [52]. The authors used a combination of 1H-NMR for the analysis of monosaccharides, amino acids, and organic acids, GC-MS for cholesterol and fatty acids, and LC-MS for the analysis of lipids. However, more recent zebrafish toxicometabolomics studies (≥2017) reported using LC-HRMS (Orbitrap or QTOF) [15,28,29,31,33,36,48,51,85,86,87,88], followed by 1H-NMR [24,30,89,90,91,92,93] and GC-HRMS [21,94], while multi-analytical platform studies remain scarce.
In LC-MS analysis, the combination of hydrophilic interaction liquid chromatography (HILIC, e.g., bare silica, amide, diol, amido, zwitterionic columns) and reversed-phase liquid chromatography (RPLC, e.g., C18, C8, C30 columns) methods is one the most comprehensive strategies for untargeted metabolomics, providing a broad metabolite coverage [95,96,97]. Currently, C18 columns with sub-2-μm particle size are often used for untargeted metabolomics and lipidomics as a stand-alone technique, and rarely combined with HILIC [22,23,31,36,48,51,83,85,87,88,98]. Furthermore, the complementarity of HILIC to RPLC methods is a highly powerful strategy for polar metabolites that should not be overlooked, especially when a multiplatform strategy is not employed [97,99]. Depending on the stationary phase, HILIC columns can have different interaction mechanisms (e.g., hydrogen bonding, electrostatic interactions, hydrophilic partitioning) that can benefit the retention of polar metabolites, which would elute close to the void time in RPLC columns, and also allow the separation of lipids by the polarity of head groups [95,100]. Due to the recent development of robust columns and increasing knowledge on how to manipulate the retention of metabolites (e.g., solvent, salt modifiers, temperature, pH), amide and aminopropyl HILIC columns have also been used in zebrafish metabolomics studies as a stand-alone technique [15,20,28,86].
In addition, MS data can be acquired in positive and negative mode with electrospray ionization (ESI+ and ESI−, respectively) which benefits both acidic and basic functional groups [101]. Consequently, with the same chromatographic column, two datasets can be obtained (ESI+ and ESI-). If two chromatographic columns are used (e.g., HILIC and RPLC), four datasets are obtained which require parallel processing [97]. For instance, Hu et al. used a combination of RPLC (C18)-based ACQUITY UPLC HSS T3 (100 × 2.1 mm, 1.8 μm) and HILIC-based ACQUITY UPLC BEH Amide (100 × 2.1 mm × 1.7 μm) columns, both in positive ionization mode [87]. Keerthisinghe et al. used a HILIC Luna aminopropyl column (150 × 10 mm, 3 μm) for polar metabolites in positive and negative ionization modes and an RPLC (C18) Zorbax Eclipse Plus RRHD column (50 × 2.1 mm, 1.8 μm) in positive mode for lipidomics [48]. Recently, Xu et al. analyzed zebrafish embryos using different combinations of chromatographic methods to evaluate their metabolite coverage [70,102]. Their results highlighted the need for two methods, one HILIC based with an XBridge Amide column (150 × 2.1 mm × 3.5 μm) in ESI+ and one pentafluorophenyl Kinetex F5 column (150 × 2.1 mm × 2.6 μm) in ESI− to cover the polar metabolome (336 annotated metabolites) and one comprehensive two-dimensional (2D) liquid chromatography method with an EVO C18 column (100 × 2.1 mm × 2.6 μm) and a BEH HILIC column (50 × 2.1 mm × 1.7 μm) for comprehensive lipid profiling of zebrafish embryos (1784 annotated lipids). Nevertheless, 2D-LC analysis requires a long analysis time (approximately 170 min for this later study), which can consequently be considered not particularly suitable for large batches, solvent consumption, and sample stability.
Furthermore, the separation of isomers and isobars, and consequently, the acquisition of well-resolved fragmentation spectra is a challenge especially for lipidomics applications [103,104]. In order to obtain a less time-consuming but comprehensive platform, ion mobility spectrometry (IMS, a separation technique based on the mobility of ions through a buffer gas under the influence of an electric field) has been successfully integrated into LC-MS-based lipidomics and metabolomics workflows [96,105]. One of the key advantages of the IMS technique is that it can separate ions in milliseconds based on their shape and size, which is highly convenient for linking LC separations (minutes) and time-of-flight (TOF)-MS detection (microseconds) for the separation of E/Z isomers, sn-positional isomers, and increasing annotation confidence with the addition of collision cross section values [104,105].

2.6. Data Analysis

Data derived from metabolomics workflows are of great complexity since it usually englobes thousands of features (e.g., for LC-MS, an entity with an attributed m/z, retention time, fragmentation spectra, and a response signal). The workflow for untargeted data preprocessing includes several steps to obtain a feature signal response matrix (e.g., features in rows vs. samples in columns). These steps are dependent on the instrument (e.g., GC-MS, LC-MS, NMR) used to acquire the data. For MS-based instrumentation, if vendor-specific software is not used, data files need to be converted to an open file format (e.g., mzML, netCDF, ABF) to be further processed with open-source software packages, such as MS-DIAL, XCMS, MZmine, and OpenMS [106,107]. The software can be used to perform peak picking, deconvolution, alignment across samples, and in some cases, the same software can perform metabolite annotation with experimental and/or in silico libraries (e.g., MS-DIAL [108]). Peak picking, deconvolution, and alignment processes are performed to detect ions in a specific region of interest above pre-defined instrumental noise levels, to handle overlapping peaks, fragments and to align those signals across different samples.
Feature tables do not contain unique signals corresponding to a specific metabolite, but also redundant features (e.g., different isotopes, charges, and adducts in soft ionization techniques such as ESI and MALDI), background signals, etc. [109]. Computational techniques can address the challenge of isotope and adduct annotation, including the well-known R package CAMERA (based on peak grouping after retention time and peak shape correlation to form groups of ions, followed by annotation of possible isotopes and adducts) and the more recent web application MS-FLO (based on several parameters such as peak height, retention time alignment and mass similarities to detect adducts, isotopes and duplicate features in a preprocessed dataset) [109,110]. The number of software packages, databases for metabolite annotation, and processing tools increase every year, with the most recent developments compiled in a review paper by Misra [107].
Following data preprocessing, data cleaning (feature reducing) (e.g., remove background ions and features with low precision and detectability), signal drift correction, and imputation of missing values are commonly applied [111,112,113]. Then, data transformation and statistical analysis (univariate and/or multivariate techniques) are performed to identify relevant features for a specific condition, followed by further structure elucidation and biological interpretation. Depending on the type of statistical analysis (univariate/multivariate), different data pretreatment methods are necessary. Statistical analysis of metabolomics data is a complex workflow and requires tailored approaches. Recently, Blaise et al. published a comprehensive protocol for statistical analysis of metabolomics data, including scaling, normalization, outlier detection, statistical tests, power tests, and performance evaluation of models [114]. In addition, the authors made the scripts (Python 3 with Jupyter Notebooks), tutorials, and data freely available on GitHub (https://github.com/Gscorreia89/chemometrics-tutorials, accessed on 10 August 2021).
Importantly, independent of the data analysis workflow used, the Metabolomics Society Data Analysis Task Group proposed minimum requirements when reporting metabolomics data that can be used as a guideline for authors and reviewers. These requirements include preprocessing parameters (e.g., peak picking, deconvolution, alignment), pre-treatment strategies (e.g., normalization, scaling, transformation, missing value imputation, outlier detection), processing (e.g., model selected for analyzing data such as principal component analysis (PCA)), post-processing (e.g., back-transformation, visualization); validation (e.g., training, monitoring, and usage of a test set) [115]. However, they were proposed in 2007 and an update is required considering the advances in software and data sharing. For instance, interactive web-based computational laboratory notebooks (e.g., Jupyter Notebook) and cloud computing have emerged as a possible solution for data analysis transparency, open collaboration with the integration of codes, figures, tables, and user-friendly interfaces [116].

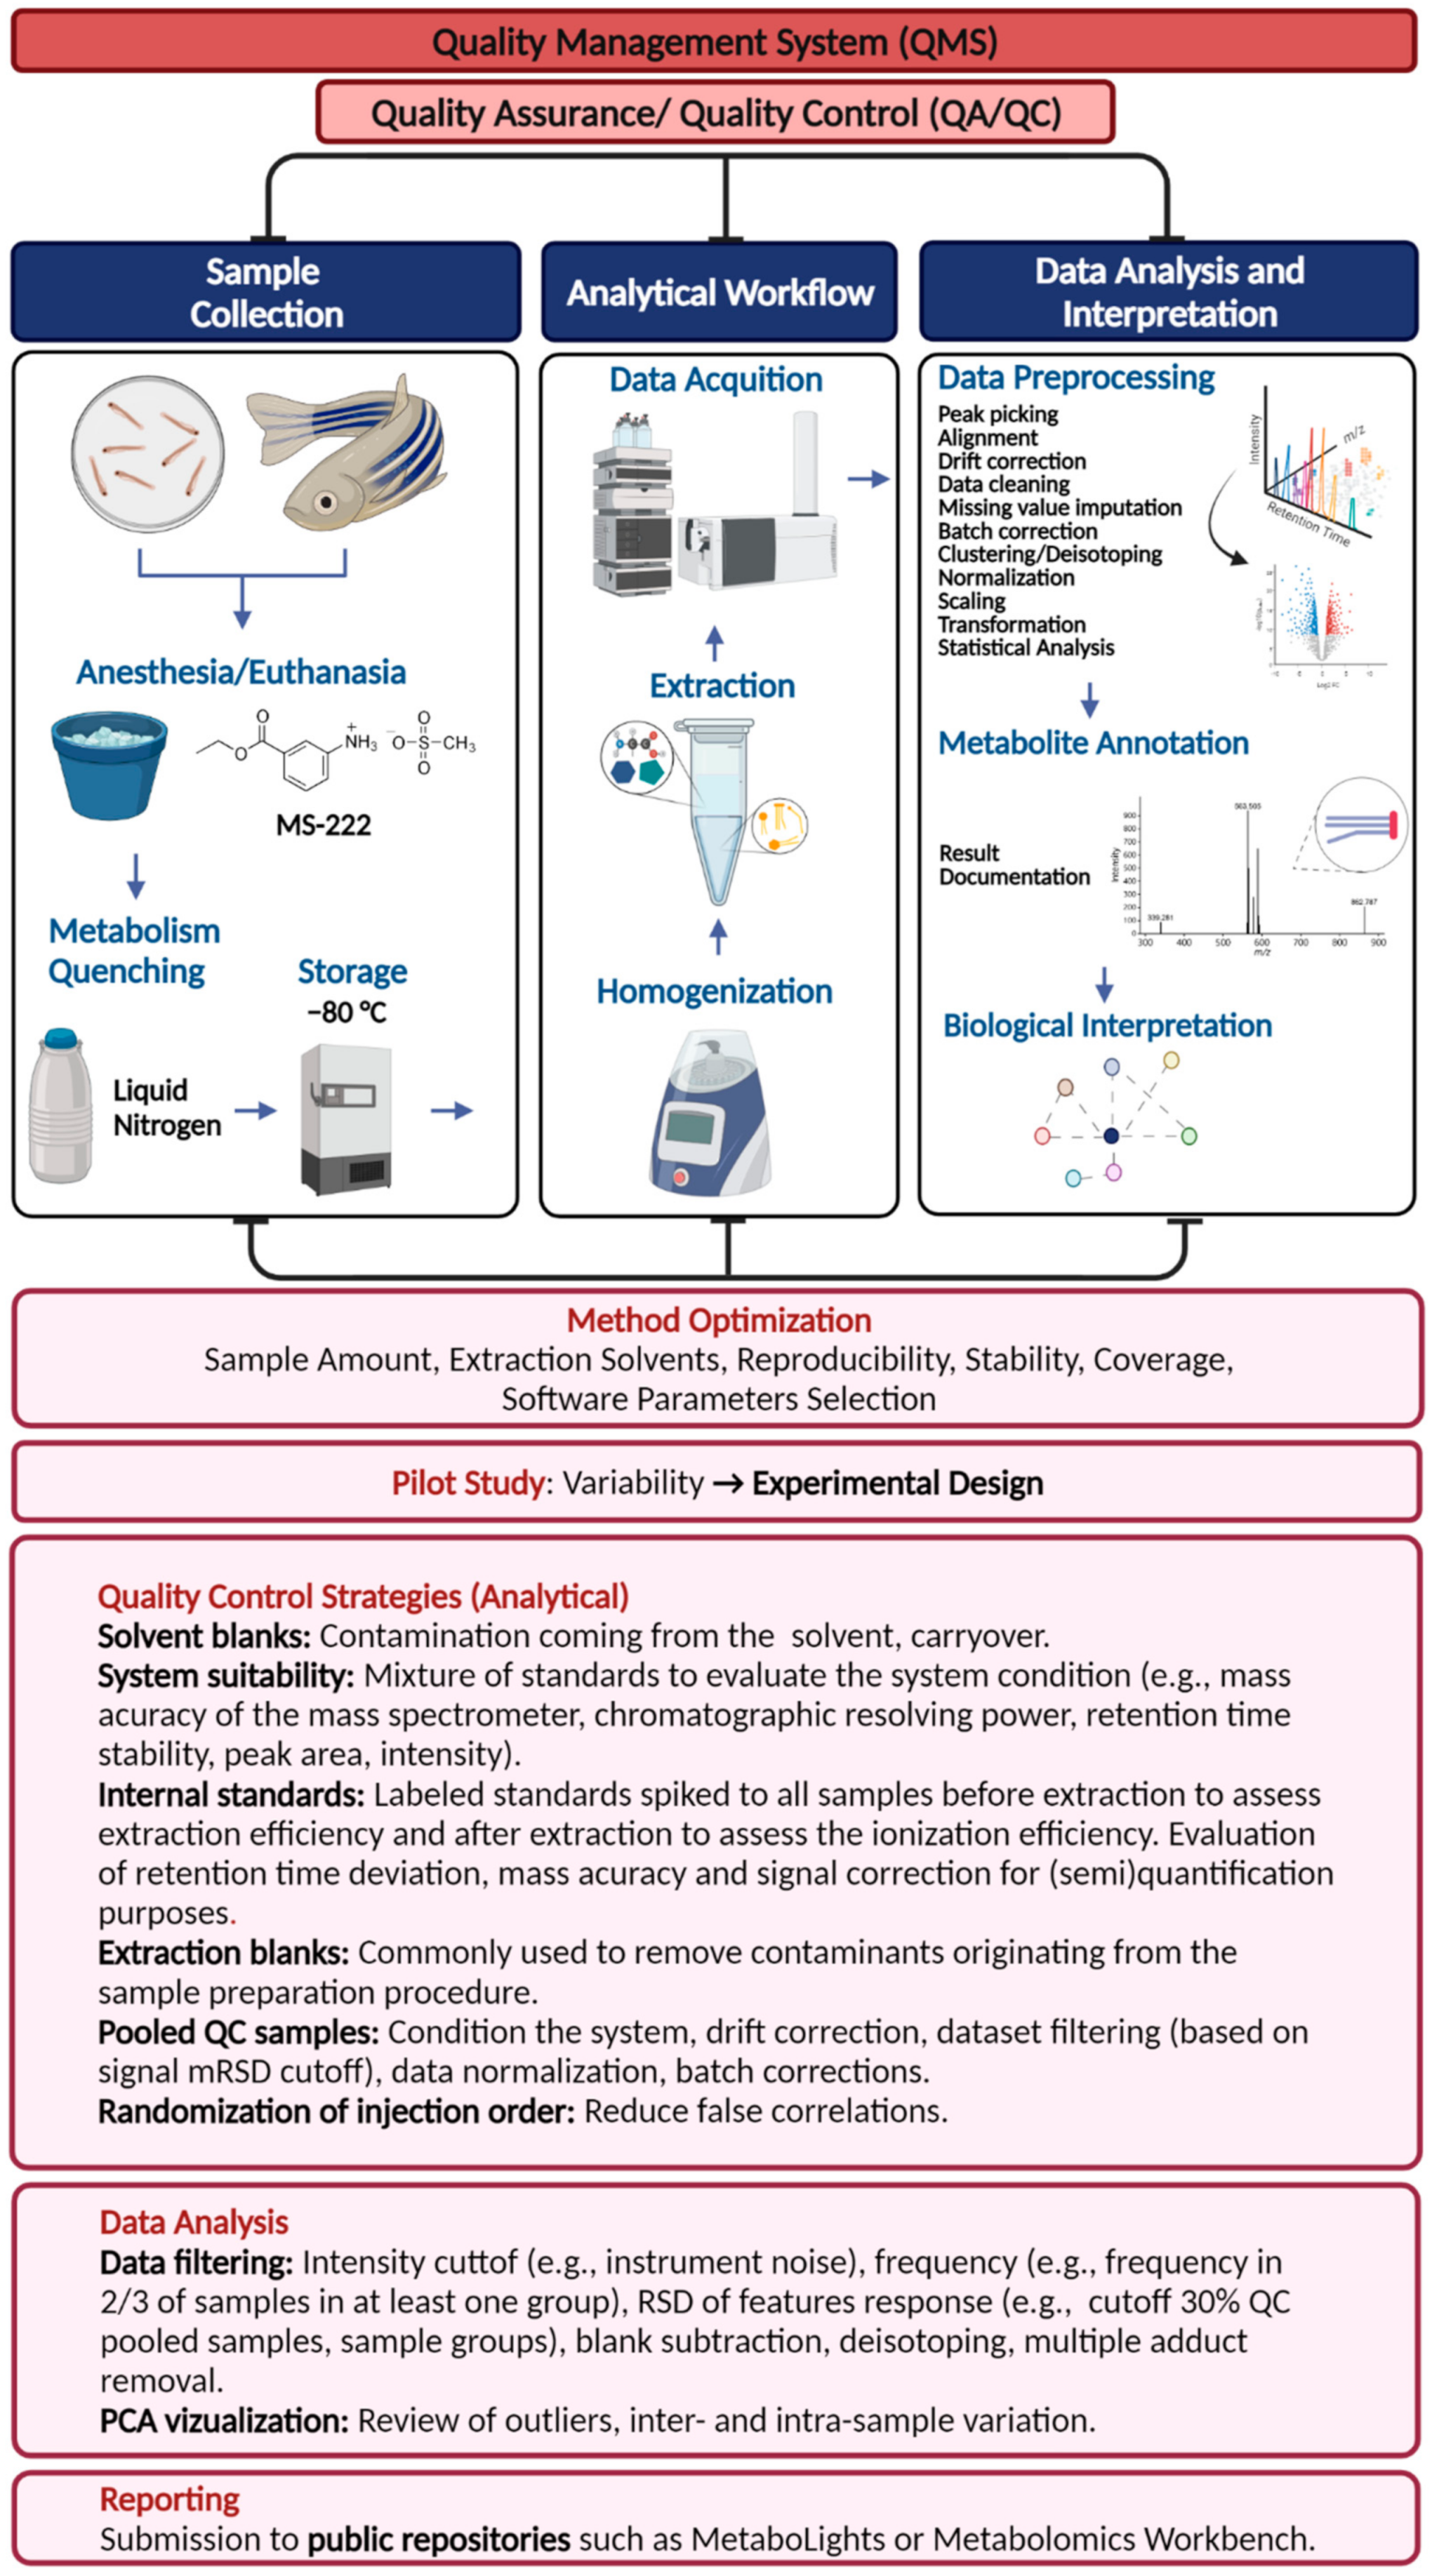
3. Quality Management System

As of 2021, metabolomics is considered a mature discipline with more than two decades of advancements in analytical workflows, software tools, and biological information in different biological systems (e.g., in vitro cells, plants, bacteria, animals) [10,44]. In parallel, guidelines to ensure data reliability and reproducibility have been proposed by the Metabolomics Standards Initiative (MSI) and the metabolomics Quality Assurance and Quality Control Consortium (mQACC) [117,118]. The MEtabolomics standaRds Initiative in Toxicology (MERIT) was created in 2017 to describe practical guidelines and minimal reporting standards for regulators to interpret the quality of metabolomics data in the context of regulatory toxicology [119]. Although the MERIT guidelines were not initially proposed for academic research, the definitions of commonly used terms in metabolomics (e.g., process blanks, system suitability QC, interlaboratory QC, level of confidence in metabolite annotation), scenarios for applications (e.g., metabolic points of departure (PODs), the discovery of chemical mode(s) of action and molecular key events (KEs), chemical grouping for read-across and cross-species extrapolation of toxicity pathways), data acquisition, and management strategies were described in a detailed and comprehensive manner and their use could be beneficial for toxicometabolomics research [119].

3.1. Quality Assurance (QA) and Quality Control (QC)

Data quality assessment includes quality assurance (QA) and quality control (QC) measures to ensure data quality and reduce the risk of misinterpretation of results in a biological context (Figure 1). QA procedures include the development and continuous improvement of standard operating procedures for sample collection, preparation, data acquisition, and data processing. QC activities are undertaken during and after the experiment to monitor and report quality requirements. For metabolomics applications, these include the acquisition of blank extraction samples, intra-study QC pooled samples (e.g., mixed aliquots of biological samples representative of the entire sample set), spiking of samples with internal labeled standards to assess precision during the analysis, and reference materials for inter-laboratory and long-term studies [120]. However, there is currently no agreement on which quality metrics should be used and reported.
The mQACC began to address the lack of guidelines and nomenclature by collecting detailed information on QA and QC practices used by different laboratories using LC-MS-based untargeted analysis [117]. Pooled QC samples were identified as one of the most commonly applied quality measurements in untargeted LC-MS-based metabolomics studies [117]. The importance of QC pooled samples for instrumental source conditioning, carry-over assessments, data filtering, signal correction, and determination of precision has been shown by recent software developments and applications [111,121,122].
Furthermore, the main consensus that resulted from the mQACC consortium group was the prospect of creating a set of minimum QA and QC practices for metabolomics. Meanwhile, the current guidelines for QA/QC management processes proposed by Broadhurst et al. can be used for zebrafish metabolomics studies, since they present good application and reporting practices, including the use of system suitability samples, process blanks (extraction blanks), pooled QC samples, QC conditioning samples, QC batch correction, and order of analytical batches [122]. Nevertheless, one of the most important aspects of QA/QC practices is the description of data acquisition and processing strategies, which includes feature-reducing strategies [115]. For instance, in the work of Broadhurst et al., the authors did not advise the use of pooled QC serial dilution to filter data based on correlations, since it does not consider a non-linear response, but they mentioned that further work is required to extend the use of this approach [122]. A recent application of the QC dilution series and advanced filtering proposed by Sands et al. showed that dilution QC series, besides its challenges (e.g., poor representation of low abundant metabolites, correct models for a response, account for matrix effects), can be used to estimate the linear range and analyte response and improve the data quality of global metabolic studies [123].

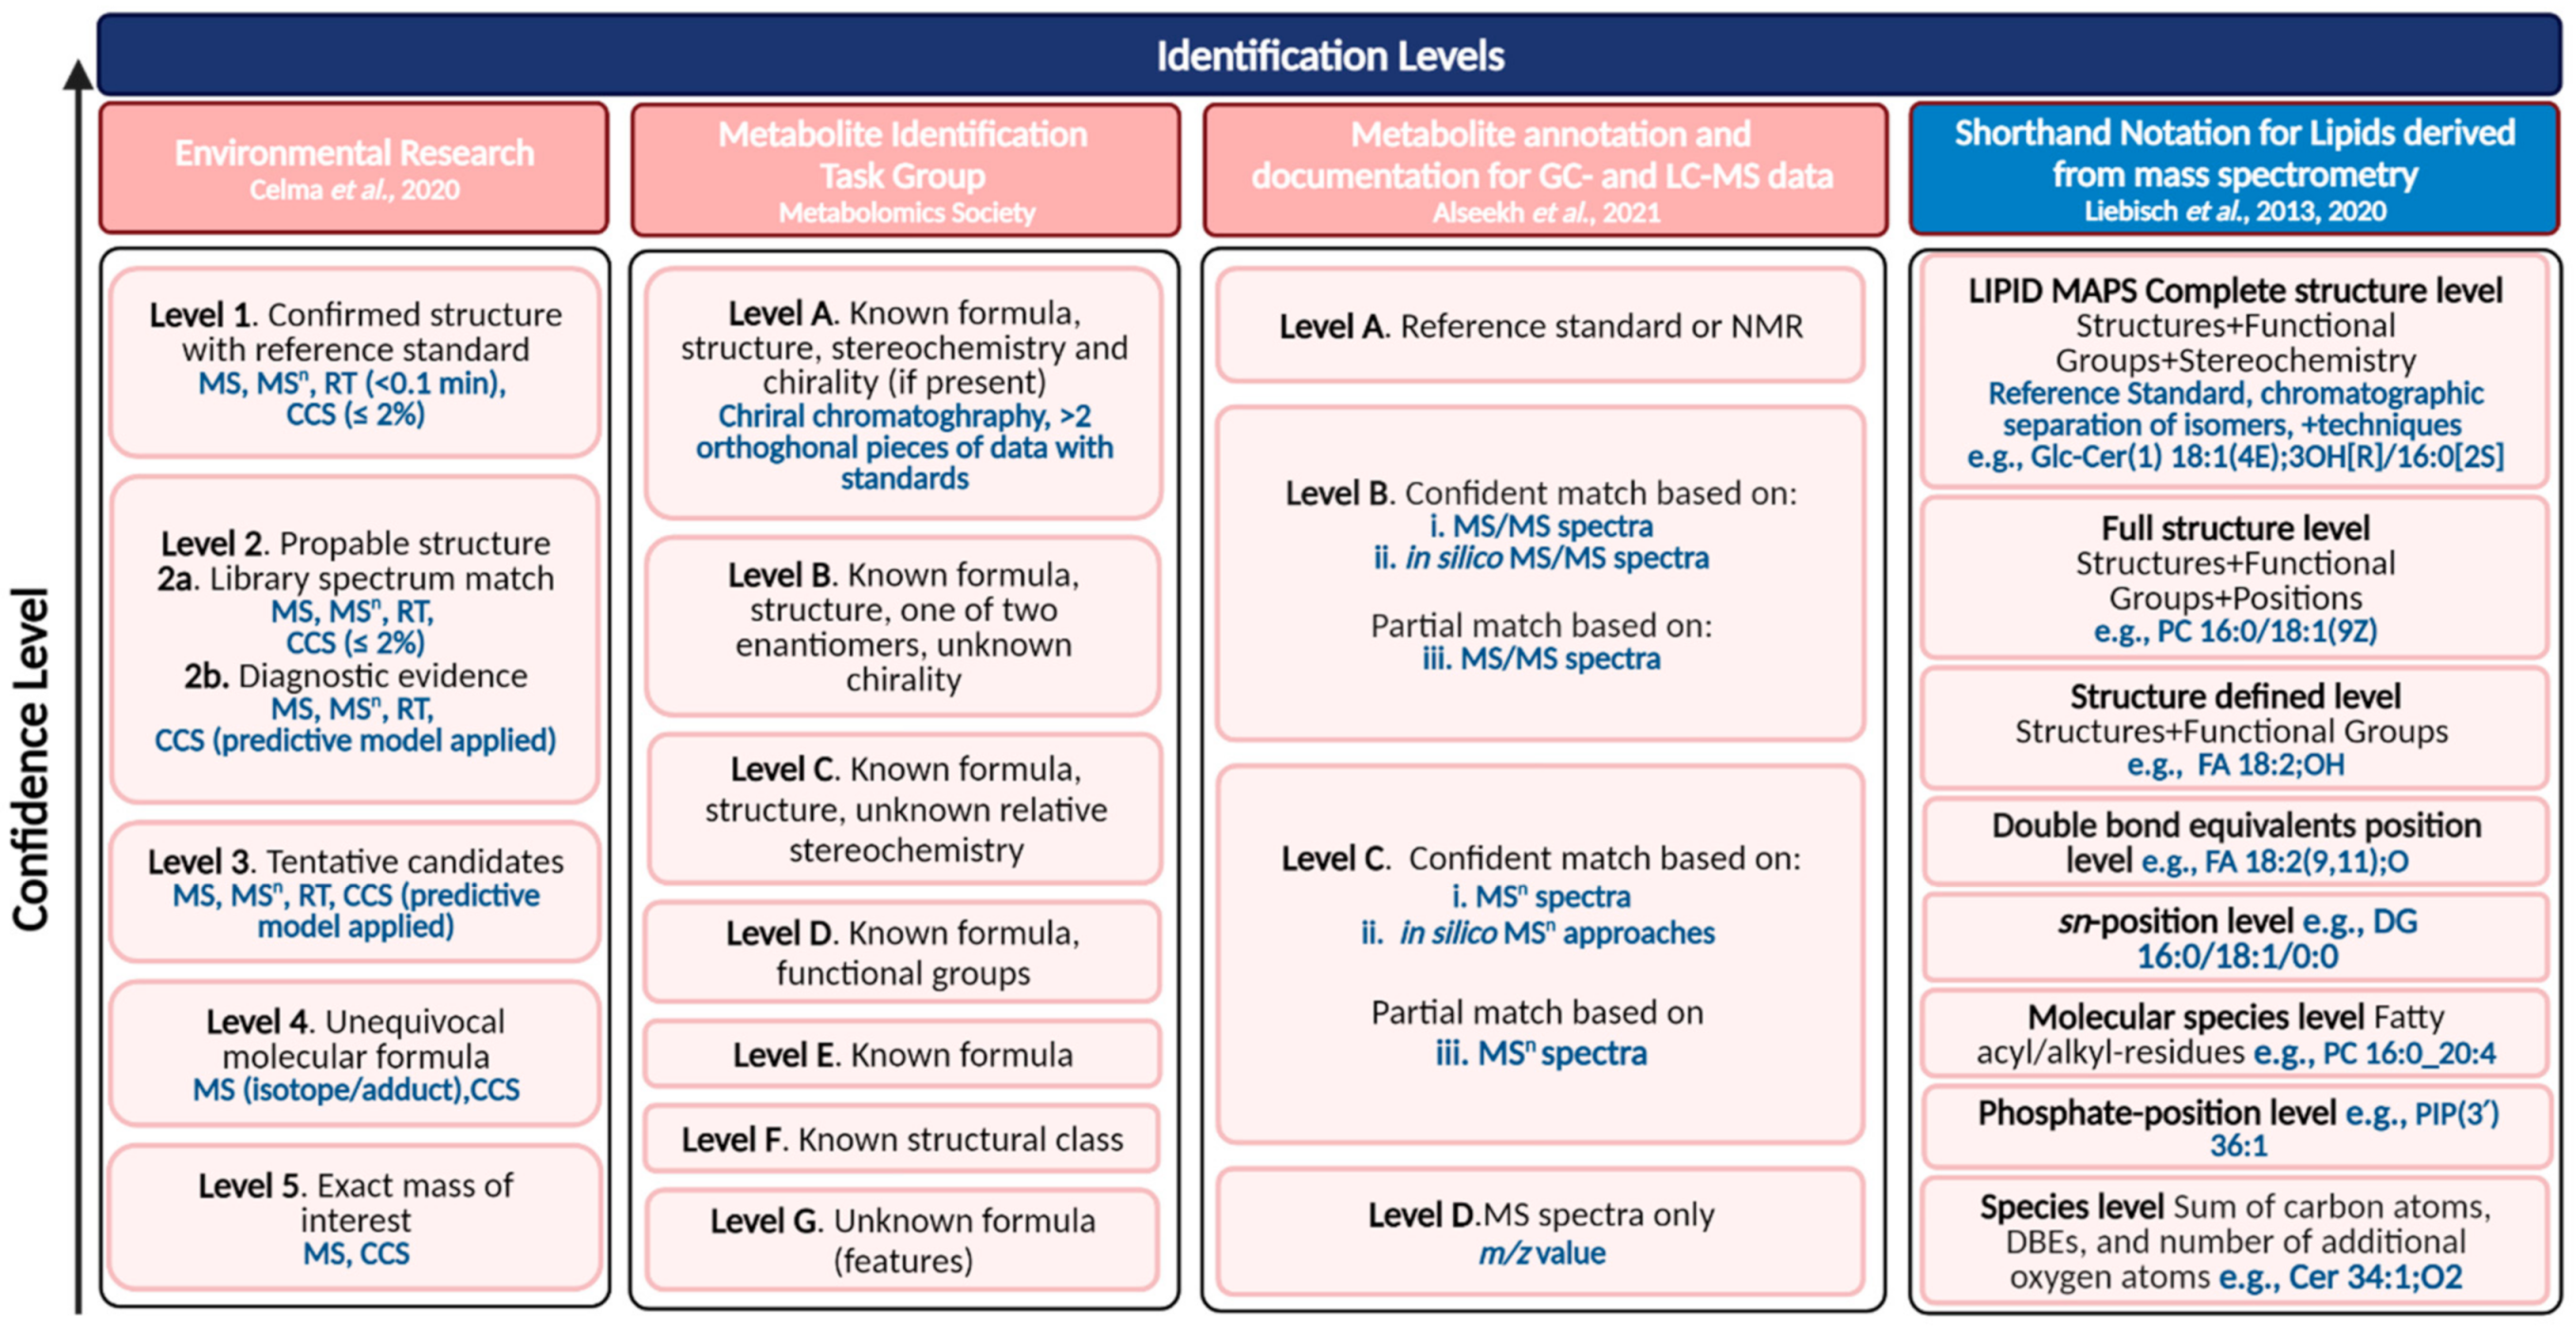
3.2. Level of Confidence in Metabolite Annotation

The importance of confidence in metabolite annotation for toxicometabolomics studies was highlighted by Malinowska et al. [124]. The authors proposed a framework for confidence levels required for metabolite annotation for different toxicological applications (e.g., application of metabolomics to derive points of departure require a higher confidence level in metabolite annotation than chemical grouping studies) using the earliest MSI confidence levels (1–4) definition [125]. More recently, in the context of mass spectrometry-based metabolomics, a simplified reporting workflow at the level of the processed data was proposed by Alseekh et al. [126] including guidelines for sample collection, extraction, storage, metabolite identification, and reporting (Figure 2). One of the main highlights of the latter work is the minimum ontology for metabolite documentation in research articles: analytical identifiers (retention time, theoretical monoisotopic mass, m/z of the adduct detected, m/z error (in ppm), MS/MS fragments, representative chromatograms, peak intensity, area for quantified data), and international identifiers for known metabolites (e.g., HMDB, KEGG, PubChem, LIPID MAPS). The authors proposed identification levels based on letters (A-D) with sublevels (i, ii, iii), as shown in Figure 2. However, these levels of confidence reflect more on the basic LC-MS information (e.g., retention time, MS/MS spectra) used to support the annotation rather than on the level of confidence based on the metabolite complete structure level.
The Metabolite Identification Task Group of the Metabolomics Society suggests confidence levels based on the metabolite complete structure level which in some cases requires additional techniques (e.g., ozonolysis or photochemical derivatization to determine the position of double bonds in glycerolipids). The MSI definition, within the metabolomics area, can be more robust towards instrumental advancements and the combination of different techniques to support annotation (e.g., the inclusion of collision cross section values derived from ion mobility spectrometry resulted in a new rank for confidence levels of identification of chemicals in environmental research [127]).
The lipidomics community adopted a shorthand notation to standardize lipid nomenclature that supports the combination of different MS-derived techniques. This latter shorthand notation also reflects on the confidence levels [128]. For instance, sn positions can be determined by both IMS and chromatographic separation which results in the same confidence level for shorthand notation [129]. Often in MS-derived analysis, structure information is limited to level C (known formula and structure, unknown stereoisomers), hence it is important to document the information used to support annotation and use evidence-based nomenclature for data transparency [126,129,130].
Figure 2. Overview of confidence levels in compound annotation using different scales. The figure was adapted from [125,126,127,128] and more detailed information about the mentioned confidence levels can be found in [124,125,126,127,128,129,131].
Metabolites 11 00635 g002

3.3. Data Sharing

The submission of metabolomics studies to open access repositories, such as MetaboLights (https://www.ebi.ac.uk/metabolights/, accessed on 13 July 2021) and Metabolomics Workbench (https://www.metabolomics workbench.org, accessed on 13 July 2021) is considered as the gold standard for metabolomics reporting [126]. While submission requirements would benefit from standardization, data submitted to open repositories contribute to transparency and reproducibility [126,132]. Also, reanalysis of data can drive advances in computational analysis and the discovery of metabolites that were not found in the previous studies [133]. As of August 2021, there are 2418 metabolomics datasets publicly available in MetaboLights (849), Metabolomics Workbench (1543), and Metabolomic Repository Bordeaux (26) combined, which can be consulted via MetabolomeXchange (http://www.metabolomexchange.org/, accessed on 13 July 2021). However, only 6 datasets using the keywords “zebrafish” or “Danio rerio” were found (Table 2). This indicates that even though it is a highly recommended practice, articles applying metabolomics to zebrafish are not often submitted to these data repositories.

4. Conclusions and Perspectives

The specific debate of using omics data in the context of OECD test guidelines dates back for more than a decade and started with assessing the potential added value of transcriptomics data. From a toxicological perspective, metabolomics could provide a more detailed understanding of toxic mechanisms of chemicals at a molecular level. The value of metabolomics studies for different OECD fish test guidelines (e.g., TG 236, 210, 229, 234, and 203), which typically focus on the measurement of apical endpoints such as mortality, growth, and reproduction could become an important element of 21st century hazard and risk assessment strategies. Furthermore, dose-range finding experiments are necessary to determine relevant exposure scenarios given a specific experimental context and for a particular toxicological endpoint. Effect concentrations for metabolomics studies can differ from those observed at other levels of biological organization, meanwhile, it is the research question that determines the relevant exposure range. For example, the concentrations required to study metabolic changes associated with loss of reproductive capacity will be different from those changes associated with loss of equilibrium. Consequently, no general rules such as using the lowest observed effect concentration (LOEC) for a specific toxicological endpoint as maximum exposure level for zebrafish toxicometabolomics have been proposed in this work.
From an analytical chemistry perspective, fast quenching of samples using liquid N2 is necessary to avoid post-collection metabolic changes, while the use of antioxidants can help to preserve samples during preparation and storage at −80 °C. Extraction methods will depend on the class of metabolites under investigation since global metabolomics methods with full coverage of the metabolome even though desired, cannot be achieved. For comprehensive untargeted LC-MS-based metabolomics, liquid–liquid extraction to separate polar and non-polar metabolites followed by their analyses using different combinations of HILIC-HRMS and RPLC-HRMS has shown high potential. Depending on the laboratory infrastructure and available time, multi-analytical platform metabolomics can be used to improve metabolite coverage. Data acquisition parameters, data preprocessing, data pretreatment, statistical analysis, feature annotation, validation, and biological interpretation need to be carefully evaluated and it is recommended to report each step in detail according to the minimum requirements proposed by the Metabolomics Society Data Analysis Task Group. To ensure reliable and high-quality data, a quality management system is of vital importance. The current guidelines for QA/QC mentioned in this review with the usage of inter alia system suitability samples, process blanks, pooled QC samples, and QC conditioning samples, present good application, and reporting practices. In addition, confidence levels should be used for all annotated metabolites accompanied by the used confidence level system. Finally, submission of data to open repositories is necessary to improve transparency and reproducibility of obtained results and allow systematic comparisons of metabolites and pathways affected by specific classes of chemicals.

Author Contributions

Conceptualization, K.M.d.S., E.I., A.C. and A.L.N.v.N.; formal analysis, K.M.d.S., E.I., C.B., D.K.; project administration, A.C. and A.L.N.v.N.; resources, A.C. and A.L.N.v.N.; funding acquisition, A.C. and A.L.N.v.N.; supervision, A.C. and A.L.N.v.N.; visualization, K.M.d.S.; writing—original draft, K.M.d.S., E.I. and C.B.; writing—review and editing, K.M.d.S., E.I., C.B., D.K., S.V.C., A.C. and A.L.N.v.N. All authors have read and agreed to the published version of the manuscript.

Funding

Katyeny Manuela da Silva acknowledges a doctoral fellowship BOF DOCPRO 4 from the University of Antwerp. Elias Iturrospe is funded by the Research Scientific Foundation-Flanders (FWO)—project number 1161620N. Chloe Bars is funded by the Research Scientific Foundation-Flanders (FWO)—project number 1S14420N. Zebrafishlab received funding from the European Union’s Horizon 2020 research and innovation program under grant agreement No. 825753 (ERGO).

Data Availability Statement

Data is contained within the article. The figures and tables of this manuscript are original. Graphical icons in Figure 1 and Figure 2 were provided by BioRender, license No. 2641-5211.

Conflicts of Interest

The authors declare that they have no conflicts of interest relative to the work presented in this manuscript. The views expressed herein are solely those of the authors. The European Union cannot be held responsible for any use that may be made of the information contained in this paper. Mention of trade names or commercial products does not constitute endorsement or recommendation for use.

References

  1. Parasuraman, S. Toxicological screening. J. Pharmacol. Pharmacother. 2011, 2, 74. [Google Scholar] [CrossRef] [Green Version]
  2. Garcia, G.R.; Noyes, P.D.; Tanguay, R.L. Advancements in zebrafish applications for 21st century toxicology. Pharmacol. Ther. 2016, 161, 11–21. [Google Scholar] [CrossRef] [PubMed] [Green Version]
  3. Dix, D.J.; Houck, K.A.; Martin, M.T.; Richard, A.M.; Setzer, R.W.; Kavlock, R.J. The ToxCast Program for Prioritizing Toxicity Testing of Environmental Chemicals. Toxicol. Sci. 2007, 95, 5–12. [Google Scholar] [CrossRef] [PubMed]
  4. Bambino, K.; Chu, J. Zebrafish in Toxicology and Environmental Health. In Current Topics in Developmental Biology; Academic Press Inc.: Amsterdam, The Netherlands, 2017; Volume 124, pp. 331–367. [Google Scholar]
  5. Lai, K.P.; Gong, Z.; Tse, W.K.F. Zebrafish as the toxicant screening model: Transgenic and omics approaches. Aquat. Toxicol. 2021, 234, 105813. [Google Scholar] [CrossRef]
  6. Massei, R.; Knapen, D.; Covaci, A.; Blust, R.; Mayer, P.; Vergauwen, L. Sublethal Effect Concentrations for Non-Polar Narcosis in the Zebrafish Embryo. Environ. Toxicol. Chem. 2021. [Google Scholar] [CrossRef]
  7. Salmi, T.M.; Tan, V.W.T.; Cox, A.G. Dissecting metabolism using zebrafish models of disease. Biochem. Soc. Trans. 2019, 47, 305–315. [Google Scholar] [CrossRef] [PubMed]
  8. Zang, L.; Maddison, L.A.; Chen, W. Zebrafish as a Model for Obesity and Diabetes. Front. Cell Dev. Biol. 2018, 6, 91. [Google Scholar] [CrossRef] [Green Version]
  9. Olesti, E.; González-Ruiz, V.; Wilks, M.F.; Boccard, J.; Rudaz, S. Approaches in metabolomics for regulatory toxicology applications. Analyst 2021, 146, 1820–1834. [Google Scholar] [CrossRef]
  10. Ivanisevic, J.; Want, E.J. From samples to insights into metabolism: Uncovering biologically relevant information in LC- HRMS metabolomics data. Metabolites 2019, 9, 308. [Google Scholar] [CrossRef] [PubMed] [Green Version]
  11. Zhang, X.; Xia, P.; Wang, P.; Yang, J.; Baird, D.J. Omics Advances in Ecotoxicology. Environ. Sci. Technol. 2018, 52, 3842–3851. [Google Scholar] [CrossRef] [PubMed]
  12. Brockmeier, E.K.; Hodges, G.; Hutchinson, T.H.; Butler, E.; Hecker, M.; Tollefsen, K.E.; Garcia-Reyero, N.; Kille, P.; Becker, D.; Chipman, K.; et al. The Role of Omics in the Application of Adverse Outcome Pathways for Chemical Risk Assessment. Toxicol. Sci. 2017, 158, 252–262. [Google Scholar] [CrossRef]
  13. Sperber, S.; Wahl, M.; Berger, F.; Kamp, H.; Lemke, O.; Starck, V.; Walk, T.; Spitzer, M.; Ravenzwaay, B. Metabolomics as read-across tool: An example with 3-aminopropanol and 2-aminoethanol. Regul. Toxicol. Pharmacol. 2019, 108, 104442. [Google Scholar] [CrossRef] [PubMed]
  14. Oka, T.; Nishimura, Y.; Zang, L.; Hirano, M.; Shimada, Y.; Wang, Z.; Umemoto, N.; Kuroyanagi, J.; Nishimura, N.; Tanaka, T. Diet-induced obesity in zebrafish shares common pathophysiological pathways with mammalian obesity. BMC Physiol. 2010, 10, 21. [Google Scholar] [CrossRef] [PubMed] [Green Version]
  15. Ortiz-Villanueva, E.; Jaumot, J.; Martínez, R.; Navarro-Martín, L.; Piña, B.; Tauler, R. Assessment of endocrine disruptors effects on zebrafish (Danio rerio) embryos by untargeted LC-HRMS metabolomic analysis. Sci. Total Environ. 2018, 635, 156–166. [Google Scholar] [CrossRef]
  16. Gebreab, K.Y.; Eeza, M.N.H.; Bai, T.; Zuberi, Z.; Matysik, J.; O’Shea, K.E.; Alia, A.; Berry, J.P. Comparative toxicometabolomics of perfluorooctanoic acid (PFOA) and next-generation perfluoroalkyl substances. Environ. Pollut. 2020, 265, 114928. [Google Scholar] [CrossRef]
  17. Sobanska, M.; Scholz, S.; Nyman, A.-M.; Cesnaitis, R.; Gutierrez Alonso, S.; Klüver, N.; Kühne, R.; Tyle, H.; de Knecht, J.; Dang, Z.; et al. Applicability of the fish embryo acute toxicity (FET) test (OECD 236) in the regulatory context of Registration, Evaluation, Authorisation, and Restriction of Chemicals (REACH). Environ. Toxicol. Chem. 2018, 37, 657–670. [Google Scholar] [CrossRef]
  18. Markin, P.A.; Brito, A.; Moskaleva, N.E.; Tagliaro, F.; La Frano, M.R.; Savitskii, M.V.; Appolonova, S.A. Short- and long-term exposures of the synthetic cannabinoid 5F-APINAC induce metabolomic alterations associated with neurotransmitter systems and embryotoxicity confirmed by teratogenicity in zebrafish. Comp. Biochem. Physiol. Part C Toxicol. Pharmacol. 2021, 243, 109000. [Google Scholar] [CrossRef] [PubMed]
  19. Markin, P.A.; Brito, A.; Moskaleva, N.E.; Tagliaro, F.; Tarasov, V.V.; La Frano, M.R.; Savitskii, M.V.; Appolonova, S.A. Short- and medium-term exposures of diazepam induce metabolomic alterations associated with the serotonergic, dopaminergic, adrenergic and aspartic acid neurotransmitter systems in zebrafish (Danio rerio) embryos/larvae. Comp. Biochem. Physiol. Part D Genom. Proteom. 2021, 38, 100816. [Google Scholar] [CrossRef]
  20. Zhang, J.; Qian, L.; Wang, C.; Teng, M.; Duan, M.; Chen, X.; Li, X.; Wang, C. UPLC-TOF-MS/MS metabolomics analysis of zebrafish metabolism by spirotetramat. Environ. Pollut. 2020, 266, 115310. [Google Scholar] [CrossRef]
  21. Fu, J.; Gong, Z.; Bae, S. Assessment of the effect of methyl-triclosan and its mixture with triclosan on developing zebrafish (Danio rerio) embryos using mass spectrometry-based metabolomics. J. Hazard. Mater. 2019, 368, 186–196. [Google Scholar] [CrossRef]
  22. Hu, Y.; Hu, J.; Li, W.; Gao, Y.; Tian, Y. Changes of embryonic development, locomotor activity, and metabolomics in zebrafish co-exposed to chlorpyrifos and deltamethrin. J. Appl. Toxicol. 2020, 00, 1–12. [Google Scholar] [CrossRef]
  23. Chousidis, I.; Chatzimitakos, T.; Leonardos, D.; Filiou, M.D.; Stalikas, C.D.; Leonardos, I.D. Cannabinol in the spotlight: Toxicometabolomic study and behavioral analysis of zebrafish embryos exposed to the unknown cannabinoid. Chemosphere 2020, 252, 126417. [Google Scholar] [CrossRef] [PubMed]
  24. Teng, M.; Zhu, W.; Wang, D.; Yan, J.; Qi, S.; Song, M.; Wang, C. Acute exposure of zebrafish embryo (Danio rerio) to flutolanil reveals its developmental mechanism of toxicity via disrupting the thyroid system and metabolism. Environ. Pollut. 2018, 242, 1157–1165. [Google Scholar] [CrossRef]
  25. Chen, L.; Hu, Y.; He, J.; Chen, J.; Giesy, J.P.; Xie, P. Responses of the Proteome and Metabolome in Livers of Zebrafish Exposed Chronically to Environmentally Relevant Concentrations of Microcystin-LR. Environ. Sci. Technol. 2017, 51, 596–607. [Google Scholar] [CrossRef]
  26. Chen, Z.; Zang, L.; Wu, Y.; Nakayama, H.; Shimada, Y.; Shrestha, R.; Zhao, Y.; Miura, Y.; Chiba, H.; Hui, S.P.; et al. Lipidomic profiling on oxidized phospholipids in type 2 diabetes mellitus model zebrafish. Anal. Sci. 2018, 34, 1201–1208. [Google Scholar] [CrossRef] [PubMed] [Green Version]
  27. Yao, X.; Cao, D.; Wang, F.; Zhang, W.; Ma, C.; Song, M. An overview of omics approaches to characterize the effect of perfluoroalkyl substances in environmental health. TrAC Trends Anal. Chem. 2019, 121, 115367. [Google Scholar] [CrossRef]
  28. Gómez-Canela, C.; Prats, E.; Piña, B.; Tauler, R. Assessment of chlorpyrifos toxic effects in zebrafish (Danio rerio) metabolism. Environ. Pollut. 2017, 220, 1231–1243. [Google Scholar] [CrossRef]
  29. Zhao, Y.; Qiao, R.; Zhang, S.; Wang, G. Metabolomic profiling reveals the intestinal toxicity of different length of microplastic fibers on zebrafish (Danio rerio). J. Hazard. Mater. 2021, 403, 123663. [Google Scholar] [CrossRef] [PubMed]
  30. Jia, M.; Wang, Y.; Wang, D.; Teng, M.; Yan, J.; Yan, S.; Meng, Z.; Li, R.; Zhou, Z.; Zhu, W. The effects of hexaconazole and epoxiconazole enantiomers on metabolic profile following exposure to zebrafish (Danio rerio) as well as the histopathological changes. Chemosphere 2019, 226, 520–533. [Google Scholar] [CrossRef] [PubMed]
  31. Zou, T.; Liang, Y.-Q.; Liao, X.; Chen, X.-F.; Wang, T.; Song, Y.; Lin, Z.-C.; Qi, Z.; Chen, Z.-F.; Cai, Z. Metabolomics reveals the reproductive abnormality in female zebrafish exposed to environmentally relevant levels of climbazole. Environ. Pollut. 2021, 275, 116665. [Google Scholar] [CrossRef]
  32. American Veterinary Medical Association (AVMA) Guidelines for the Euthanasia of Animals: 2013 Edition. Available online: https://www.avma.org/sites/default/files/resources/euthanasia.pdf (accessed on 12 July 2021).
  33. García-Jaramillo, M.; Beaver, L.M.; Truong, L.; Axton, E.R.; Keller, R.M.; Prater, M.C.; Magnusson, K.R.; Tanguay, R.L.; Stevens, J.F.; Hord, N.G. Nitrate and nitrite exposure leads to mild anxiogenic-like behavior and alters brain metabolomic profile in zebrafish. PLoS ONE 2021, 15, 1–21. [Google Scholar] [CrossRef]
  34. Dreier, D.A.; Nouri, M.Z.; Denslow, N.D.; Martyniuk, C.J. Lipidomics reveals multiple stressor effects (temperature × mitochondrial toxicant) in the zebrafish embryo toxicity test. Chemosphere 2021, 264, 128472. [Google Scholar] [CrossRef] [PubMed]
  35. Lebold, K.M.; Kirkwood, J.S.; Taylor, A.W.; Choi, J.; Barton, C.L.; Miller, G.W.; La Du, J.; Jump, D.B.; Stevens, J.F.; Tanguay, R.L.; et al. Novel liquid chromatography-mass spectrometry method shows that vitamin E deficiency depletes arachidonic and docosahexaenoic acids in zebrafish (danio rerio) embryos. Redox Biol. 2014, 2, 105–113. [Google Scholar] [CrossRef] [Green Version]
  36. Song, Y.; Chai, T.; Yin, Z.; Zhang, X.; Zhang, W.; Qian, Y.; Qiu, J. Stereoselective effects of ibuprofen in adult zebrafish (Danio rerio) using UPLC-TOF/MS-based metabolomics. Environ. Pollut. 2018, 241, 730–739. [Google Scholar] [CrossRef]
  37. Carter, K.M.; Woodley, C.M.; Brown, R.S. A review of tricaine methanesulfonate for anesthesia of fish. Rev. Fish Biol. Fish. 2011, 21, 51–59. [Google Scholar] [CrossRef]
  38. Deebani, A.; Iyer, N.; Raman, R.; Jagadeeswaran, P. Effect of MS222 on Hemostasis in Zebrafish. J. Am. Assoc. Lab. Anim. Sci. 2019, 58, 390–396. [Google Scholar] [CrossRef] [PubMed]
  39. Euthanasia of Experimental Animals. Available online: https://op.europa.eu/en/publication-detail/-/publication/b0ecd88f-8c31-4a5f-9ebd-2c8ad4da4c14 (accessed on 12 July 2021).
  40. Lu, W.; Su, X.; Klein, M.S.; Lewis, I.A.; Fiehn, O.; Rabinowitz, J.D. Metabolite measurement: Pitfalls to avoid and practices to follow. Annu. Rev. Biochem. 2017, 86, 277–304. [Google Scholar] [CrossRef] [PubMed]
  41. Ulmer, C.Z.; Koelmel, J.P.; Jones, C.M.; Garrett, T.J.; Aristizabal-Henao, J.J.; Vesper, H.W.; Bowden, J.A. A Review of Efforts to Improve Lipid Stability during Sample Preparation and Standardization Efforts to Ensure Accuracy in the Reporting of Lipid Measurements. Lipids 2021, 56, 3–16. [Google Scholar] [CrossRef]
  42. Ni, Z.; Sousa, B.C.; Colombo, S.; Afonso, C.B.; Melo, T.; Pitt, A.R.; Spickett, C.M.; Domingues, P.; Domingues, M.R.; Fedorova, M.; et al. Evaluation of air oxidized PAPC: A multi laboratory study by LC-MS/MS. Free Radic. Biol. Med. 2019, 144, 156–166. [Google Scholar] [CrossRef]
  43. Koelmel, J.P.; Jones, C.M.; Ulmer, C.Z.; Garrett, T.J.; Yost, R.A.; Schock, T.B.; Bowden, J.A. Examining heat treatment for stabilization of the lipidome. Bioanalysis 2018, 10, 291–305. [Google Scholar] [CrossRef] [Green Version]
  44. Barnes, S.; Benton, H.P.; Casazza, K.; Cooper, S.J.; Cui, X.; Du, X.; Engler, J.; Kabarowski, J.H.; Li, S.; Pathmasiri, W.; et al. Training in metabolomics research. I. Designing the experiment, collecting and extracting samples and generating metabolomics data. J. Mass Spectrom. 2016, 51, 461–475. [Google Scholar] [CrossRef] [PubMed] [Green Version]
  45. Zhao, Y.; Qin, Z.; Huang, Z.; Bao, Z.; Luo, T.; Jin, Y. Effects of polyethylene microplastics on the microbiome and metabolism in larval zebrafish. Environ. Pollut. 2021, 282, 117039. [Google Scholar] [CrossRef] [PubMed]
  46. Yang, G.; Wang, Y.; Li, J.; Wang, D.; Bao, Z.; Wang, Q.; Jin, Y. Health risks of chlorothalonil, carbendazim, prochloraz, their binary and ternary mixtures on embryonic and larval zebrafish based on metabolomics analysis. J. Hazard. Mater. 2021, 404, 124240. [Google Scholar] [CrossRef] [PubMed]
  47. Bai, X.; Jia, J.; Kang, Q.; Fu, Y.; Zhou, Y.; Zhong, Y.; Zhang, C.; Li, M. Integrated Metabolomics and Lipidomics Analysis Reveal Remodeling of Lipid Metabolism and Amino Acid Metabolism in Glucagon Receptor–Deficient Zebrafish. Front. Cell Dev. Biol. 2021, 8, 605979. [Google Scholar] [CrossRef] [PubMed]
  48. Keerthisinghe, T.P.; Wang, F.; Wang, M.; Yang, Q.; Li, J.; Yang, J.; Xi, L.; Dong, W.; Fang, M. Long-term exposure to TET increases body weight of juvenile zebrafish as indicated in host metabolism and gut microbiome. Environ. Int. 2020, 139, 105705. [Google Scholar] [CrossRef]
  49. Misra, B.B. Data normalization strategies in metabolomics: Current challenges, approaches, and tools. Eur. J. Mass Spectrom. 2020, 26, 165–174. [Google Scholar] [CrossRef]
  50. Chai, T.; Cui, F.; Yin, Z.; Yang, Y.; Qiu, J.; Wang, C. Chiral PCB 91 and 149 Toxicity Testing in Embryo and Larvae (Danio rerio): Application of Targeted Metabolomics via UPLC-MS/MS. Sci. Rep. 2016, 6, 33481. [Google Scholar] [CrossRef] [PubMed] [Green Version]
  51. Rosdy, M.S.; Rofiee, M.S.; Samsulrizal, N.; Salleh, M.Z.; Teh, L.K. Understanding the effects of Moringa oleifera in chronic unpredictable stressed zebrafish using metabolomics analysis. J. Ethnopharmacol. 2021, 278, 114290. [Google Scholar] [CrossRef]
  52. Ong, E.S.; Chor, C.F.; Zou, L.; Ong, C.N. A multi-analytical approach for metabolomic profiling of zebrafish (Danio rerio) livers. Mol. BioSyst. 2009, 5, 288–298. [Google Scholar] [CrossRef]
  53. Saad, M.; Matheeussen, A.; Bijttebier, S.; Verbueken, E.; Pype, C.; Casteleyn, C.; Van Ginneken, C.; Apers, S.; Maes, L.; Cos, P.; et al. In vitro CYP-mediated drug metabolism in the zebrafish (embryo) using human reference compounds. Toxicol. Vitr. 2017, 42, 329–336. [Google Scholar] [CrossRef] [PubMed]
  54. Cuykx, M.; Mortelé, O.; Rodrigues, R.M.; Vanhaecke, T.; Covaci, A. Optimisation of in vitro sample preparation for LC-MS metabolomics applications on HepaRG cell cultures. Anal. Methods 2017, 9, 3704–3712. [Google Scholar] [CrossRef]
  55. Trutschel, D.; Schmidt, S.; Grosse, I.; Neumann, S. Experiment design beyond gut feeling: Statistical tests and power to detect differential metabolites in mass spectrometry data. Metabolomics 2014, 11, 851–860. [Google Scholar] [CrossRef]
  56. Want, E.J.; Masson, P.; Michopoulos, F.; Wilson, I.D.; Theodoridis, G.; Plumb, R.S.; Shockcor, J.; Loftus, N.; Holmes, E.; Nicholson, J.K. Global metabolic profiling of animal and human tissues via UPLC-MS. Nat. Protoc. 2013, 8, 17–32. [Google Scholar] [CrossRef]
  57. McDougall, M.; Choi, J.; Kim, H.K.; Bobe, G.; Stevens, J.F.; Cadenas, E.; Tanguay, R.; Traber, M.G. Lethal dysregulation of energy metabolism during embryonic vitamin E deficiency. Free Radic. Biol. Med. 2017, 104, 324–332. [Google Scholar] [CrossRef] [Green Version]
  58. Chang, W.C.W.; Wu, H.Y.; Yeh, Y.; Liao, P.C. Untargeted foodomics strategy using high-resolution mass spectrometry reveals potential indicators for fish freshness. Anal. Chim. Acta 2020, 1127, 98–105. [Google Scholar] [CrossRef] [PubMed]
  59. Luque de Castro, M.D.; Delgado-Povedano, M.M. Ultrasound: A subexploited tool for sample preparation in metabolomics. Anal. Chim. Acta 2014, 806, 74–84. [Google Scholar] [CrossRef] [PubMed]
  60. Quinlivan, V.H.; Farber, S.A. Lipid uptake, metabolism, and transport in the larval zebrafish. Front. Endocrinol. (Lausanne) 2017, 8, 1. [Google Scholar] [CrossRef]
  61. Gertsman, I.; Barshop, B.A. Promises and pitfalls of untargeted metabolomics. J. Inherit. Metab. Dis. 2018, 41, 355–366. [Google Scholar] [CrossRef]
  62. Fiehn, O. Metabolomics by gas chromatography-mass spectrometry: Combined targeted and untargeted profiling. Curr. Protoc. Mol. Biol. 2016, 2016, 30.4.1–30.4.32. [Google Scholar] [CrossRef]
  63. Le Faouder, P.; Soullier, J.; Tremblay-Franco, M.; Tournadre, A.; Martin, J.-F.; Guitton, Y.; Carlé, C.; Caspar-Bauguil, S.; Denechaud, P.-D.; Bertrand-Michel, J. Untargeted Lipidomic Profiling of Dry Blood Spots Using SFC-HRMS. Metabolites 2021, 11, 305. [Google Scholar] [CrossRef]
  64. Le Faouder, P.; Baillif, V.; Spreadbury, I.; Motta, J.P.; Rousset, P.; Chêne, G.; Guigné, C.; Tercé, F.; Vanner, S.; Vergnolle, N.; et al. LC-MS/MS method for rapid and concomitant quantification of pro-inflammatory and pro-resolving polyunsaturated fatty acid metabolites. J. Chromatogr. B Anal. Technol. Biomed. Life Sci. 2013, 932, 123–133. [Google Scholar] [CrossRef]
  65. Olesti, E.; Boccard, J.; Visconti, G.; González-Ruiz, V.; Rudaz, S. From a single steroid to the steroidome: Trends and analytical challenges. J. Steroid Biochem. Mol. Biol. 2021, 206, 105797. [Google Scholar] [CrossRef] [PubMed]
  66. Li, L.; Zhong, S.; Shen, X.; Li, Q.; Xu, W.; Tao, Y.; Yin, H. Recent development on liquid chromatography-mass spectrometry analysis of oxidized lipids. Free Radic. Biol. Med. 2019, 144, 16–34. [Google Scholar] [CrossRef]
  67. Jenner, A.M.; Brown, S.H.J. Sterol analysis by quantitative mass spectrometry. Methods Mol. Biol. 2017, 1583, 221–239. [Google Scholar] [CrossRef] [PubMed]
  68. Yan, S.-C.; Chen, Z.-F.; Zhang, H.; Chen, Y.; Qi, Z.; Liu, G.; Cai, Z. Evaluation and optimization of sample pretreatment for GC/MS-based metabolomics in embryonic zebrafish. Talanta 2020, 207, 120260. [Google Scholar] [CrossRef]
  69. Zhao, H.-J.; Xu, J.-K.; Yan, Z.-H.; Ren, H.-Q.; Zhang, Y. Microplastics enhance the developmental toxicity of synthetic phenolic antioxidants by disturbing the thyroid function and metabolism in developing zebrafish. Environ. Int. 2020, 140, 105750. [Google Scholar] [CrossRef]
  70. Xu, M.; Legradi, J.; Leonards, P. Evaluation of LC-MS and LC×LC-MS in analysis of zebrafish embryo samples for comprehensive lipid profiling. Anal. Bioanal. Chem. 2020, 412, 4313–4325. [Google Scholar] [CrossRef] [PubMed]
  71. Kim, S.; Chen, J.; Cheng, T.; Gindulyte, A.; He, J.; He, S.; Li, Q.; Shoemaker, B.A.; Thiessen, P.A.; Yu, B.; et al. PubChem in 2021: New data content and improved web interfaces. Nucleic Acids Res. 2021, 49, D1388–D1395. [Google Scholar] [CrossRef]
  72. Gong, Z.G.; Hu, J.; Wu, X.; Xu, Y.J. The Recent Developments in Sample Preparation for Mass Spectrometry-Based Metabolomics. Crit. Rev. Anal. Chem. 2017, 47, 325–331. [Google Scholar] [CrossRef] [PubMed]
  73. Bligh, E.G.; Dyer, W.J. A Rapid Method of Total Lipid Extraction and Purification. Can. J. Biochem. Physiol. 1959, 37, 911–917. [Google Scholar] [CrossRef] [PubMed] [Green Version]
  74. Matyash, V.; Liebisch, G.; Kurzchalia, T.V.; Shevchenko, A.; Schwudke, D. Lipid extraction by methyl-tert-butyl ether for high-throughput lipidomics. J. Lipid Res. 2008, 49, 1137–1146. [Google Scholar] [CrossRef] [PubMed] [Green Version]
  75. Cajka, T.; Fiehn, O. Comprehensive analysis of lipids in biological systems by liquid chromatography-mass spectrometry. TrAC Trends Anal. Chem. 2014, 61, 192–206. [Google Scholar] [CrossRef] [PubMed] [Green Version]
  76. Whiley, L.; Godzien, J.; Ruperez, F.J.; Legido-Quigley, C.; Barbas, C. In-Vial Dual Extraction for Direct LC-MS Analysis of Plasma for Comprehensive and Highly Reproducible Metabolic Fingerprinting. Anal. Chem. 2012, 84, 5992–5999. [Google Scholar] [CrossRef]
  77. Chen, S.; Hoene, M.; Li, J.; Li, Y.; Zhao, X.; Häring, H.-U.U.; Schleicher, E.D.; Weigert, C.; Xu, G.; Lehmann, R. Simultaneous extraction of metabolome and lipidome with methyl tert-butyl ether from a single small tissue sample for ultra-high performance liquid chromatography/mass spectrometry. J. Chromatogr. A 2013, 1298, 9–16. [Google Scholar] [CrossRef] [PubMed]
  78. Liu, J.; Liu, Y.; Yu, H.; Zhang, Y.; Hsu, A.C.Y.; Zhang, M.; Gou, Y.; Sun, W.; Wang, F.; Li, P.; et al. Design, synthesis and biological evaluation of novel pyxinol derivatives with anti-heart failure activity. Biomed. Pharmacother. 2021, 133, 111050. [Google Scholar] [CrossRef] [PubMed]
  79. Ostermann, A.I.; Koch, E.; Rund, K.M.; Kutzner, L.; Mainka, M.; Schebb, N.H. Targeting esterified oxylipins by LC–MS—Effect of sample preparation on oxylipin pattern. Prostaglandins Other Lipid Mediat. 2020, 146, 106384. [Google Scholar] [CrossRef] [PubMed]
  80. Gladine, C.; Ostermann, A.I.; Newman, J.W.; Schebb, N.H. MS-based targeted metabolomics of eicosanoids and other oxylipins: Analytical and inter-individual variabilities. Free Radic. Biol. Med. 2019, 144, 72–89. [Google Scholar] [CrossRef]
  81. Strassburg, K.; Huijbrechts, A.M.L.L.; Kortekaas, K.A.; Lindeman, J.H.; Pedersen, T.L.; Dane, A.; Berger, R.; Brenkman, A.; Hankemeier, T.; van Duynhoven, J.; et al. Quantitative profiling of oxylipins through comprehensive LC-MS/MS analysis: Application in cardiac surgery. Anal. Bioanal. Chem. 2012, 404, 1413–1426. [Google Scholar] [CrossRef] [Green Version]
  82. Han, L.; Matarrita, J.; Sapozhnikova, Y.; Lehotay, S.J. Evaluation of a recent product to remove lipids and other matrix co-extractives in the analysis of pesticide residues and environmental contaminants in foods. J. Chromatogr. A 2016, 1449, 17–29. [Google Scholar] [CrossRef]
  83. Wang, X.; Tan, Z.; Chen, S.; Gui, L.; Li, X.; Ke, D.; Hou, L.; Leung, J.Y.S.S. Norethindrone causes cellular and hepatic injury in zebrafish by compromising the metabolic processes associated with antioxidant defence: Insights from metabolomics. Chemosphere 2021, 275, 130049. [Google Scholar] [CrossRef]
  84. Chatzimitakos, T.G.; Pliatsika, C.; Chousidis, I.; Leonardos, I.D.; Stalikas, C.D. Metabolomic Profiling Unveils the Impact of Non-Doped and Heteroatom-Doped Carbon Nanodots on Zebrafish (Danio rerio) Embryos. Nanomaterials 2021, 11, 483. [Google Scholar] [CrossRef] [PubMed]
  85. Park, M.; Lee, Y.; Khan, A.; Aleta, P.; Cho, Y.; Park, H.; Park, Y.H.; Kim, S. Metabolite tracking to elucidate the effects of environmental pollutants. J. Hazard. Mater. 2019, 376, 112–124. [Google Scholar] [CrossRef] [PubMed]
  86. Ortiz-Villanueva, E.; Navarro-Martín, L.; Jaumot, J.; Benavente, F.; Sanz-Nebot, V.; Piña, B.; Tauler, R. Metabolic disruption of zebrafish (Danio rerio) embryos by bisphenol A. An integrated metabolomic and transcriptomic approach. Environ. Pollut. 2017, 231, 22–36. [Google Scholar] [CrossRef] [PubMed]
  87. Hu, C.; Liu, M.; Wan, T.; Tang, L.; Sun, B.; Zhou, B.; Lam, J.C.W.; Lam, P.K.S.; Chen, L. Disturbances in Microbial and Metabolic Communication across the Gut–Liver Axis Induced by a Dioxin-like Pollutant: An Integrated Metagenomics and Metabolomics Analysis. Environ. Sci. Technol. 2021, 55, 529–537. [Google Scholar] [CrossRef]
  88. Zhang, W.; Song, Y.; Chai, T.; Liao, G.; Zhang, L.; Jia, Q.; Qian, Y.; Qiu, J. Lipidomics perturbations in the brain of adult zebrafish (Danio rerio) after exposure to chiral ibuprofen. Sci. Total Environ. 2020, 713, 136565. [Google Scholar] [CrossRef] [PubMed]
  89. Chen, X.; Teng, M.; Zhang, J.; Qian, L.; Duan, M.; Cheng, Y.; Zhao, F.; Zheng, J.; Wang, C. Tralopyril induces developmental toxicity in zebrafish embryo (Danio rerio) by disrupting the thyroid system and metabolism. Sci. Total Environ. 2020, 746. [Google Scholar] [CrossRef]
  90. Tian, S.; Yan, S.; Meng, Z.; Huang, S.; Sun, W.; Jia, M.; Teng, M.; Zhou, Z.; Zhu, W. New insights into bisphenols induced obesity in zebrafish (Danio rerio): Activation of cannabinoid receptor CB1. J. Hazard. Mater. 2021, 418, 126100. [Google Scholar] [CrossRef]
  91. Fujita, K.K.; Xia, Z.; Tomy, G.; Montina, T.; Wiseman, S. 1H NMR based metabolomic profiling of early life stage zebrafish (Danio rerio) exposed to a water-soluble fraction of weathered sediment-bound diluted bitumen. Aquat. Toxicol. 2021, 232, 105766. [Google Scholar] [CrossRef]
  92. Akhtar, M.T.; Mushtaq, M.Y.; Verpoorte, R.; Richardson, M.K.; Choi, Y.H. Metabolic effects of cannabinoids in zebrafish (Danio rerio) embryos determined by 1H NMR metabolomics. Metabolomics 2016, 12, 44. [Google Scholar] [CrossRef]
  93. Lu, Y.; Zhang, Y.; Deng, Y.; Jiang, W.; Zhao, Y.; Geng, J.; Ding, L.; Ren, H. Uptake and Accumulation of Polystyrene Microplastics in Zebrafish (Danio rerio) and Toxic Effects in Liver. Environ. Sci. Technol. 2016, 50, 4054–4060. [Google Scholar] [CrossRef]
  94. Mishra, P.; Gong, Z.; Kelly, B.C. Assessing pH-dependent toxicity of fluoxetine in embryonic zebrafish using mass spectrometry-based metabolomics. Sci. Total Environ. 2019, 650, 2731–2741. [Google Scholar] [CrossRef] [PubMed]
  95. Iturrospe, E.; Da Silva, K.M.; Talavera Andújar, B.; Cuykx, M.; Boeckmans, J.; Vanhaecke, T.; Covaci, A.; van Nuijs, A.L.N. An exploratory approach for an oriented development of an untargeted hydrophilic interaction liquid chromatography-mass spectrometry platform for polar metabolites in biological matrices. J. Chromatogr. A 2021, 1637, 461807. [Google Scholar] [CrossRef] [PubMed]
  96. da Silva, K.M.; Iturrospe, E.; Heyrman, J.; Koelmel, J.P.; Cuykx, M.; Vanhaecke, T.; Covaci, A.; van Nuijs, A.L.N. Optimization of a liquid chromatography-ion mobility-high resolution mass spectrometry platform for untargeted lipidomic and application to HepaRG cell extracts. Talanta 2021, 235, 122808. [Google Scholar] [CrossRef] [PubMed]
  97. Cuykx, M.; Negreira, N.; Beirnaert, C.; Van den Eede, N.; Rodrigues, R.; Vanhaecke, T.; Laukens, K.; Covaci, A. Tailored liquid chromatography–mass spectrometry analysis improves the coverage of the intracellular metabolome of HepaRG cells. J. Chromatogr. A 2017, 1487, 168–178. [Google Scholar] [CrossRef]
  98. Hammond, V.J.; O’Donnell, V.B. Esterified eicosanoids: Generation, characterization and function. Biochim. Biophys. Acta Biomembr. 2012, 1818, 2403–2412. [Google Scholar] [CrossRef] [Green Version]
  99. Tang, D.-Q.; Zou, L.; Yin, X.-X.; Ong, C.N. HILIC-MS for metabolomics: An attractive and complementary approach to RPLC-MS. Mass Spectrom. Rev. 2016, 35, 574–600. [Google Scholar] [CrossRef]
  100. Li, A.; Hines, K.M.; Xu, L. Lipidomics by HILIC-Ion Mobility-Mass Spectrometry. In Ion Mobility-Mass Spectrometry. Methods in Molecular Biology; Paglia, G., Astarita, G., Eds.; NIH Public Access: New York, NY, USA, 2020; Volume 2084, pp. 119–132. [Google Scholar]
  101. Banerjee, S.; Mazumdar, S. Electrospray Ionization Mass Spectrometry: A Technique to Access the Information beyond the Molecular Weight of the Analyte. Int. J. Anal. Chem. 2012, 2012, 282574. [Google Scholar] [CrossRef] [Green Version]
  102. Xu, M.; Legradi, J.; Leonards, P. Cross platform solutions to improve the zebrafish polar metabolome coverage using LC-QTOF MS: Optimization of separation mechanisms, solvent additives, and resuspension solvents. Talanta 2021, 234, 122688. [Google Scholar] [CrossRef]
  103. Xu, T.; Hu, C.; Xuan, Q.; Xu, G. Recent advances in analytical strategies for mass spectrometry-based lipidomics. Anal. Chim. Acta 2020, 1137, 156–169. [Google Scholar] [CrossRef] [PubMed]
  104. Blaženović, I.; Shen, T.; Mehta, S.S.; Kind, T.; Ji, J.; Piparo, M.; Cacciola, F.; Mondello, L.; Fiehn, O. Increasing Compound Identification Rates in Untargeted Lipidomics Research with Liquid Chromatography Drift Time-Ion Mobility Mass Spectrometry. Anal. Chem. 2018, 90, 10758–10764. [Google Scholar] [CrossRef]
  105. Burnum-Johnson, K.E.; Zheng, X.; Dodds, J.N.; Ash, J.; Fourches, D.; Nicora, C.D.; Wendler, J.P.; Metz, T.O.; Waters, K.M.; Jansson, J.K.; et al. Ion mobility spectrometry and the omics: Distinguishing isomers, molecular classes and contaminant ions in complex samples. TrAC Trends Anal. Chem. 2019, 116, 292–299. [Google Scholar] [CrossRef] [PubMed]
  106. Spicer, R.; Salek, R.M.; Moreno, P.; Cañueto, D.; Steinbeck, C. Navigating freely-available software tools for metabolomics analysis. Metabolomics 2017, 13, 106. [Google Scholar] [CrossRef] [PubMed] [Green Version]
  107. Misra, B.B. New software tools, databases, and resources in metabolomics: Updates from 2020. Metabolomics 2021, 17, 49. [Google Scholar] [CrossRef]
  108. Tsugawa, H.; Ikeda, K.; Takahashi, M.; Satoh, A.; Mori, Y.; Uchino, H.; Okahashi, N.; Yamada, Y.; Tada, I.; Bonini, P.; et al. A lipidome atlas in MS-DIAL 4. Nat. Biotechnol. 2020, 38, 1159–1163. [Google Scholar] [CrossRef] [PubMed]
  109. Treutler, H.; Neumann, S. Prediction, Detection, and Validation of Isotope Clusters in Mass Spectrometry Data. Metabolites 2016, 6, 37. [Google Scholar] [CrossRef] [PubMed] [Green Version]
  110. DeFelice, B.C.; Mehta, S.S.; Samra, S.; Čajka, T.; Wancewicz, B.; Fahrmann, J.F.; Fiehn, O. Mass Spectral Feature List Optimizer (MS-FLO): A Tool To Minimize False Positive Peak Reports in Untargeted Liquid Chromatography–Mass Spectroscopy (LC-MS) Data Processing. Anal. Chem. 2017, 89, 3250–3255. [Google Scholar] [CrossRef] [PubMed]
  111. Riquelme, G.; Zabalegui, N.; Marchi, P.; Jones, C.M.; Monge, M.E. A Python-Based Pipeline for Preprocessing LC–MS Data for Untargeted Metabolomics Workflows. Metabolites 2020, 10, 416. [Google Scholar] [CrossRef]
  112. Klåvus, A.; Kokla, M.; Noerman, S.; Koistinen, V.M.; Tuomainen, M.; Zarei, I.; Meuronen, T.; Häkkinen, M.R.; Rummukainen, S.; Farizah Babu, A.; et al. “Notame”: Workflow for Non-Targeted LC–MS Metabolic Profiling. Metabolites 2020, 10, 135. [Google Scholar] [CrossRef] [Green Version]
  113. Schiffman, C.; Petrick, L.; Perttula, K.; Yano, Y.; Carlsson, H.; Whitehead, T.; Metayer, C.; Hayes, J.; Rappaport, S.; Dudoit, S. Filtering procedures for untargeted LC-MS metabolomics data. BMC Bioinform. 2019, 20, 334. [Google Scholar] [CrossRef] [Green Version]
  114. Blaise, B.J.; Correia, G.D.S.; Haggart, G.A.; Surowiec, I.; Sands, C.; Lewis, M.R.; Pearce, J.T.M.; Trygg, J.; Nicholson, J.K.; Holmes, E.; et al. Statistical analysis in metabolic phenotyping. Nat. Protoc. 2021, 16, 4299–4326. [Google Scholar] [CrossRef] [PubMed]
  115. Goodacre, R.; Broadhurst, D.; Smilde, A.K.; Kristal, B.S.; Baker, J.D.; Beger, R.; Bessant, C.; Connor, S.; Capuani, G.; Craig, A.; et al. Proposed minimum reporting standards for data analysis in metabolomics. Metabolomics 2007, 3, 231–241. [Google Scholar] [CrossRef]
  116. Mendez, K.M.; Pritchard, L.; Reinke, S.N.; Broadhurst, D.I. Toward collaborative open data science in metabolomics using Jupyter Notebooks and cloud computing. Metabolomics 2019, 15, 125. [Google Scholar] [CrossRef] [Green Version]
  117. Evans, A.M.; O’Donovan, C.; Playdon, M.; Beecher, C.; Beger, R.D.; Bowden, J.A.; Broadhurst, D.; Clish, C.B.; Dasari, S.; Dunn, W.B.; et al. Dissemination and analysis of the quality assurance (QA) and quality control (QC) practices of LC–MS based untargeted metabolomics practitioners. Metabolomics 2020, 16, 113. [Google Scholar] [CrossRef] [PubMed]
  118. Fiehn, O.; Robertson, D.; Griffin, J.; van der Werf, M.; Nikolau, B.; Morrison, N.; Sumner, L.W.; Goodacre, R.; Hardy, N.W.; Taylor, C.; et al. The metabolomics standards initiative (MSI). Metabolomics 2007, 3, 175–178. [Google Scholar] [CrossRef]
  119. Viant, M.R.; Ebbels, T.M.D.; Beger, R.D.; Ekman, D.R.; Epps, D.J.T.; Kamp, H.; Leonards, P.E.G.; Loizou, G.D.; MacRae, J.I.; van Ravenzwaay, B.; et al. Use cases, best practice and reporting standards for metabolomics in regulatory toxicology. Nat. Commun. 2019, 10, 3041. [Google Scholar] [CrossRef] [Green Version]
  120. Gika, H.G.; Zisi, C.; Theodoridis, G.; Wilson, I.D. Protocol for quality control in metabolic profiling of biological fluids by U(H)PLC-MS. J. Chromatogr. B 2016, 1008, 15–25. [Google Scholar] [CrossRef]
  121. Beger, R.D.; Dunn, W.B.; Bandukwala, A.; Bethan, B.; Broadhurst, D.; Clish, C.B.; Dasari, S.; Derr, L.; Evans, A.; Fischer, S.; et al. Towards quality assurance and quality control in untargeted metabolomics studies. Metabolomics 2019, 15, 4. [Google Scholar] [CrossRef] [PubMed]
  122. Broadhurst, D.; Goodacre, R.; Reinke, S.N.; Kuligowski, J.; Wilson, I.D.; Lewis, M.R.; Dunn, W.B. Guidelines and considerations for the use of system suitability and quality control samples in mass spectrometry assays applied in untargeted clinical metabolomic studies. Metabolomics 2018, 14, 72. [Google Scholar] [CrossRef] [Green Version]
  123. Sands, C.J.; Gómez-Romero, M.; Correia, G.; Chekmeneva, E.; Camuzeaux, S.; Izzi-Engbeaya, C.; Dhillo, W.S.; Takats, Z.; Lewis, M.R. Representing the Metabolome with High Fidelity: Range and Response as Quality Control Factors in LC-MS-Based Global Profiling. Anal. Chem. 2021, 93, 1924–1933. [Google Scholar] [CrossRef]
  124. Malinowska, J.M.; Viant, M.R. Confidence in metabolite identification dictates the applicability of metabolomics to regulatory toxicology. Curr. Opin. Toxicol. 2019, 16, 32–38. [Google Scholar] [CrossRef]
  125. Sumner, L.W.; Amberg, A.; Barrett, D.; Beale, M.H.; Beger, R.; Daykin, C.A.; Fan, T.W.-M.; Fiehn, O.; Goodacre, R.; Griffin, J.L.; et al. Proposed minimum reporting standards for chemical analysis. Metabolomics 2007, 3, 211–221. [Google Scholar] [CrossRef] [Green Version]
  126. Alseekh, S.; Aharoni, A.; Brotman, Y.; Contrepois, K.; D’Auria, J.; Ewald, J.; Ewald, J.C.; Fraser, P.D.; Giavalisco, P.; Hall, R.D.; et al. Mass spectrometry-based metabolomics: A guide for annotation, quantification and best reporting practices. Nat. Methods 2021, 18, 747–756. [Google Scholar] [CrossRef] [PubMed]
  127. Celma, A.; Sancho, J.V.; Schymanski, E.L.; Fabregat-Safont, D.; Ibáñez, M.; Goshawk, J.; Barknowitz, G.; Hernández, F.; Bijlsma, L. Improving Target and Suspect Screening High-Resolution Mass Spectrometry Workflows in Environmental Analysis by Ion Mobility Separation. Environ. Sci. Technol. 2020, 54, 15120–15131. [Google Scholar] [CrossRef]
  128. Liebisch, G.; Vizcaíno, J.A.; Köfeler, H.; Trötzmüller, M.; Griffiths, W.J.; Schmitz, G.; Spener, F.; Wakelam, M.J.O. Shorthand notation for lipid structures derived from mass spectrometry. J. Lipid Res. 2013, 54, 1523–1530. [Google Scholar] [CrossRef] [PubMed] [Green Version]
  129. Liebisch, G.; Fahy, E.; Aoki, J.; Dennis, E.A.; Durand, T.; Ejsing, C.S.; Fedorova, M.; Feussner, I.; Griffiths, W.J.; Köfeler, H.; et al. Update on LIPID MAPS classification, nomenclature, and shorthand notation for MS-derived lipid structures. J. Lipid Res. 2020, 61, 1539–1555. [Google Scholar] [CrossRef] [PubMed]
  130. Koelmel, J.P.; Ulmer, C.Z.; Jones, C.M.; Yost, R.A.; Bowden, J.A. Common cases of improper lipid annotation using high-resolution tandem mass spectrometry data and corresponding limitations in biological interpretation. Biochim. Biophys. Acta Mol. Cell Biol. Lipids 2017, 1862, 766–770. [Google Scholar] [CrossRef] [PubMed]
  131. Schymanski, E.L.; Jeon, J.; Gulde, R.; Fenner, K.; Ruff, M.; Singer, H.P.; Hollender, J. Identifying Small Molecules via High Resolution Mass Spectrometry: Communicating Confidence. Environ. Sci. Technol. 2014, 48, 2097–2098. [Google Scholar] [CrossRef] [PubMed]
  132. Spicer, R.A.; Salek, R.; Steinbeck, C. A decade after the metabolomics standards initiative it’s time for a revision. Sci. Data 2017, 4, 170138. [Google Scholar] [CrossRef]
  133. Tsugawa, H.; Satoh, A.; Uchino, H.; Cajka, T.; Arita, M.; Arita, M. Mass Spectrometry Data Repository Enhances Novel Metabolite Discoveries with Advances in Computational Metabolomics. Metabolites 2019, 9, 119. [Google Scholar] [CrossRef] [Green Version]
  134. Karampelias, C.; Rezanejad, H.; Rosko, M.; Duan, L.; Lu, J.; Pazzagli, L.; Bertolino, P.; Cesta, C.E.; Liu, X.; Korbutt, G.S.; et al. Reinforcing one-carbon metabolism via folic acid/Folr1 promotes β-cell differentiation. Nat. Commun. 2021, 12, 3362. [Google Scholar] [CrossRef]
  135. Oemer, G.; Lackner, K.; Muigg, K.; Krumschnabel, G.; Watschinger, K.; Sailer, S.; Lindner, H.; Gnaiger, E.; Wortmann, S.B.; Werner, E.R.; et al. Molecular structural diversity of mitochondrial cardiolipins. Proc. Natl. Acad. Sci. USA 2018, 115, 4158–4163. [Google Scholar] [CrossRef] [PubMed] [Green Version]
  136. Arcuri, J.; Veldman, M.B.; Bhattacharya, S.K. Lipidomics dataset of Danio rerio optic nerve regeneration model. Data Br. 2021, 37, 107260. [Google Scholar] [CrossRef] [PubMed]
  137. Fahy, E.; Subramaniam, S. RefMet: A reference nomenclature for metabolomics. Nat. Methods 2020, 17, 1173–1174. [Google Scholar] [CrossRef] [PubMed]
Figure 1. Quality management system strategies in the zebrafish metabolomics workflow.
Metabolites 11 00635 g001
Table 2. Zebrafish studies in publicly available repositories.
TitleStudySampleAnalytical
Technique
Example of Metabolite
Classes Detected *
RepositoryReference
Metabolomics
characterization of zebrafish larvae
Research articleLarvaeRPLC-MS and
HILIC-MS
Hydroxy fatty acids,
tricarboxylic acids, short-chain FA,
folic acids, tetrahydrofolic acids
Metabolomics Workbench (ST001670)[134]
Fasting wildtype, tfeb -/- knockout, and lmna -/- knockout metabolite
profiling of adult zebrafish
Pilot studyKidney, heart, muscle, and liverRPLC-MS and
HILIC-MS
-Metabolomics Workbench (ST000584)-
Zebrafish
Metabolomics:
Model for
Environmental
Metal Toxicity
Seed
project
LarvaeNMR (1H, 700 MHz)Acyl carnitines, Amino acids, Amino FA, Benzoic acids, Branched FA,
Carboximidic acids, Cholines,
Dialkylamines, Hydroxy FA, Imidazolines, Organic phosphoric acids,
Primary alcohols, Saturated FA,
Short-chain acids, Sulfones,
TCA acids, Tertiary amines
Metabolomics Workbench (ST000365)-
Plasticizers as
obesogens in zebrafish
Feasibility
study
LarvaeRPLC-MSAmino acids, Amino FA, Xanthines,
Butenolides, Benzoic acid esters,
Catecholamines, Dicarboxylic acids, Dipeptides, Hypoxanthines,
Monosaccharides, Phosphate esters, Pyrimidine deoxyribonucleosides,
Pyrimidine ribonucleosides,
Pyrimidines, Short-chain acids, Sugar alcohols, Sulfonic acids, TCA acids
Metabolomics Workbench (ST000556)
Molecular
structural diversity of mitochondrial
cardiolipins
Research articleWhole body embryos and adults, head, tailRPLC-MSCardiolipins (# of carbons 48–84)MetaboLights
(MTBLS636)
[135]
Lipidomics dataset of Danio rerio optic nerve regeneration modelData in BriefAdult optic nerveRPLC-MSAcyl carnitines, Ceramides, Dihydroceramides, Ceramide 1-phosphates, Phytoceramides, Sterol esters, Cardiolipins, Ubiquinones,
Diradylglycerols, Fatty acids,
Hexosylceramides,
Glycerophosphocholines,
Glycerophosphoethanolamines,
Glycerophosphoglycerols,
Glycerophosphoinositols,
Glycerophosphoserines,
Sphingomyelins, Triradylglycerols
Metabolomics Workbench (ST001725)[136]
* The metabolite classes were obtained from RefMet [137].
Publisher’s Note: MDPI stays neutral with regard to jurisdictional claims in published maps and institutional affiliations.

