
Comparative Untargeted Metabolomic Profiling of Induced Mitochondrial Fusion in Pancreatic Cancer

 , , and
Abstract
: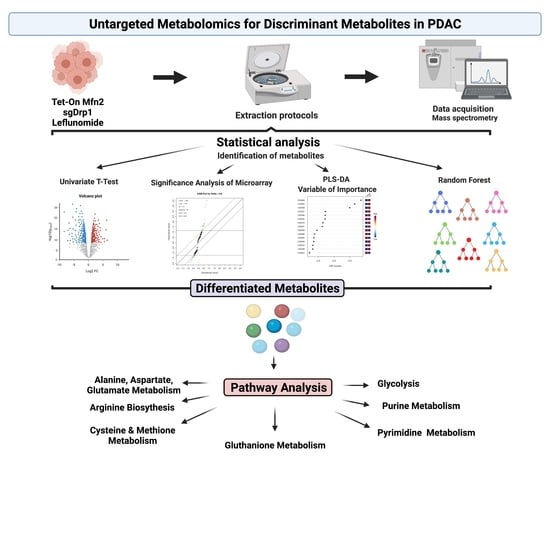
1. Introduction
2. Results
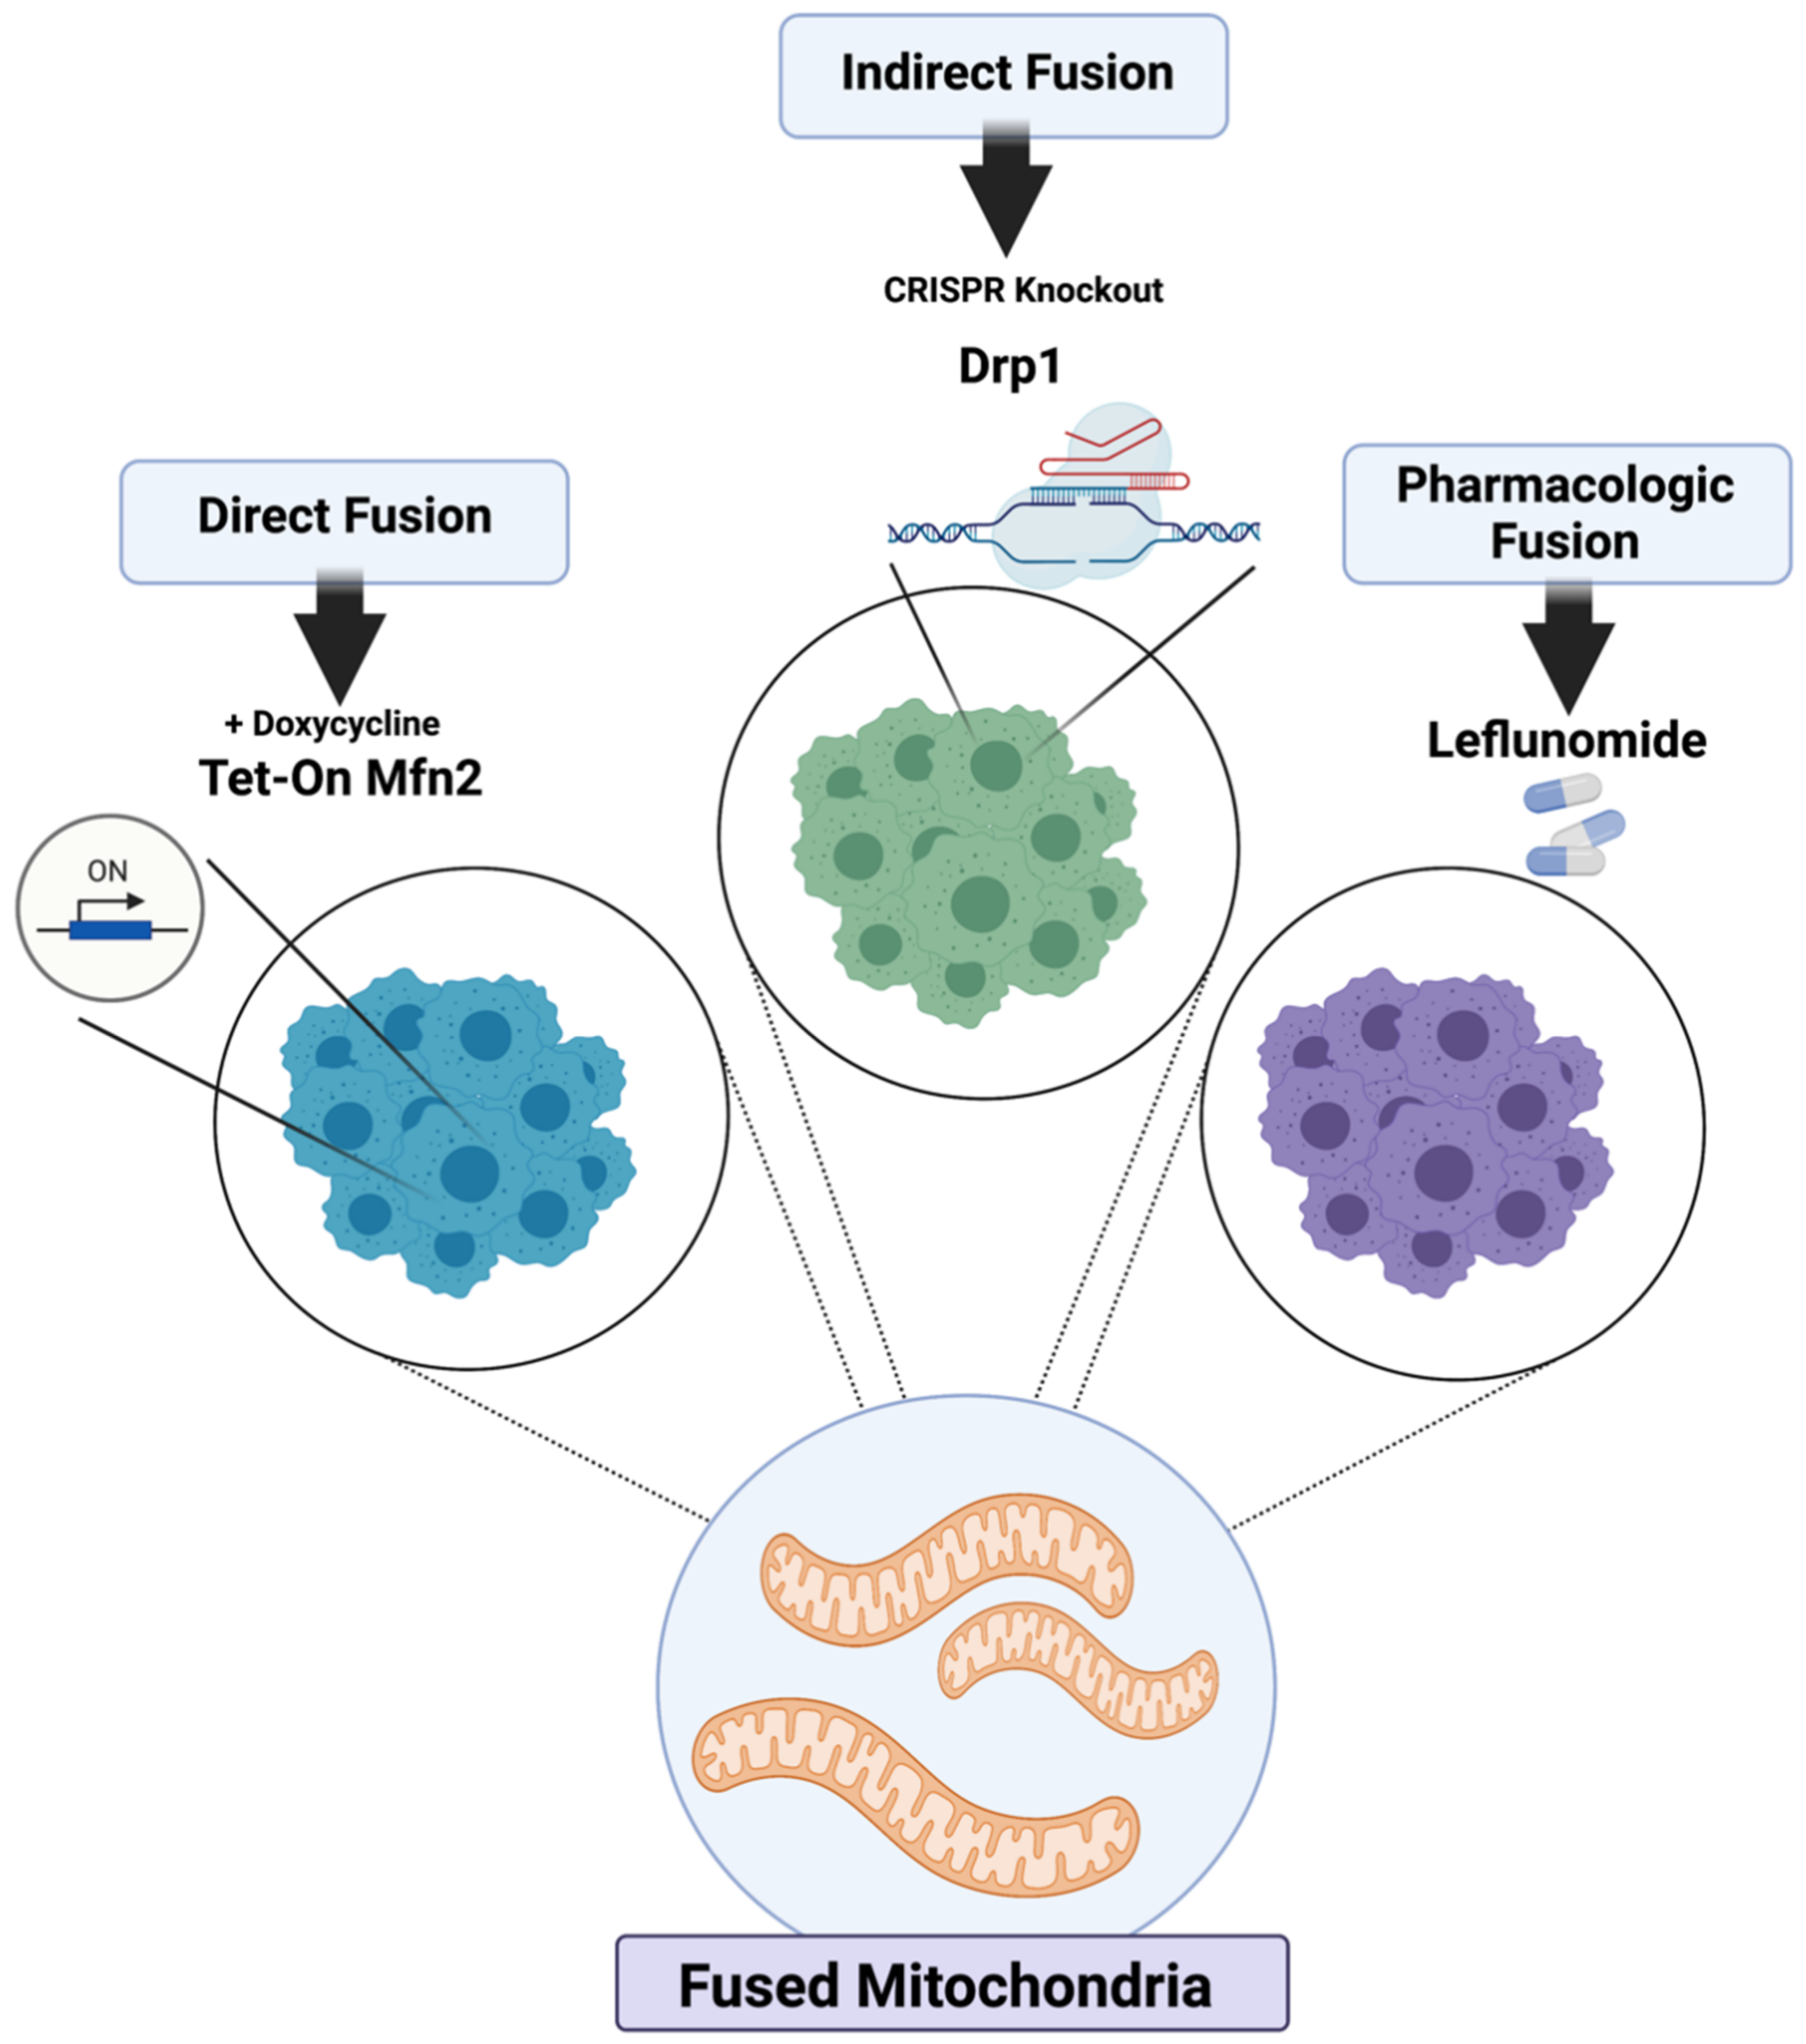
2.1. Genetic and Pharmacologic Induction of Mitochondrial Fusion
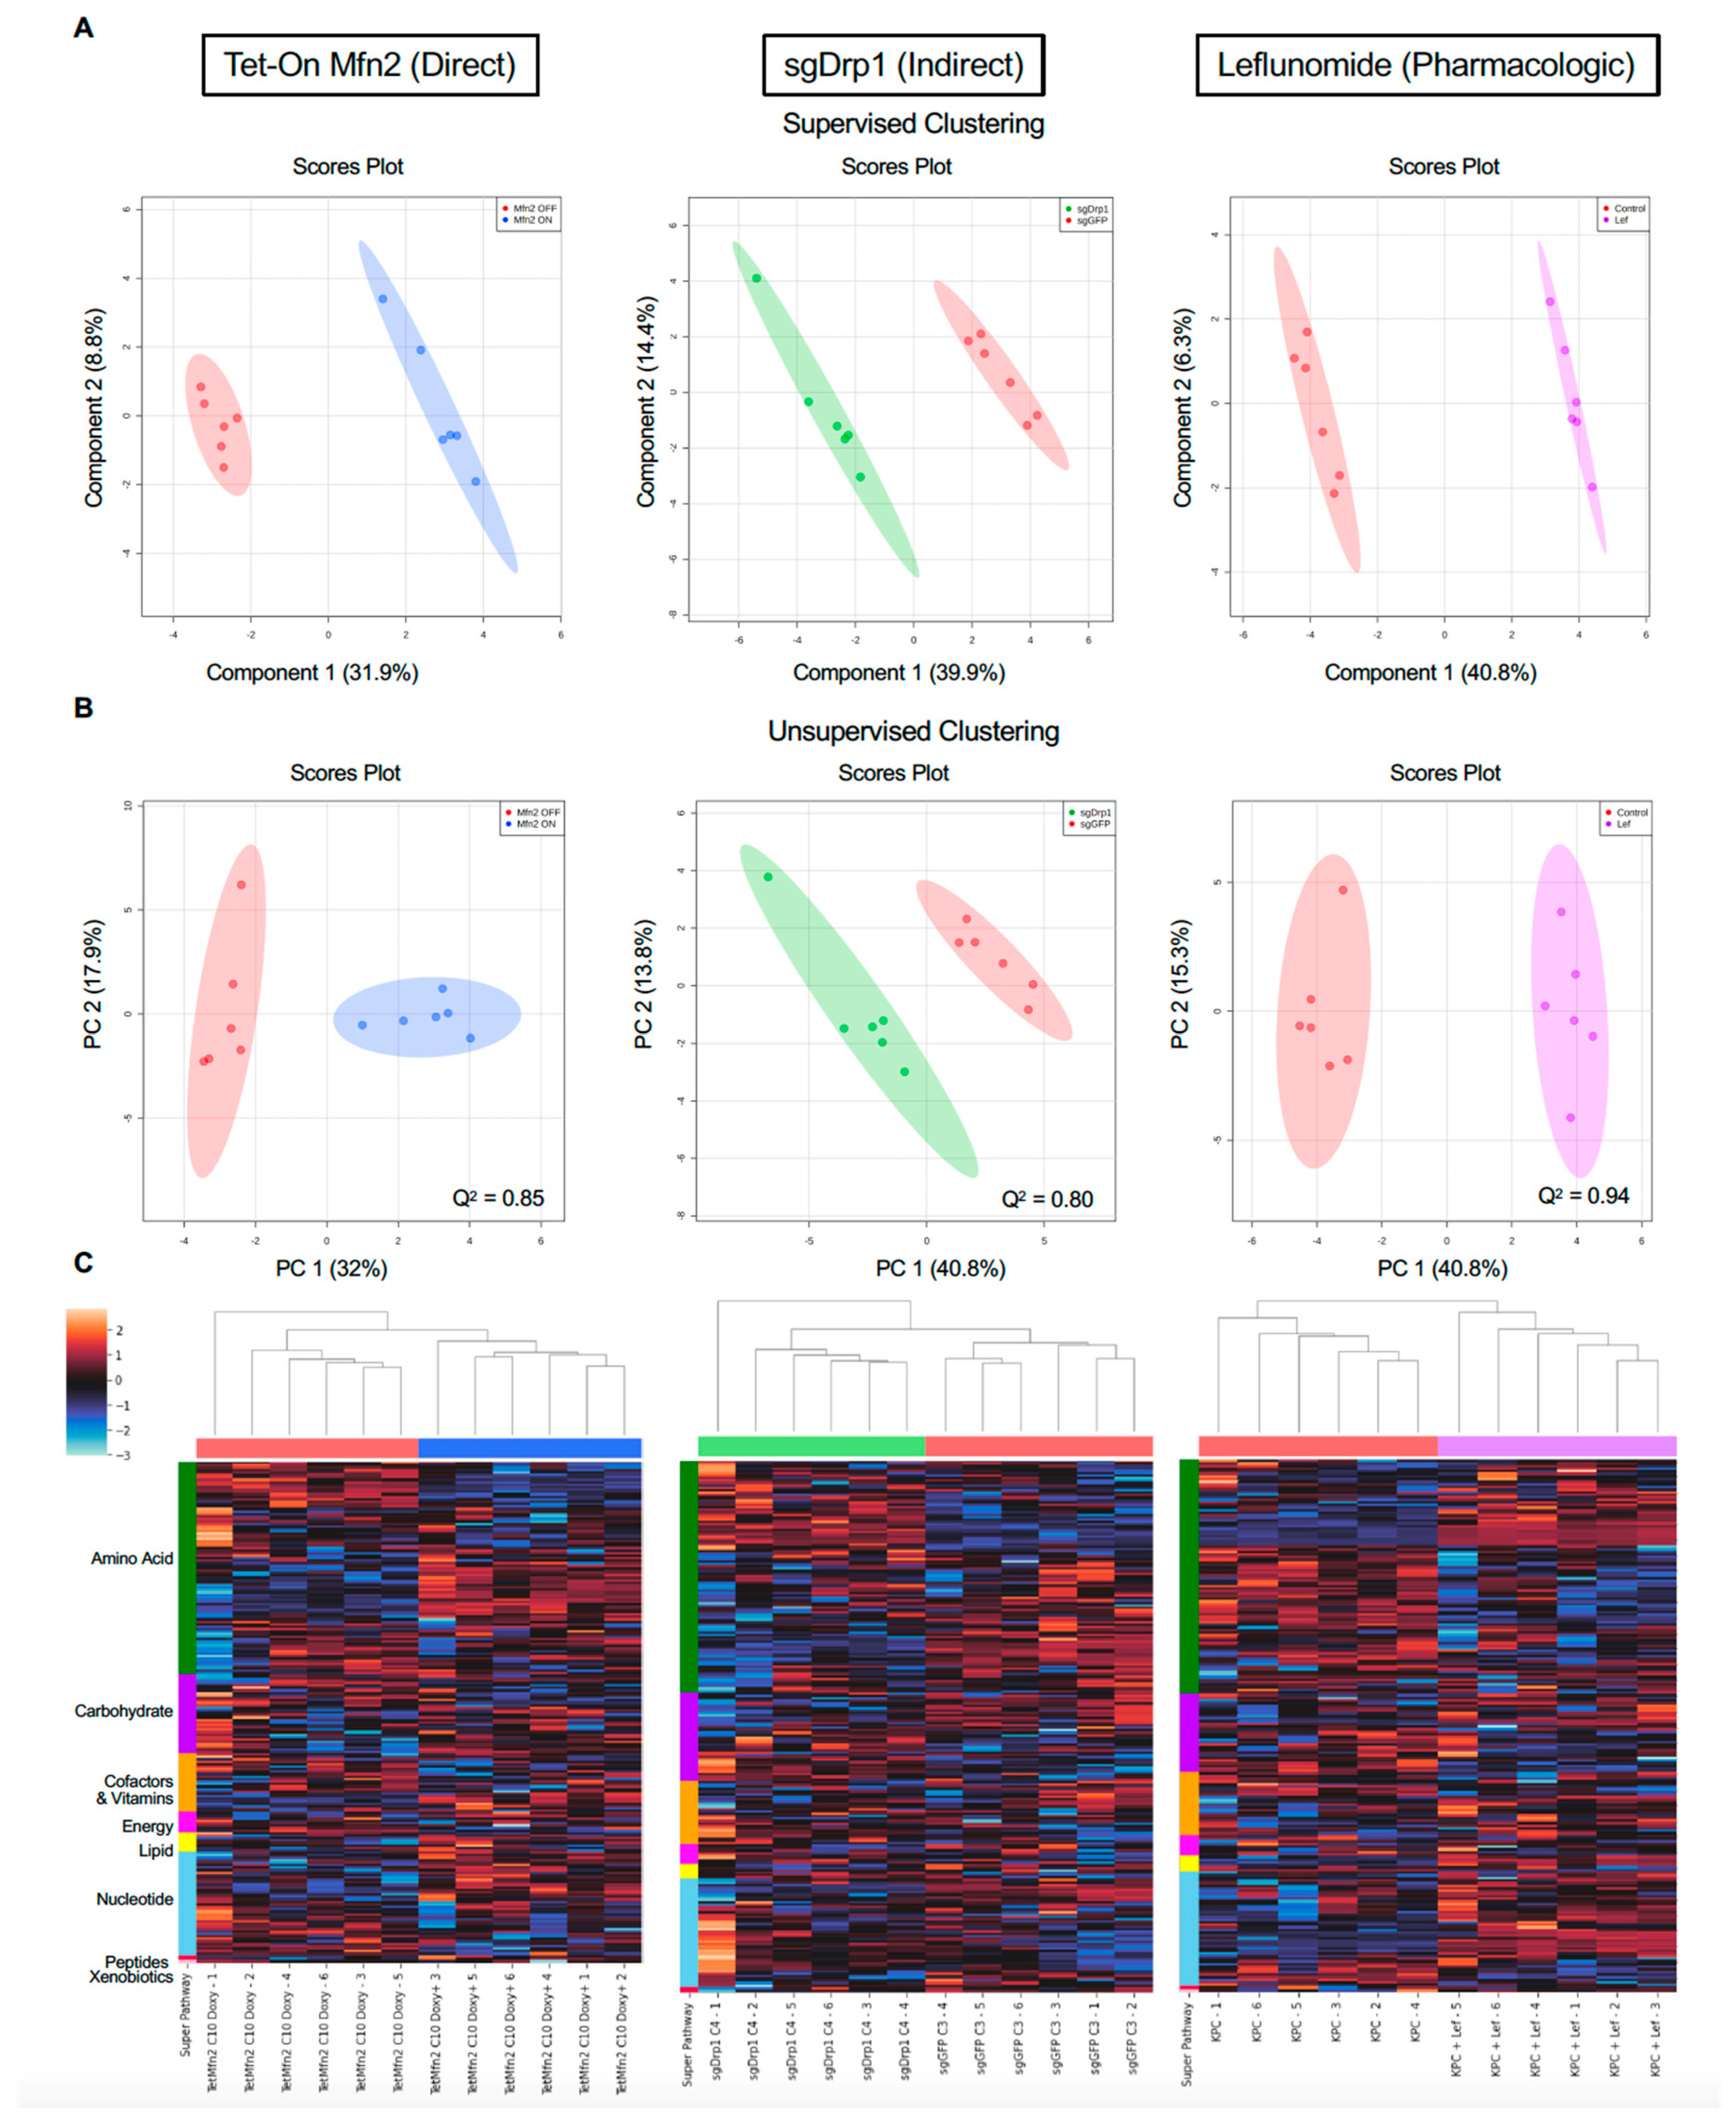
2.2. Mitochondrial Fusion Distinctly Alters PDAC Metabolome
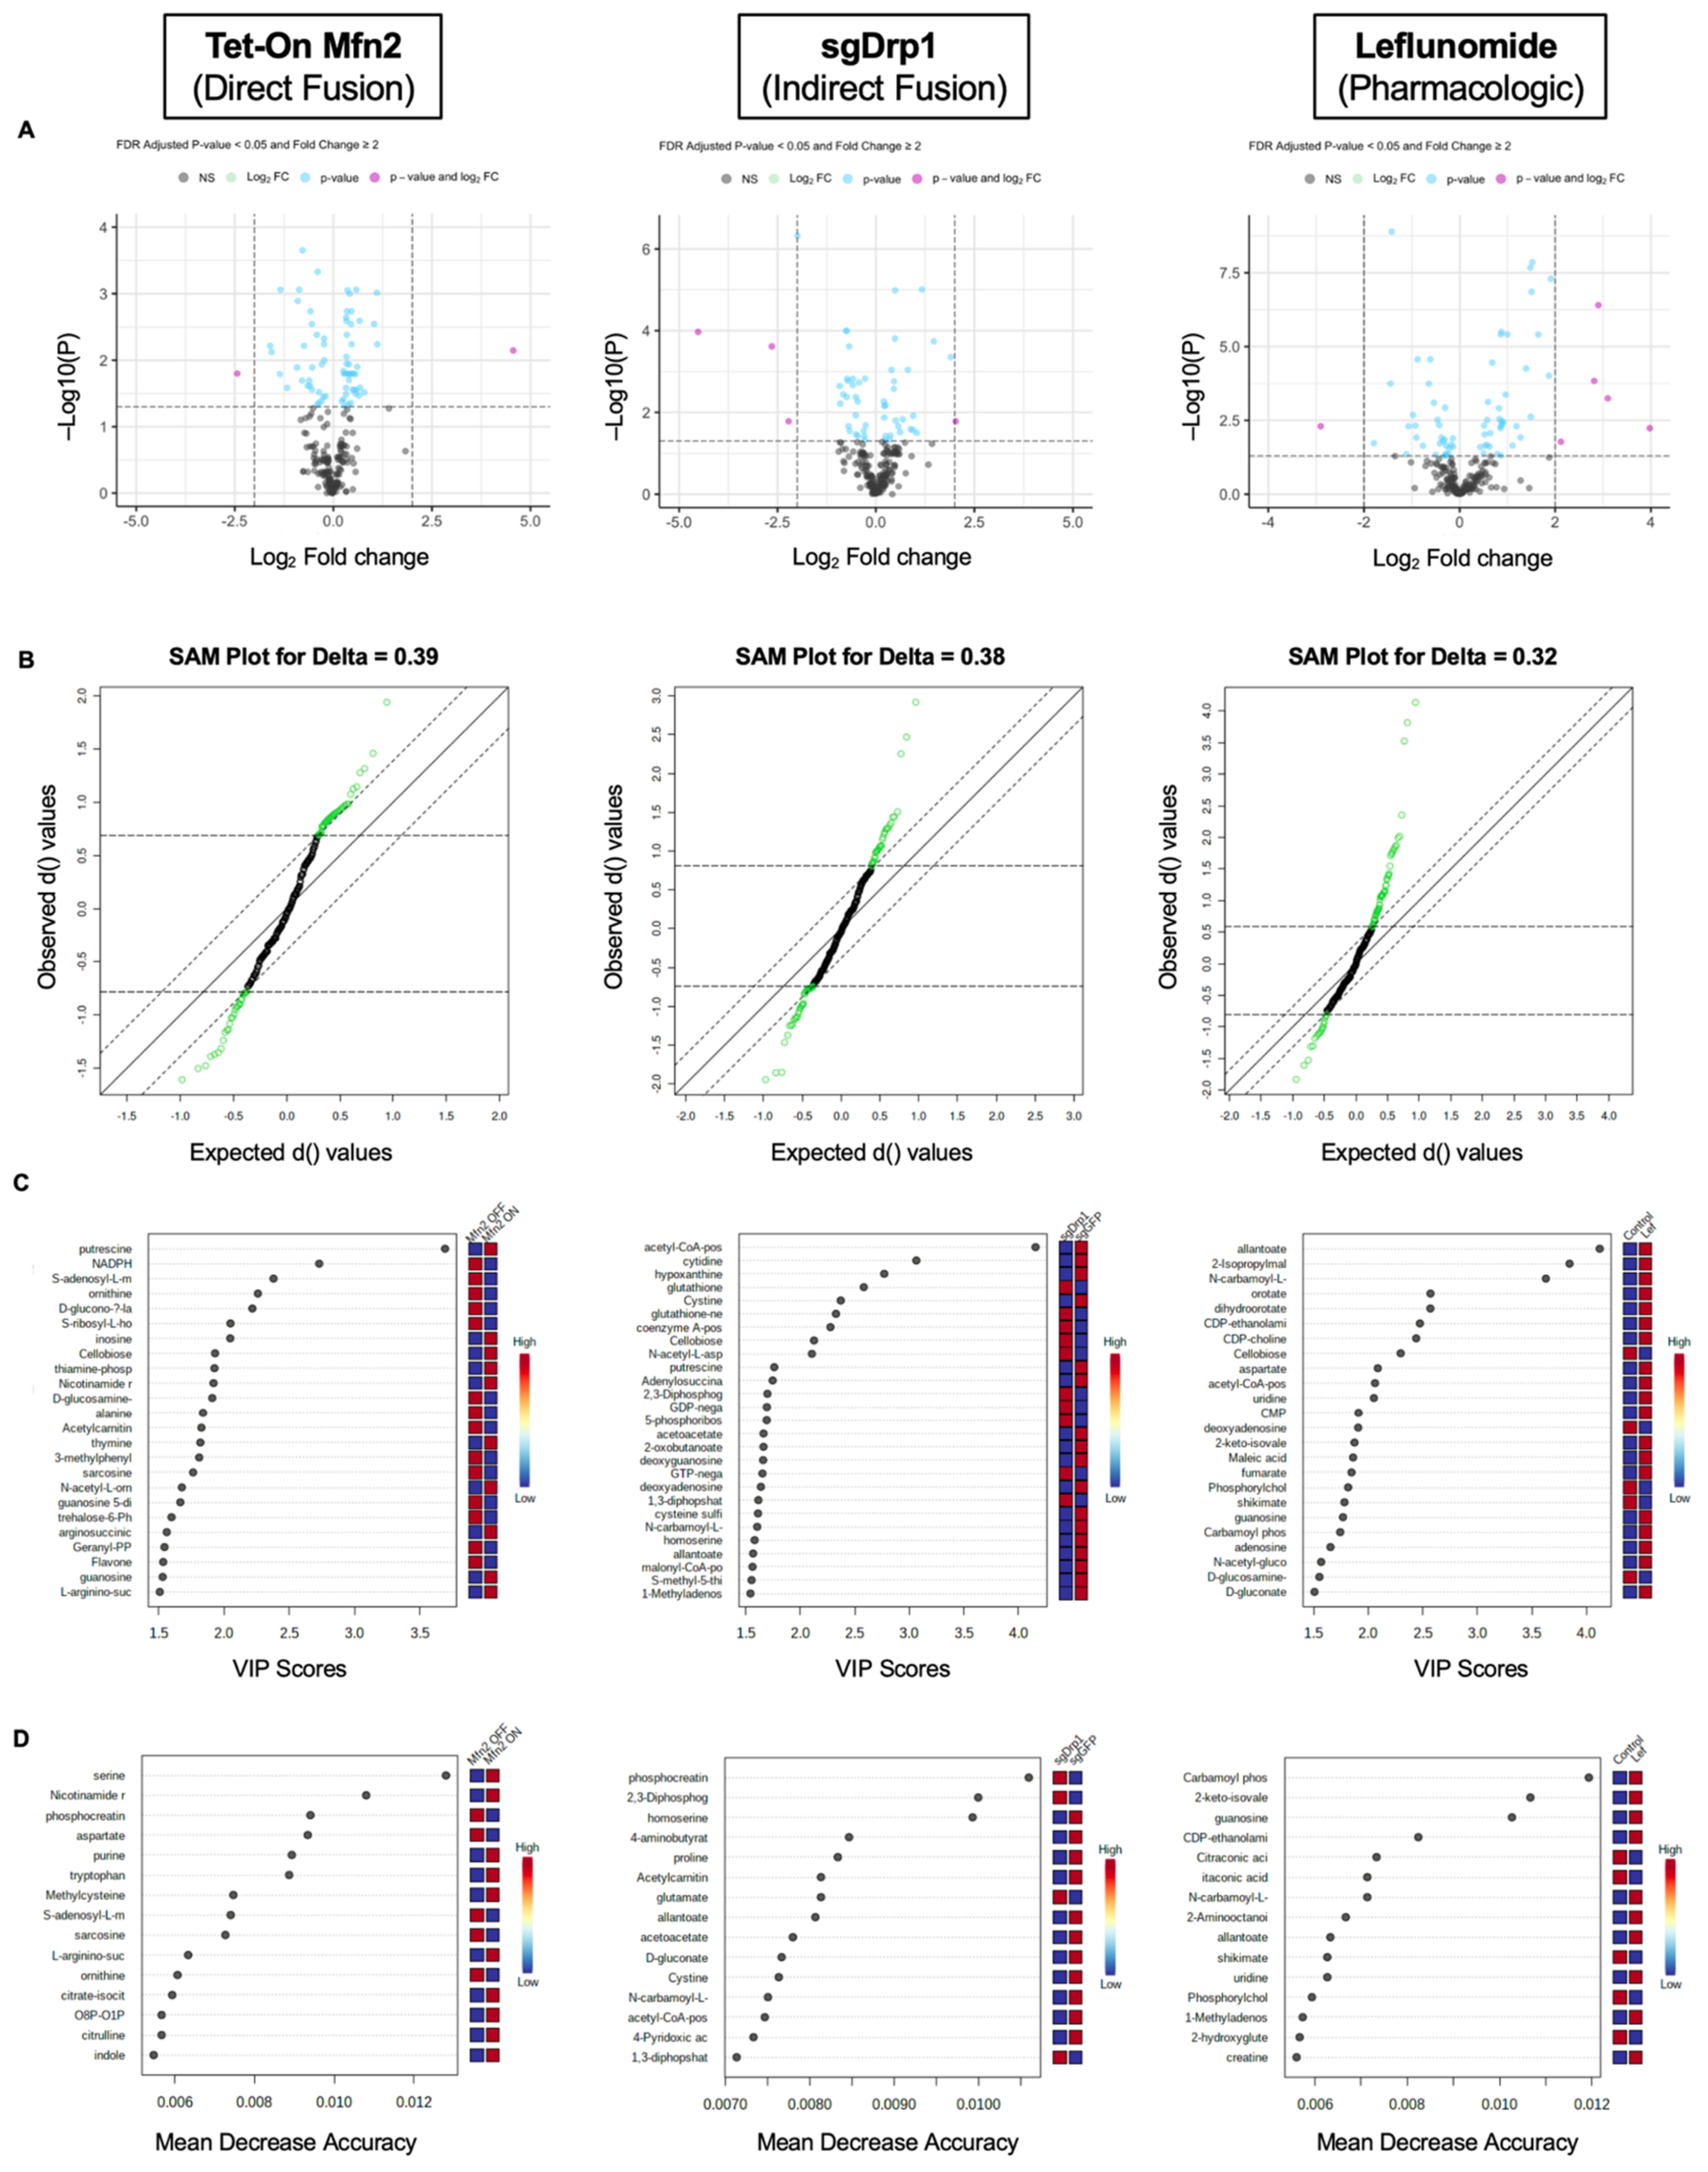
2.3. Identification of Significantly Differentiated Metabolites
2.4. Targeted Pathway Analysis Distinguishes Altered Metabolome after Mitochondrial Fusion
3. Discussion
4. Materials and Methods
4.1. Cell Culture
4.2. Confocal Microscopy and Mitochondrial Morphology Analysis
4.3. Immunoblot Analysis
4.4. Untargeted Metabolomic Analysis
4.5. Discriminant Metabolite Identification
4.6. Pathway Analysis
4.7. Statistical Analysis
5. Conclusions
Supplementary Materials
Author Contributions
Funding
Institutional Review Board Statement
Informed Consent Statement
Data Availability Statement
Acknowledgments
Conflicts of Interest
References
- Hollinshead, K.E.R.; Parker, S.J.; Eapen, V.V.; Encarnacion-Rosado, J.; Sohn, A.; Oncu, T.; Cammer, M.; Mancias, J.D.; Kimmelman, A.C. Respiratory Supercomplexes Promote Mitochondrial Efficiency and Growth in Severely Hypoxic Pancreatic Cancer. Cell Rep. 2020, 33, 108231. [Google Scholar] [CrossRef]
- Zhao, J.; Zhang, J.; Yu, M.; Xie, Y.; Huang, Y.; Wolff, D.W.; Abel, P.W.; Tu, Y. Mitochondrial Dynamics Regulates Migration and Invasion of Breast Cancer Cells. Oncogene 2013, 32, 4814–4824. [Google Scholar] [CrossRef]
- Yu, M.; Nguyen, N.D.; Huang, Y.; Lin, D.; Fujimoto, T.N.; Molkentine, J.M.; Deorukhkar, A.; Kang, Y.; San Lucas, F.A.; Fernandes, C.J.; et al. Mitochondrial Fusion Exploits a Therapeutic Vulnerability of Pancreatic Cancer. JCI Insight 2019, 4, e126915. [Google Scholar] [CrossRef]
- Kashatus, J.A.; Nascimento, A.; Myers, L.J.; Sher, A.; Byrne, F.L.; Hoehn, K.L.; Counter, C.M.; Kashatus, D.F. Erk2 Phosphorylation of Drp1 Promotes Mitochondrial Fission and MAPK-Driven Tumor Growth. Mol. Cell 2015, 57, 537–551. [Google Scholar] [CrossRef] [PubMed] [Green Version]
- Senft, D.; Ronai, Z.A. Regulators of Mitochondrial Dynamics in Cancer. Curr. Opin. Cell Biol. 2016, 39, 43–52. [Google Scholar] [CrossRef] [Green Version]
- Koundinya, M.; Sudhalter, J.; Courjaud, A.; Lionne, B.; Touyer, G.; Bonnet, L.; Menguy, I.; Schreiber, I.; Perrault, C.; Vougier, S.; et al. Dependence on the Pyrimidine Biosynthetic Enzyme DHODH Is a Synthetic Lethal Vulnerability in Mutant KRAS-Driven Cancers. Cell Chem. Biol. 2018, 25, 705–717.e11. [Google Scholar] [CrossRef] [PubMed] [Green Version]
- Nagdas, S.; Kashatus, J.A.; Nascimento, A.; Hussain, S.S.; Trainor, R.E.; Pollock, S.R.; Adair, S.J.; Michaels, A.D.; Sesaki, H.; Stelow, E.B.; et al. Drp1 Promotes KRas-Driven Metabolic Changes to Drive Pancreatic Tumor Growth. Cell Rep. 2019, 28, 1845–1859.e5. [Google Scholar] [CrossRef] [PubMed] [Green Version]
- Miret-Casals, L.; Sebastián, D.; Brea, J.; Rico-Leo, E.M.; Palacín, M.; Fernández-Salguero, P.M.; Loza, M.I.; Albericio, F.; Zorzano, A. Identification of New Activators of Mitochondrial Fusion Reveals a Link between Mitochondrial Morphology and Pyrimidine Metabolism. Cell Chem. Biol. 2018, 25, 268–278.e4. [Google Scholar] [CrossRef] [Green Version]
- Phan, T.; Nguyen, V.H.; Buettner, R.; Morales, C.; Yang, L.; Wong, P.; Tsai, W.; d’Alincourt Salazar, M.; Gil, Z.; Diamond, D.J.; et al. Inhibition of de Novo Pyrimidine Synthesis Augments Gemcitabine Induced Growth Inhibition in an Immunocompetent Model of Pancreatic Cancer. Int. J. Biol. Sci. 2021, 17, 2240–2251. [Google Scholar] [CrossRef]
- Buettner, R.; Morales, C.; Wu, X.; Sanchez, J.F.; Li, H.; Melstrom, L.G.; Rosen, S.T. Leflunomide Synergizes with Gemcitabine in Growth Inhibition of PC Cells and Impairs C-Myc Signaling through PIM Kinase Targeting. Mol. Ther.—Oncolytics 2019, 14, 149–158. [Google Scholar] [CrossRef]
- Fujimoto, T.N.; Colbert, L.E.; Huang, Y.; Molkentine, J.M.; Deorukhkar, A.; Baseler, L.; de la Cruz Bonilla, M.; Yu, M.; Lin, D.; Gupta, S.; et al. Selective EGLN Inhibition Enables Ablative Radiotherapy and Improves Survival in Unresectable Pancreatic Cancer. Cancer Res. 2019, 79, 2327–2338. [Google Scholar] [CrossRef] [PubMed] [Green Version]
- Yuan, M.; Breitkopf, S.B.; Yang, X.; Asara, J.M. A Positive/Negative Ion–Switching, Targeted Mass Spectrometry–Based Metabolomics Platform for Bodily Fluids, Cells, and Fresh and Fixed Tissue. Nat. Protoc. 2012, 7, 872–881. [Google Scholar] [CrossRef] [PubMed] [Green Version]
- Sousa, C.M.; Biancur, D.E.; Wang, X.; Halbrook, C.J.; Sherman, M.H.; Zhang, L.; Kremer, D.; Hwang, R.F.; Witkiewicz, A.K.; Ying, H.; et al. Pancreatic Stellate Cells Support Tumour Metabolism through Autophagic Alanine Secretion. Nature 2016, 536, 479–483. [Google Scholar] [CrossRef] [Green Version]
- Weckmann, K.; Diefenthäler, P.; Baeken, M.W.; Yusifli, K.; Turck, C.W.; Asara, J.M.; Behl, C.; Hajieva, P. Metabolomics Profiling Reveals Differential Adaptation of Major Energy Metabolism Pathways Associated with Autophagy upon Oxygen and Glucose Reduction. Sci. Rep. 2018, 8, 2337. [Google Scholar] [CrossRef]
- Gao, J.; Guo, Z.; Cheng, J.; Sun, B.; Yang, J.; Li, H.; Wu, S.; Dong, F.; Yan, X. Differential Metabolic Responses in Breast Cancer Cell Lines to Acidosis and Lactic Acidosis Revealed by Stable Isotope Assisted Metabolomics. Sci. Rep. 2020, 10, 21967. [Google Scholar] [CrossRef]
- Oza, V.H.; Aicher, J.K.; Reed, L.K. Random Forest Analysis of Untargeted Metabolomics Data Suggests Increased Use of Omega Fatty Acid Oxidation Pathway in Drosophila Melanogaster Larvae Fed a Medium Chain Fatty Acid Rich High-Fat Diet. Metabolites 2018, 9, 5. [Google Scholar] [CrossRef] [Green Version]
- Graham, S.F.; Rey, N.L.; Yilmaz, A.; Kumar, P.; Madaj, Z.; Maddens, M.; Bahado-Singh, R.O.; Becker, K.; Schulz, E.; Meyerdirk, L.K.; et al. Biochemical Profiling of the Brain and Blood Metabolome in a Mouse Model of Prodromal Parkinson’s Disease Reveals Distinct Metabolic Profiles. J. Proteome Res. 2018, 17, 2460–2469. [Google Scholar] [CrossRef]
- Liang, J.; Yang, Y.; Bai, L.; Li, F.; Li, E. DRP1 Upregulation Promotes Pancreatic Cancer Growth and Metastasis through Increased Aerobic Glycolysis. J. Gastroenterol. Hepatol. 2020, 35, 885–895. [Google Scholar] [CrossRef] [PubMed]
- Matoba, S.; Kang, J.-G.; Patino, W.D.; Wragg, A.; Boehm, M.; Gavrilova, O.; Hurley, P.J.; Bunz, F.; Hwang, P.M. P53 Regulates Mitochondrial Respiration. Science 2006, 312, 1650–1653. [Google Scholar] [CrossRef] [PubMed]
- Catchpole, G.; Platzer, A.; Weikert, C.; Kempkensteffen, C.; Johannsen, M.; Krause, H.; Jung, K.; Miller, K.; Willmitzer, L.; Selbig, J.; et al. Metabolic Profiling Reveals Key Metabolic Features of Renal Cell Carcinoma. J. Cell. Mol. Med. 2011, 15, 109–118. [Google Scholar] [CrossRef] [Green Version]
- Pelicano, H.; Xu, R.; Du, M.; Feng, L.; Sasaki, R.; Carew, J.S.; Hu, Y.; Ramdas, L.; Hu, L.; Keating, M.J.; et al. Mitochondrial Respiration Defects in Cancer Cells Cause Activation of Akt Survival Pathway through a Redox-Mediated Mechanism. J. Cell Biol. 2006, 175, 913–923. [Google Scholar] [CrossRef]
- Hardie, R.-A.; van Dam, E.; Cowley, M.; Han, T.-L.; Balaban, S.; Pajic, M.; Pinese, M.; Iconomou, M.; Shearer, R.F.; McKenna, J.; et al. Mitochondrial Mutations and Metabolic Adaptation in Pancreatic Cancer. Cancer Metab. 2017, 5, 2. [Google Scholar] [CrossRef]
- Santana-Codina, N.; Roeth, A.A.; Zhang, Y.; Yang, A.; Mashadova, O.; Asara, J.M.; Wang, X.; Bronson, R.T.; Lyssiotis, C.A.; Ying, H.; et al. Oncogenic KRAS Supports Pancreatic Cancer through Regulation of Nucleotide Synthesis. Nat. Commun. 2018, 9, 4945. [Google Scholar] [CrossRef] [Green Version]
- Ying, H.; Kimmelman, A.C.; Lyssiotis, C.A.; Hua, S.; Chu, G.C.; Fletcher-Sananikone, E.; Locasale, J.W.; Son, J.; Zhang, H.; Coloff, J.L.; et al. Oncogenic Kras Maintains Pancreatic Tumors through Regulation of Anabolic Glucose Metabolism. Cell 2012, 149, 656–670. [Google Scholar] [CrossRef] [Green Version]
- Vettore, L.; Westbrook, R.L.; Tennant, D.A. New Aspects of Amino Acid Metabolism in Cancer. Br. J. Cancer 2020, 122, 150–156. [Google Scholar] [CrossRef]
- Lyssiotis, C.; Son, J.; Mancias, J.; Ying, H.; Kimmelman, A.; Cantley, L. Pancreatic Cancers Depend on a Non-Canonical Glutamine Metabolism Pathway. Cancer Metab. 2014, 2, P44. [Google Scholar] [CrossRef] [Green Version]
- Son, J.; Lyssiotis, C.A.; Ying, H.; Wang, X.; Hua, S.; Ligorio, M.; Perera, R.M.; Ferrone, C.R.; Mullarky, E.; Shyh-Chang, N.; et al. Glutamine Supports Pancreatic Cancer Growth through a KRAS-Regulated Metabolic Pathway. Nature 2013, 496, 101–105. [Google Scholar] [CrossRef]
- Pathria, G.; Lee, J.S.; Hasnis, E.; Tandoc, K.; Scott, D.A.; Verma, S.; Feng, Y.; Larue, L.; Sahu, A.D.; Topisirovic, I.; et al. Translational Reprogramming Marks Adaptation to Asparagine Restriction in Cancer. Nat. Cell Biol. 2019, 21, 1590–1603. [Google Scholar] [CrossRef] [PubMed]
- Bachet, J.-B.; Gay, F.; Maréchal, R.; Galais, M.-P.; Adenis, A.; MsC, D.S.; Cros, J.; Demetter, P.; Svrcek, M.; Bardier-Dupas, A.; et al. Asparagine Synthetase Expression and Phase I Study With L-Asparaginase Encapsulated in Red Blood Cells in Patients With Pancreatic Adenocarcinoma. Pancreas 2015, 44, 1141–1147. [Google Scholar] [CrossRef] [PubMed]
- Bryant, K.L.; Mancias, J.D.; Kimmelman, A.C.; Der, C.J. KRAS: Feeding Pancreatic Cancer Proliferation. Trends Biochem. Sci. 2014, 39, 91–100. [Google Scholar] [CrossRef] [Green Version]
- Viale, A.; Pettazzoni, P.; Lyssiotis, C.A.; Ying, H.; Sánchez, N.; Marchesini, M.; Carugo, A.; Green, T.; Seth, S.; Giuliani, V.; et al. Oncogene Ablation-Resistant Pancreatic Cancer Cells Depend on Mitochondrial Function. Nature 2014, 514, 628–632. [Google Scholar] [CrossRef] [Green Version]
- Dey, P.; Li, J.; Zhang, J.; Chaurasiya, S.; Strom, A.; Wang, H.; Liao, W.-T.; Cavallaro, F.; Denz, P.; Bernard, V.; et al. Oncogenic KRAS-Driven Metabolic Reprogramming in Pancreatic Cancer Cells Utilizes Cytokines from the Tumor Microenvironment. Cancer Discov. 2020, 10, 608–625. [Google Scholar] [CrossRef]
- Efron, B.; Tibshirani, R.; Storey, J.D.; Tusher, V. Empirical Bayes Analysis of a Microarray Experiment. J. Am. Stat. Assoc. 2001, 96, 1151–1160. [Google Scholar] [CrossRef]
- Jeanmougin, M.; de Reynies, A.; Marisa, L.; Paccard, C.; Nuel, G.; Guedj, M. Should We Abandon the t-Test in the Analysis of Gene Expression Microarray Data: A Comparison of Variance Modeling Strategies. PLoS ONE 2010, 5, e12336. [Google Scholar] [CrossRef]
- Zhang, S. A Comprehensive Evaluation of SAM, the SAM R-Package and a Simple Modification to Improve Its Performance. BMC Bioinform. 2007, 8, 230. [Google Scholar] [CrossRef] [PubMed] [Green Version]
- Tusher, V.G.; Tibshirani, R.; Chu, G. Significance Analysis of Microarrays Applied to the Ionizing Radiation Response. Proc. Natl. Acad. Sci. USA 2001, 98, 5116–5121. [Google Scholar] [CrossRef] [PubMed] [Green Version]
- Worley, B.; Powers, R. Multivariate Analysis in Metabolomics. Curr. Metab. 2013, 1, 92–107. [Google Scholar] [CrossRef]
- Yun, Y.-H.; Liang, F.; Deng, B.-C.; Lai, G.-B.; Vicente Gonçalves, C.M.; Lu, H.-M.; Yan, J.; Huang, X.; Yi, L.-Z.; Liang, Y.-Z. Informative Metabolites Identification by Variable Importance Analysis Based on Random Variable Combination. Metabolomics 2015, 11, 1539–1551. [Google Scholar] [CrossRef]
- Chong, I.-G.; Jun, C.-H. Performance of Some Variable Selection Methods When Multicollinearity Is Present. Chemom. Intell. Lab. Syst. 2005, 78, 103–112. [Google Scholar] [CrossRef]
- Lin, Z.; Vicente Gonçalves, C.M.; Dai, L.; Lu, H.; Huang, J.; Ji, H.; Wang, D.; Yi, L.; Liang, Y. Exploring Metabolic Syndrome Serum Profiling Based on Gas Chromatography Mass Spectrometry and Random Forest Models. Anal. Chim. Acta 2014, 827, 22–27. [Google Scholar] [CrossRef]
- Poisson, L.M.; Munkarah, A.; Madi, H.; Datta, I.; Hensley-Alford, S.; Tebbe, C.; Buekers, T.; Giri, S.; Rattan, R. A Metabolomic Approach to Identifying Platinum Resistance in Ovarian Cancer. J. Ovarian Res. 2015, 8, 13. [Google Scholar] [CrossRef] [Green Version]
- Pang, Z.; Chong, J.; Zhou, G.; de Lima Morais, D.A.; Chang, L.; Barrette, M.; Gauthier, C.; Jacques, P.-É.; Li, S.; Xia, J. MetaboAnalyst 5.0: Narrowing the Gap between Raw Spectra and Functional Insights. Nucleic Acids Res. 2021, 49, W388–W396. [Google Scholar] [CrossRef]
- Blighe, K.; Rana, S.; Turkes, E.; Ostendorf, B.; Grioni, A.; Lewis, M. EnhancedVolcano: Publication-Ready Volcano Plots with Enhanced Colouring and Labeling; Bioconductor Version; Release (3.13). 2021. Available online: https://bioconductor.org/packages/release/bioc/html/EnhancedVolcano.html (accessed on 6 August 2021).


| Pathway Name | Tet-On Mfn2 (Direct Fusion) | sgDrp1 (Indirect Fusion) | Leflunomide (Pharmacologic) | |||||||||
|---|---|---|---|---|---|---|---|---|---|---|---|---|
| Percent Affected | Differentiated Metabolites | FDR | Impact | Percent Affected | Differentiated Metabolites | FDR | Impact | Percent Affected | Differentiated Metabolites | FDR | Impact | |
| Pyrimidine Metabolism | 64.1% | 25/39 | 3.39 × 10⁻⁴ | 0.821 | 64.1% | 25/39 | 5.95 × 10⁻³ | 0.746 | 64.1% | 25/39 | 2.43 × 10⁻⁹ | 0.432 |
| Arginine Biosynthesis | 78.6% | 11/14 | 4.69 × 10⁻⁴ | 0.802 | 85.7% | 12/14 | 5.91 × 10⁻³ | 0.688 | 92.9% | 13/14 | 3.73 × 10⁻⁶ | 0.750 |
| Pentose Phosphate Pathway | 59.1% | 13/22 | 1.18 × 10⁻³ | 0.758 | 63.6% | 14/22 | 9.65 × 10⁻⁵ | 0.793 | 63.6% | 14/22 | 5.02 × 10⁻² | 0.659 |
| Alanine, Aspartate, and Glutamate Metabolism | 57.1% | 16/28 | 6.00 × 10⁻⁵ | 0.731 | 64.3% | 18/28 | 8.16 × 10⁻⁶ | 0.750 | 64.3% | 18/28 | 2.43 × 10⁻⁹ | 0.475 |
| Glycolysis/Gluconeogenesis | 50% | 13/26 | 9.43 × 10⁻² | 0.643 | 53.9% | 14/26 | 8.16 × 10⁻⁶ | 0.543 | 53.9% | 14/26 | 6.18 × 10⁻³ | 0.780 |
| Synthesis and Degradation of Ketone Bodies | 40% | 2/5 | 6.16 × 10⁻² | 0.600 | 100% | 5/5 | 3.72 × 10⁻⁵ | 1.000 | 60% | 3/5 | 5.79 × 10⁻³ | 0.875 |
| Glyoxylate and Dicarboxylate Metabolism | 34.4% | 11/32 | 9.43 × 10⁻² | 0.556 | 43.8% | 14/32 | 9.40 × 10⁻⁶ | 0.385 | 34.4% | 11/32 | 1.67 × 10⁻⁴ | 0.793 |
| Citrate Cycle (TCA cycle) | 50% | 10/20 | 5.80 × 10⁻² | 0.513 | 65% | 13/20 | 7.97 × 10⁻⁶ | 0.621 | 60% | 12/20 | 6.00 × 10⁻⁶ | 0.308 |
| Purine Metabolism | 43.9% | 29/66 | 6.00 × 10⁻⁵ | 0.483 | 51.5% | 34/66 | 1.53 × 10⁻³ | 0.682 | 50% | 33/66 | 6.00 × 10⁻⁶ | 0.667 |
| Arginine and Proline Metabolism | 36.8% | 14/38 | 1.07 × 10⁻⁴ | 0.469 | 39.5% | 15/38 | 8.16 × 10⁻⁶ | 0.450 | 36.8% | 14/38 | 3.94 × 10⁻³ | 0.552 |
| Nicotinate and Nicotinamide Metabolism | 53.3% | 8/15 | 1.65 × 10⁻³ | 0.461 | 53.33% | 8/15 | 1.13 × 10⁻¹ | 0.571 | 60% | 9/15 | 5.65 × 10⁻⁴ | 0.714 |
| Amino Sugar and Nucleotide Sugar Metabolism | 24.3% | 9/37 | 9.81 × 10⁻² | 0.434 | 24.3% | 9/37 | 5.33 × 10⁻⁴ | 0.261 | 24.3% | 9/37 | 6.36 × 10⁻² | 0.543 |
| Glutathione Metabolism | 32.1% | 9/28 | 2.89 × 10⁻⁵ | 0.346 | 35.7% | 10/28 | 7.08 × 10⁻⁶ | 0.432 | 35.7% | 10/28 | 1.74 × 10⁻² | 0.261 |
| Pyruvate Metabolism | 31.8% | 7/22 | 1.65 × 10⁻¹ | 0.251 | 45.5% | 10/22 | 8.16 × 10⁻⁶ | 0.481 | 31.8% | 7/22 | 2.10 × 10⁻⁴ | 0.370 |
| Sample Name | Fold Change | Univariate FDR | VIP Score (Comp 1) | Mean Decrease Accuracy (MDA) | SAM FDR |
|---|---|---|---|---|---|
| CDP | 0.687 | 2.78 × 10⁻² | 1.287 | 6.67 × 10⁻⁴ | 3.21 × 10⁻² |
| Carbamoyl Phosphate | 1.251 | 2.61 × 10⁻² | 1.008 | 1.80 × 10⁻³ | 5.04 × 10⁻² |
| Asparagine | 1.264 | 1.13 × 10⁻² | 1.065 | 3.40 × 10⁻³ | 3.74 × 10⁻² |
| D-Glucosamine-1-Phosphate | 0.443 | 2.61 × 10⁻² | 1.909 | 2.33 × 10⁻³ | 1.37 × 10⁻² |
| S-Adenosyl-L-Methioninamine | 0.329 | 6.07 × 10⁻³ | 2.379 | 2.27 × 10⁻³ | 4.84 × 10⁻³ |
| 2-Dehydro-D-Gluconate | 0.686 | 2.86 × 10⁻³ | 1.396 | 9.93 × 10⁻³ | 2.35 × 10⁻² |
| Indole | 1.363 | 2.86 × 10⁻³ | 1.267 | 3.00 × 10⁻³ | 2.82 × 10⁻² |
| Citrulline | 1.270 | 1.84 × 10⁻³ | 1.135 | 5.53 × 10⁻³ | 3.14 × 10⁻² |
| GTP | 1.337 | 1.60 × 10⁻² | 1.156 | 1.00 × 10⁻³ | 3.55 × 10⁻² |
| Arginosuccinic Acid | 1.584 | 2.57 × 10⁻³ | 1.561 | 5.93 × 10⁻³ | 1.42 × 10⁻² |
| GMP | 1.419 | 1.59 × 10⁻² | 1.303 | 1.80 × 10⁻³ | 2.99 × 10⁻² |
| 2-Aminooctanoic Acid | 0.670 | 1.84 × 10⁻³ | 1.463 | 3.60 × 10⁻³ | 1.85 × 10⁻² |
| Arginine | 1.254 | 2.28 × 10⁻³ | 1.101 | 3.40 × 10⁻³ | 3.32 × 10⁻² |
| Purine | 1.265 | 4.14 × 10⁻³ | 1.099 | 5.00 × 10⁻³ | 3.41 × 10⁻² |
| NADPH | 0.185 | 1.59 × 10⁻² | 2.729 | 2.63 × 10⁻³ | 4.84 × 10⁻³ |
| O8P-O1P | 1.378 | 5.76 × 10⁻³ | 1.276 | 6.53 × 10⁻³ | 2.91 × 10⁻² |
| L-Arginino-Succinate | 1.496 | 8.71 × 10⁻⁴ | 1.508 | 8.44 × 10⁻³ | 1.37 × 10⁻² |
| Alanine | 0.548 | 8.71 × 10⁻⁴ | 1.839 | 1.48 × 10⁻² | 4.84 × 10⁻³ |
| 5-Phosphoribosyl-1-Pyrophosphate | 1.598 | 2.59 × 10⁻² | 1.458 | 6.67 × 10⁻⁴ | 2.80 × 10⁻² |
| S-Ribosyl-L-Homocysteine | 0.391 | 1.62 × 10⁻² | 2.049 | 3.13 × 10⁻³ | 9.16 × 10⁻³ |
| Acetylcarnitine DL | 0.535 | 1.29 × 10⁻³ | 1.827 | 3.27 × 10⁻³ | 4.84 × 10⁻³ |
| 2-Hydroxy-2-Methylbutanedioic Acid | 1.402 | 1.59 × 10⁻² | 1.282 | 2.33 × 10⁻³ | 2.99 × 10⁻² |
| Glutathione Disulfide | 1.314 | 1.98 × 10⁻² | 1.097 | 8.93 × 10⁻³ | 3.74 × 10⁻² |
| Phenylalanine | 1.283 | 8.91 × 10⁻⁴ | 1.172 | 1.23 × 10⁻² | 2.92 × 10⁻² |
| dTMP | 1.118 | 2.03 × 10⁻² | 1.441 | 5.60 × 10⁻³ | 2.80 × 10⁻² |
| NADH | 1.246 | 1.25 × 10⁻² | 1.434 | 6.67 × 10⁻⁴ | 2.60 × 10⁻² |
| Nicotinamide Ribotide | 2.050 | 2.86 × 10⁻³ | 1.920 | 2.33 × 10⁻³ | 4.84 × 10⁻³ |
| Uridine | 1.401 | 2.78 × 10⁻² | 1.229 | 1.40 × 10⁻³ | 3.41 × 10⁻² |
| Indoleacrylic Acid | 1.317 | 1.15 × 10⁻² | 1.168 | 4.80 × 10⁻³ | 3.41 × 10⁻² |
| Tryptophan | 1.374 | 1.84 × 10⁻³ | 1.303 | 6.73 × 10⁻³ | 2.60 × 10⁻² |
| 3-Phosphoglycerate | 0.689 | 1.28 × 10⁻² | 1.336 | 5.13 × 10⁻³ | 2.91 × 10⁻² |
| N-Acetyl-Glucosamine | 0.663 | 2.43 × 10⁻² | 1.343 | 1.30 × 10⁻³ | 2.99 × 10⁻² |
| Sarcosine | 0.582 | 2.23 × 10⁻⁴ | 1.763 | 5.80 × 10⁻³ | 4.84 × 10⁻³ |
| Tyrosine | 1.259 | 8.89 × 10⁻³ | 1.066 | 1.17 × 10⁻² | 3.72 × 10⁻² |
| Aspartate | 0.759 | 4.67 × 10⁻⁴ | 1.250 | 5.13 × 10⁻³ | 2.60 × 10⁻² |
| D-Glucono-1,5-Lactone-6-Phosphate | 0.338 | 7.52 × 10⁻³ | 2.217 | 3.60 × 10⁻³ | 4.84 × 10⁻³ |
| Methylcysteine | 1.333 | 1.00 × 10⁻³ | 1.256 | 2.00 × 10⁻³ | 2.60 × 10⁻² |
| Glycerophosphocholine | 1.321 | 1.61 × 10⁻² | 1.138 | 4.27 × 10⁻³ | 3.55 × 10⁻² |
| Putrescine | 23.644 | 7.14 × 10⁻³ | 3.693 | 3.33 × 10⁻³ | 0.00 × 100 |
| Ornithine | 0.394 | 8.71 × 10⁻⁴ | 2.259 | 6.33 × 10⁻³ | 4.84 × 10⁻³ |
| Trehalose-6-Phosphate | 0.578 | 2.03 × 10⁻² | 1.598 | 1.07 × 10⁻³ | 2.35 × 10⁻² |
| Carnitine | 0.748 | 4.14 × 10⁻³ | 1.231 | 5.27 × 10⁻³ | 2.93 × 10⁻² |
| Pantothenate | 1.474 | 1.62 × 10⁻² | 1.327 | 3.93 × 10⁻³ | 2.93 × 10⁻² |
| Serine | 1.260 | 2.57 × 10⁻³ | 1.115 | 4.40 × 10⁻³ | 3.29 × 10⁻² |
| Guanosine | 1.721 | 3.04 × 10⁻² | 1.530 | 8.00 × 10⁻⁴ | 2.60 × 10⁻² |
| Inosine | 2.150 | 9.67 × 10⁻⁴ | 2.047 | 9.93 × 10⁻³ | 4.84 × 10⁻³ |
| Orotidine-5-Phosphate | 1.499 | 2.79 × 10⁻² | 1.355 | 2.33 × 10⁻³ | 2.99 × 10⁻² |
| Thiamine-Phosphate | 2.167 | 5.76 × 10⁻³ | 1.927 | 5.80 × 10⁻³ | 7.20 × 10⁻³ |
| Sample Name | Fold Change | Univariate FDR | VIP Score (Comp 1) | Mean Decrease Accuracy (MDA) | SAM FDR |
|---|---|---|---|---|---|
| Betaine | 0.664 | 2.15 × 10⁻³ | 1.413 | 8.60 × 10⁻³ | 7.70 × 10⁻³ |
| 4-Pyridoxic Acid | 0.725 | 3.76 × 10⁻² | 1.130 | 1.33 × 10⁻³ | 3.30 × 10⁻² |
| Phosphocreatine | 1.317 | 9.06 × 10⁻⁴ | 1.174 | 5.27 × 10⁻³ | 1.41 × 10⁻² |
| Aminoimidazole Carboxamide Ribonucleotide | 0.630 | 2.83 × 10⁻² | 1.403 | 1.67 × 10⁻³ | 1.41 × 10⁻² |
| Glutathione | 3.743 | 4.42 × 10⁻⁴ | 2.583 | 6.27 × 10⁻³ | 0.00 × 10−0 |
| Acetoacetate | 0.596 | 1.01 × 10⁻⁴ | 1.662 | 7.20 × 10⁻³ | 4.23 × 10⁻³ |
| 2-Oxobutanoate | 0.593 | 1.01 × 10⁻⁴ | 1.662 | 3.33 × 10⁻³ | 4.23 × 10⁻³ |
| GTP | 1.920 | 2.67 × 10⁻² | 1.653 | 4.27 × 10⁻³ | 7.70 × 10⁻³ |
| N-Carbamoyl-L-Aspartate | 0.822 | 1.50 × 10⁻³ | 1.604 | 6.80 × 10⁻³ | 5.06 × 10⁻³ |
| D-Gluconate | 0.725 | 5.43 × 10⁻³ | 1.239 | 2.27 × 10⁻³ | 1.52 × 10⁻² |
| Homoserine | 0.598 | 4.21 × 10⁻³ | 1.581 | 5.47 × 10⁻³ | 5.68 × 10⁻³ |
| Acetyl-CoA | 0.044 | 1.07 × 10⁻⁴ | 4.158 | 3.93 × 10⁻³ | 0.00 × 10−0 |
| N-Acetyl-L-Aspartic Acid | 2.249 | 9.87 × 10⁻⁶ | 2.106 | 4.67 × 10⁻³ | 0.00 × 10−0 |
| Adenylosuccinate | 0.534 | 6.10 × 10⁻³ | 1.746 | 5.77 × 10⁻³ | 5.06 × 10⁻³ |
| GDP | 2.054 | 3.16 × 10⁻² | 1.693 | 4.33 × 10⁻³ | 7.70 × 10⁻³ |
| 5-Phosphoribosyl-1-Pyrophosphate | 1.758 | 9.06 × 10⁻⁴ | 1.691 | 2.27 × 10⁻³ | 4.49× 10⁻³ |
| Cytidine | 0.160 | 2.42 × 10⁻⁴ | 3.065 | 7.13 × 10⁻³ | 0.00 × 10−0 |
| S-Ribosyl-L-Homocysteine | 1.416 | 1.58 × 10⁻² | 1.261 | 6.67 × 10⁻³ | 1.60 × 10⁻² |
| Acetylcarnitine DL | 0.666 | 1.50 × 10⁻³ | 1.428 | 2.33 × 10⁻³ | 7.36 × 10⁻³ |
| N-Acetyl-Glutamine | 1.608 | 1.48 × 10⁻² | 1.462 | 1.73 × 10⁻³ | 1.13 × 10⁻² |
| Deoxyguanosine | 0.563 | 3.64 × 10⁻³ | 1.658 | 2.47 × 10⁻³ | 5.06 × 10⁻³ |
| Betaine Aldehyde | 0.702 | 4.21 × 10⁻³ | 1.312 | 4.80 × 10⁻³ | 1.21 × 10⁻² |
| 1,3-Diphopshateglycerate | 1.843 | 2.56 × 10⁻² | 1.615 | 4.13 × 10⁻³ | 8.98 × 10⁻³ |
| Homocysteine | 1.377 | 1.74 × 10⁻³ | 1.268 | 5.73 × 10⁻³ | 1.21 × 10⁻² |
| dAMP | 1.373 | 2.66 × 10⁻³ | 1.238 | 5.40 × 10⁻³ | 1.41 × 10⁻² |
| D-Glucono-1,5-Lactone-6-Phosphate | 0.700 | 1.18 × 10⁻² | 1.270 | 1.80 × 10⁻³ | 1.55 × 10⁻² |
| Homocysteic Acid | 0.617 | 2.17 × 10⁻² | 1.418 | 1.47 × 10⁻³ | 1.32 × 10⁻² |
| Cystine | 0.215 | 1.65 × 10⁻² | 2.371 | 4.80 × 10⁻³ | 3.85 × 10⁻³ |
| 4-Aminobutyrate | 0.741 | 1.86 × 10⁻³ | 1.218 | 7.87 × 10⁻³ | 1.41 × 10⁻² |
| Putrescine | 0.528 | 2.26 × 10⁻³ | 1.760 | 7.60 × 10⁻³ | 4.49 × 10⁻³ |
| Ornithine | 1.405 | 1.04 × 10⁻⁵ | 1.360 | 7.77 × 10⁻³ | 5.06 × 10⁻³ |
| Coenzyme A | 4.070 | 1.65 × 10⁻² | 2.276 | 4.13 × 10⁻³ | 4.23 × 10⁻³ |
| 2,3-Diphosphoglyceric Acid | 1.926 | 1.21 × 10⁻² | 1.698 | 4.80 × 10⁻³ | 5.58 × 10⁻³ |
| Hypoxanthine | 0.251 | 4.76 × 10⁻⁷ | 2.770 | 7.53 × 10⁻³ | 0.00 × 10−0 |
| Citrate | 1.399 | 1.56 × 10⁻⁴ | 1.329 | 9.27 × 10⁻³ | 7.36 × 10⁻³ |
| Allantoate | 0.625 | 2.42 × 10⁻⁴ | 1.567 | 1.00 × 10⁻³ | 4.74 × 10⁻³ |
| 1-Methyladenosine | 0.615 | 1.69 × 10⁻³ | 1.543 | 2.33 × 10⁻³ | 5.06 × 10⁻³ |
| Sample Name | Fold Change | Univariate FDR | VIP Score (Comp 1) | Mean Decrease Accuracy (MDA) | SAM FDR |
|---|---|---|---|---|---|
| Citrate-Isocitrate | 0.654 | 2.70 × 10⁻⁵ | 1.160 | 3.97 × 10⁻³ | 7.57 × 10⁻³ |
| CDP | 1.771 | 1.23 × 10⁻³ | 1.304 | 5.13 × 10⁻³ | 7.32 × 10⁻³ |
| Carbamoyl Phosphate | 2.619 | 5.46 × 10⁻⁵ | 1.742 | 7.00 × 10⁻³ | 1.11 × 10⁻³ |
| Fumarate | 2.787 | 2.11 × 10⁻⁸ | 1.846 | 2.51 × 10⁻³ | 2.55 × 10⁻⁴ |
| Aminoimidazole Carboxamide Ribonucleotide | 0.526 | 4.79 × 10⁻³ | 1.358 | 1.06 × 10⁻² | 7.41 × 10⁻³ |
| Choline | 0.534 | 1.20 × 10⁻² | 1.277 | 2.00 × 10⁻³ | 8.62 × 10⁻³ |
| Orotate | 15.739 | 5.83 × 10⁻³ | 2.569 | 8.00 × 10⁻⁴ | 7.27 × 10⁻⁴ |
| Thiamine Pyrophosphate | 1.781 | 2.86 × 10⁻³ | 1.267 | 3.43 × 10⁻³ | 7.57 × 10⁻³ |
| Acetoacetate | 0.587 | 2.28 × 10⁻² | 1.150 | 2.27 × 10⁻³ | 1.55 × 10⁻² |
| Phosphorylcholine | 0.373 | 1.28 × 10⁻⁹ | 1.814 | 1.15 × 10⁻² | 2.55 × 10⁻⁴ |
| Isocitrate | 0.477 | 4.99 × 10⁻³ | 1.416 | 2.13 × 10⁻³ | 7.32 × 10⁻³ |
| Deoxyadenosine | 0.288 | 1.86 × 10⁻² | 1.907 | 9.00 × 10⁻⁴ | 5.73 × 10⁻³ |
| 1-Methyladenosine | 1.883 | 3.60 × 10⁻³ | 1.360 | 6.67 × 10⁻³ | 7.32 × 10⁻³ |
| 2-Aminooctanoic Acid | 1.812 | 4.99 × 10⁻³ | 1.267 | 5.74 × 10⁻³ | 7.64 × 10⁻³ |
| D-Gluconate | 1.999 | 3.90 × 10⁻⁶ | 1.507 | 5.73 × 10⁻³ | 3.40 × 10⁻³ |
| 2-Keto-Isovalerate | 2.868 | 1.39 × 10⁻⁸ | 1.873 | 5.74 × 10⁻³ | 2.55 × 10⁻⁴ |
| Acetyl-CoA | 4.344 | 1.67 × 10⁻² | 2.061 | 8.00 × 10⁻⁴ | 4.20 × 10⁻³ |
| N-Carbamoyl-L-Aspartate | 51.968 | 2.86 × 10⁻¹⁰ | 3.627 | 7.40 × 10⁻³ | 0.00 × 10−0 |
| Cellobiose | 0.134 | 4.99 × 10⁻³ | 2.296 | 5.47 × 10⁻³ | 1.02 × 10⁻³ |
| O8P-O1P | 1.511 | 7.57 × 10⁻⁴ | 1.119 | 8.53 × 10⁻³ | 9.11 × 10⁻³ |
| Thiamine-Phosphate | 1.822 | 4.87 × 10⁻² | 1.147 | 5.00 × 10⁻⁴ | 1.88 × 10⁻² |
| Creatine | 1.814 | 3.86 × 10⁻⁶ | 1.394 | 4.33 × 10⁻³ | 5.44 × 10⁻³ |
| CDP-Ethanolamine | 7.035 | 1.45 × 10⁻⁴ | 2.473 | 5.00 × 10⁻³ | 0.00 × 10−0 |
| Acetylcarnitine DL | 1.841 | 3.38 × 10⁻³ | 1.295 | 4.13 × 10⁻³ | 7.57 × 10⁻³ |
| Aconitate | 0.542 | 2.70 × 10⁻⁵ | 1.399 | 9.03 × 10⁻³ | 5.73 × 10⁻³ |
| Shikimate | 0.367 | 1.81 × 10⁻⁴ | 1.781 | 5.27 × 10⁻³ | 1.20 × 10⁻³ |
| Anthranilate | 1.485 | 2.12 × 10⁻² | 1.014 | 2.33 × 10⁻³ | 2.12 × 10⁻² |
| Uridine | 3.660 | 9.62 × 10⁻⁵ | 2.051 | 1.14 × 10⁻³ | 7.27 × 10⁻⁴ |
| 2-Isopropylmalic Acid | 81.792 | 1.87 × 10⁻¹¹ | 3.844 | 9.53 × 10⁻³ | 0.00 × 10−0 |
| CMP | 3.127 | 3.90 × 10⁻⁶ | 1.910 | 4.07 × 10⁻³ | 4.24 × 10⁻⁴ |
| CDP-Choline | 8.569 | 5.71 × 10⁻⁴ | 2.438 | 3.60 × 10⁻³ | 2.55 × 10⁻⁴ |
| Deoxyguanosine | 0.507 | 2.09 × 10⁻³ | 1.402 | 2.60 × 10⁻³ | 7.32 × 10⁻³ |
| Citraconic Acid | 0.639 | 1.81 × 10⁻⁴ | 1.173 | 4.73 × 10⁻³ | 7.57 × 10⁻³ |
| N-acetyl-glucosamine | 1.556 | 8.59 × 10⁻³ | 1.109 | 5.47 × 10⁻³ | 1.40 × 10⁻² |
| Glycerophosphocholine | 1.606 | 3.48 × 10⁻⁵ | 1.225 | 4.00 × 10⁻³ | 7.32 × 10⁻³ |
| 2-Oxo-4-Methylthiobutanoate | 0.462 | 4.38 × 10⁻² | 1.405 | 1.40 × 10⁻³ | 9.41 × 10⁻³ |
| Histidinol | 1.546 | 2.44 × 10⁻² | 1.021 | 3.20 × 10⁻³ | 2.12 × 10⁻² |
| 4-Aminobutyrate | 1.948 | 4.26 × 10⁻⁴ | 1.417 | 4.60 × 10⁻³ | 6.11 × 10⁻³ |
| Dihydroorotate | 7.471 | 3.97 × 10⁻⁷ | 2.569 | 7.60 × 10⁻³ | 0.00 × 10−0 |
| UDP | 1.854 | 4.22 × 10⁻³ | 1.315 | 6.60 × 10⁻³ | 7.57 × 10⁻³ |
| Itaconic Acid | 0.688 | 8.04 × 10⁻⁴ | 1.050 | 6.07 × 10⁻³ | 1.23 × 10⁻² |
| Maleic Acid | 2.836 | 1.41 × 10⁻⁷ | 1.860 | 4.80 × 10⁻³ | 4.24 × 10⁻⁴ |
| dCDP | 1.194 | 5.78 × 10⁻³ | 1.310 | 4.67 × 10⁻³ | 7.64 × 10⁻³ |
| N-Acetyl-Glucosamine-1-Phosphate | 2.279 | 4.99 × 10⁻³ | 1.567 | 8.00 × 10⁻⁴ | 6.46 × 10⁻³ |
| Aspartate | 3.759 | 4.98 × 10⁻⁸ | 2.087 | 1.08 × 10⁻² | 0.00 × 10−0 |
| Allantoate | 158.360 | 3.66 × 10⁻¹² | 4.120 | 8.40 × 10⁻³ | 0.00 × 10−0 |
| Guanosine | 2.804 | 2.39 × 10⁻³ | 1.768 | 5.00 × 10⁻³ | 3.89 × 10⁻³ |
| Pathway Name | Percent Affected | Differentiated Metabolites | FDR | Impact |
|---|---|---|---|---|
| Tet-On Mfn2 (Direct Fusion) | ||||
| Beta-Alanine Metabolism | 9.5% | 2/21 | 6.74 × 10⁻⁷ | 0.048 |
| Aminoacyl-tRNA Biosynthesis | 16.7% | 8/48 | 6.74 × 10⁻⁷ | 0.310 |
| Alanine, Aspartate, and Glutamate Metabolism * | 28.6% | 8/28 | 7.36 × 10⁻⁶ | 0.313 |
| Arginine Biosynthesis * | 42.9% | 6/14 | 7.36 × 10⁻⁶ | 0.563 |
| Glutathione Metabolism * | 14.3% | 4/28 | 7.36 × 10⁻⁶ | 0.162 |
| Pantothenate and CoA Biosynthesis | 15.8% | 3/19 | 7.85 × 10⁻⁶ | 0.111 |
| Glycine, Serine, and Threonine Metabolism | 17.7% | 6/34 | 2.00 × 10⁻⁵ | 0.262 |
| Nicotinate and Nicotinamide Metabolism | 13.3% | 2/15 | 2.83 × 10⁻⁵ | 0.190 |
| Pyrimidine Metabolism * | 23.1% | 9/39 | 4.87 × 10⁻⁵ | 0.220 |
| Arginine and Proline Metabolism | 13.2% | 5/38 | 4.88 × 10⁻⁵ | 0.300 |
| Cysteine and Methionine Metabolism * | 15.2% | 5/33 | 5.28 × 10⁻⁵ | 0.152 |
| Amino Sugar and Nucleotide Sugar Metabolism | 5.4% | 2/37 | 1.85 × 10⁻⁴ | 0.087 |
| Pentose Phosphate Pathway * | 13.6% | 3/22 | 2.16 × 10⁻⁴ | 0.103 |
| Glycolysis/Gluconeogenesis * | 3.9% | 1/26 | 2.64 × 10⁻⁴ | 0.029 |
| Purine Metabolism * | 10.6% | 7/66 | 4.70 × 10⁻⁴ | 0.136 |
| sgDrp1 (Indirect Fusion) | ||||
| Arginine Biosynthesis * | 14.3% | 2/14 | 2.05 × 10⁻⁷ | 0.1875 |
| Alanine, Aspartate, and Glutamate Metabolism * | 21.4% | 6/28 | 2.32 × 10⁻⁷ | 0.28125 |
| Fatty Acid Degradation | 5.1% | 2/39 | 2.32 × 10⁻⁷ | 0.16327 |
| Arginine and Proline Metabolism | 15.8% | 6/38 | 2.66 × 10⁻⁷ | 0.25 |
| Glutathione Metabolism * | 17.9% | 5/28 | 4.20 × 10⁻⁷ | 0.27028 |
| Glycolysis/Gluconeogenesis * | 11.5% | 3/26 | 1.56 × 10⁻⁶ | 0.11428 |
| Pyrimidine Metabolism * | 7.7% | 3/39 | 1.82 × 10⁻⁶ | 0.0339 |
| Nitrogen Metabolism | 16.7% | 1/6 | 2.85 × 10⁻⁶ | 0.25 |
| Pentose Phosphate Pathway * | 18.2% | 4/22 | 3.06 × 10⁻⁶ | 0.10344 |
| Glyoxylate and Dicarboxylate Metabolism | 9.4% | 3/32 | 3.06 × 10⁻⁶ | 0.11538 |
| Purine Metabolism * | 15.2% | 10/66 | 3.92 × 10⁻⁶ | 0.2159 |
| Butanoate Metabolism | 26.7% | 4/15 | 7.42 × 10⁻⁶ | 0.33334 |
| Citrate Cycle (TCA cycle) | 10% | 2/20 | 7.42 × 10⁻⁶ | 0.10345 |
| Propanoate Metabolism | 8.7% | 2/23 | 7.69 × 10⁻⁶ | 0.11538 |
| Cysteine and Methionine Metabolism * | 12.1% | 4/33 | 3.69 × 10⁻⁵ | 0.15151 |
| Leflunomide (Pharmacologic) | ||||
| Alanine, Aspartate, and Glutamate Metabolism * | 25% | 7/28 | 3.28 × 10⁻⁹ | 0.313 |
| Pantothenate and CoA Biosynthesis | 10.5% | 2/19 | 2.69 × 10⁻⁸ | 0.056 |
| Pyrimidine Metabolism * | 25.6% | 10/39 | 2.69 × 10⁻⁸ | 0.288 |
| Purine Metabolism * | 9.1% | 6/66 | 2.25 × 10⁻⁷ | 0.102 |
| Citrate Cycle (TCA cycle) | 30% | 6/20 | 5.03 × 10⁻⁷ | 0.276 |
| Valine, Leucine, and Isoleucine Biosynthesis | 12.5% | 1/8 | 5.03 × 10⁻⁷ | 0.250 |
| Aminoacyl-tRNA Biosynthesis | 2.1% | 1/48 | 5.03 × 10⁻⁷ | 0.034 |
| Glyoxylate and Dicarboxylate Metabolism | 12.5% | 4/32 | 7.65 × 10⁻⁷ | 0.154 |
| Nicotinate and Nicotinamide Metabolism | 13.3% | 2/15 | 7.65 × 10⁻⁷ | 0.190 |
| Arginine Biosynthesis * | 21.4% | 3/14 | 8.20 × 10⁻⁷ | 0.125 |
| Glycine, Serine, and Threonine Metabolism | 5.9% | 2/34 | 4.87 × 10⁻⁵ | 0.024 |
| Butanoate Metabolism | 26.7% | 4/15 | 8.19 × 10⁻⁵ | 0.267 |
| Valine, Leucine, and Isoleucine Degradation | 10% | 4/40 | 3.43 × 10⁻⁴ | 0.132 |
| Cysteine and Methionine Metabolism * | 3.0% | 1/33 | 1.55 × 10⁻³ | 0.030 |
| Beta-Alanine Metabolism | 9.5% | 2/21 | 2.94 × 10⁻³ | 0.048 |
| Pentose Phosphate Pathway * | 9.1% | 2/22 | 1.10 × 10⁻² | 0.069 |
| Glutathione Metabolism * | 3.6% | 1/28 | 4.23 × 10⁻² | 0.027 |
| Glycolysis/Gluconeogenesis * | 7.7% | 2/26 | 4.37 × 10⁻² | 0.057 |
Publisher’s Note: MDPI stays neutral with regard to jurisdictional claims in published maps and institutional affiliations. |
© 2021 by the authors. Licensee MDPI, Basel, Switzerland. This article is an open access article distributed under the terms and conditions of the Creative Commons Attribution (CC BY) license (https://creativecommons.org/licenses/by/4.0/).
Share and Cite
Nguyen, N.D.; Yu, M.; Reddy, V.Y.; Acevedo-Diaz, A.C.; Mesarick, E.C.; Abi Jaoude, J.; Yuan, M.; Asara, J.M.; Taniguchi, C.M. Comparative Untargeted Metabolomic Profiling of Induced Mitochondrial Fusion in Pancreatic Cancer. Metabolites 2021, 11, 627. https://doi.org/10.3390/metabo11090627
Nguyen ND, Yu M, Reddy VY, Acevedo-Diaz AC, Mesarick EC, Abi Jaoude J, Yuan M, Asara JM, Taniguchi CM. Comparative Untargeted Metabolomic Profiling of Induced Mitochondrial Fusion in Pancreatic Cancer. Metabolites. 2021; 11(9):627. https://doi.org/10.3390/metabo11090627
Chicago/Turabian StyleNguyen, Nicholas D., Meifang Yu, Vinit Y. Reddy, Ariana C. Acevedo-Diaz, Enzo C. Mesarick, Joseph Abi Jaoude, Min Yuan, John M. Asara, and Cullen M. Taniguchi. 2021. "Comparative Untargeted Metabolomic Profiling of Induced Mitochondrial Fusion in Pancreatic Cancer" Metabolites 11, no. 9: 627. https://doi.org/10.3390/metabo11090627