Article

A Role for Inositol Pyrophosphates in the Metabolic Adaptations to Low Phosphate in Arabidopsis

1
Department of Plant and Microbial Biology, North Carolina State University, Raleigh, NC 27695, USA
2
Department of Biochemistry, Virginia Polytechnic and State University, Blacksburg, VA 24061, USA
*
Author to whom correspondence should be addressed.
Metabolites 2021, 11(9), 601; https://doi.org/10.3390/metabo11090601
Submission received: 8 July 2021 / Revised: 1 September 2021 / Accepted: 2 September 2021 / Published: 4 September 2021
(This article belongs to the Special Issue Regulation of Plant Lipid Metabolism)

Abstract

:
Phosphate is a major plant macronutrient and low phosphate availability severely limits global crop productivity. In Arabidopsis, a key regulator of the transcriptional response to low phosphate, phosphate starvation response 1 (PHR1), is modulated by a class of signaling molecules called inositol pyrophosphates (PP-InsPs). Two closely related diphosphoinositol pentakisphosphate enzymes (AtVIP1 and AtVIP2) are responsible for the synthesis and turnover of InsP8, the most implicated molecule. This study is focused on characterizing Arabidopsis vip1/vip2 double mutants and their response to low phosphate. We present evidence that both local and systemic responses to phosphate limitation are dampened in the vip1/vip2 mutants as compared to wild-type plants. Specifically, we demonstrate that under Pi-limiting conditions, the vip1/vip2 mutants have shorter root hairs and lateral roots, less accumulation of anthocyanin and less accumulation of sulfolipids and galactolipids. However, phosphate starvation response (PSR) gene expression is unaffected. Interestingly, many of these phenotypes are opposite to those exhibited by other mutants with defects in the PP-InsP synthesis pathway. Our results provide insight on the nexus between inositol phosphates and pyrophosphates involved in complex regulatory mechanisms underpinning phosphate homeostasis in plants.

1. Introduction

Inorganic phosphate (Pi) is a critical macronutrient required for optimal plant growth and development. Pi uptake by plants is a major limit to crop productivity, and modern agriculture relies heavily on the use of phosphate fertilizers. However, this practice is unsustainable from both geopolitical and environmental perspectives. Currently manufacture of phosphatic fertilizers is dependent on mined rock phosphate and economically viable sources of these minerals are estimated to be depleted within the next 100 years [1]. Compounding this problem, phosphate fertilizers are poorly bioavailable and over-application causes significant ecological damage to fresh and marine waterways. To meet increasing food demand, global agricultural practices must undergo “sustainable intensification” [2]. It is therefore critical that basic research examine the dynamic mechanisms by which plants regulate phosphate uptake, use, and homeostasis.
Plants have evolved several strategies to grow in phosphate-limited soils. Broadly, these adaptive strategies may be divided into two categories: local and systemic. Local adaptations occur in the root and serve to increase Pi uptake from the soil. In tandem, systemic responses aim to maximize Pi usage efficiency and maintain Pi homeostasis within the plant. Local phosphate starvation responses (PSR) are characterized by changes in root system architecture (RSA) which are directly triggered by limiting external Pi [3]. The initiation and elongation of lateral roots redistributes new growth more broadly across the topsoil, while enhanced production of root hairs effectively increases total root surface area and the ability to penetrate into finer soil structures [4]. These adaptations prioritize topsoil nutrient foraging over deep soil water uptake [5]. Systemic or long distance adaptations are responsive to internal Pi concentrations and include reduced photosynthetic activity, metabolic bypasses of Pi-intensive pathways, increased anthocyanin accumulation, membrane lipid remodeling, and increased Pi recovery and transport. These measures are aimed to conserve and recycle phosphate [6,7]. Several mobile signals such as Pi, sugars, hormones, and miRNAs are involved in the coordination between local and long distance signaling pathways [6,8,9,10].
One characteristic long term response which occurs in both shoots and roots under Pi starvation is membrane lipid remodeling [11]. Lipid remodeling involves the concomitant induction of the phospholipid hydrolysis pathway, and the non-phosphate containing glycerolipid biosynthetic pathways [12,13,14,15]. Under low-Pi conditions, glycerolipids such as digalactosyldiacylglycerol (DGDG) and sulfoquinovosyldiacylglycerol (SQDG) replace phospholipids in the plasma membrane, and chloroplast, respectively, to maintain structure and charge across lipid membranes [11,12,16]. Lipid remodeling allows the plant to utilize the approximately ~30% of cellular organic phosphate contained in phospholipids for other essential physiological processes [11,17,18,19].
Underlying the physiological responses to Pi starvation is a massive reprogramming of transcription by which ~10% of the Arabidopsis transcriptome may be differentially expressed in response to low Pi. Much of this transcriptional regulation is controlled by the transcription factor, phosphate starvation response 1 (PHR1) [20]. Considered a master regulator, PHR1 modulates the transcription of PSR genes by targeting PHR1 binding sites (P1BS) in their promoter sequences [21]. While PHR1 is not induced by low phosphate, its DNA-binding activity is inhibited in a phosphate-dependent manner by interaction with the nuclear regulatory protein SPX1, (which is named after proteins from Saccharomyces cerevisiae, Syg1 and Pho81, and the mammalian Xpr1.) [22]. Recently the mechanism of this regulation was further elucidated with the finding that an electropositive binding pocket conserved in SPX domain structures binds, with increasing affinity, to Pi, inositol phosphates (InsPs), and inositol pyrophosphates (PP-InsPs) [23]. PP-InsPs promote the association of SPX1 with PHR1, thereby inhibiting DNA-binding activity and leading to repression of PSR genes when cellular Pi levels are restored. The high affinity interaction between SPX1 and PP-InsPs, provides a sensitive regulatory mechanism which may be rapidly modulated by relatively small changes in PP-InsP pools [24,25].
Inositol hexakisphosphate (InsP6 or phytic acid) serves as the primary phosphate and energy store in most plant seeds [26]. Synthesis of InsP6 is catalyzed by the enzyme inositol phosphate kinase-1 (IPK1). Two groups of enzymes are responsible for sequential phosphorylation of InsP6 to InP8. A multifunctional enzyme, inositol tetrakisphosphate 1-kinase 1 (ITPK1), converts InsP6 to InsP7 [27,28]. The diphosphoinositol pentakisphosphate (PPIP5K) enzymes referred to as VIP or VIH kinases [29,30] catalyze InsP8 synthesis [27,30,31]. A simple pathway of these reactions is shown in Figure S1.
As is evident from several studies, InsPs and PPx-InsPs are implicated in phosphate storage and homeostasis. Disruption of IPK1 leads to over-accumulation of phosphate in shoots and Pi toxicity [32], and activation of PSR genes under Pi-replete conditions [33,34]. Similar to ipk1, the itpk1 mutant also hyper-accumulates Pi in the shoot and shows basally elevated PSR gene expression [34]. The VIP proteins are dual domain enzymes containing an N-terminal kinase domain and C-terminal phosphatase domain with opposing catalytic activities [35,36]. Double mutants with disruptions in the kinase domains of both alleles have been reported previously [31,37]. These mutants have an elevation in InsP7 and are almost entirely devoid of InsP8. Interestingly, these mutants exhibit severe imbalances in Pi homeostasis [31,37], resulting in accumulation of Pi and constitutive PSR gene expression under Pi-replete conditions. This, along with more recent binding studies [38], has led to a model in which InsP8 regulates Pi homeostasis by repressing PSR.
In this paper we describe novel vip double mutants that have several opposite phenotypes to ipk1 and the previously reported vih mutants. We report on their basal Pi status as well as local and systemic responses to low Pi. In particular, we compare the shoot lipid remodeling response of the vip mutant and ipk1 to low Pi conditions. Analysis of 3H inositol labeling profiles reveals significant differences in InsP7 and InsP8 patterns in these vip mutants as compared to previously reported vih mutants, which highlights the complex regulation of plant phosphate homeostasis.

2. Results

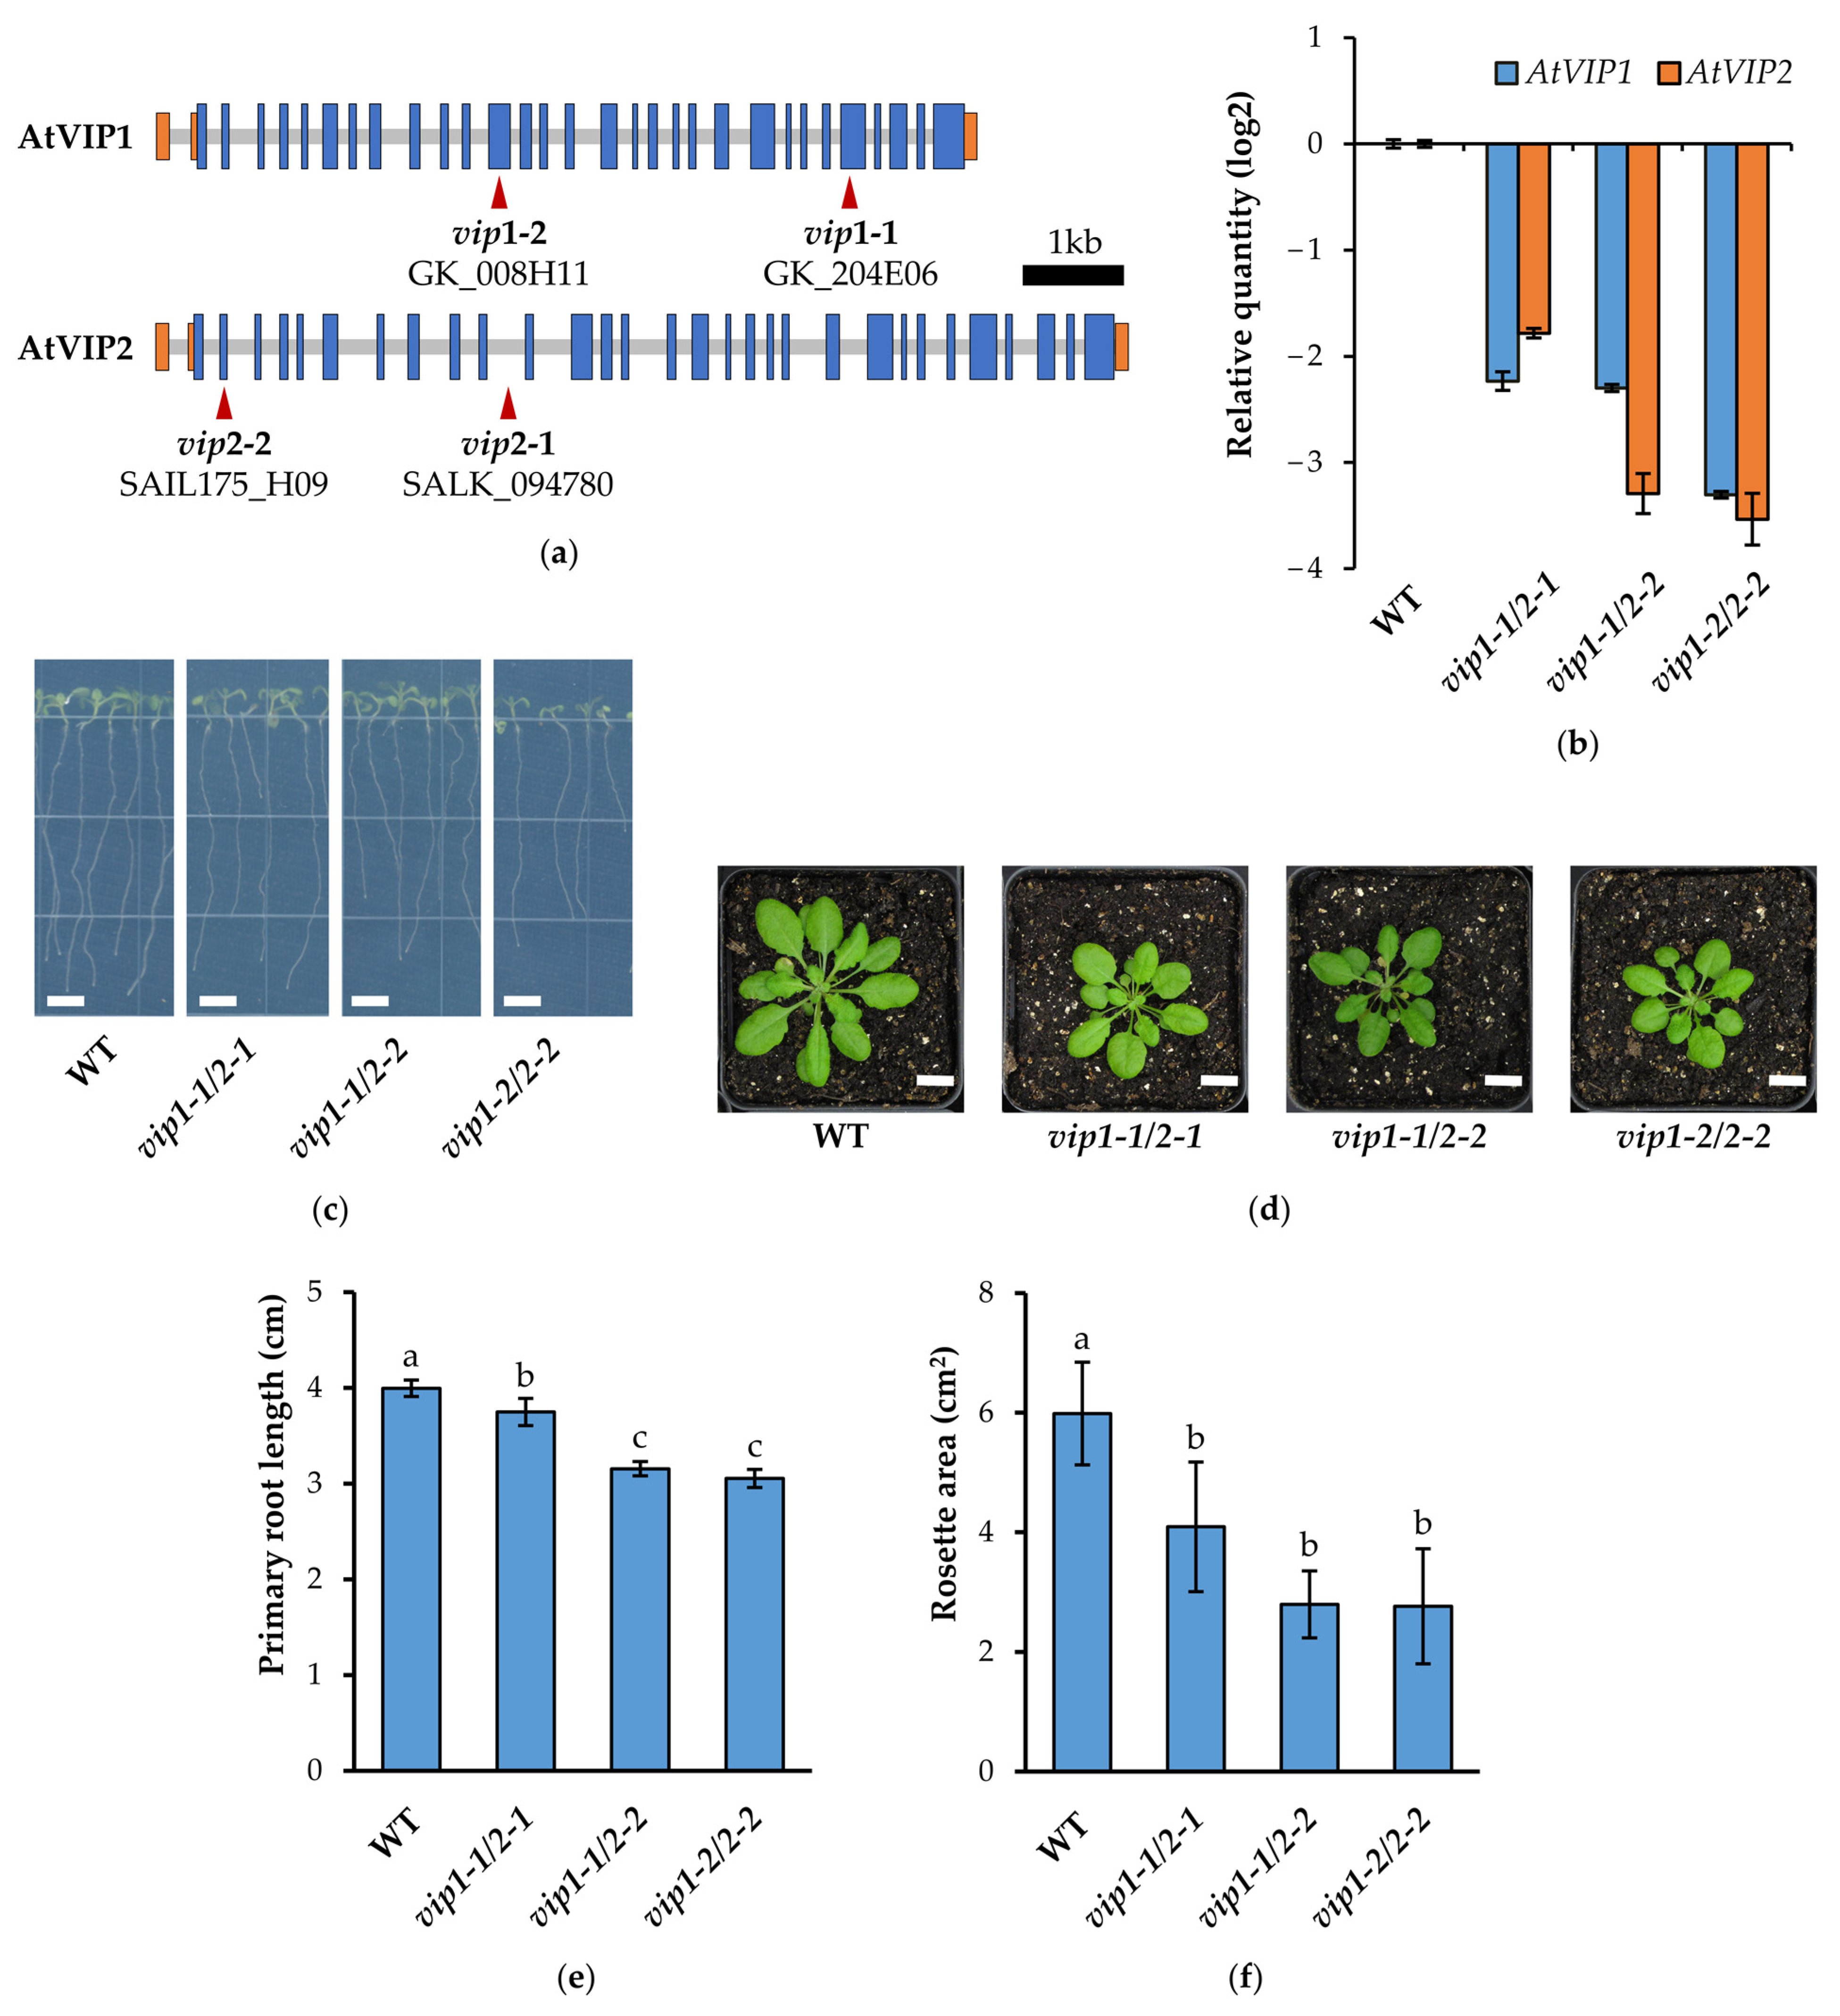
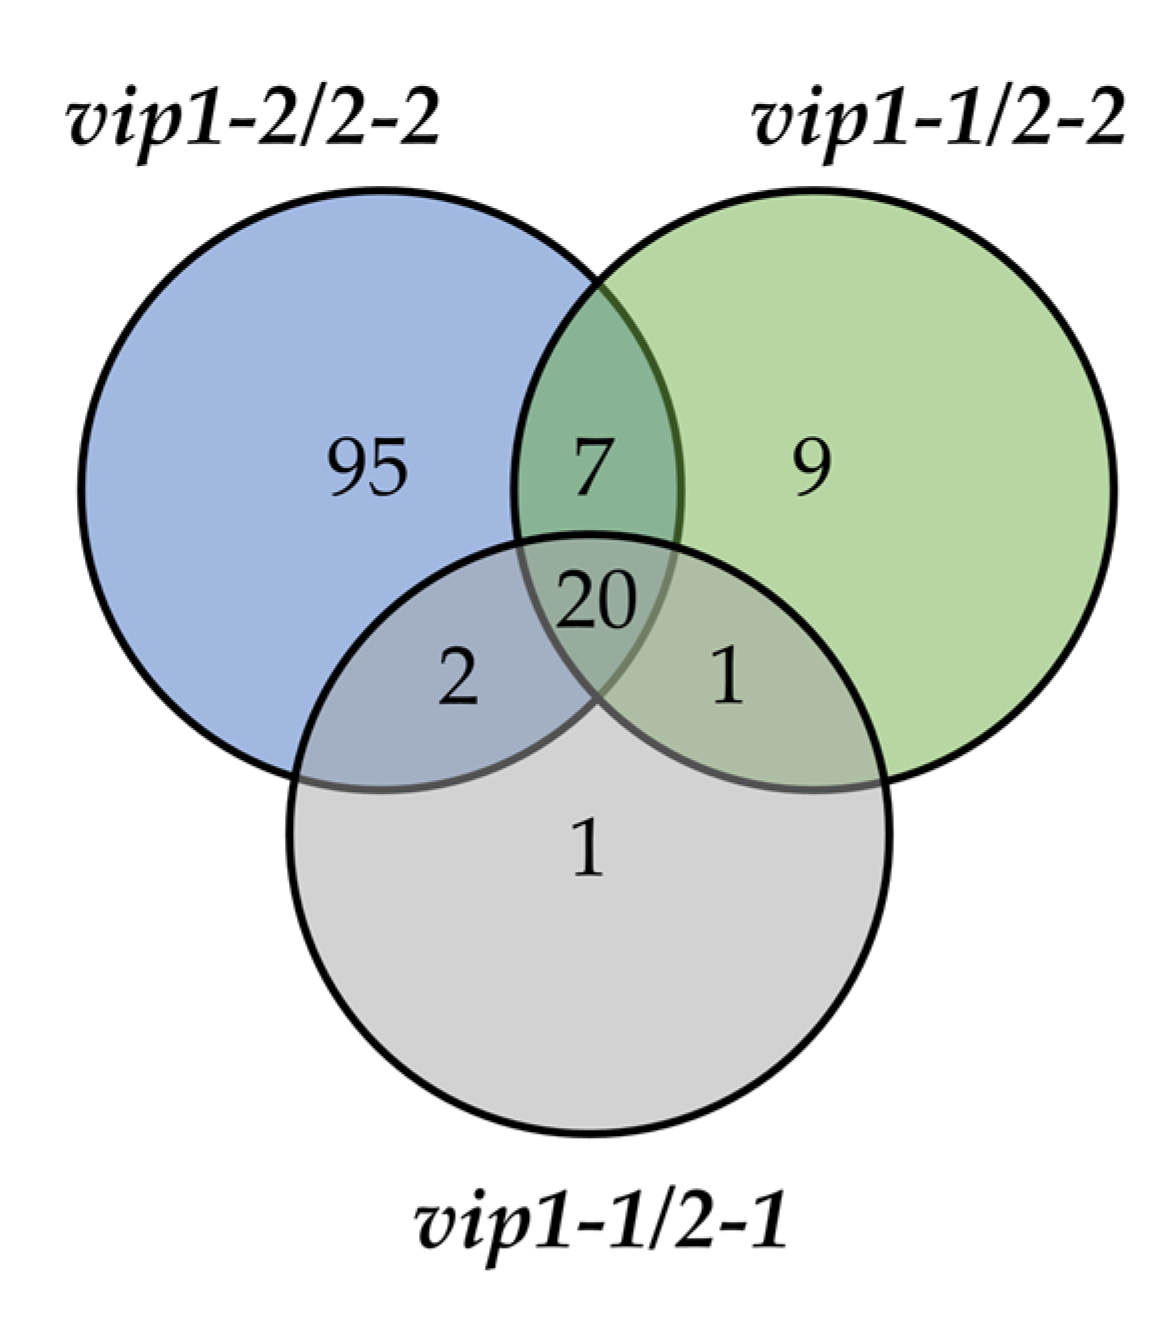
2.1. vip Double Mutants Are Characterized by a Reduced Growth Phenotype and Transcriptional Changes

The Arabidopsis VIP [29,30] isoforms AtVIP1 and AtVIP2 share similar organization at the genomic and transcript levels, and their predicted protein products are 88% identical. To determine the impact of these enzymes’ activity on plant growth and development in the context of phosphate starvation, multiple T-DNA insertional mutants were obtained from the Gabi-Kat, SALK, and SAIL T-DNA insertion collections (Figure 1a). The homozygosity of each T-DNA insertion was confirmed by genomic PCR, and three unique double mutants (vip1-1/vip2-1, vip1-1/vip2-2, vip1-2/vip2-2) were generated by crossing confirmed parental lines. Each double mutant was further propagated through three generations and homozygosity was selected for at each insertional loci. The allelic combinations of these double mutants (which we will refer to as vip mutants) and the previously published vih double mutants are listed in Supplementary Table S1. As indicated in Figure 1a, the vip1 alleles that we used to generate double mutants have insertions downstream of the kinase domain. It has been reported that vip1-2 is able to generate a truncated transcript which contains the kinase domain [31], and potentially retains kinase activity. Quantitative reverse transcription PCR (qRT-PCR) using unique gene-specific primers confirmed that the transcriptional abundance of each loci was significantly reduced in vip double mutants (Figure 1b). Specifically, the greatest decreases in AtVIP1 and AtVIP2 transcript levels were observed in the vip1-2/vip2-2 double mutant, with the vip1-1/vip2-1 and vip1-1/vip2-2 mutants showing lesser reductions. Furthermore, RT-PCR amplification of cDNA derived from these double mutants did not detect full-length AtVIP1 or AtVIP2 transcripts (Figure S2), indicating an absence of functional full length VIP1 and VIP2 proteins.
Morphometric analysis of the double vip mutants showed reduced seedling size when grown on Murashige and Skoog (MS) agar media (Figure 1c). In particular, vip1-1/vip2-2 and vip1-2/vip2-2 exhibited a ~20% decrease in primary root length compared to wild-type Col-0 (WT) (Figure 1e). Seedlings transplanted to soil also exhibited reduced rosette diameter (Figure 1d) persistent throughout the vegetative growth phase of mature plants. All three double mutants showed significantly reduced rosette area compared to WT (Figure 1f).

2.2. Systemic Phosphate Starvation Response Genes Are Downregulated in vip Double Mutants

Morphometric analyses showed small but significant reduction in growth in the vip double mutants compared to WT. To gain insight into the molecular basis of these growth perturbations, we conducted a transcriptional profiling of shoot tissue from 10-day-old WT, vip1-1/vip2-1, vip1-1/vip2-2, and vip1-2/vip2-2 seedlings using RNA sequencing.
Three biological replicates for each genotype were processed and differential gene expression was analyzed using DESeq2. Consistent with the transcriptional downregulation of AtVIP1/AtVIP2 quantified in Figure 1b, vip1-1/vip2-1, vip1-1/vip2-2, and vip1-2/vip2-2 mutants showed a gradation in numbers of DE genes identified. Relative to WT, (p-value [Padj] ≤ 0.05) 6, 20, and 168 genes were found to be significantly upregulated in vip1-1/vip2-1, vip1-1/vip2-2, and vip1-2/vip2-2 double mutants, respectively. Similarly, 24, 37, and 124 genes were found to be significantly downregulated in these mutants.
Interestingly, a conserved subset of 20 genes were identified as being downregulated in the shoot tissues of all three double mutants relative to WT (Figure 2, Table 1). Of these downregulated genes, 15 (75%) DE transcripts are PSR genes. Several of these genes show involvement in lipid metabolism (PLDZ2, MGD2, MGD3, SQD1). Other genes in this subset are also associated with phosphate deficiency responses (SPX1, PS2, IPS1, AT4, PAP17, GDPD1). Additionally, three related PSR genes (SQD2, VTC4, GDPD6) were found to be downregulated in vip1-1/vip2-2 and vip1-2/vip2-2 mutants only. A similar downregulation of PSR regulatory genes (SPX1, AT4, IPS1) was observed in the roots of vip double mutants when queried by qRT-PCR (Figure S3). To identify potential common cis-acting regulatory elements, the 1 kb region upstream of these genes was examined. Interestingly, one or more PHR1-binding sequences (P1BS, GnATATnC) were identified in 14 of the 20 downregulated PSR genes. The presence and number of P1BS sequences in the 20 common genes is indicated in Table 1. This suggests that the subset of downregulated genes in the vip double mutants are likely under the control of the PHR1 transcription factor.

2.3. Inorganic Phosphate Levels Are Altered in vip Double Mutants

To examine the consequences of altered PSR transcript abundances on the state of cellular Pi levels in the double vip mutants, young seedling and mature leaf tissues were analyzed for Pi content by a molybdate-based colorimetric assay and compared to WT and the ipk1 mutant which hyperaccumulates phosphate (Figure 3).
In both seedlings and mature leaves, Pi levels were significantly increased in the ipk1 mutant, relative to WT, consistent with previous reports [32,33,34]. Interestingly, the vip double mutant seedlings showed small reductions in phosphate content relative to WT. A gradient of this phenotype was found to be consistent with the previously observed transcriptomic gradient. The vip1-2/vip2-2 double mutant seedlings exhibited the greatest decrease in Pi levels at 18 days old relative to WT (~28%) while vip1-1/vip2-2 exhibited ~12% decrease relative to WT. In mature leaf tissues of the vip mutants, Pi levels were similar to those of WT.

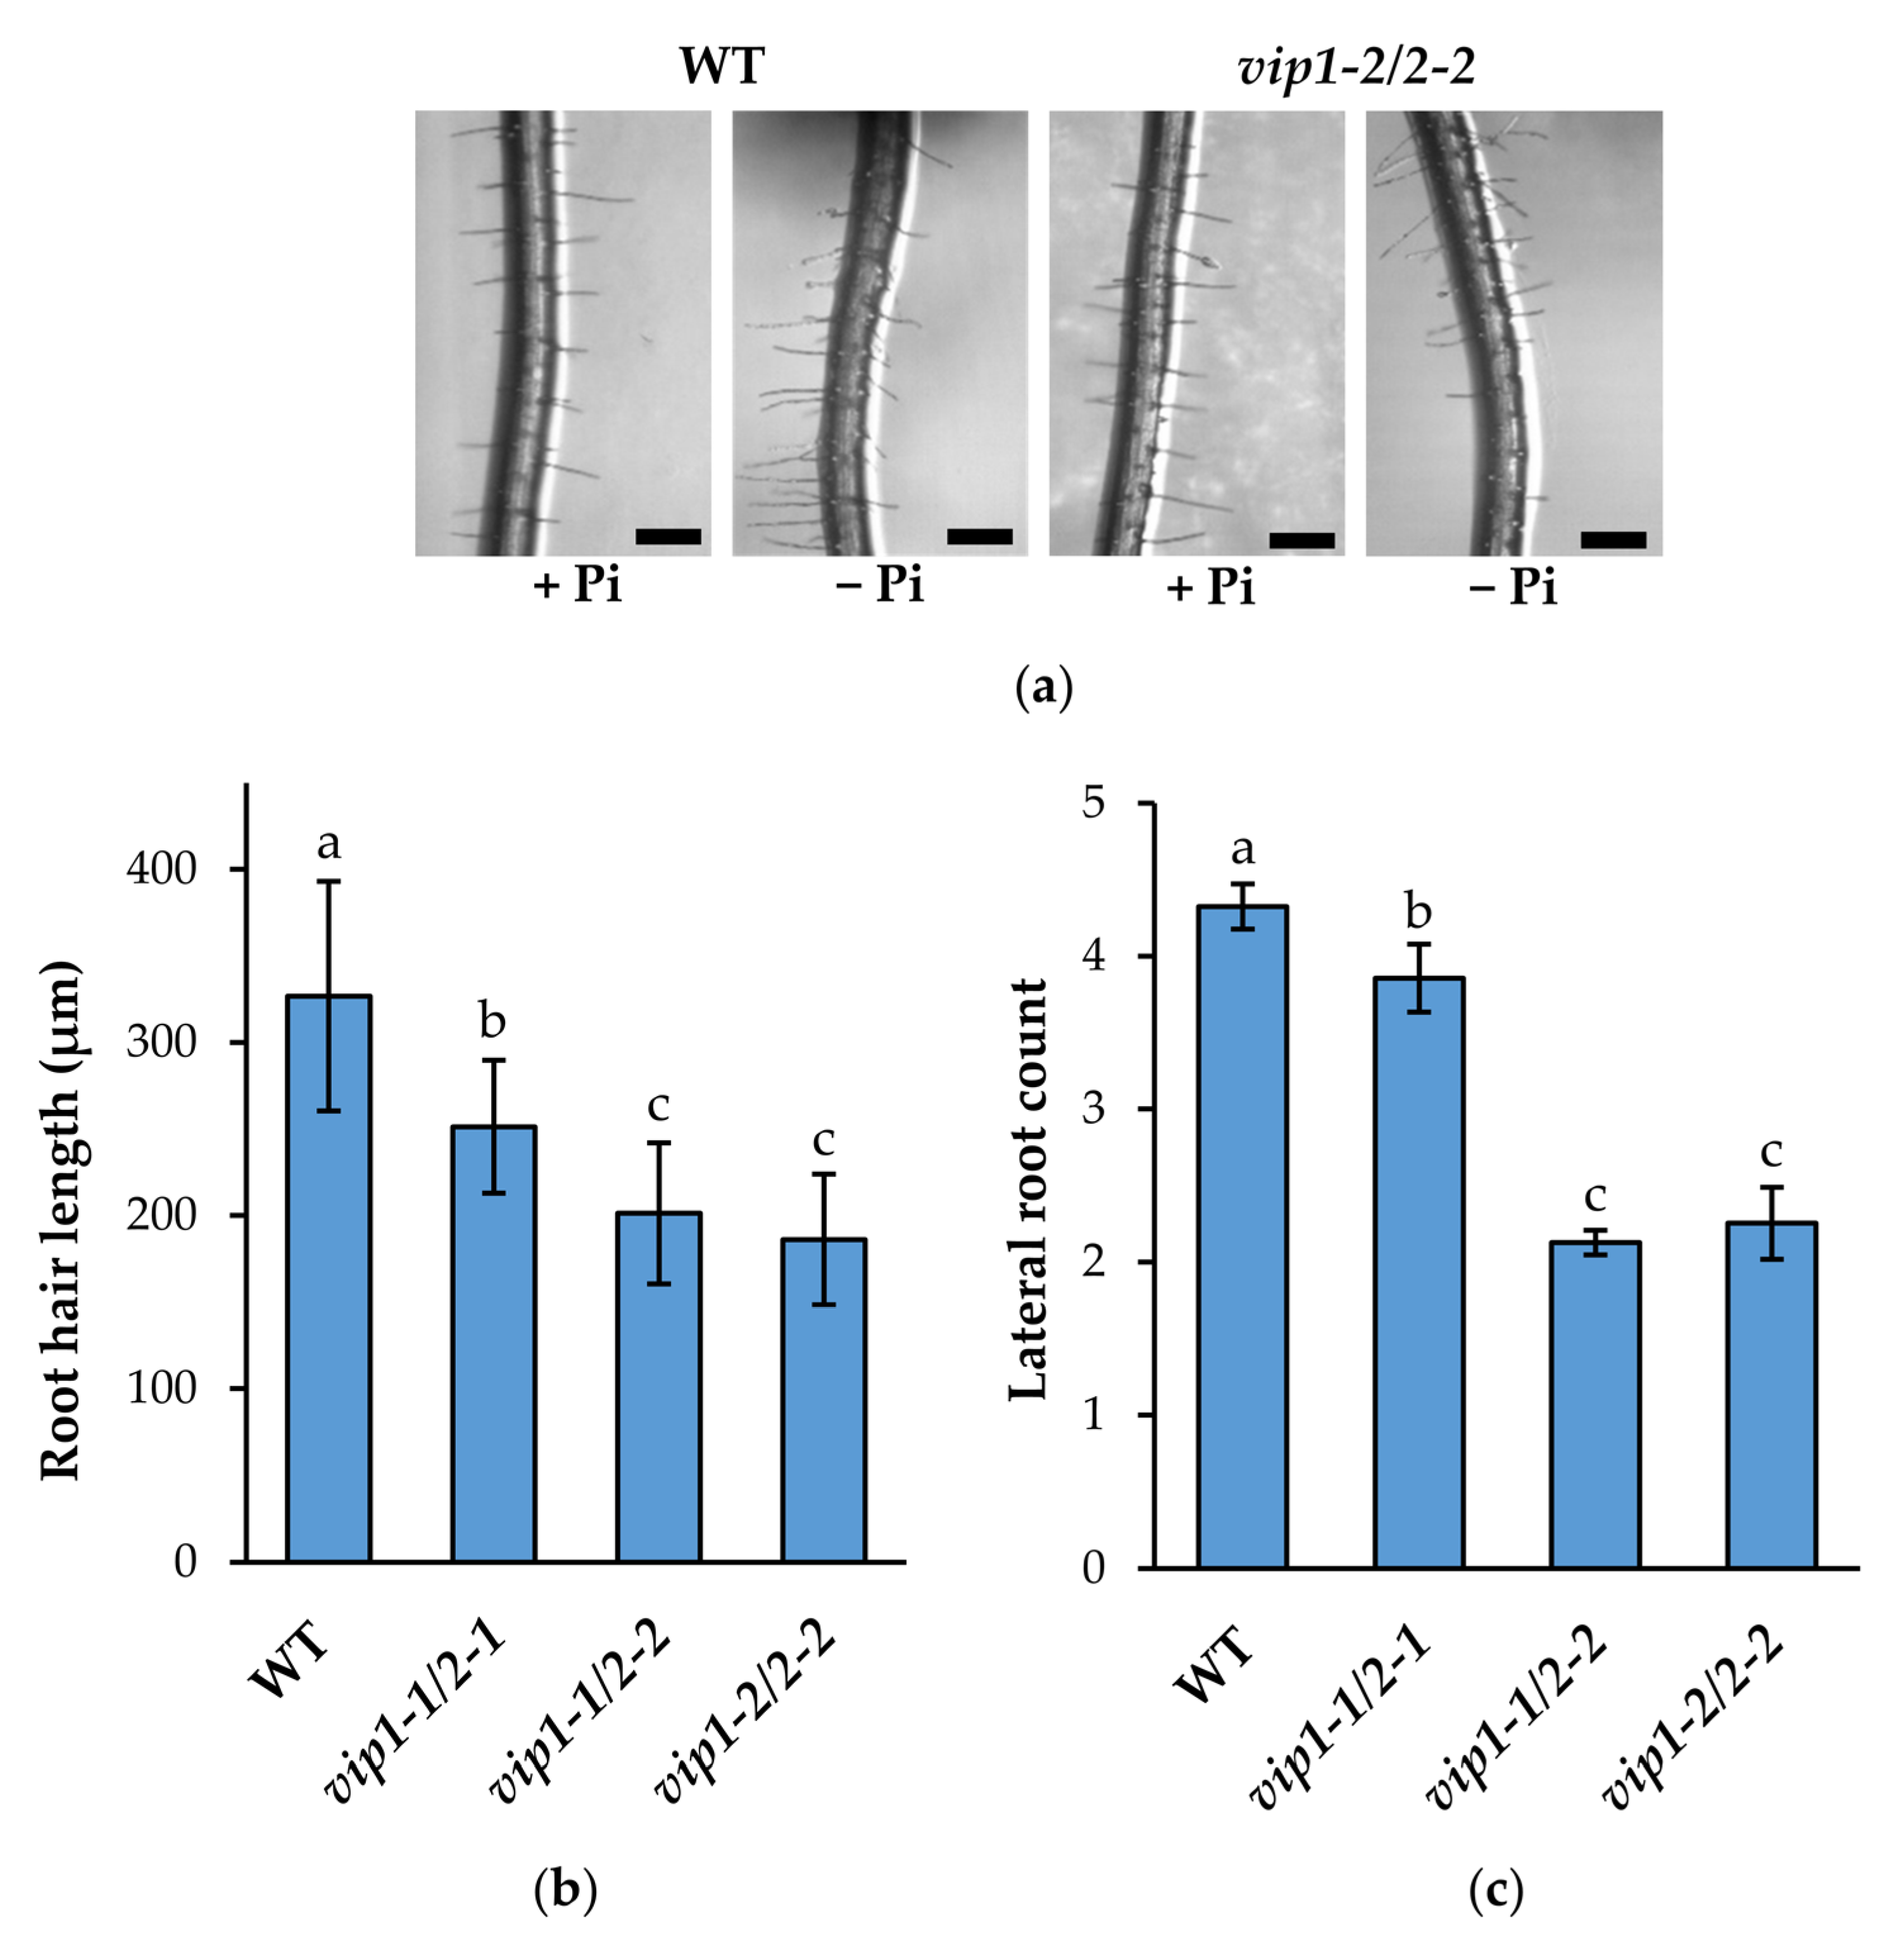
2.4. Root System Architecture Is Significantly Altered in vip Double Mutants’ Response to Low Phosphate

WT and vip double mutants were grown on either replete or limiting phosphate MS media to monitor changes in RSA. As expected, after 14 days of growth on limiting Pi, wild-type roots showed reduction in primary root growth along with increased lateral roots and increased root hairs compared to the Pi-replete condition (Figure 4a–c). In contrast, vip double mutants exhibited significantly reduced lateral root formation and root hair elongation under low Pi compared to wild type. Consistent with other phenotypes, vip1-1/vip2-1 mutants showed a ~10% reduction in lateral root formation (Figure 4b). More notably, both vip1-1/vip2-2 and vip1-2/vip2-2 showed dramatic reductions in lateral root formation (~50%). A similar trend was observed with root hair elongation (Figure 4c). Relative to WT, vip1-1/vip2-1 mutants exhibited a ~23% decrease in root hair length while vip1-1/vip2-2 and vip1-2/vip2-2 exhibited a ~40% decrease in root hair length. Together these data show that vip mutant seedlings exhibit dampened local responses to low phosphate availability.

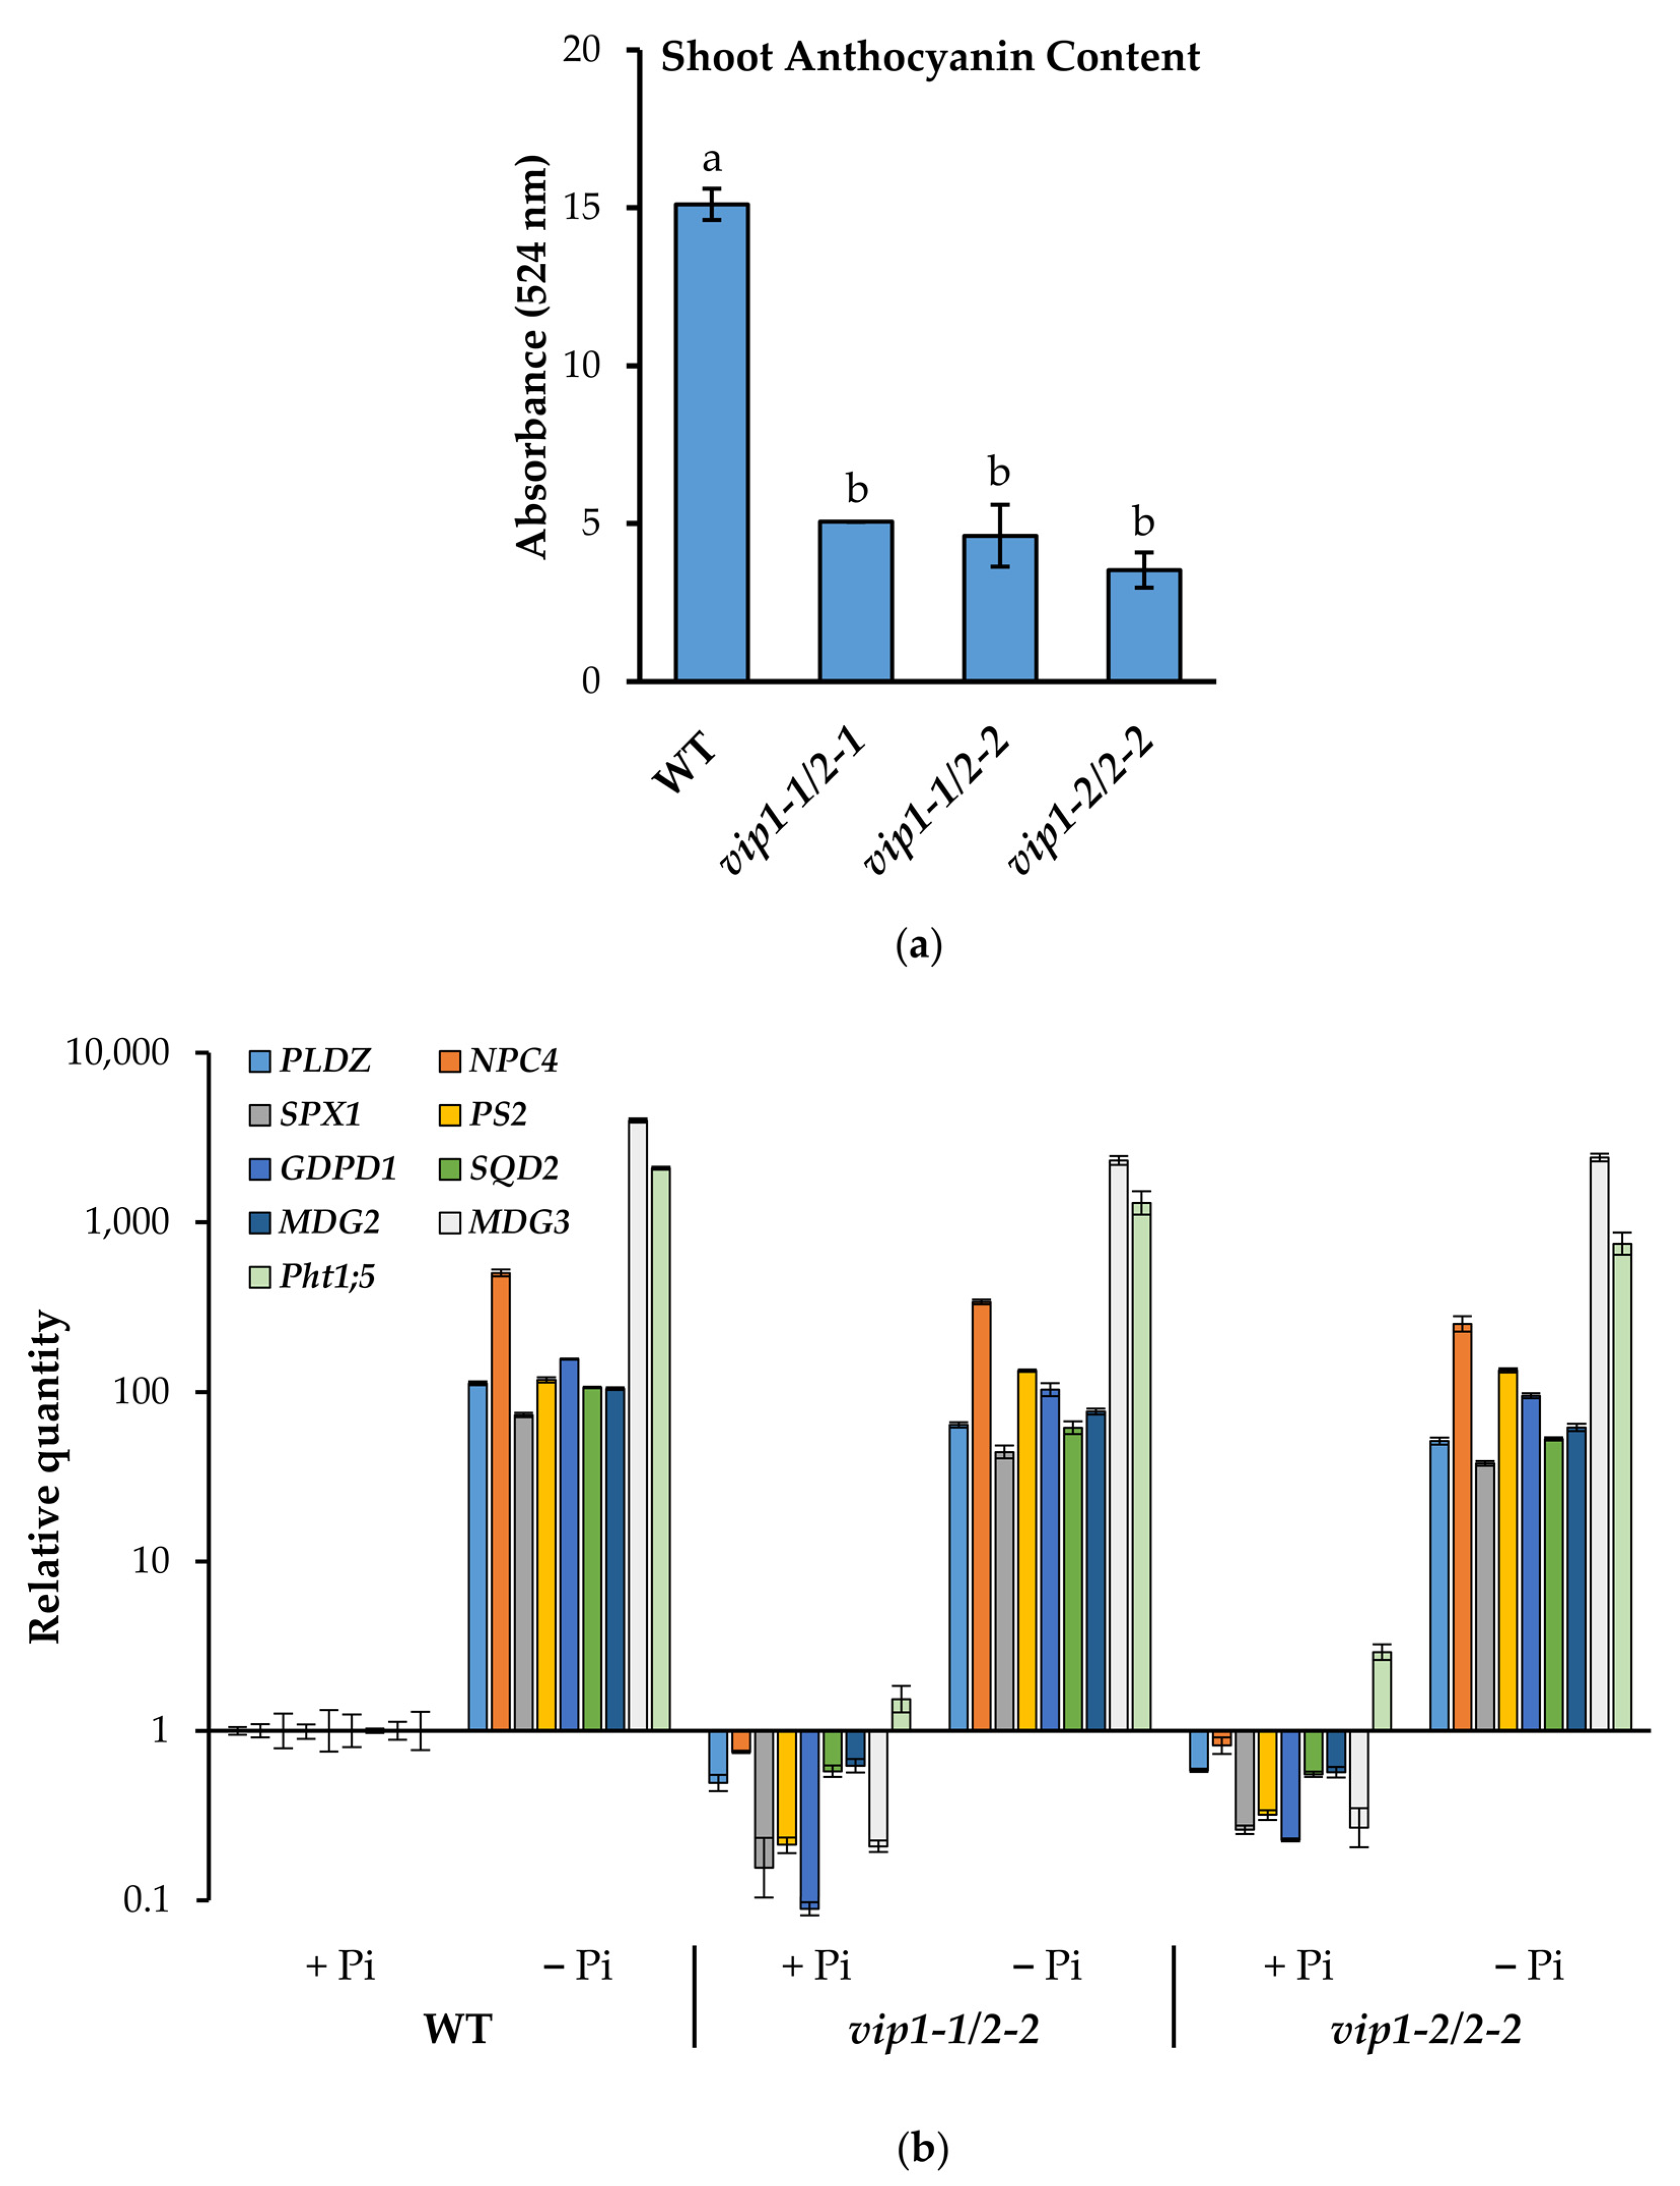
2.5. Anthocyanin Accumulation Is Reduced in vip Double Mutants in Response to Low Phosphate

Foliar anthocyanin accumulation is associated with a systemic physiological response of plants to low phosphate availability [39]. Interestingly, the transcription factor production of anthocyanin pigment1 (PAP1), a key controller of anthocyanin biosynthesis, was recently shown to be regulated via SPX4 and InsPs, analogous to the PHR1/SPX1 inhibition complex [40,41].
After growing on phosphate-limiting media for 18 days, vip double mutant seedlings accumulated considerably less anthocyanin in their shoot tissues, relative to WT controls. (Figure 5a). As measured by a spectrophotometric anthocyanin assay, vip1-1/vip2-1, vip1-1/vip2-2, and vip1-2/vip2-2 mutants accumulated 66%, 69%, and 76% less anthocyanin than WT controls. This dramatic reduction in anthocyanin accumulation in response to limited Pi in the vip mutants supports a role for PP-InsP-mediated regulation anthocyanin biosynthesis.

2.6. Phosphate Starvation Response (PSR) Genes Are Inducible in vip Double Mutants

To query the ability of vip double mutants to surmount a systemic phosphate starvation response, WT and vip mutant seedlings were grown under replete or limiting phosphate conditions for 18 days and transcriptional responses in the shoot tissues were examined (Figure 5b). The subset of PSR genes found to be basally downregulated in vip double mutants (Table 1), along with other genes involved in lipid metabolism, were monitored by qRT-PCR. Consistent with the RNA-seq results, basal expression of many of the queried genes was reduced compared to wild type. However, this downregulation was only seen in a subset of PSR genes; the basal level of expression of Pht1;5 (a high-affinity phosphate transporter in leaves) was comparable to that of wild type. Irrespective of their basal levels in the vip mutants, all PSR genes queried showed significant induction under limited phosphate (Figure 5b). Transcripts associated with lipid metabolism including PLDZ2, MGD2, MGD3, and SQD2 were induced under low Pi in vip1-1/vip2-1, vip1-1/vip2-2, vip1-2/vip2-2. Similarly, transcripts associated with phosphate transport during leaf senescence, [42,43] including GDPD1 and Pht1;5, were upregulated. Furthermore, the relative fold change under low Pi in vip doubles was comparable to PSR induction observed in shoots of WT seedlings, indicating that the vip double mutants are equally responsive and not impaired in their transcriptional response to low Pi.

2.7. vip1-2/vip2-2 Mutants Are Deficient in InsP8

To determine if the changes in these vip mutants were associated with alterations in PP-InsPs, we focused on the vip1-2/vip2-2 double mutant, and quantified PP-InsPs by radiolabeling with 3H-myo-inositol using our previously described methods [27]. We also compared vip1-2/vip2-2 mutants to ipk1. We found, as expected and as shown by others, that ipk1 mutants contained elevated Ins(1,3,4,5,6)P5, greatly reduced InsP6, and a reduction in InsP7 and InsP8 (Figure 6a,b,e–g). In contrast, vip1-2/vip2-2 mutants exhibited a ~25% decrease in InsP8 levels, a slight reduction in InsP7 and no significant changes in other InsPs (Figure 6c–g). We conclude that the vip1-2/vip2-2 mutant has a unique alteration in its InsP/PP-InsP profile, which most resembles a loss of function in the VIP kinases.

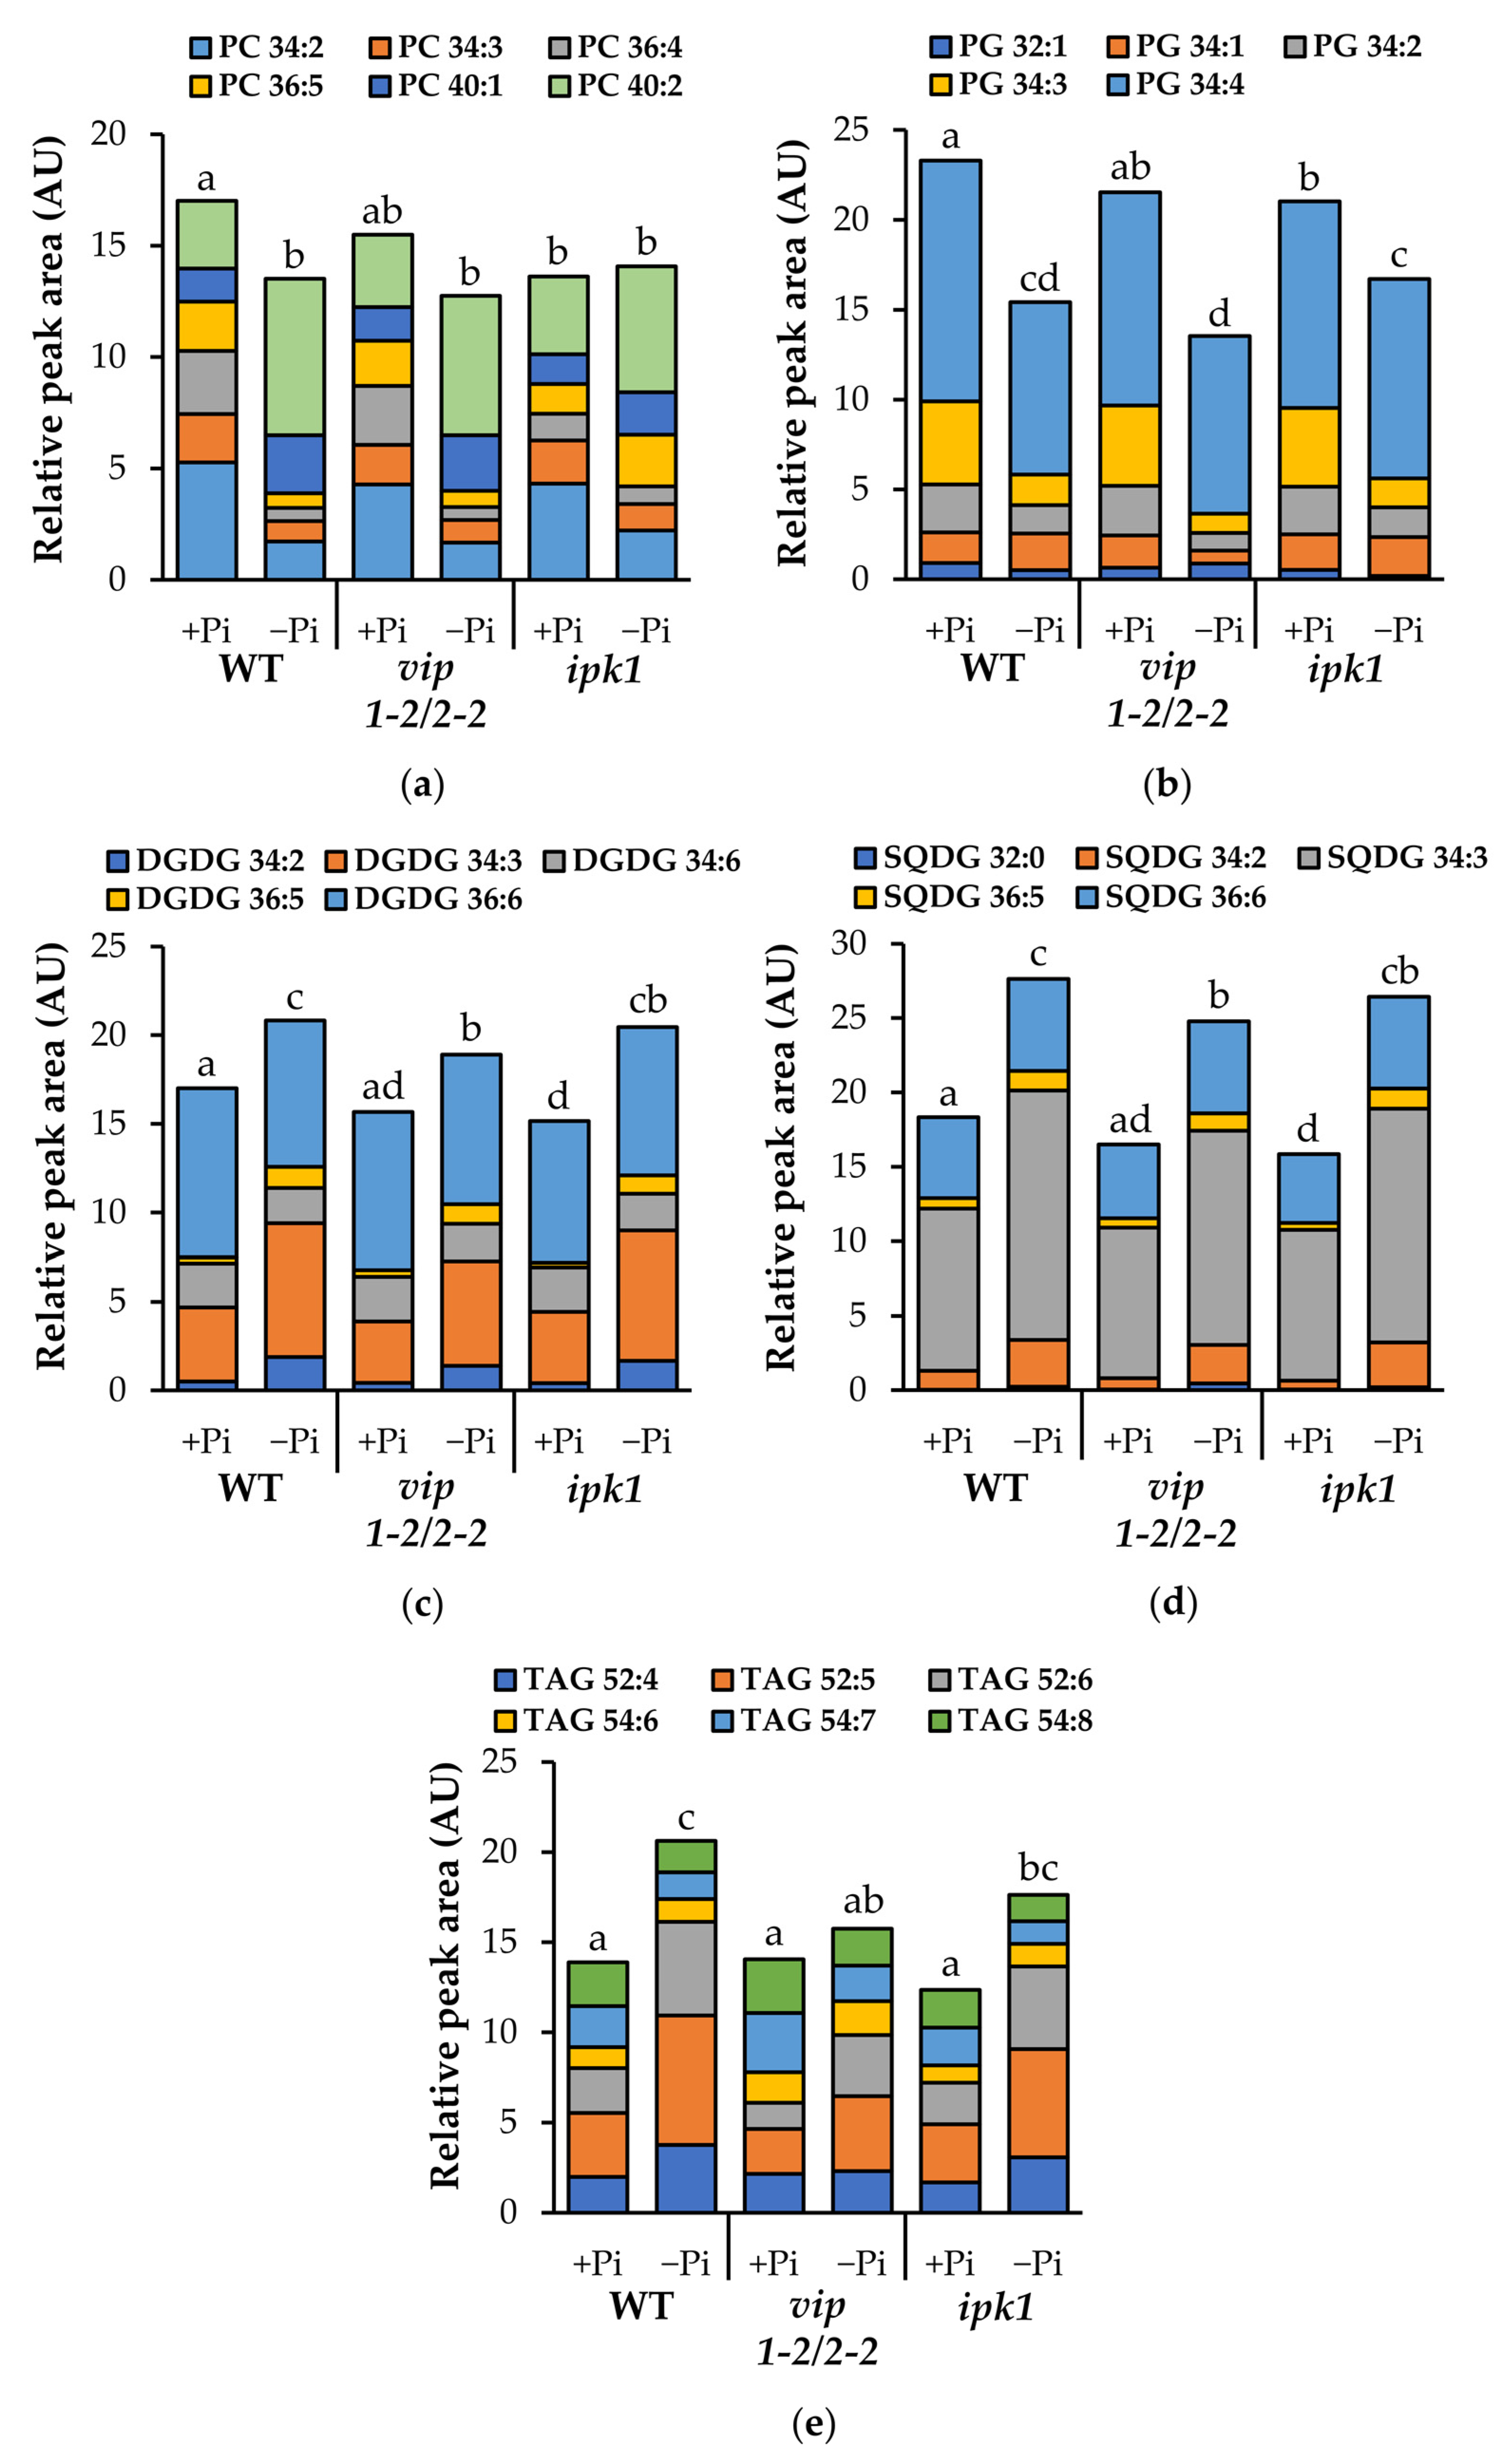
2.8. Altered Lipid Remodeling Responses in PP-InsP-Deficient Mutants

In response to low Pi, plants evoke a well-characterized lipid remodeling process that involves the replacement of phospholipids by galactolipids and sulfolipids within plant membranes [13,14,15]. To examine whether changes in PP-InsPs affect lipid remodeling, we assessed the response of vip1-2/vip2-2 and ipk1 mutants relative to WT using an untargeted mass spectrometry approach.
As seen in by the PLS-DA plot (Figure S4), there are dramatic differences between Pi-replete and Pi-limited conditions in shoot tissues of WT and both vip and ipk1 mutants (with the treatment variable contributing to >22% of the difference). Additionally, all of the replicates for each genotype/treatment clustered together. We conclude that our MS conditions are appropriate to measure established changes in lipid remodeling in response to low Pi.
We investigated the levels of the different classes of phospholipids and galactolipids under normal growth conditions, and in response to low Pi. WT plants responded to low Pi conditions as expected. Specifically, our data indicate that various species of phosphatidylcholine (PC), phosphatidylethanolamine (PE), phosphatidylglycerol (PG), phosphatidic acid (PA), and phosphatidylinositol (PI) undergo a significant decrease (Figure 7, Supplemental Table S3, Figure S5). Conversely, various species of DGDG, SQDG, and triacylglycerol (TAG) significantly increase in response to low Pi, while monogalactosyldiacylglycerol (MGDG) levels do not change (Figure 7, Supplemental Table S3, Figure S5).
We compared the vip mutant with WT plants under both Pi-replete and low-Pi conditions. The vip1-2/vip2-2 mutants grown under Pi-replete conditions did not significantly differ in any lipids queried (Figure 7, Supplemental Table S3, Figure S5) compared to WT. When vip1-2/vip2-2 mutants were grown under low-Pi conditions, levels of DGDG, SQDG, and TAGs increased relative to the Pi-replete condition. However, the levels of these lipids were significantly lower than in similarly grown WT plants (Figure 7, Supplemental Table S3, Figure S5). We conclude that vip1-2/vip2-2 mutants have suppressed a portion of their low-Pi lipid remodeling responses, specifically with regards to DGDG, SQDG, and TAGs.
We included ipk1 mutants in our analysis as these plants have known changes in both InsP6 and PP-InsPs, which we confirmed in Figure 6. The data presented in Figure 7, Supplemental Table S3, and Figure S5 indicate that ipk1 mutants differ significantly from WT plants grown in replete-Pi conditions in their levels of both phospholipids (PC, PG, PI) as well as galactolipids (MGDG, DGDG) and sulfolipids (SQDG). As each of these lipid classes is significantly lower in ipk1 mutants, we conclude that under Pi-replete conditions, altered levels of InsP6 and PP-InsPs correlate with suppressed levels of key lipids regulated by the phosphate sensing pathway. Interestingly, under low Pi, decreases in phospholipids (PG, PI) and increases in DGDG and SQDG in ipk1 are comparable to those in WT. Thus, we conclude that lipid remodeling in response to low Pi is not impaired in ipk1.
When comparing the lipid levels and lipid remodeling responses of vip1-2/vip2-2 and ipk1 mutants, our data support a model in which IPK1 preferentially impacts lipids under Pi-replete conditions, while the VIP enzymes have a greater impact on lipid remodeling in response to low Pi.

3. Discussion

3.1. Comparison of Mutants with Disrupted Inositol Pyrophosphate Biosynthesis

In this paper we characterize novel vip double mutants and compare their responses to limited Pi. Specifically, we show that both local (RSA) and systemic (metabolic) responses to low phosphate are dampened/reduced in the vip mutants compared to wild type. These mutants provide an important tool for discerning the molecular details of Pi-sensing in plants as they contain novel changes in PP-InsPs, which are implicated in the repression of PSR. Specifically, the vip mutants differ in their PP-InsP profiles from previously published vih mutants [31,37]. We show that the vip mutants contain a modest reduction in InsP8 (70–75% of WT levels), as detected by 3H myo-inositol labeling (Figure 6c,d,g). Furthermore, our vip mutants differ significantly in the amount of InsP8 precursors, i.e., InsP6 and InsP7, as compared to ipk1 and vih mutants. [31,37]. Notably, the differences in the levels of InsP7 and InsP8 between the vip and the vih mutants result in near opposite phenotypes, with respect to the regulation of Pi homeostasis and PSR, including gene expression (Figure 5b), Pi accumulation (Figure 3), and anthocyanin production (Figure 5a). Importantly, the transcriptomic data show that under Pi-replete conditions a subset of PSR genes are repressed in shoots and roots of vip mutants compared to WT levels. This is in contrast to other mutants with lower InsP8 levels, including both the vih and ipk1 mutants. This suggests two important considerations for Pi-sensing. Firstly, our data cannot be explained by the current model of PHR1 regulation. In this model, InsP8 is thought to be the primary regulatory ligand promoting repression of PHR1 by SPX1; in the absence of InsP8, PSR gene expression is constitutively upregulated under Pi-replete conditions. However, in the vip mutants, PSR gene expression is not constitutive despite a reduction in InsP8; in fact, their response is opposite. Given that SPX domains are able to interact with less phosphorylated forms (InsP6 and InsP7), and that the cellular levels of these metabolites may far exceed that of InsP8, it is conceivable that other InsPs and PP-InsPs may contribute towards the regulation of PSR. The second novel implication from our transcriptomic analysis is that only a subset of PSR genes is misregulated in the vip mutants. This suggests that specific subsets of genes, and possibly metabolites as well, are regulated by a finely tuned InsP and/or PP-InsP profile within the plant.

3.2. Transcriptional Responses of vip Mutants

A stated above, it is intriguing that we identified downregulation of 20 PSR genes in all three of the vip mutants reported here. This is all the more striking given that each of the three mutants have overlapping but different allelic combinations. Several of these (14) genes were also shown to contain a variant of the P1BS element in their promoters that is presumably targeted by PHR1. Furthermore, these genes belong to a PLDz co-expression network [44], which includes genes involved in lipid remodeling and Pi recycling. This suggests that additional factors affecting PHR1 DNA-binding may be required to provide transcriptional specificity.
We also compared the transcriptional results from vip1-2/vip2-2 with those of vih1-2/2-3, a double mutant with a different allelic combination [37]. A major difference in differentially expressed genes (DEGs) was that the 20 basally downregulated genes in vip1-2/vip2-2 were upregulated in vih1-2/2-3. Despite this difference, we also detected substantial overlap of DEGs between the two mutants (Figure S6). In fact, 57% of upregulated and 47% of downregulated genes in vip1-2/vip2-2 are shared with vih1-2/vih2-3.
Gene ontology (GO) terms enriched in the upregulated genes include stress response genes, as well as those involved in immune responses and ethylene-activated signaling pathways. Compared to wild type, several leucine-rich repeat (LRR)-receptor-like protein kinases, WRKY transcription factors, ethylene responsive transcription factors, UDP-glycosyl transferases, as well as JAZ1 (a negative regulator of Jasmonic Acid (JA) signaling) were upregulated in both vip1-2/vip2-2 and vih1-2/2-3 mutants. Some of these defense-related genes were also found to be induced within 1 h in response to jasmonic acid (JA) treatment [45,46]. Interestingly, InsP8 levels were shown to increase in Arabidopsis leaves upon treatment with methyl jasmonate and it was proposed that InsP8 and JA bind the COI1-ASK1 complex functioning as an incidence signal to recruit the JAZ1 repressor protein for ubiquitin-mediated degradation [30], thereby activating JA-mediated defense responses. Single vih2-3 or vih2-4 mutants had reduced expression of JA response genes VSP2 and MYC2 and were more susceptible to herbivory [30]. Given the response of the single mutants, it is intriguing that both the vip1-2/vip2-2 and the vih1-2/vih2-3 double mutants show increased expression of JAZ1 and other JA-responsive genes basally. In fact, a closer examination of the vih1-2/vih2-3 double mutant DEG dataset indicates that several genes involved in JA biosynthesis (AOS, AOC, LOX2, LOX3, LOX4, and LOX6), as well as the JA responsive master regulator MYC2 [47] and the vegetative storage proteins VSP1 and VSP2, have greater than twofold increased basal expression [37]. Taken together, these observations suggest that some aspects of defense signaling may be under the control of compensatory pathways. It is conceivable that ethylene crosstalk may play a role, since JA-ET can act in an interdependent manner to control plant defense [48].
Gene ontology (GO) terms enriched in the downregulated genes are primarily associated with the chloroplast and include several genes encoding for subunits of the photosynthetic apparatus, including photosystem I (PS I), components of the oxygen evolving complex, chlorophyll ab-binding protein subunits, as well as NADPH quinone oxidoreductase, and the chloroplastic NDH. The NDH complex is tightly associated with PS I and functions in cyclic electron transport [49]. It is remarkable that approximately 50% of the downregulated genes identified in the vip mutant are associated with the photosynthetic apparatus, yet this does not appear to dramatically impact overall growth. The connection between photosynthesis and PP-InsPs thus awaits a thorough analysis of photosynthetic parameters within vip and vih double mutants.

3.3. Metabolite Changes in vip Mutants

Given that we identified transcriptional changes in genes that encode enzymes involved in lipid remodeling, we used LC-MS to profile key lipid changes in vip double and ipk1 mutants. Our expectation was that analysis of these two mutants, one with suppressed PSR gene expression and one noted for increasing PSR gene expression, would give us a chance to discern how PP-InsP-induced transcriptional changes impact lipid remodeling in response to low Pi. Under limited Pi, we expected to detect increases in galactolipids and sulfolipids in vip mutants comparable to those in WT, given their robust transcriptional responses to limiting Pi (Figure 5b). However, we observed an attenuated response of DGDG and SQDG increases under limited Pi. These results reveal two important insights. The first is that small changes in PP-InsPs can alter lipid remodeling in response to low Pi conditions. The second is that this altered regulation of lipid remodeling in response to low Pi is not controlled at the transcriptional level in the vip mutant, suggesting that there are other, post-transcriptional mechanisms involved.
Many researchers have characterized adaptations of the ipk1 mutant to low phosphate [33,34]. However, to our knowledge, lipid remodeling has not been examined. If ipk1 shoots are responding to a perceived Pi limitation, we might expect decreases in phospholipids with concomitant increases in galactolipids and sulfolipids under basal Pi conditions. Instead, we observed a significant reduction in PC and PG as well as in the galactolipids DGDG and SQDG (Figure 7a–d). These results indicate that replete Pi conditions may stimulate hydrolysis of specific phospholipids in the ipk1 mutant, however, this does not result in an increase in galactolipids and sulfolipids. Under limited Pi, ipk1 mutants contain similar levels of PC, PE, DGDG, and SQDG as compared to WT. This indicates that despite the changes in lipid composition under replete Pi conditions, ipk1 is able to turn on a robust lipid remodeling response.
Under Pi stress, Arabidopsis leaves were shown to accumulate up to ~20-fold greater TAG [19]. In Chlamydomonas reinhardtii, mutation of VIP abrogates control of nutrient sensing, and results in an elevation of TAGs under replete Pi and under nitrogen starvation [50]. We found that vip mutants exhibited similar levels of TAG to WT under Pi replete conditions. However, under limited Pi, TAG levels were significantly reduced in vip mutants (Figure 7e), further supporting that a dampened response to low Pi occurs in these vip mutants. In contrast, ipk1 exhibited a small, but insignificant, reduction in TAG levels under both Pi-replete and Pi-limiting conditions. These data could inform engineering strategies to increase TAG production in higher plants.
Taken together, the expression patterns of genes involved in phospholipid turnover and galactolipid and sulfolipid synthesis do not correlate directly with the lipid profiles for the mutants studied here. This incongruence indicates that there must be a higher order of control of lipid remodeling processes, beyond what occurs at the regulation of transcription of lipid remodeling genes.

4. Materials and Methods

4.1. Plant Materials and Growth Conditions

Seed of T-DNA insertional mutants were obtained from the Gabi-Kat (vip1-1 GK_204E06; vip1-2 GK_008H11), SALK (vip2-1 SALK_094780), and SAIL (vip2-2 SAIL_175_H09) T-DNA insertion collections [51,52,53]. Double mutants generated from these insertional lines were compared to Col-0 WT in all experiments. In all experiments carried out on Murashige and Skoog (MS) agar media, seeds were surface sterilized in a dilute bleach solution (2% v/v sodium hypochlorite, 0.1% v/v Triton X-100, aq.) for 12 min and rinsed with eight changes of sterile deionized water. Seeds were stratified at 4 °C in darkness for 2 days and sown on plates containing 0.5× MS media (M576, Phytotech Labs, Lenexa, KS, USA) supplemented with 1% w/v sucrose, 0.05% morpholinoethanesulfonic acid, 1% w/v agar (Agar-M, Sigma Aldrich, St. Louis, MO, USA), pH 5.7. Seedlings were grown under an 8 h light/16 h darkness photoperiod with an intensity of 110 µmol m−2 s−1. Day/night temperatures were set to 21 °C/19 °C.

4.2. Basal Morphometric Analysis

Arabidopsis seedlings were grown as described above and primary root length was measured after 10 days using morphometric image analysis software (ImageJ v1.52n). Eighteen-day-old seedlings were transplanted to wetted soil (PGX, Pro-Mix) and mature rosette leaf areas were measured after 28 days of growth.

4.3. Low Phosphate Treatment

For all low-phosphate experiments, phosphate-replete media contained 1 mM Pi and phosphate-limiting media contained 10 µM Pi. Media were prepared by supplementing commercially prepared MS micronutrient media (M529, Phytotech) with macronutrients (20.61 mM ammonium nitrate, 2.99 mM calcium chloride dihydrate, 3.07 mM magnesium sulfate heptahydrate, 18.79 mM potassium nitrate) and phosphate in the form of monobasic potassium phosphate. All glassware used for low-phosphate experiments was rinsed for 5 min in a solution of 0.1 M NaOH/0.1 M HCl, and rinsed 10 times with deionized water to remove accumulated phosphate from the borosilicate glass.
WT and vip double mutant seedlings were grown on 1× MS medium with replete (1 mM Pi) or limiting (10 µM Pi) phosphate. For all low-phosphate treatment experiments, plates were placed within the growth chamber in a random arrangement by genotype and treatment with regular rearrangement to minimize any effects of microenvironments within the chamber. Roots were imaged after 14 days under a stereo microscope (Wild M3, Heerbrugg, fitted with MC170HD camera, Leica, Wetzlar, Germany), and root hairs growing within the focal plane (orthogonal to the axis of observation) were measured using morphometric image analysis software (ImageJ v1.52n).

4.4. RNA Isolation and NextGen RNA Sequencing

WT, vip1-1/vip2-1, vip1-1/vip2-2, vip1-2/vip2-2 seedlings were grown on 0.5× MS media under standard conditions as described above. Shoot tissues (all aerial tissues including leaves, cotyledons, and hypocotyls) were harvested after 10 days of growth. RNA was isolated using a silica column-based kit (RNEasy, Qiagen, Hilden, Germany) and analyzed for integrity by capillary electrophoresis (BioAnalyzer 2100). Three replicate experiments were carried out. Directional next generation RNA sequencing libraries were prepared for the Illumina HiSeq platform according to manufacturer’s instruction (NEBNext Ultra directional) and each sample was uniquely barcoded. Samples were analyzed in triplicate across three lanes of an Illumina HiSeq chip carried out at the Genomics Sciences Laboratory (GSL, NCSU). Reads were trimmed by CutAdapt (https://github.com/marcelm/cutadapt/tree/v1.7.1 (accessed on 1 September 2017)) to unconditionally remove the first 10 bases of each read, search for and remove universal Illumina adapter prefixes, and reject reads below 50 bp. Trimmed FASTQ files were aligned to the Arabidopsis genome (Ensembl TAIR10 genes.gtf) by the tophat pipeline using bowtie2, resulting in an average mapping rate of 97.5%. Differential gene expression was analyzed by linear modeling using DESeq2 (https://bioconductor.org (accessed on 13 September 2017)). A linear model was built to include genotype and bio-replicate groupings and contrast terms were used to compare basal gene expression of each vip double mutant to WT. Differential expression lists were generated to include genes which had >10 reads, and adjusted p-values of <0.05. GeneID lists were annotated by functional classification using TAIR and the PANTHER classification system (www.arabidopsis.org, www.pantherdb.org (accessed on 16 September 2017)).

4.5. Inorganic Phosphate Assay

WT, vip1-1/vip2-1, vip1-1/vip2-2, vip1-2/vip2-2, and ipk1 seedlings were grown on 0.5× MS media at 21 °C under an 8 h photoperiod for 18 days. Separately, a replicate panel of seedlings were transplanted to soil and grown to maturity for an additional 28 days. Shoot tissues from ~50 seedlings/genotype/bioreplicate were harvested into liquid nitrogen and ground to a fine powder. For assays of mature plants, 2 leaves were collected from each of 8 plants/genotype/bioreplicate and ground in a similar manner. Inorganic phosphate was extracted by incubating in ten volumes 1% v/v acetic acid. Extracted fractions were analyzed for Pi concentration by a modified micro-titer assay [54]. Briefly, 50 µL sample extract was diluted to a volume of 150 µL, mixed 1:1 with an ammonium molybdate working reagent (5% w/v FeH14O11S·7H2O, 1% w/v (NH4)2MoO4, 1N H2SO4 aq.) and incubated for 1 h. Absorbance at 660 nm was measured on a plate spectrophotometer and phosphate concentrations were calculated using a standard curve of known phosphate amounts in the form of KH2PO4.

4.6. Anthocyanin Measurements

Shoot tissue was harvested from 18-day-old seedlings (~50 seedlings/genotype/bioreplicate) grown on Pi-limiting (10 µM Pi) MS medium. Anthocyanin was extracted and quantified by a modified method adapted from [55]. Briefly, 50 mg shoot tissue was homogenized by 2.8 mm stainless steel beads in 500 µL extraction buffer (50% v/v EtOH ((aq.)) containing 0.25% v/v HCl) using a tissue disruption apparatus (BioSpec Mini-Beadbeater). Lysates were clarified by centrifugation at 20,000 RCF and 300 µL supernatant was transferred to clean microcentrifuge tubes. Collected supernatants were washed with three changes of 400 µL CHCl3 and vigorous shaking. Isolated anthocyanin fractions were drawn from the upper phase, diluted 20-fold and quantified by reading absorbance at 524 nm using a spectrophotometer.

4.7. Statistical Analysis of Morphometric and Spectrophotometric Data

For all morphometric analyses, the number of biological and technical replicates is indicated for each experiment in accompanying figure legends. For spectrophotometric data, including inorganic Pi and anthocyanin measurements, 2-3 biological replicates (described in the methods sections above) were analyzed. Morphometric and spectrophotometric data were analyzed by one-way ANOVA using JMP Pro v15 software (SAS Institute Inc., Cary, NC, USA). Post hoc analysis of these data were carried out by Tukey–Kramer honest significant difference tests at a significance level of α = 0.05.

4.8. RNA Isolation, cDNA Synthesis, and qRT-PCR Analysis

Shoot tissue was ground to a fine powder in liquid nitrogen and total RNA was isolated using a silica column-based kit (RNEasy, Qiagen, Hilden, Germany). RNA isolates were treated with DNase (DNAfree, Invitrogen, Carlsbad, CA, USA) and first strand cDNA was synthesized with random hexanucleotide primers and Multiscribe reverse transcriptase according to manufacturer’s specifications (Applied Biosystems, San Francisco, CA, USA). Quantitative reverse transcription PCR (qRT-PCR) reactions were prepared with a mastermix (PowerUp SYBRGreen, Applied Biosystems) and carried out in triplicate using cDNA equivalent to 20 ng of RNA input. AtVIP1 and AtVIP2 transcript abundances were quantified using gene-specific primers and PP2A as an endogenous control. Primer efficiencies for AtVIP1, AtVIP2, and PP2A assays were determined using a standard curve and found to be comparable. PSR gene expression was quantified in low-phosphate-treated samples using gene-specific primers (Supplemental Table S4) and PEX4 as an endogenous control. All qRT-PCR reactions were carried out in a StepOnePlus Thermal cycler (Applied Biosystems) and relative expression values were calculated according to the ΔΔCT method [56] by instrument software (StepOne v2.2.2).

4.9. Plant Inositol Polyphosphate Analysis

Arabidopsis seedlings were grown in 0.5 × MS + 0.2% w/v agarose, pH 5.7 with a 16 h light, 8 h dark cycle. After 2 weeks of growth, 50 µCi of [3H]-myo-Inositol (20 Ci/mmol, American Radiolabeled Chemicals, St. Louis, MO, USA) was added to 24 seedlings in the same media. After 5 days of incubation under constant light, the seedlings were rinsed 3 times with water, frozen, then thawed and extracted with 1 M perchloric acid + 3 mM EDTA + 0.1 mg/mL InsP6 (Sigma Aldrich, St. Louis, MO, USA) by douncing with a plastic pestle on ice. The extract was then centrifuged for 5 min at maximum speed, the supernatant was transferred to a microcentrifuge tube and neutralized to pH 6–8 with 1 M potassium carbonate + 3 mM EDTA. The tubes were loosely capped and incubated on ice for 2 h, then centrifuged at maximum speed for 5 min. The supernatant was transferred to a microcentrifuge tube and concentrated under a stream of nitrogen. Inositol polyphosphates were separated by HPLC using a 125 × 4.6 mm Partisphere SAX-column (MAC-MOD Analytical, Chadds Ford, PA, USA), and eluted with a previously described ammonium phosphate gradient [57]. Eighty-five fractions were collected and radioactivity was measured by liquid scintillation counting (Beckman Coulter, New Brunswick, NJ, USA). To exclude unincorporated label, the total CPM of fractions 13–85 was used to normalize the datasets. Normalized CPM from fractions comprising the peaks for InsP6, InsP7, and InsP8 were used for quantification. Error bars are standard deviations of the mean (n = 3 biological replicates) and statistical significance values of deviations from WT means were calculated by two-tailed Student’s t-test.

4.10. Lipidomics Methods

Lipid extraction method was followed according to an amended protocol [58]. WT, vip1-2/vip2-2, and ipk1 seedlings were grown on 0.5× MS media at 21 °C under an 8 h photoperiod for 18 days. Six biological replicates of ~50 seedlings/sample were processed for each genotype and treatment. Shoot tissue was harvested into 3 mL vials, containing 0.5 mL isopropanol (Spectrum Chemicals, New Brunswick, NJ, USA) with 0.01% BHT (Sigma-Aldrich, St. Louis, MO, USA) preheated to 75 °C. Samples were incubated at 75 °C for 15 min and cooled to room temperature. 1.5 mL chloroform:methanol:water (30:41.5:3.5), Spectrum Chemicals, New Brunswick, NJ, USA) was added and shaken at 100 rpm on an orbital shaker for 24 h. Before lipid analysis, 70 µL of 600 mM ammonium acetate (Sigma-Aldrich, St. Louis, MO, USA) was added.
Lipid profiling was performed using a Waters Acquity I-class ultra-performance liquid chromatography (UPLC) coupled with a Waters Synapt G2-S Q-TOF mass spectrometer (Waters Corp, Milford, MA, USA). Sample separation was achieved with a binary solvent system of 60:40 water:acetonitrile (Spectrum Chemicals, New Brunswick, NJ, USA) with 10 mM ammonium acetate (Sigma-Aldrich, St. Louis, MO, USA) (A) and 90:10 isopropanol:acetonitrile (Spectrum Chemicals, New Brunswick, NJ, USA) with 10 mM ammonium acetate (B) at a flow rate of 0.4 mL/min using the following gradient conditions: linear gradient from 40–100% B (0–10 min), hold at 100% B (10–12 min), and then return to initial conditions and re-equilibrate (40% B; 13–15 min). An 8 μL sample was injected onto an Acquity HSS T3 column (2.1 × 100 mm, 1.8 μm; Waters Corp., Milford, MA, USA) maintained at 55 °C.
The column was eluted into the mass spectrometer fitted with an electrospray ionization (ESI) probe and analysis was performed in high resolution, MSE, positive, and negative modes with a scan time of 0.20 s and a mass scan range of 250–1800 m/z. Source conditions were: capillary voltage 2.4 (negative mode) and 3.2 (positive mode), temperature 120 °C, cone voltage 30, source offset 80, desolvation temperature 350 °C, cone gas 50 L/h, desolvation gas 500 L/h, and nebulizer gas 6.0 bar. For accurate mass, leucine–enkephalin (Waters Corp., Milford, MA, USA) at a concentration of 200 ng/mL was continually infused through the reference sprayer at five μL/min.
The lipidomic data files were processed with MarkerLynx XS application manager software (version 4.1; Waters Corp., Milford, MA, USA) for unsupervised feature discovery, principal component analysis (PCA), and orthogonal partial least-squares discriminant analysis (OPLS-DA), with the following parameters: mass tolerance of 0.02 Da, Xic window of 0.02 Da, mass window of 0.02 Da, retention time window 0.2 min, marker intensity threshold of 4000 intensity units, and data deisotoped. MarkerLynx XS features were normalized to dry mass of shoot tissue. A principle component analysis (PCA) and partial least-squares discriminant analysis (PLS-DA; Figure S4) were performed on the data using the statistical analysis module of the web program Metaboanalyst [59]. Feature peak area values were generated from the average of 3 technical replicates for each of the 6 biological replicates (Supplementary Tables S2 and S3). From the 182 features detected in negative mode, 68 unique lipid species were identified. Positive mode was used to identify unique TAG species, with 8 TAG species identified from 166 detected features. Fragmentation analysis by MS/MS was performed to assign identities to the features using the same chromatography and source conditions described above. Lipid species were identified by hand using fragmentation patterns of head groups and acyl chains, using LipidMaps and previously published lipid datasets as references [58,60,61,62,63].

4.11. Lipidomics Statistical Analysis

For lipidomic analysis, tissue was grown according to randomized fully orthogonal blocked design, with six biological replicates of each genotype and Pi treatment. Each biological replicate was analyzed in technical triplicate by ESI-MS/MS. Peak area data were cube root-transformed to fit a Gaussian distribution. JMP Pro v16 (SAS Institute Inc., Cary, NC, USA) was used to perform linear regression modeling and backward model selection for all main effects and their interactions. A post hoc Tukey HSD test was performed to determine significance (α = 0.05) between genotypes and Pi treatments.

5. Conclusions

Together, the data presented here highlight the complexity of Pi homeostasis regulation in plants and suggest that InsPs as well as multiple PP-InsPs could contribute to a redundant system of control over PSR. Our results illustrate that perturbations to PP-InsPs influence a diverse set of processes including root morphology, gene expression, metabolite levels, and lipid remodeling events, in response to changing and/or limiting Pi conditions. Given that agricultural sources of Pi are predicted to be limited in the future, understanding the impact of plant cellular PP-InsPs on the biology and biochemistry of Pi-sensing is a critical endeavor.

Supplementary Materials

The following are available online at https://www.mdpi.com/article/10.3390/metabo11090601/s1, Figure S1: Model of PP-InsP biosynthesis from InsP6, Figure S2: RT-PCR of full-length AtVIP1 an AtVIP2 transcripts from WT and vip mutant cDNA, Figure S3: Basal expression of select PSR genes in root tissue of vip double mutants, Figure S4: Partial least-squares discriminant analysis (PLS-DA) plot of the negative mode lipidomic profiles of WT, vip1-2/2-2 and ipk1 under Pi-replete and limiting conditions, Figure S5: Additional lipidomic data, Figure S6: Comparison of vip1-2/vip2-2 and vih1-2/2-3 (Dong et al. 2019) RNA-seq datasets, Table S1: Comparison of vip double mutants presented in this work, and others, Table S2: Exact mass/retention time (EMRT), retention time, mass and adduct for identified lipid species, Table S3: Peak area relative abundance and standard error of identified lipid species, Table S4: Oligonucleotide primers used in this study.

Author Contributions

Conceptualization, G.E.G. and I.Y.P.; experimental work, E.S.L., A.D., C.A.C. and B.C.; data analysis and interpretation, E.S.L., C.A.C., B.C., S.B.H., R.F.H., G.E.G. and I.Y.P.; writing—original draft preparation, E.S.L. and C.A.C.; writing—review and editing, G.E.G. and I.Y.P.; visualization, E.S.L.; funding acquisition, G.E.G. and I.Y.P. All authors have read and agreed to the published version of the manuscript.

Funding

This work was made possible by funding from National Science Foundation to IYP (MCB 1615953) and GEG (MCB 1616038) and in part by the USDA National Institute of Food and Agriculture, Hatch project VA-136334. AD was supported by the Integrative Molecular Plant Systems REU at North Carolina State University (DBI 1558579); CAC is supported as a Graduate Teaching Scholar of the College of Agriculture and Life Sciences, Virginia Tech.

Institutional Review Board Statement

Not applicable.

Informed Consent Statement

Not applicable.

Data Availability Statement

Next-generation sequencing data reported in this study will be deposited to the National Center for Biotechnology Information Sequence Read Archive (SRA) database available online at: https://www.ncbi.nlm.nih.gov/sra/ (accessed on 25 March 2021). Data were compared to a published dataset (Dong et al., 2019) available online at: https://www.cell.com/cms/10.1016/j.molp.2019.08.002/attachment/02fad813-965e-4a57-aa06-1150424ecf0b/mmc2.xlsx (accessed on 25 March 2021).

Acknowledgments

Arabidopsis mutant seeds were obtained from the Arabidopsis Biological Resource Center, ABRC (Columbus, OH, USA) and GABI-kat. Next-generation sequencing was performed by the NC State University Genomic Sciences Laboratory (Raleigh, NC, USA). We gratefully acknowledge the excellent technical help of Ayse Uneri and Janet Donahue. We also thank Wendy Boss, Aurora Toennisson, and Catherine Freed for helpful comments during manuscript preparation and John Jelesko for guidance and help with statistical analysis.

Conflicts of Interest

The authors declare no conflict of interest.

References

  1. Herrera-Estrella, L.; López-Arredondo, D. Phosphorus: The underrated element for feeding the world. Trends Plant Sci. 2016, 21, 461–463. [Google Scholar] [CrossRef]
  2. Pretty, J.; Bharucha, Z.P. Sustainable intensification in agricultural systems. Ann. Bot. 2014, 114, 1571–1596. [Google Scholar] [CrossRef] [PubMed]
  3. Péret, B.; Clément, M.; Nussaume, L.; Desnos, T. Root developmental adaptation to phosphate starvation: Better safe than sorry. Trends Plant Sci. 2011, 16, 442–450. [Google Scholar] [CrossRef] [PubMed]
  4. Bouain, N.; Doumas, P.; Rouached, H. The Root System Response to Phosphate Deficiency in Arabidopsis. Curr. Genom. 2016, 17, 308–314. [Google Scholar] [CrossRef] [Green Version]
  5. Péret, B.; Desnos, T.; Jost, R.; Kanno, S.; Berkowitz, O.; Nussaume, L. Root architecture responses: In search of phosphate. Plant Physiol. 2014, 166, 1713–1723. [Google Scholar] [CrossRef] [Green Version]
  6. Chiou, T.-J.; Lin, S.-I. Signaling network in sensing phosphate availability in plants. Annu. Rev. Plant Biol. 2011, 62, 185–206. [Google Scholar] [CrossRef] [Green Version]
  7. Chien, P.S.; Chiang, C.P.; Leong, S.J.; Chiou, T.J. Sensing and signaling of phosphate starvation: From local to long distance. Plant Cell Physiol. 2018, 59, 1714–1722. [Google Scholar] [CrossRef] [PubMed]
  8. Hammond, J.P.; White, P.J. Sugar signaling in root responses to low phosphorus availability. Plant Physiol. 2011, 156, 1033–1040. [Google Scholar] [CrossRef] [Green Version]
  9. Bari, R.; Pant, B.D.; Stitt, M.; Golm, S.P. PHO2, microRNA399, and PHR1 define a phosphate-signaling pathway in plants. Plant Physiol. 2006, 141, 988–999. [Google Scholar] [CrossRef] [Green Version]
  10. Rubio, V.; Bustos, R.; Irigoyen, M.L.; Cardona-López, X.; Rojas-Triana, M.; Paz-Ares, J. Plant hormones and nutrient signaling. Plant Mol. Biol. 2009, 69, 361–373. [Google Scholar] [CrossRef] [PubMed]
  11. Nakamura, Y. Phosphate starvation and membrane lipid remodeling in seed plants. Prog. Lipid Res. 2013, 52, 43–50. [Google Scholar] [CrossRef]
  12. Cruz-Ramírez, A.; Oropeza-Aburto, A.; Razo-Hernández, F.; Ramírez-Chávez, E.; Herrera-Estrella, L. Phospholipase DZ2 plays an important role in extraplastidic galactolipid biosynthesis and phosphate recycling in Arabidopsis roots. Proc. Natl. Acad. Sci. USA 2006, 103, 6765–6770. [Google Scholar] [CrossRef] [Green Version]
  13. Dörmann, P.; Benning, C. Galactolipids rule in seed plants. Trends Plant Sci. 2002, 7, 112–118. [Google Scholar] [CrossRef]
  14. Kalisch, B.; Dörmann, P.; Hölzl, G. Lipids in Plant and Algae Development; Springer: Cham, Switzerland, 2016; Volume 86. [Google Scholar] [CrossRef]
  15. Moellering, E.R.; Benning, C. Galactoglycerolipid metabolism under stress: A time for remodeling. Trends Plant Sci. 2011, 16, 98–107. [Google Scholar] [CrossRef] [PubMed]
  16. Essigmann, B.; Güler, S.; Narang, R.A.; Linke, D.; Benning, C. Phosphate availability affects the thylakoid lipid composition and the expression of SQD1 a gene required for sulfolipid biosynthesis in Arabidopsis thaliana. Proc. Natl. Acad. Sci. USA 1998, 95, 1950–1955. [Google Scholar] [CrossRef] [Green Version]
  17. Andersson, M.X.; Stridh, M.H.; Larsson, K.E.; Liljenberg, C.; Sandelius, A.S. Phosphate-deficient oat replaces a major portion of the plasma membrane phospholipids with the galactolipid digalactosyldiacylglycerol. FEBS Lett. 2003, 537, 128–132. [Google Scholar] [CrossRef] [Green Version]
  18. Shimojima, M. Biosynthesis and functions of the plant sulfolipid. Prog. Lipid Res. 2011, 50, 234–239. [Google Scholar] [CrossRef] [PubMed]
  19. Pant, B.D.; Burgos, A.; Pant, P.; Cuadros-Inostroza, A.; Willmitzer, L.; Scheible, W.R. The transcription factor PHR1 regulates lipid remodeling and triacylglycerol accumulation in Arabidopsis thaliana during phosphorus starvation. J. Exp. Bot. 2015, 66, 1907–1918. [Google Scholar] [CrossRef] [Green Version]
  20. Rubio, V.; Linhares, F.; Solano, R.; Martin, A.C.; Iglesias, J.; Leyva, A.; Paz-Ares, J. A conserved MYB transcription factor involved in phosphate starvation signaling both in vascular plants and in unicellular algae. Genes Dev. 2001, 15, 2122–2133. [Google Scholar] [CrossRef] [Green Version]
  21. Bustos, R.; Castrillo, G.; Linhares, F.; Puga, M.I.; Rubio, V.; Pérez-Pérez, J.; Solano, R.; Leyva, A.; Paz-Ares, J. A central regulatory system largely controls transcriptional activation and repression responses to phosphate starvation in Arabidopsis. PLoS Genet. 2010, 6, e1001102. [Google Scholar] [CrossRef] [Green Version]
  22. Puga, M.I.; Mateos, I.; Charukesi, R.; Wang, Z.; Franco-Zorrilla, J.M.; De Lorenzo, L.; Irigoyen, M.L.; Masiero, S.; Bustos, R.; Rodríguez, J.; et al. SPX1 is a phosphate-dependent inhibitor of Phosphate Starvation Response 1 in Arabidopsis. Proc. Natl. Acad. Sci. USA 2014, 111, 14947–14952. [Google Scholar] [CrossRef] [Green Version]
  23. Wild, R.; Gerasimaite, R.; Jung, J.Y.; Truffault, V.; Pavlovic, I.; Schmidt, A.; Saiardi, A.; Jacob Jessen, H.; Poirier, Y.; Hothorn, M.; et al. Control of eukaryotic phosphate homeostasis by inositol polyphosphate sensor domains. Science 2016, 352, 986–990. [Google Scholar] [CrossRef] [Green Version]
  24. Azevedo, C.; Saiardi, A. Eukaryotic phosphate homeostasis: The inositol pyrophosphate perspective. Trends Biochem. Sci. 2017, 42, 219–231. [Google Scholar] [CrossRef] [PubMed]
  25. Jung, J.Y.; Ried, M.K.; Hothorn, M.; Poirier, Y. Control of plant phosphate homeostasis by inositol pyrophosphates and the SPX domain. Curr. Opin. Biotechnol. 2018, 49, 156–162. [Google Scholar] [CrossRef] [Green Version]
  26. Raboy, V. The ABCs of low-phytate crops. Nat. Biotechnol. 2007, 25, 874–875. [Google Scholar] [CrossRef] [PubMed]
  27. Adepoju, O.; Williams, S.P.; Craige, B.; Cridland, C.A.; Sharpe, A.K.; Brown, A.M.; Land, E.; Perera, I.Y.; Mena, D.; Sobrado, P.; et al. Inositol trisphosphate kinase and diphosphoinositol pentakisphosphate kinase enzymes constitute the inositol pyrophosphate synthesis pathway in plants. arXiv 2019, arXiv:10.1101/724914, 724914. [Google Scholar]
  28. Laha, D.; Parvin, N.; Hofer, A.; Giehl, R.F.H.; Fernandez-Rebollo, N.; Von Wirén, N.; Saiardi, A.; Jessen, H.J.; Schaaf, G. Arabidopsis ITPK1 and ITPK2 Have an Evolutionarily Conserved Phytic Acid Kinase Activity. ACS Chem. Biol. 2019, 14, 2127–2133. [Google Scholar] [CrossRef] [Green Version]
  29. Desai, M.; Rangarajan, P.; Donahue, J.L.; Williams, S.P.; Land, E.S.; Mandal, M.K.; Phillippy, B.Q.; Perera, I.Y.; Raboy, V.; Gillaspy, G.E. Two inositol hexakisphosphate kinases drive inositol pyrophosphate synthesis in plants. Plant J. 2014, 80, 642–653. [Google Scholar] [CrossRef]
  30. Laha, D.; Johnen, P.; Azevedo, C.; Dynowski, M.; Weiß, M.; Capolicchio, S.; Mao, H.; Iven, T.; Steenbergen, M.; Freyer, M.; et al. VIH2 regulates the synthesis of inositol pyrophosphate InsP8 and jasmonate-dependent defenses in arabidopsis. Plant Cell 2015, 27, 1082–1097. [Google Scholar] [CrossRef] [PubMed] [Green Version]
  31. Zhu, J.; Lau, K.; Puschmann, R.; Harmel, R.K.; Zhang, Y.; Pries, V.; Gaugler, P.; Broger, L.; Dutta, A.K.; Jessen, H.J.; et al. Two bifunctional inositol pyrophosphate kinases/phosphatases control plant phosphate homeostasis. Elife 2019, 8, 1–25. [Google Scholar] [CrossRef]
  32. Stevenson-Paulik, J.; Bastidas, R.J.; Chiou, S.-T.T.; Frye, R.A.; York, J.D. Generation of phytate-free seeds in Arabidopsis through disruption of inositol polyphosphate kinases. Proc. Natl. Acad. Sci. USA 2005, 102, 12612–12617. [Google Scholar] [CrossRef] [Green Version]
  33. Kuo, H.F.; Chang, T.Y.; Chiang, S.F.; Wang, W.D.; Charng, Y.Y.; Chiou, T.J. Arabidopsis inositol pentakisphosphate 2-kinase, AtIPK1, is required for growth and modulates phosphate homeostasis at the transcriptional level. Plant J. 2014, 80, 503–515. [Google Scholar] [CrossRef] [PubMed]
  34. Kuo, H.F.; Hsu, Y.Y.; Lin, W.C.; Chen, K.Y.; Munnik, T.; Brearley, C.A.; Chiou, T.J. Arabidopsis inositol phosphate kinases IPK1 and ITPK1 constitute a metabolic pathway in maintaining phosphate homeostasis. Plant J. 2018, 95, 613–630. [Google Scholar] [CrossRef] [Green Version]
  35. Shears, S.B.; Baughman, B.M.; Gu, C.; Nair, V.S.; Wang, H. The significance of the 1-kinase/1-phosphatase activities of the PPIP5K family. Adv. Biol. Regul. 2017, 63, 98–106. [Google Scholar] [CrossRef] [PubMed]
  36. Gu, C.; Nguyen, H.-N.; Hofer, A.; Jessen, H.J.; Dai, X.; Wang, H.; Shears, S.B. The Significance of the bifunctional kinase/phosphatase activities of diphosphoinositol pentakisphosphate kinases (PPIP5Ks) for coupling inositol pyrophosphate cell signaling to cellular phosphate homeostasis. J. Biol. Chem. 2017, 292, 4544–4555. [Google Scholar] [CrossRef] [PubMed] [Green Version]
  37. Dong, J.; Ma, G.; Sui, L.; Wei, M.; Satheesh, V.; Zhang, R.; Ge, S.; Li, J.; Zhang, T.E.; Wittwer, C.; et al. Inositol pyrophosphate insp8 acts as an intracellular phosphate signal in Arabidopsis. Mol. Plant 2019, 12, 1463–1473. [Google Scholar] [CrossRef]
  38. Ried, M.K.; Wild, R.; Zhu, J.; Pipercevic, J.; Sturm, K.; Broger, L.; Harmel, R.K.; Abriata, L.A.; Hothorn, L.A.; Fiedler, D.; et al. Inositol pyrophosphates promote the interaction of SPX domains with the coiled-coil motif of PHR transcription factors to regulate plant phosphate homeostasis. Nat. Commun. 2021, 12, 384. [Google Scholar] [CrossRef] [PubMed]
  39. Crombez, H.; Motte, H.; Beeckman, T. Tackling plant phosphate starvation by the roots. Dev. Cell 2019, 48, 599–615. [Google Scholar] [CrossRef] [PubMed] [Green Version]
  40. Teng, S.; Keurentjes, J.; Bentsink, L.; Koornneef, M.; Smeekens, S. Sucrose-Specific induction of anthocyanin biosynthesis in Arabidopsis requires the MYB75/PAP1 gene. Plant Physiol. 2005, 139, 1840–1852. [Google Scholar] [CrossRef] [Green Version]
  41. He, Y.; Zhang, X.; Li, L.; Sun, Z.; Li, J.; Chen, X.; Hong, G. SPX4 interacts with both PHR1 and PAP1 to regulate critical steps in phosphorus-status-dependent anthocyanin biosynthesis. New Phytol. 2021, 230, 205–217. [Google Scholar] [CrossRef]
  42. Cheng, Y.; Zhou, W.; El Sheery, N.I.; Peters, C.; Li, M.; Wang, X.; Huang, J. Characterization of the Arabidopsis glycerophosphodiester phosphodiesterase (GDPD) family reveals a role of the plastid-localized AtGDPD1 in maintaining cellular phosphate homeostasis under phosphate starvation. Plant J. 2011, 66, 781–795. [Google Scholar] [CrossRef]
  43. Nagarajan, V.K.; Jain, A.; Poling, M.D.; Lewis, A.J.; Raghothama, K.G.; Smith, A.P. Arabidopsis Pht1;5 mobilizes phosphate between source and sink organs and influences the interaction between phosphate homeostasis and ethylene signaling. Plant Physiol. 2011, 156, 1149–1163. [Google Scholar] [CrossRef] [Green Version]
  44. Acevedo-Hernández, G.; Oropeza-Aburto, A.; Herrera-Estrella, L. A specific variant of the PHR1 binding site is highly enriched in the Arabidopsis phosphate-responsive phospholipase DZ2 coexpression network. Plant Signal. Behav. 2012, 7, 914–917. [Google Scholar] [CrossRef] [PubMed] [Green Version]
  45. Hickman, R.; Van Verk, M.C.; Van Dijken, A.J.H.; Mendes, M.P.; Vroegop-Vos, I.A.; Caarls, L.; Steenbergen, M.; Van der Nagel, I.; Wesselink, G.J.; Jironkin, A.; et al. Architecture and dynamics of the jasmonic acid gene regulatory network. Plant Cell 2017, 29, 2086–2105. [Google Scholar] [CrossRef] [Green Version]
  46. Zander, M.; Lewsey, M.G.; Clark, N.M.; Yin, L.; Bartlett, A.; Saldierna Guzmán, J.P.; Hann, E.; Langford, A.E.; Jow, B.; Wise, A.; et al. Integrated multi-omics framework of the plant response to jasmonic acid. Nat. Plants 2020, 6, 290–302. [Google Scholar] [CrossRef] [PubMed]
  47. Kazan, K.; Manners, J.M. MYC2: The master in action. Mol. Plant 2013, 6, 686–703. [Google Scholar] [CrossRef] [Green Version]
  48. Zhu, Z. Molecular basis for jasmonate and ethylene signal interactions in Arabidopsis. J. Exp. Bot. 2014, 65, 5743–5748. [Google Scholar] [CrossRef] [PubMed]
  49. Shikanai, T. Chloroplast NDH: A different enzyme with a structure similar to that of respiratory NADH dehydrogenase. Biochim. Biophys. Acta Bioenerg. 2016, 1857, 1015–1022. [Google Scholar] [CrossRef]
  50. Couso, I.; Evans, B.S.; Li, J.; Liu, Y.; Ma, F.; Diamond, S.; Allen, D.K.; Umen, J.G. Synergism between inositol polyphosphates and TOR kinase signaling in nutrient sensing, growth control, and lipid metabolism in chlamydomonas. Plant Cell 2016, 28, 2026–2042. [Google Scholar] [CrossRef] [PubMed] [Green Version]
  51. Kleinboelting, N.; Huep, G.; Kloetgen, A.; Viehoever, P.; Weisshaar, B. GABI-Kat SimpleSearch: New features of the Arabidopsis thaliana T-DNA mutant database. Nucleic Acids Res. 2012, 40, D1211–D1215. [Google Scholar] [CrossRef] [Green Version]
  52. Alonso, J.M.; Stepanova, A.N.; Leisse, T.J.; Kim, C.J.; Chen, H.; Shinn, P.; Stevenson, D.K.; Zimmerman, J.; Barajas, P.; Cheuk, R.; et al. Genome-Wide insertional mutagenesis Arabidopsis thaliana. Science 2003, 301, 5633. [Google Scholar] [CrossRef] [Green Version]
  53. Sessions, A.; Burke, E.; Presting, G.; Aux, G.; McElver, J.; Patton, D.; Dietrich, B.; Ho, P.; Bacwaden, J.; Ko, C.; et al. A high-throughput Arabidopsis reverse genetics system. Plant Cell 2002, 14, 2985–2994. [Google Scholar] [CrossRef]
  54. Ames, B.N. Assay of inorganic phosphate, total phosphate and phosphatases. Methods Enzymol. 1966, 8, 115–118. [Google Scholar] [CrossRef]
  55. He, X.; Li, Y.; Lawson, D.; Xie, D.Y. Metabolic engineering of anthocyanins in dark tobacco varieties. Physiol. Plant. 2017, 159, 2–12. [Google Scholar] [CrossRef] [PubMed]
  56. Livak, K.J.; Schmittgen, T.D. Analysis of relative gene expression data using real-time quantitative PCR and the 2−ΔΔCT method. Methods 2001, 25, 402–408. [Google Scholar] [CrossRef] [PubMed]
  57. Azevedo, C.; Saiardi, A. Extraction and analysis of soluble inositol polyphosphates from yeast. Nat. Protoc. 2006, 1, 2416–2422. [Google Scholar] [CrossRef] [PubMed]
  58. Shiva, S.; Enninful, R.; Roth, M.R.; Tamura, P.; Jagadish, K.; Welti, R. An efficient modified method for plant leaf lipid extraction results in improved recovery of phosphatidic acid. Plant Methods 2018, 14, 14. [Google Scholar] [CrossRef] [PubMed] [Green Version]
  59. Chong, J.; Soufan, O.; Li, C.; Caraus, I.; Li, S.; Bourque, G.; Wishart, D.S.; Xia, J. MetaboAnalyst 4.0: Towards more transparent and integrative metabolomics analysis. Nucleic Acids Res. 2018, 46, W486–W494. [Google Scholar] [CrossRef] [Green Version]
  60. The LIPID MAPS®. Lipidomics Gateway. Available online: https://www.lipidmaps.org/ (accessed on 1 May 2021).
  61. Fahy, E.; Sud, M.; Cotter, D.; Subramaniam, S. LIPID MAPS online tools for lipid research. Nucleic Acids Res. 2007, 35, 606–612. [Google Scholar] [CrossRef] [Green Version]
  62. Castro-Perez, J.M.; Kamphorst, J.; Degroot, J.; Lafeber, F.; Goshawk, J.; Yu, K.; Shockcor, J.P.; Vreeken, R.J.; Hankemeier, T. Comprehensive LC-MSE lipidomic analysis using a shotgun approach and its application to biomarker detection and identification in osteoarthritis patients. J. Proteome Res. 2010, 9, 2377–2389. [Google Scholar] [CrossRef]
  63. Vu, H.S.; Tamura, P.; Galeva, N.A.; Chaturvedi, R.; Roth, M.R.; Williams, T.D.; Wang, X.; Shah, J.; Welti, R. Direct infusion mass spectrometry of oxylipin-containing Arabidopsis membrane lipids reveals varied patterns in different stress responses. Plant Physiol. 2012, 158, 324–339. [Google Scholar] [CrossRef] [PubMed]
Figure 1. Double vip mutant generation and morphometric analysis. (a) Gene structure of Arabidopsis AtVIP1 (AT3G01310) and AtVIP2 (AT5G15070). Exon coding regions are indicated in blue, untranslated regions are indicated in orange, and introns are indicated in gray. The position of the T-DNA insertions are indicated by the red arrows. Three independent homozygous double mutants (vip1-1/vip2-1, vip1-1/vip2-2, vip1-2/vip2-2) were generated by crossing. (b) AtVIP1 and AtVIP2 transcriptional abundances in 14-day-old seedlings relative to WT. Samples were assayed in triplicate by qRT-PCR using gene-specific primers and PP2A as an endogenous control. Error bars denote SD. (c) WT and vip double mutant seedlings were grown on 0.5× MS media for 10 days (scale bars indicate 0.5 cm). (d) Young seedlings were transplanted to soil and grown under short day conditions (8 h light) and rosette area was measured after 28 days (scale bars indicate 1 cm). (e) Primary root lengths. Data presented are the average ± SD of two independent experiments (n = 50/experiment). Different letters indicate statistically significant means (Tukey HSD, α = 0.05). (f) Rosette areas. Data presented are the average ± SD of a representative experiment (n = 12). Different letters indicate statistically significant means (Tukey HSD, α = 0.05).
Metabolites 11 00601 g001
Figure 2. Genes downregulated in shoot tissue of vip double mutants. Venn diagram shows overlap between genes downregulated in all three vip mutants compared to WT. A conserved subset of 20 genes were identified as being downregulated in all the vip double mutants.
Metabolites 11 00601 g002
Figure 3. Inorganic phosphate content was quantified in 18-day-old seedlings and in 49-day-old mature leaves of WT, vip double mutants, and ipk1. Data presented are the average ± SD of three independent bioreplicate experiments. Different letters indicate statistically significant means (Tukey HSD, α = 0.05).
Metabolites 11 00601 g003
Figure 4. Root system architecture (RSA) responses in vip mutants. (a) Close-up images of 14-day-old WT and vip1-2/vip2-2 primary roots from seedlings grown on phosphate-replete (+Pi) and phosphate-limiting (−Pi) MS media (scale bars indicate 250 µm). (b) Root hair length of seedlings grown on phosphate-limiting media. Data presented are the average ± SD of two replicate experiments, (n = 400–500 observations). (c) Lateral root count of seedlings grown on phosphate-limiting media. Data presented are the average ± SD of three bioreplicate experiments (n = 30 observations/bioreplicate). Different letters indicate statistically significant means (Tukey HSD, α = 0.05).
Metabolites 11 00601 g004
Figure 5. Shoot transcriptional responses to limiting Pi conditions. (a) Anthocyanin accumulation in 18-day-old WT and vip double mutant seedlings grown on phosphate-limiting media. Data presented are the average ± SD of two bioreplicate experiments assayed in technical duplicate. Different letters indicate statistically significant means (Tukey HSD, α = 0.05). (b) The transcriptional abundance of select PSR genes was queried relative to WT by qRT-PCR using gene-specific primers and PEX4 (which is not transcriptionally responsive to low Pi) as an endogenous control. Data shown are from a representative bioreplicate. Error bars indicate standard deviation.
Metabolites 11 00601 g005
Figure 6. Inositol phosphate profiles. Fourteen-day-old WT, vip1-2/vip2-2 and ipk1 seedlings were radiolabeled with 3H-myo-inositol for 5 days and InsP species were separated by HPLC and quantified by liquid scintillation counting. (ad) Normalized CPM elution profiles comparing WT to ipk1 (a,b) and vip1-2/vip2-2 (c,d). (eg) Normalized CPM from fractions comprising InsP6 (e), InsP7 (f), and InsP8 (g). Mean values of three replicate experiments are shown (n = 3) and error bars represent standard deviation. Significance of differences relative to WT were calculated by two tailed Student’s t-test.
Metabolites 11 00601 g006
Figure 7. Composition of major phospholipid and galactolipids under Pi-replete and limiting conditions. Lipids were extracted and analyzed from wild type (WT), vip1-2/2-2, and ipk1 in 18-day-old shoot tissue grown on 1 mM Pi (+Pi) and 10 µM Pi (−Pi) agar media. Individual lipid species are indicated by stacked bars. (a) Relative peak area of phosphatidylcholine (PC). (b) Relative peak area of phosphatidylglycerol (PG). (c) Relative peak area of digalactosyldiacylglycerol (DGDG). (d) Relative peak area of sulfoquinovosyldiacylglycerol (SQDG). (e) Relative peak area of triacylglycerol (TAG). Values are cube root-transformed relative peak area units and means of six biological replicate experiments assayed in technical triplicate. Letters (ae) indicate statistical groups according to post hoc Tukey HSD test (α = 0.05).
Metabolites 11 00601 g007
Table 1. Description of conserved downregulated genes in vip double mutants. Many of these genes were found to be associated with phosphate starvation responses. Promoter motif analysis found one or more PHR1-binding sequences (P1BS, GnATATnC) to be present in the 1kB putative promoter region upstream of 14 of these genes.
Locus IDGene Description (Symbol)−1 kb P1BS
AT1G17710Phosphoethanolamine/Phosphocholine Phosphatase 1 (PEPC1)2
AT1G23110Fold Protein1
AT1G58280Phosphoglycerate Mutase Family Protein1
AT1G73010Phosphate Starvation-induced Gene 2 (PS2)2
AT2G11810Monogalactosyldiacylglycerol Synthase Type C (MGDC)0
AT2G46880Purple Acid Phosphatase 14 (PAP14)2
AT3G01345Expressed Protein0
AT3G02040Glycerophosphodiester Phosphodiesterase 1 (GDPD1)4
AT3G05630Phospholipase D Zeta 2 (PLDZ2)4
AT3G09922Induced By Phosphate Starvation1 (IPS1)2
AT3G17790Purple Acid Phosphatase 17 (PAP17)0
AT3G30122Pseudogene1
AT3G43110Transmembrane Protein1
AT4G33030Sulfoquinovosyldiacylglycerol 1 (SQD1)0
AT5G03545Induced By Pi Starvation 2 (ATIPS2, AT4)2
AT5G15070Arabidopsis Homolog Of Yeast Vip1 2 (ATVIP2)0
AT5G20150Spx Domain Gene 1 (SPX1)1
AT5G20410Monogalactosyldiacylglycerol Synthase 2 (MGD2)2
AT5G20790Transmembrane Protein0
AT5G53048Natural Antisense Transcripts1
Publisher’s Note: MDPI stays neutral with regard to jurisdictional claims in published maps and institutional affiliations.

