Article

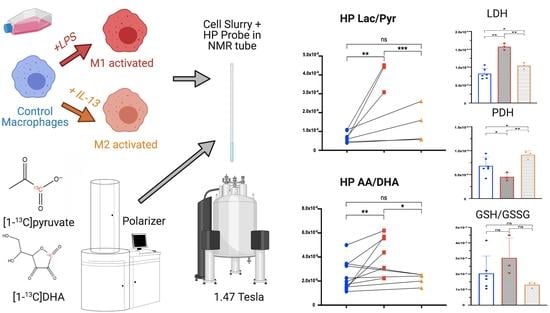
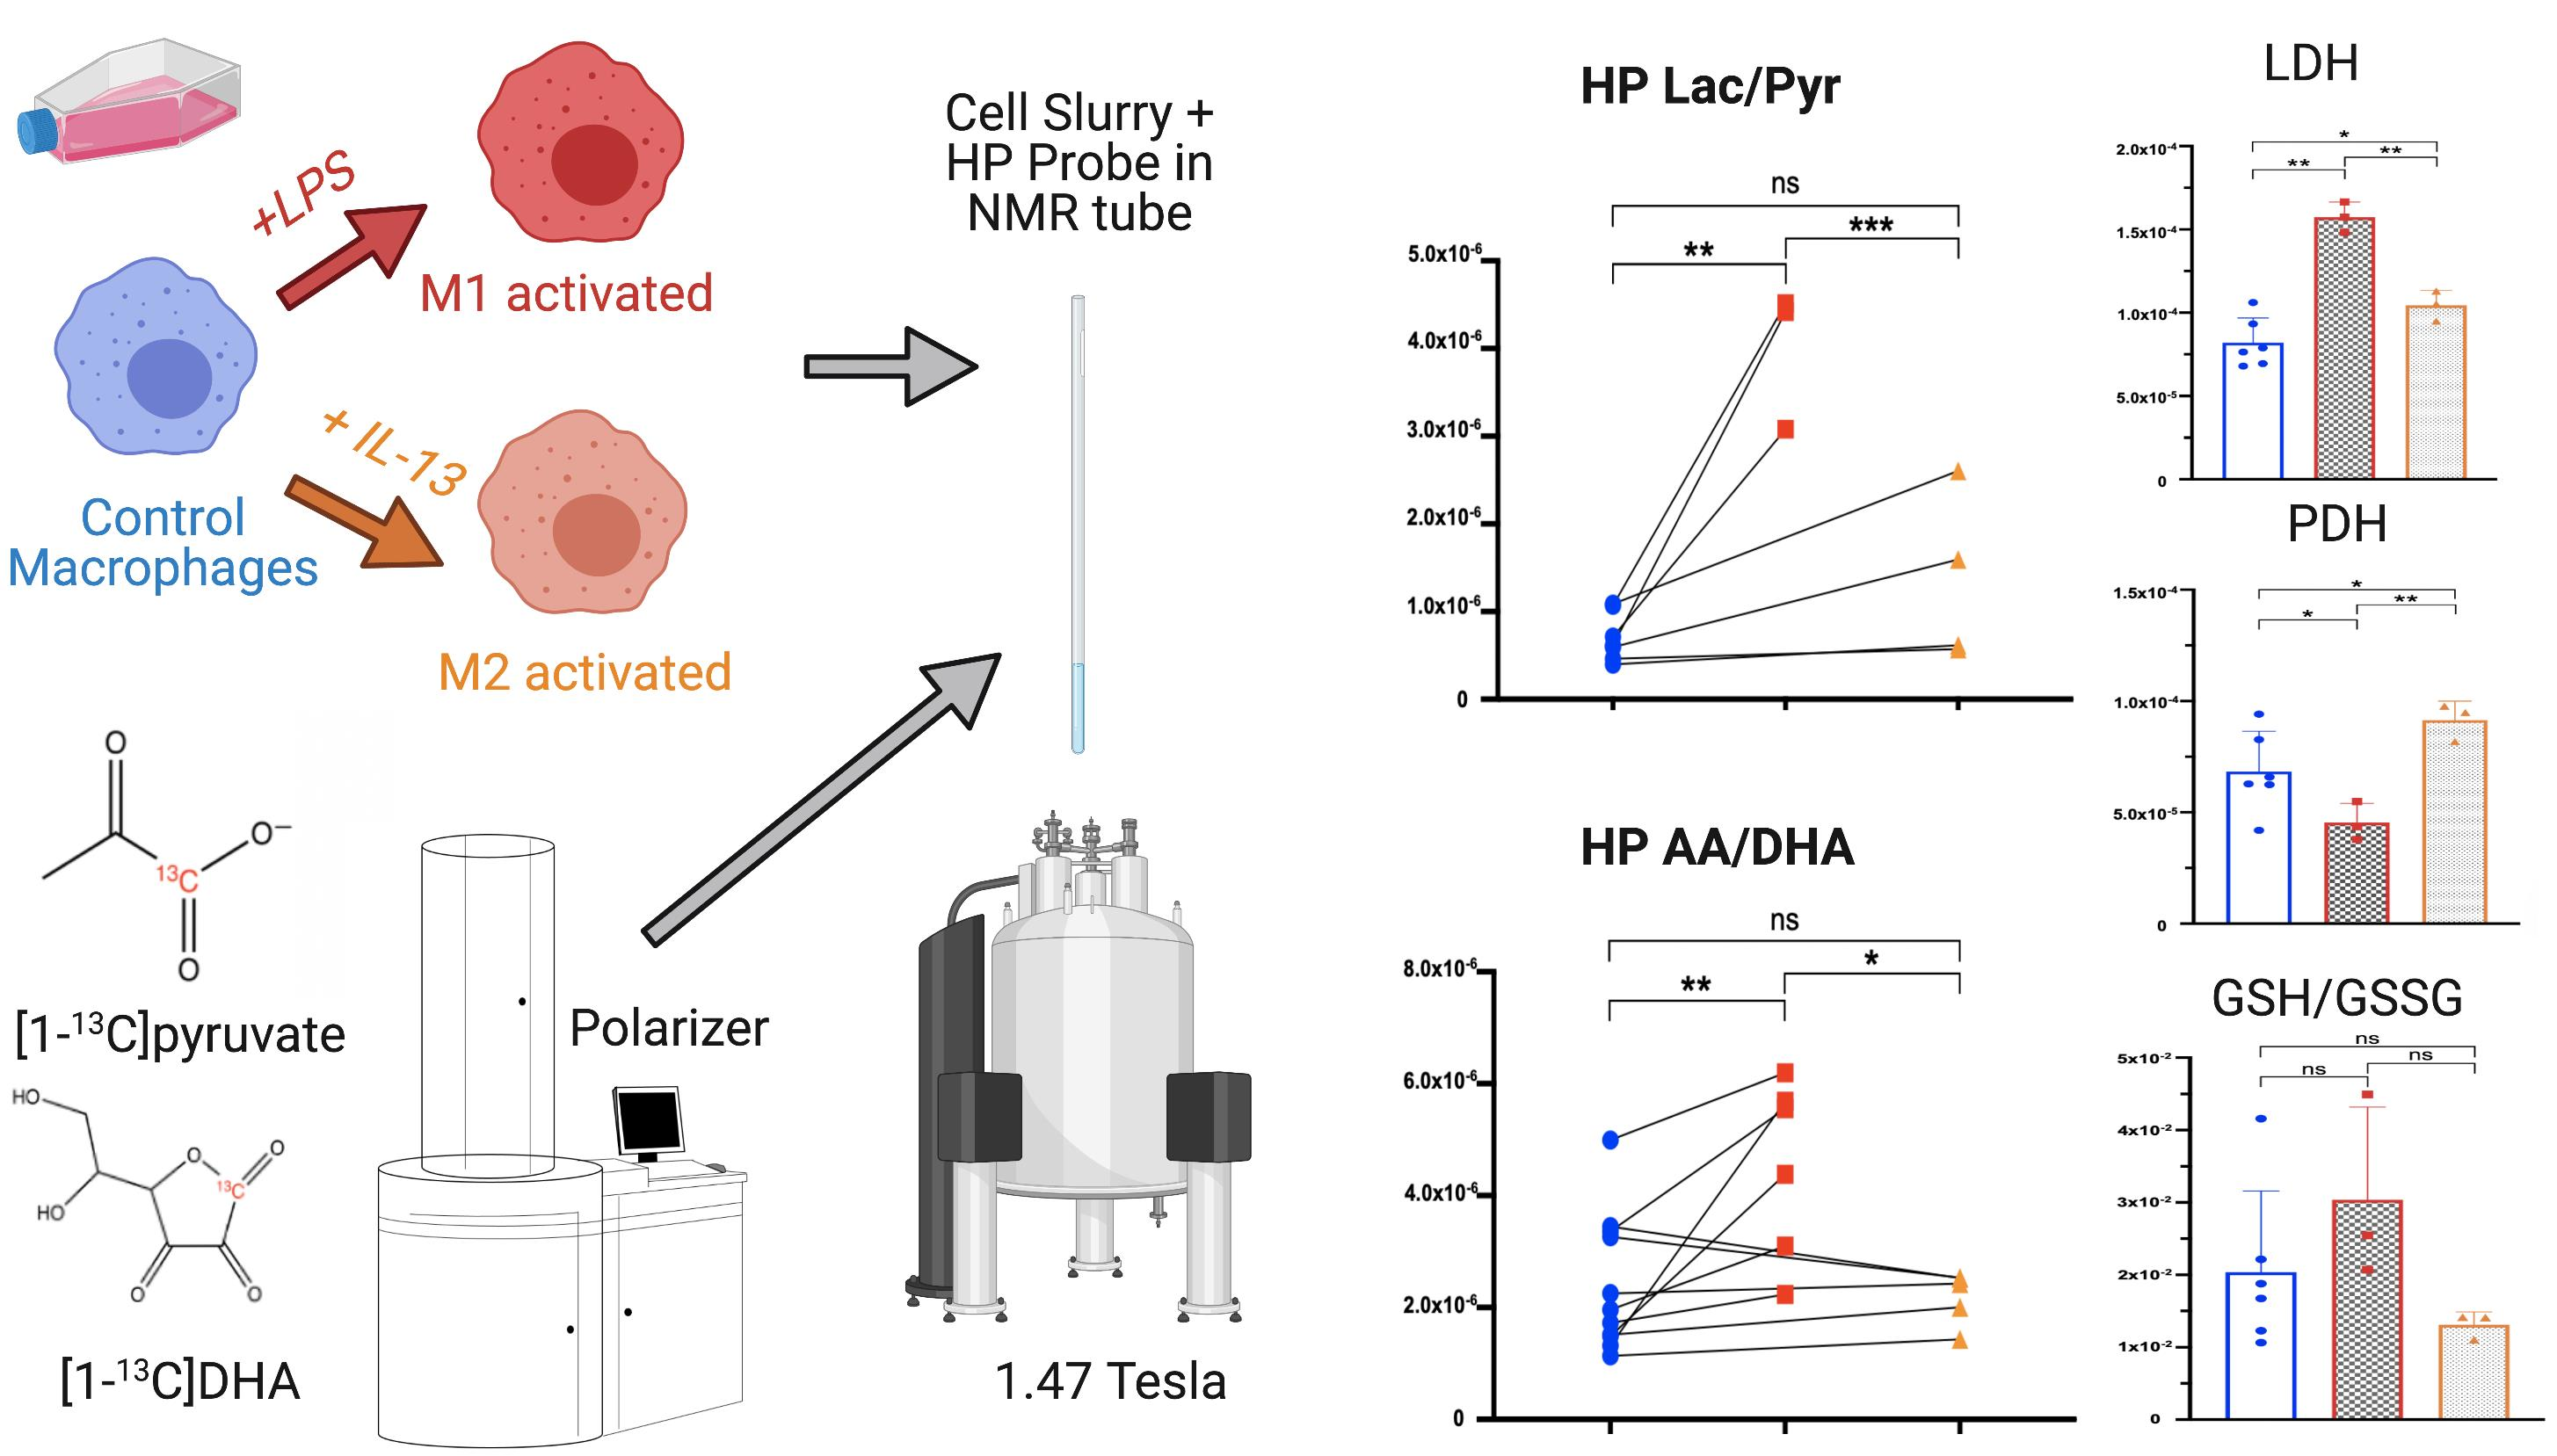
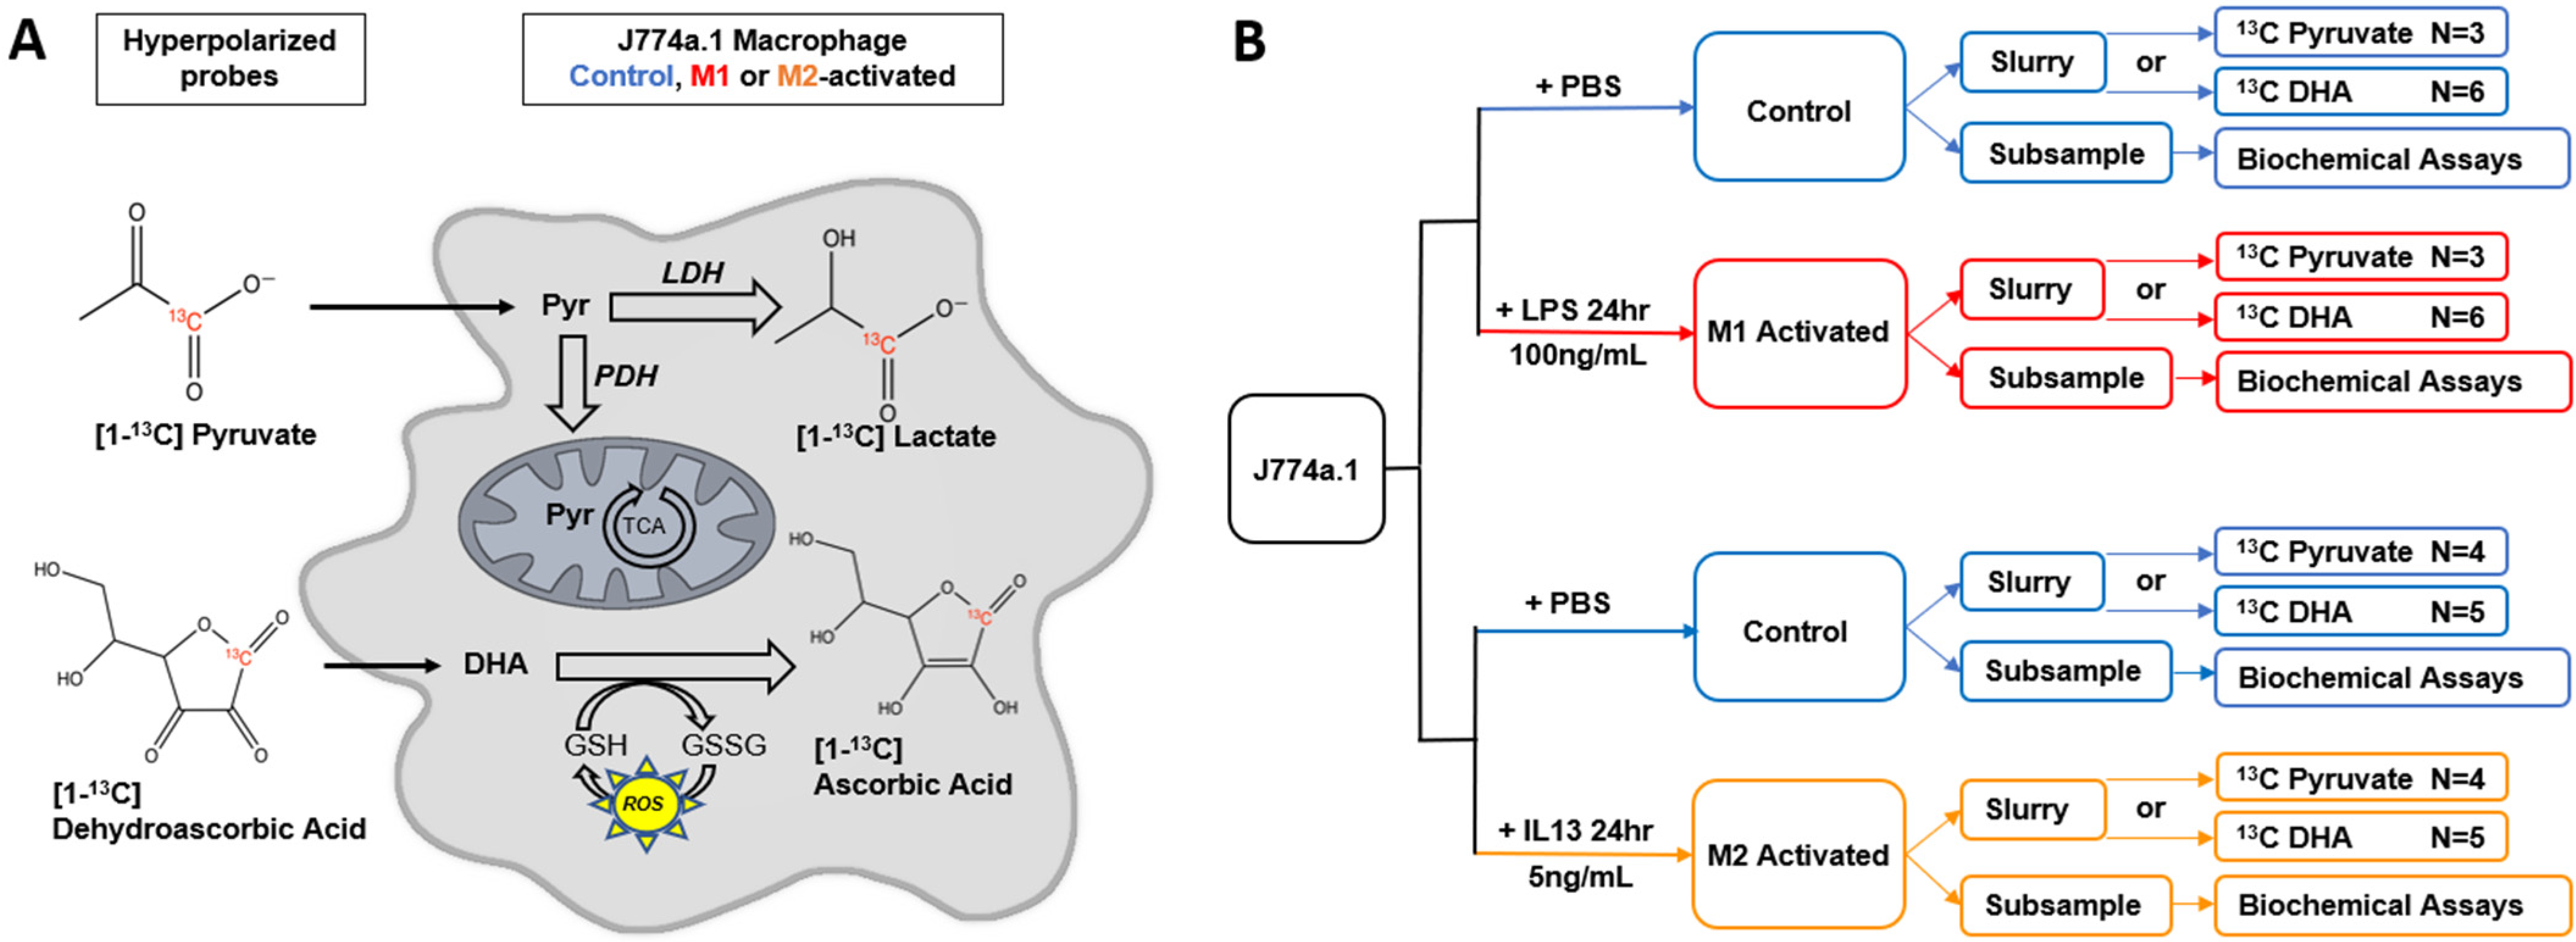
Non-Invasive Differentiation of M1 and M2 Activation in Macrophages Using Hyperpolarized 13C MRS of Pyruvate and DHA at 1.47 Tesla

1
Department of Physical Therapy and Rehabilitation Science, University of California, San Francisco, CA 94143, USA
2
Department of Radiology and Biomedical Imaging, University of California, San Francisco, CA 94143, USA
*
Author to whom correspondence should be addressed.
Metabolites 2021, 11(7), 410; https://doi.org/10.3390/metabo11070410
Submission received: 22 April 2021 / Revised: 16 June 2021 / Accepted: 17 June 2021 / Published: 22 June 2021

Abstract

:
Macrophage activation, first generalized to the M1/M2 dichotomy, is a complex and central process of the innate immune response. Simply, M1 describes the classical proinflammatory activation, leading to tissue damage, and M2 the alternative activation promoting tissue repair. Given the central role of macrophages in multiple diseases, the ability to noninvasively differentiate between M1 and M2 activation states would be highly valuable for monitoring disease progression and therapeutic responses. Since M1/M2 activation patterns are associated with differential metabolic reprogramming, we hypothesized that hyperpolarized 13C magnetic resonance spectroscopy (HP 13C MRS), an innovative metabolic imaging approach, could distinguish between macrophage activation states noninvasively. The metabolic conversions of HP [1-13C]pyruvate to HP [1-13C]lactate, and HP [1-13C]dehydroascorbic acid to HP [1-13C]ascorbic acid were monitored in live M1 and M2 activated J774a.1 macrophages noninvasively by HP 13C MRS on a 1.47 Tesla NMR system. Our results show that both metabolic conversions were significantly increased in M1 macrophages compared to M2 and nonactivated cells. Biochemical assays and high resolution 1H MRS were also performed to investigate the underlying changes in enzymatic activities and metabolite levels linked to M1/M2 activation. Altogether, our results demonstrate the potential of HP 13C MRS for monitoring macrophage activation states noninvasively.

Graphical Abstract

1. Introduction

Nearly ubiquitous throughout the body, macrophages are a critical component in maintaining our health and wellbeing, playing a central role in the innate immune response, tissue homeostasis, and facilitation of crosstalk with neighboring cell types [1,2,3]. Macrophages have typically been described as having two activation states, which have each been observed to play significant roles in various pathologies, such as autoimmune disorders, obesity, and cancer malignancy [4,5,6]. Although there is still much to be understood, these activation states were first generalized to the M1 and M2 dichotomy [7], and are associated with cell-wide changes, including modulations of signaling pathways and reprogramming of cellular metabolism [8]. Briefly, M1 describes the classical proinflammatory activation response, leading to subsequent tissue damage, whereas M2 activation is associated with upregulation of anti-inflammatory pathways promoting tissue repair. From an energetic metabolism perspective, M1 macrophages have been shown to increase anaerobic glycolysis, while M2 use primarily aerobic oxidative phosphorylation for energy generation [9]. Reactive oxygen species (ROS) have also been reported to increase significantly in M1-activated macrophages, including in J774a.1 cells, and are often used as a marker of this activation state [10,11,12,13,14,15,16]. The activity of the arginase-1 enzyme isoform, meanwhile, has been shown to significantly increase specifically in M2-activated macrophages, serving as a robust marker of M2 activation [13,16,17,18,19,20,21].
Thus far, M1 and M2 differentiation has been largely determined using such markers by histological, biochemical, and genotypic studies conducted on samples collected invasively from the bloodstream or diseased tissues [22]. To date, no in vivo imaging method enables differentiation between M1 and M2 activation states. Given their broad and critical roles, such an approach could be very useful in improving our understanding of the role of macrophages in underlying diseases, and would also allow in vivo monitoring of responses to immunomodulatory treatments targeting macrophage activation in situ.
An investigative tool for assessment of in vivo metabolism exists in the form of 13C magnetic resonance spectroscopy (MRS) combined with dissolution dynamic nuclear polarization (dDNP) of 13C-labeled probes [23], so-called hyperpolarized (HP) 13C MRS. This technique has been used to noninvasively monitor metabolic impairment in multiple preclinical models, including cancer, neuroinflammation, and cardiomyopathy [24,25,26]. Importantly, the use of this technology is now expanding into the clinic, with ongoing clinical trials on patients with brain tumor, traumatic brain injury, and prostate cancer, among others [27,28,29]. Depending on the choice of 13C-labeled substrate, different metabolic pathways can be targeted and imaged noninvasively [30,31]. To date, two studies have used HP 13C MRS to look at activation states of macrophages. One study described the use of HP [6-13C]arginine to detect arginase activity in M2-like primary mouse myeloid-derived suppressor cells (MDSCs) [32]. The authors showed that metabolism of HP [6-13C]arginine to HP 13C urea was significantly increased in MDSCs compared to control bone marrow cells, in line with increased arginase activity linked to M2 activation. Two other studies on macrophage cells (J774a.1 [33] and RAW264.7 [34]) using HP [1-13C]pyruvate showed that, after M1 activation using the toxin lipopolysaccharides (LPS), the conversion of HP [1-13C]pyruvate into [1-13C]lactate, catalyzed by the lactate dehydrogenase (LDH) enzyme, was significantly increased compared to nontreated macrophages. This result was linked to, among other events, increased LDH activity and gene transcription [33]. Furthermore, blockade of glycolysis with 2-deoxyglucose in activated cells normalized lactate label flux rates and markedly inhibited the production of key proinflammatory cytokines [34]. However, to date, no study has directly compared M1 vs. M2 activation states in macrophages using HP 13C MRS, and no other HP 13C probe besides HP [1-13C]pyruvate has been tested in macrophage cell lines.
In this comprehensive study, we applied HP 13C MRS to paired M1 vs. control, and paired M2 vs. control macrophages. Two metabolic conversions were evaluated: (1) the conversion of HP [1-13C]pyruvate into HP [1-13C]lactate, and (2) the conversion of HP [1-13C]dehydroascorbic acid (DHA) into HP [1-13C]ascorbic acid (AA) (Figure 1). The first reaction is the final step of anaerobic glycolysis, while the second reaction is modulated by ROS levels. Both reactions have previously been successfully imaged in vivo [35,36]. In our study, we show that, for both probes, HP product-to-substrate ratios were observed to be significantly increased in M1 macrophages compared to M2, while control and M2 macrophages presented similar metabolic ratios. Underlying mechanisms were investigated, and spectrophotometric assays showed that changes in HP lactate-to-pyruvate ratios were associated with changes in LDH and pyruvate dehydrogenase (PDH) enzymatic activities, while changes in HP AA-to-DHA ratio paralleled changes in ROS levels.
Our study therefore shows that noninvasive differentiation of M1 vs. M2 activation in macrophages can be achieved using 13C MRS of HP [1-13C]pyruvate and DHA at the clinically relevant field strength of 1.47 Tesla. Upon translation to in vivo models, this method could prove useful to evaluate the immune response and monitor the effect of immunomodulatory treatments.

2. Results

2.1. M1 and M2 Activation of J774a.1 Macrophages

First, ROS and Arginase assays were performed to confirm differential M1 and M2 activation of J774a.1 macrophages, which was performed using previously established protocols ([33] for M1 and [37] for M2). Arginase enzyme activity was unchanged with M1 activation by LPS (p = 0.849), while a significant 57-fold increase in arginase activity was seen in M2 macrophages activated by interleukin-13 (IL-13) (p < 0.0001, N = 3, 38.255 U/L/105 cells in M2-activated vs. 0.669 U/L/105 cells for control), as previously reported [37] (Supplementary Figure S1A). On the other hand, M1-activated macrophages exhibited a 2.3-fold increase in ROS compared to control (p = 0.0009, N = 6), whereas no significant increase in ROS was detected in M2-activated macrophages (p = 0.7380, N = 3) (Supplementary Figure S1B). The ROS increase in M1-activated macrophages is in agreement with previous reports [38]. The Bradford assay showed no differences in total protein concentration per cell between groups (Supplementary Figure S1C).

2.2. HP [1-13C]lactate Production Is Differentially Increased by M1/M2 Macrophage Activation

The T1 of HP [1-13C]pyruvate was calculated to be 52 s at 1.47 Tesla. Upon injection of HP [1-13C]pyruvate into activated and control macrophages, HP [1-13C]lactate production could be detected at 183.3 ppm, with the HP [1-13C]pyruvate resonance visible at 171.1 ppm (Figure 2A). Figure 2B shows the mean HP [1-13C]lactate signal for control, M1-activated, and M2-activated datasets over the first 40 TRs normalized to cell number. The buildup of HP [1-13C]lactate can be observed, demonstrating in situ metabolism. Quantification of the total sum spectra yielded a non-normalized HP [1-13C]pyruvate SNR of 6.06 ± 1.76 × 10⁵, 5.33 ± 2.33 × 10⁵, and 5.89 ± 1.25 × 10⁵ for control, M1-activated, and M2-activated, respectively, while the SNR of HP [1-13C]lactate for control, M1, and M2 was 1.27 ± 0.68 × 10³, 2.28 ± 0.35 × 10³, and 2.44 ± 0.73 × 10³, respectively. When normalizing to cell number and volume, in comparison to control cells, HP lactate-to-pyruvate ratio was significantly increased by 467 ± 49% with M1 activation (p = 0.0010, 4.00 ± 0.27 × 10⁻⁶ for M1-activated cells vs. 7.06 ± 0.39 × 10⁻⁷ for control cells). In M2 macrophages, a 91 ± 36% increase was observed compared to controls, but it did not reach significance (p = 0.1866, 1.35 ± 0.24 × 10⁻⁶ for M2-activated cells) (Figure 2C). When comparing activation states, HP lactate-to-pyruvate ratio was significantly higher by 197 ± 57% in M1-activated cells as compared to M2-activated cells (p = 0.0008).

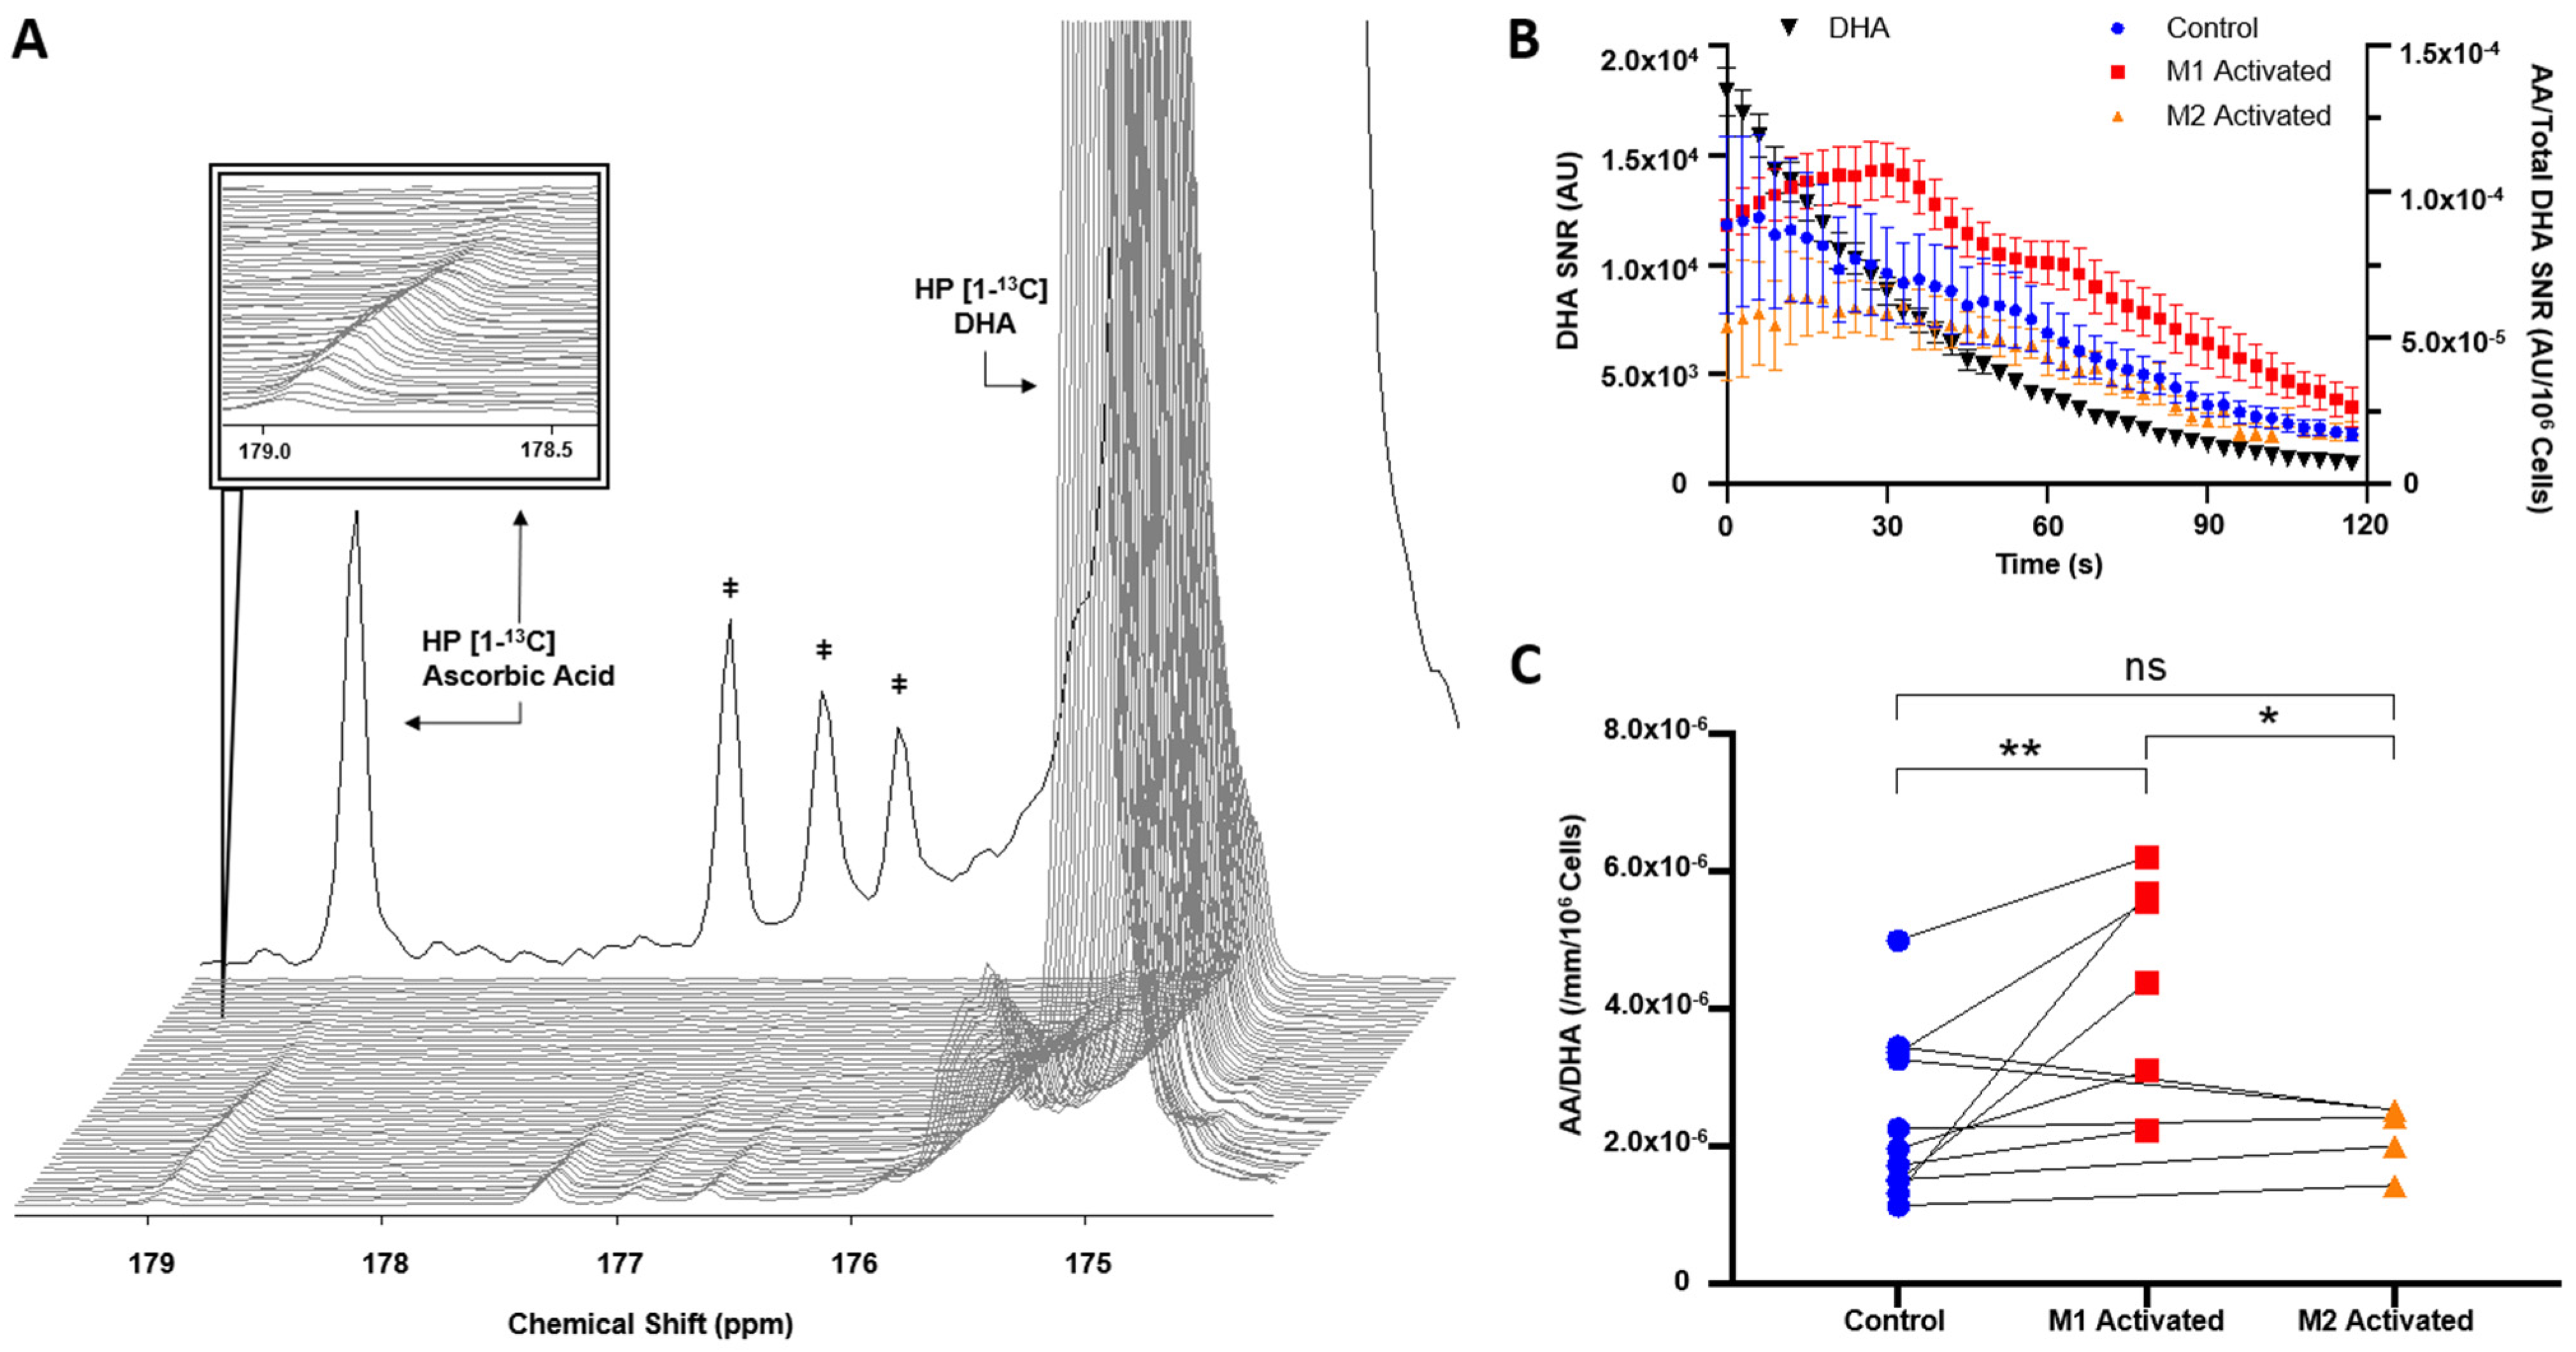
2.3. HP [1-13C]DHA Conversion to HP [1-13C]AA Is Increased with M1 Activation

The T1 of HP [1-13C]DHA was calculated to be 46 s at 1.47 Tesla. Following injection of HP [1-13C]DHA, HP [1-13C]AA production could be detected at 178.8 ppm in control and activated macrophages, while the resonance of the substrate HP [1-13C]DHA was detected at 175 ppm (Figure 3A). The time courses of HP [1-13C]DHA and HP [1-13C]AA are shown in Figure 3B for a control, an M1, and an M2-activated dataset. HP [1-13C]AA signal gradually builds up as the signal from HP [1-13C]DHA decays, denoting in situ conversion. Quantification of the total sum spectra yielded a non-normalized HP [1-13C]DHA SNR of 2.23 ± 0.77 × 10⁴, 3.16 ± 0.71 × 10⁴, and 2.51 ± 1.03 × 10⁴ for control, M1-activated, and M2-activated, respectively, while the SNR of HP [1-13C]AA for control, M1, and M2 was 142 ± 58, 217 ± 67, and 144 ± 67, respectively. When normalizing to cell number and volume, HP AA-to-DHA ratio was significantly increased by 88 ± 14% in M1 compared to control (p = 0.0034, 4.53 ± 0.26 × 10⁻⁶ in M1-activated vs. 2.41 ± 0.11 × 10⁻⁶ in control), while no significant differences were observed in M2 macrophages vs. control (p = 0.9581, 2.19 ± 0.10 × 10⁻⁶ in M2-activated) (Figure 3C). When comparing activation states, HP AA-to-DHA ratio was significantly higher by 107 ± 15% in M1 cells as compared to M2-activated cells (p = 0.0122).

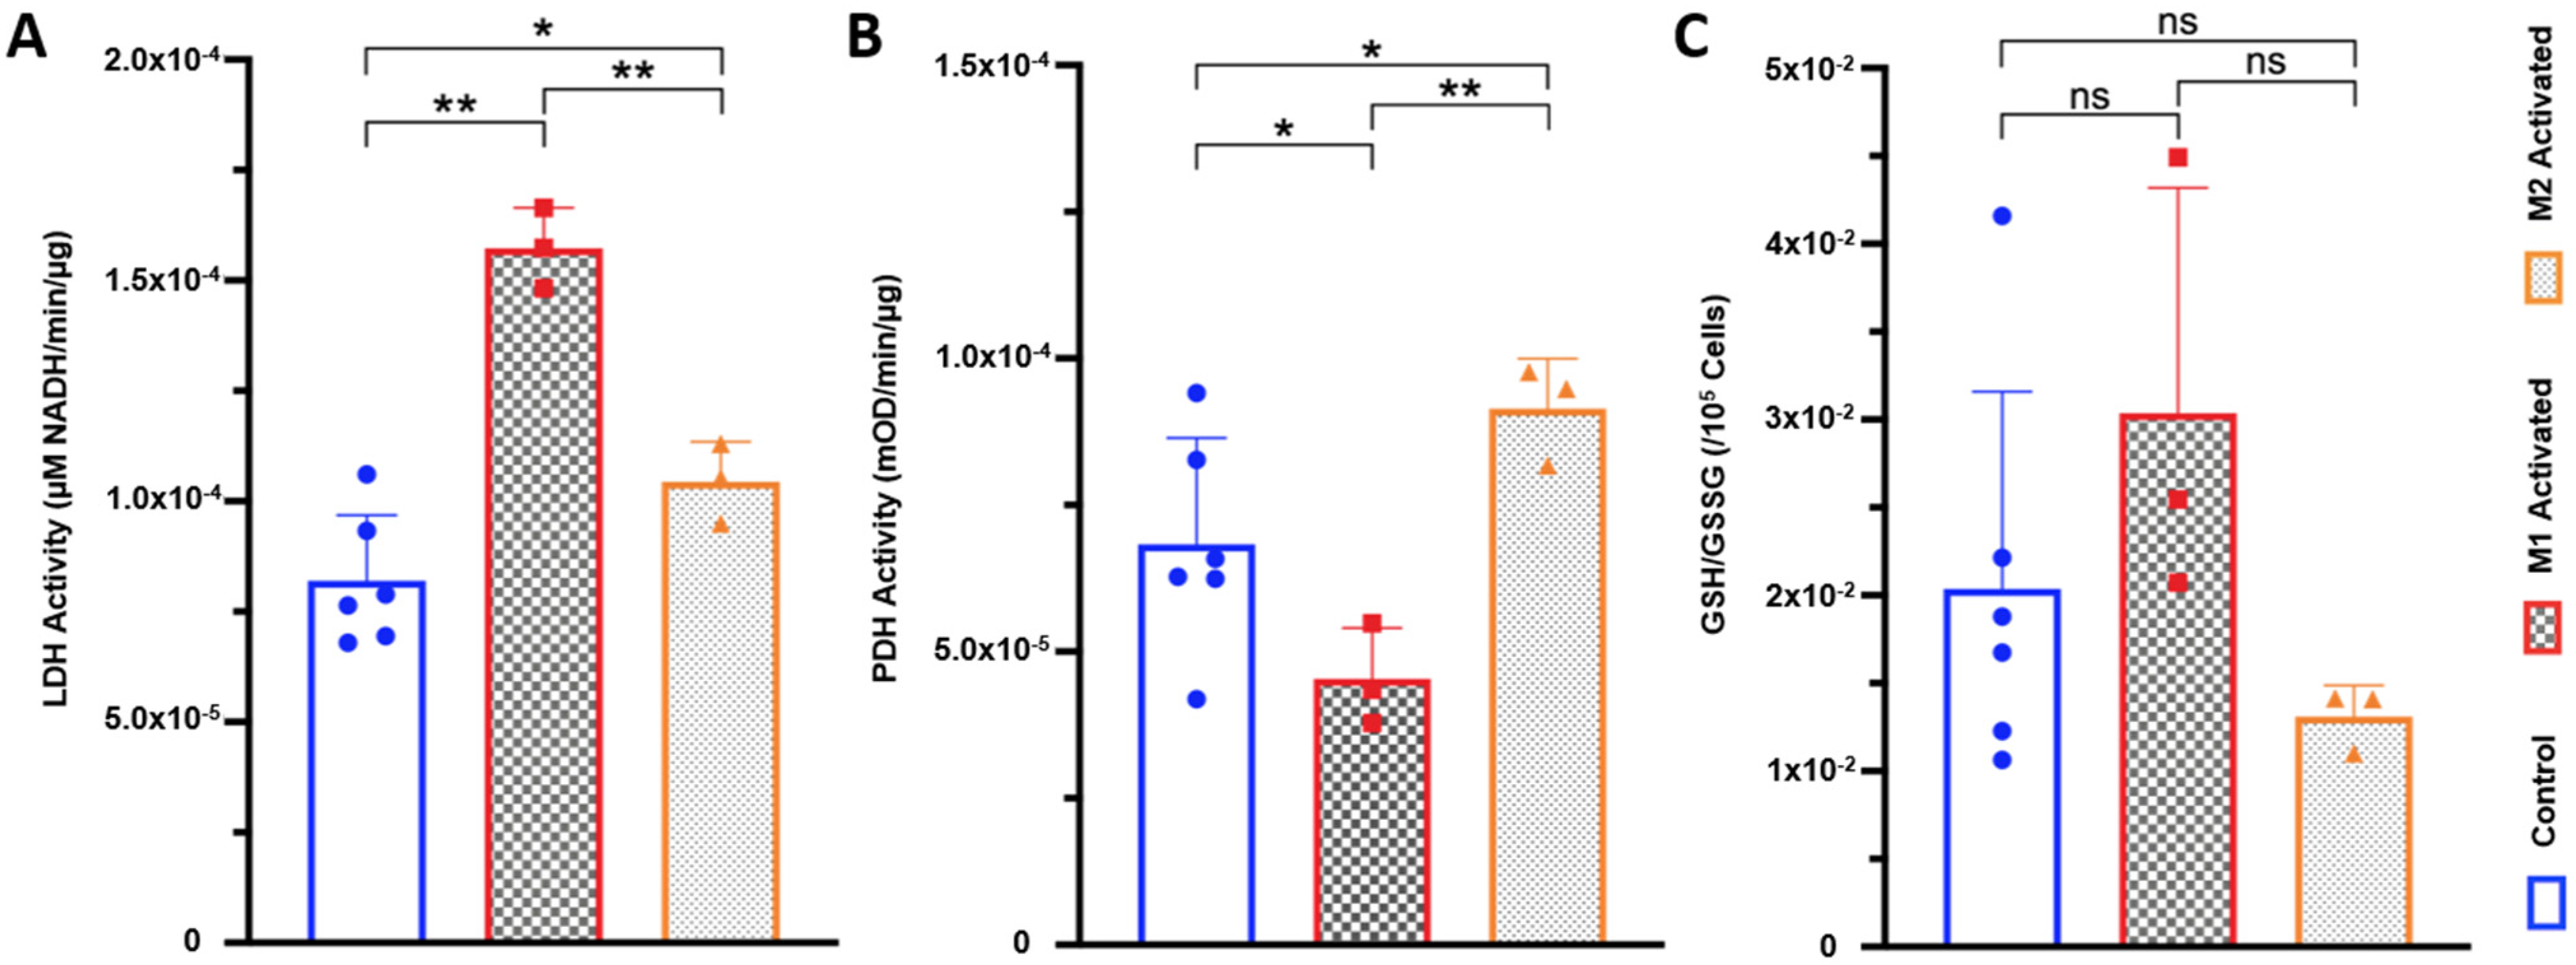
2.4. LDH Activity Is Increased in Both M1- and M2-Activated Macrophages, While PDH Activity Is Decreased in M1 and Increased in M2 Activation

Interestingly, LDH enzyme activity was significantly increased by 92 ± 6% in M1-activated macrophages (p = 0.0020, 1.57 × 10⁻⁴ µM NADH/min/µg for M1-activated vs. 8.20 × 10⁻⁵ µM NADH/min/µg for control), and by 27 ± 6% in M2-activated macrophages (p = 0.0300, 1.04 × 10⁻⁴ µM NADH/min/µg) (Figure 4A). In contrast, PDH activity was significantly decreased by 34 ± 5% in M1-activated macrophages (9.08 × 10⁻⁴ mOD/min/µg) compared to control (1.37 × 10⁻³ mOD/min/µg, p = 0.0297). Meanwhile, M2-activated macrophages showed a significant 34 ± 7% increase in PDH activity (1.83 × 10⁻³ mOD/min/µg) compared to control (p = 0.0290) (Figure 4B). Spectrophotometric assay of glutathione (GSH) to glutathione disulfide (GSSG) GSH/GSSG ratios with subsequent normalization to 105 cells showed no significant differences between groups (Figure 4C).

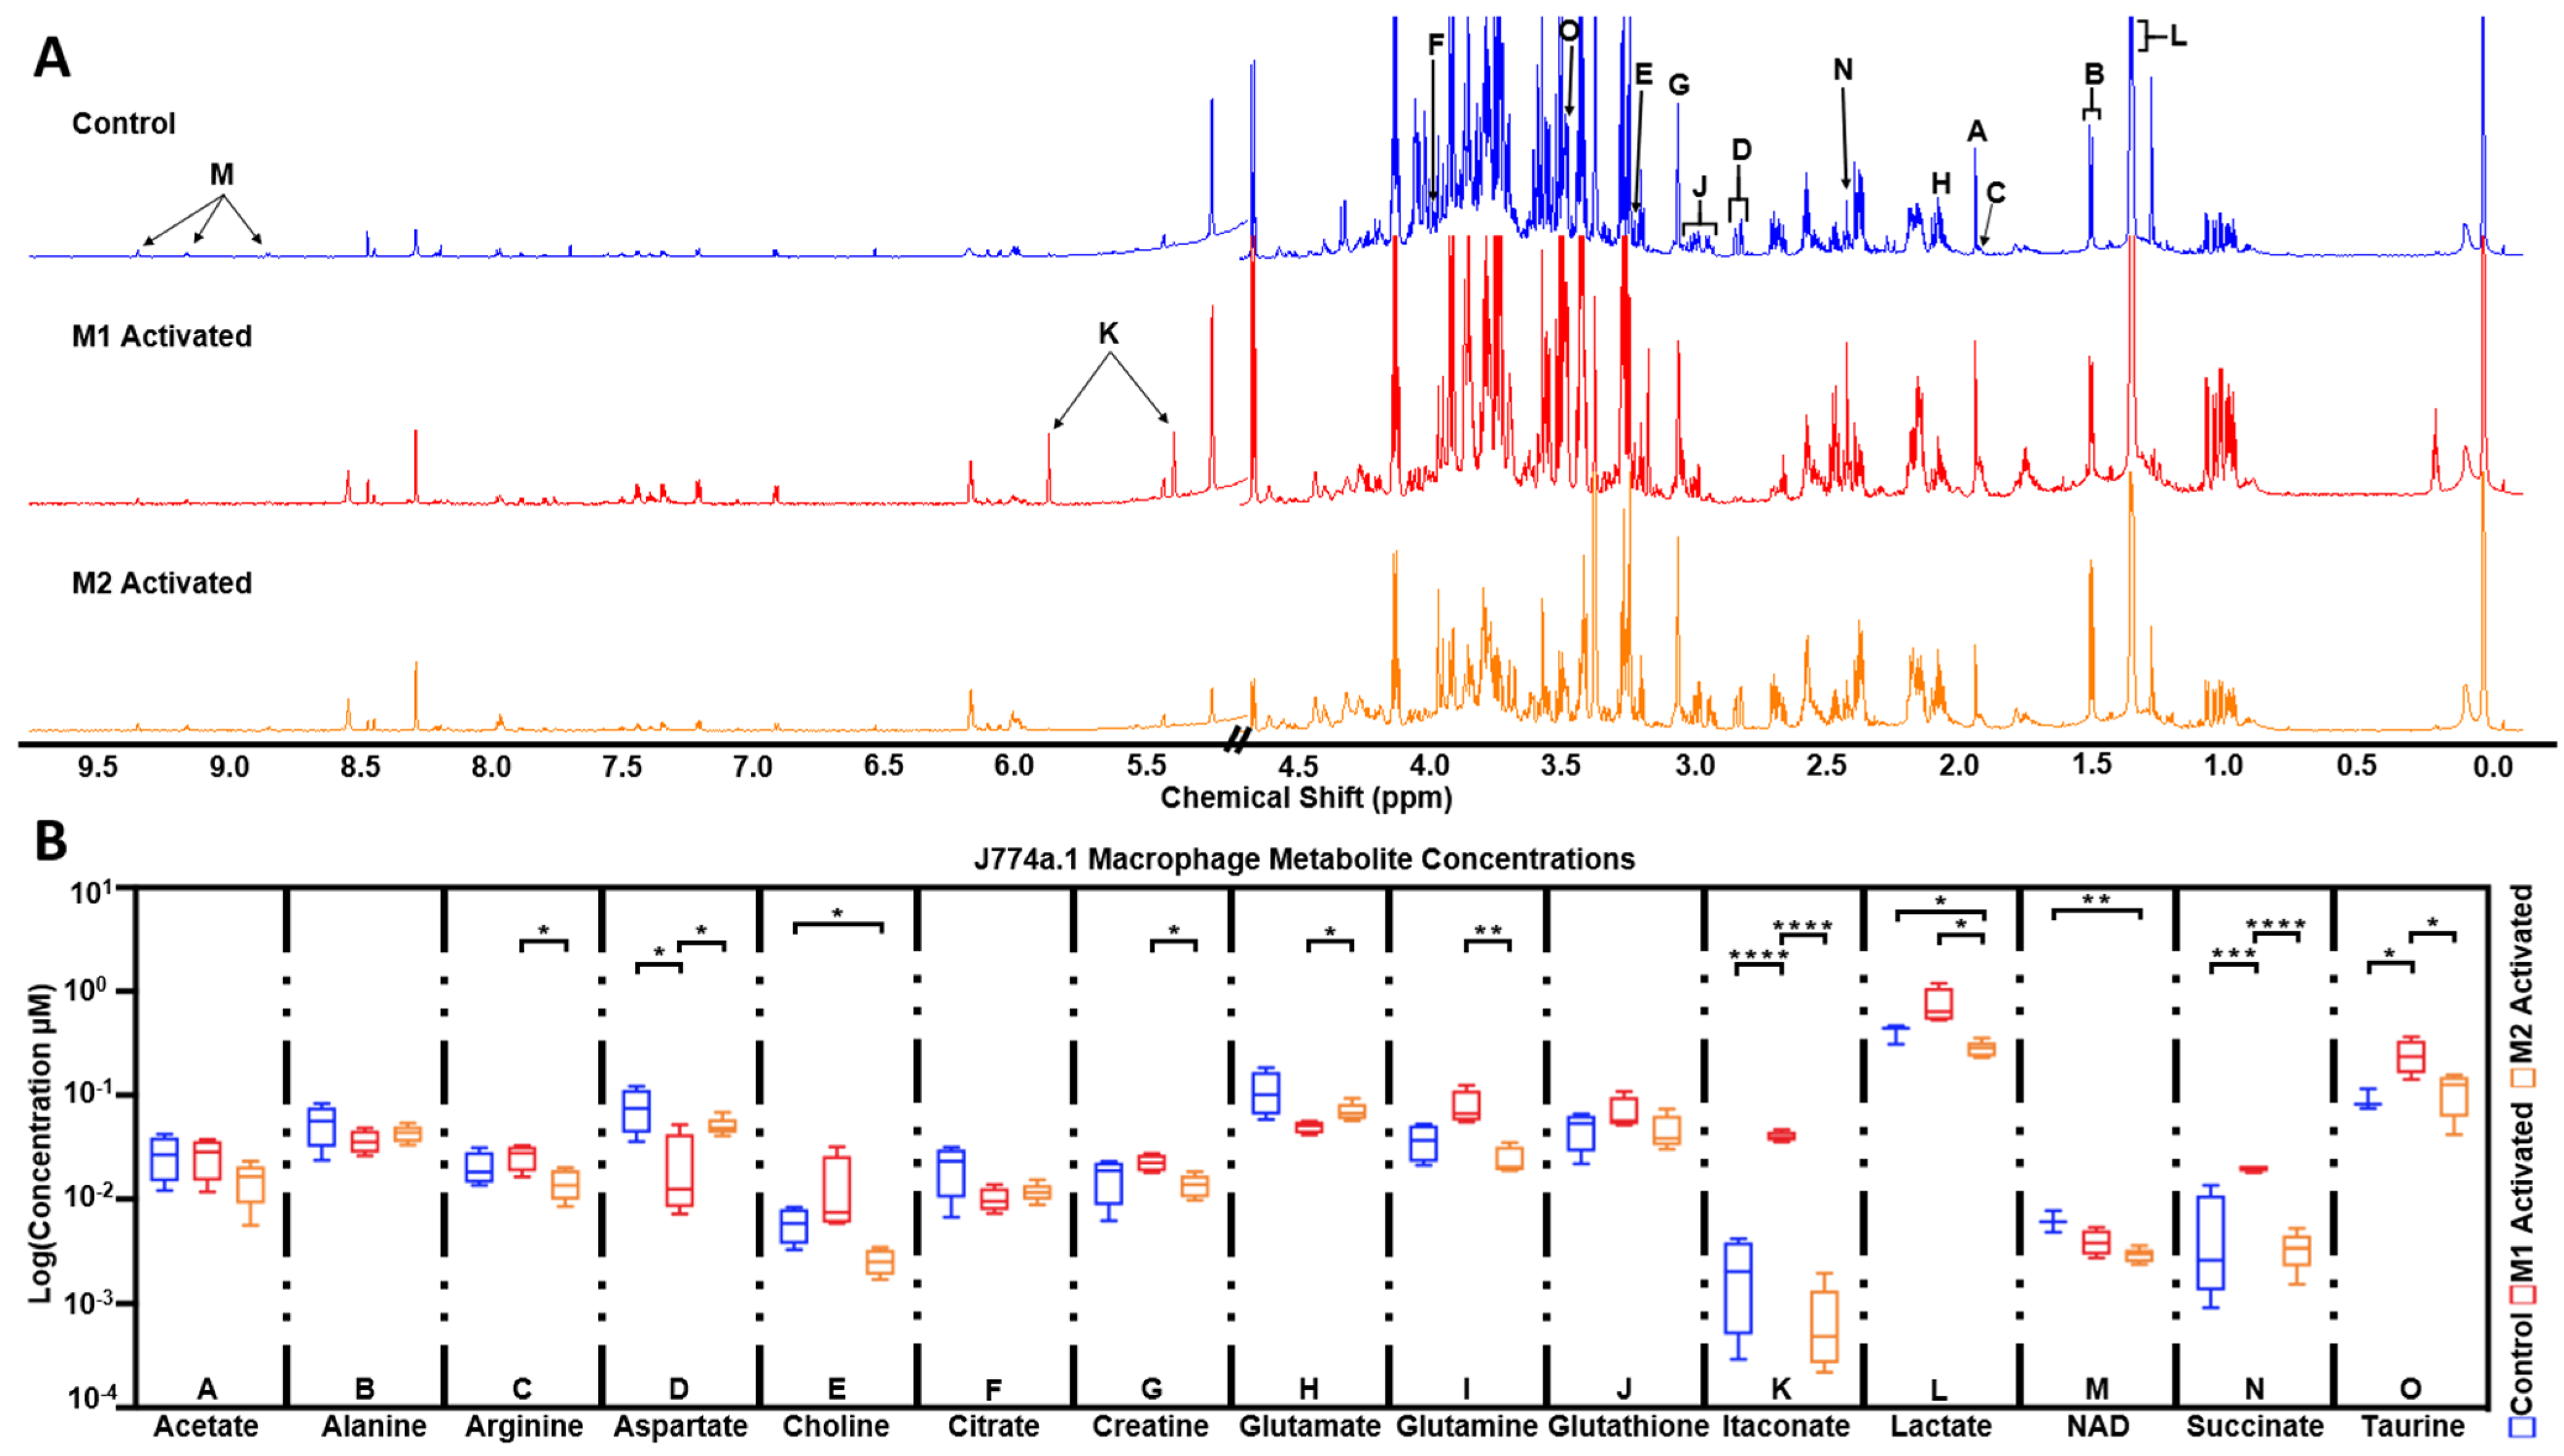
2.5. High Resolution 1H NMR Detects Significant Differences in Extracted Metabolites between Control, M1, and M2 Macrophages

1H NMR spectra of extracted metabolites exhibited well-resolved peaks at 800 MHz (Figure 5A). Multiple metabolite concentrations were observed to be significantly altered between groups (Figure 5B), with many in agreeance with previous reports [33]. In M1-activated macrophages, significant increases in itaconate (p < 0.0001 vs. control, p < 0.0001 vs. M2), taurine (p < 0.05 vs. control, p < 0.05 vs. M2), and succinate (p < 0.001 vs. control, p < 0.0001 vs. M2) were measured, whereas a significant decrease in aspartate (p < 0.05 vs. control, p < 0.05 vs. M2) was detected. In M2 macrophages, significant decreases in NAD (p < 0.01 vs. control, Non Significant (NS) vs. M1), lactate (p < 0.05 vs. control, p < 0.05 vs. M1), and choline (p < 0.05 vs. control, NS vs. M1) were observed. Additional significant metabolite changes between M1- and M2-activated macrophages include glutamate (p < 0.05), creatine (p < 0.05), and arginine (p < 0.05). Metabolite concentrations for each activation group are detailed in Table 1.

3. Discussion

In this study, we used the established J774a.1 mouse macrophage cell line and applied M1 [33] and M2 [37] activation protocols described in previous reports. First, we confirmed that differential activation was successfully achieved, as shown by a significant increase of arginase activity in M2 macrophages [20] and an increased level of ROS in M1 macrophages [7]. Of note, we did not see a significant decrease in ROS levels in M2-activated macrophages compared to control, as others have reported [22], likely due to the small number of cells available for this assay. Protein concentrations per cell were unchanged with M1 or M2 activation, justifying the normalization of all HP and spectrophotometric values to number of cells throughout the study. The 1H MRS results further confirmed differential activation of macrophages. Highly significant increases in itaconate and succinate concentrations are seen in M1 macrophages compared to control, in line with previous reports [39], as itaconate is a well-known product of M1 polarization [40] and a potent inhibitor of succinate dehydrogenase, which leads to succinate accumulation [41]. Glutamine is higher in M1 compared to control, albeit not significantly, in line with a previous report utilizing the identical cell line and activation protocol [33], and also consistent with a study of LPS-induced M1 polarization utilizing a tenfold lower dosage (10 ng/mL) [42]. The increased lactate observed in M1 compared to control and M2 is also indicative of highly upregulated lactate production and Warburg-like effect that are specific to M1 activation [22]. In M2-activated macrophages, the observed decrease in arginine levels compared to M1 could be explained by increased arginine consumption through upregulated arginase activity, though, to date, the only metabolomics study of macrophage activation reports increased intracellular arginine concentration for both M1 and M2 [43]. It should be noted, however, that this study used primary human macrophages, which have been shown to respond differently than established cell lines, as well as much longer activation protocol of 72 h, which might explain the observed discrepancy [44]. A larger metabolomics study specific to activation patterns of murine macrophage cell lines would need to be pursued for more direct comparisons.
Here, we used an innovative approach allowing for noninvasive assessment of metabolism, namely HP 13C MRS, and evaluated its potential to differentiate between activation states in live macrophages. Our results show that significant differences in HP product-to-substrate ratios of both HP [1-13C]pyruvate and HP [1-13C]DHA can be observed in differentially activated murine macrophages. The sampling of cell slurries prior to each HP 13C MRS acquisition allowed for paired biochemical assays to be performed, thus enabling for strong biochemical validations. The methods used may be applied in other cell types, both from culture and primary populations.
The increased HP 13C lactate-to-pyruvate ratio observed in M1-activated macrophages is in agreeance with previous reports [33], and congruent with the expected highly increased glycolytic activity in proinflammatory macrophages [45]. This increased ratio is also associated with a significant increase in LDH activity in the M1 group detected in paired subsamples. In M2-activated macrophages, the HP 13C lactate-to-pyruvate ratio was not significantly different from control, although a trend towards significance was observed. This trend is in line with a smaller significant increase in LDH activity, which was detected by spectrophotometric assays that are likely more sensitive than HP 13C MRS. These results are also in agreement with previous reports showing that M2 polarized macrophages exhibit a more modest increase in glycolytic activity compared to nonactivated macrophages [46]. To further understand our HP results, it is important to look into another common pathway for HP [1-13C]pyruvate metabolism, through PDH. In M1-activated macrophages, our spectrophotometric results showing decreased PDH activity compared to controls are in line with previous reports showing significantly reduced PDH activity in M1 primary murine bone-marrow-derived macrophages [39]. Reduced PDH activity in M1 macrophages would lead to less HP [1-13C]pyruvate entering the Krebs cycle, shuttling this HP probe towards LDH and increased HP [1-13C]lactate production, in line with our HP results. In M2-activated macrophages, on the other hand, we observed a significant increase in PDH activity. This result is interesting, and reasonable given that expression of pyruvate dehydrogenase kinase (PDK), an inhibitor of PDH, is reduced in M2 polarization [47]. In that case, and contrary to M1, increased PDH activity may lead to more HP [1-13C]pyruvate being shuttled into the mitochondria, thus decreasing flux towards HP [1-13C]lactate production via LDH. This result provides an additional explanation for the fact that HP lactate–pyruvate ratio was not significantly increased in M2-activated macrophages, despite the increased LDH activity. It should be noted that HP [1-13C]pyruvate metabolized through PDH can generate HP [1-13C]bicarbonate via pyruvate decarboxylation, and measurements of HP [1-13C]bicarbonate have been used to determine PDH flux in previous studies [48,49]. Although the spectral bandwidth in this study was large enough to cover the resonance of HP [1-13C]bicarbonate at 163 ppm, the signal of this metabolite was not detected, likely due to its intrinsically low level in this cell type. Finally, in addition to enzymatic activities, the levels of steady-state lactate levels from 1H NMR might also contribute to the HP readouts through the well-documented pool-size effect [50,51,52]. The observed significant decrease in 1H lactate levels in M2 macrophages may also contribute to the reduced HP lactate levels in that group. In M1 macrophages, lactate levels follow an increasing trend (p = 0.128), which is also in line with the HP results. Multiple additional factors contributing to the HP readouts could be considered, including levels of membrane transporters (e.g., MCT1) or NAD cofactor availability. However, such measures could not be performed in this study due to the limited number of paired samples available.
Our results show that conversion of HP [1-13C]DHA to HP [1-13C]AA was increased in M1 macrophages, mirrored by increased ROS levels, but unexpectedly not by changes in GSH levels or GSH/GSSG ratio. It is well known that the GSH redox system is a mitigator of ROS [53], while also being coupled to the conversion of DHA into AA [54]: GSH is oxidized to GSSG by DHA, which, in turn, is converted to AA. Increasing ROS levels should theoretically deplete the available pool of GSH (and increase levels of GSSG), leaving less GSH available for the production of AA, and thus leading to a decreased HP AA-to-DHA ratio, as previously reported [36,55]. However, both GSH/GSSG ratios, as detected by spectrophotometric assay, and total GSH levels, as detected by 1H NMR, were not significantly different between M1 macrophages and control or M2. A previous study of the same cell line also showed that the total pool of GSH as detected by 1H NMR was not increased post-activation by LPS [33]. Other reports using biochemical methods also show no changes in total GSH levels with M1 activation, but do note elevated GSH/GSSG ratio [56]. Elevated GSH/GSSG ratio can explain an increase in AA production, and may be a compensatory effect unique to macrophages, as they endogenously manufacture ROS as part of the immune response. Our results show that a trend to an increase in M1-activated compared to control (p = 0.1265) and M2 (p = 0.1083) was seen, although it did not reach significance, possibly due to the limited numbers of available paired samples (N = 3) that were spread thinly across the numerous assays. Further work could be done with a larger sample size to confirm the increase in GSH/GSSG ratio in M1 macrophages. Importantly, conversion of HP [1-13C]DHA to HP [1-13C]AA can also be affected by the levels of the glucose membrane transporter 1 (GLUT1), which is a known facilitated transporter of DHA [57]. GLUT1 has been shown to be upregulated with M1 activation compared to quiescent [58,59], whereas its expression is comparable between control and M2-activated states [42,60]. These facts mirror our HP AA/DHA ratio results and could be another possible mechanistic explanation to our observed HP data. Due to the limited number of paired samples, however, membrane transporter expressions were not evaluated here.
The power of dynamic metabolic probing using HP 13C MR is compelling, as it allows the measuring of previously inaccessible metabolic reactions noninvasively. HP 13C metabolic imaging is a rapidly growing field, and is now being used in multiple clinical trials across the globe, targeting several organs, including the brain, heart, prostate, and kidney [28,29,61,62,63,64,65,66,67,68,69,70]. It is very likely that, given the constant improvements reported, both on the acquisition and processing sides, this methodology will soon approach feasibility for widespread clinical adoption. Currently, the most popular probe for hyperpolarization is HP [1-13C]pyruvate, with some of the best polarization characteristics [52], but other probes are continuously being investigated, opening up possibilities not explored before. While the clinical data reported so far are highly compelling, mechanistic studies are still critically needed to understand the relative contribution of each cell type to the detected HP signal, especially for cells as ubiquitous as macrophages, which are found in most diseases and most organs. Here, we performed the first study of live macrophages at a clinically relevant field strength, and compared both M1 and M2 activation patterns. Before, the only other study that used HP 3C MRS on activated macrophages was conducted at the high magnetic field strength of 11.7 Tesla, and employed M1 activation only [33]. We showed that, at clinical field strength, the spectral resolution was sufficient to enable measurements of metabolic fluxes in live cells. Further, we demonstrated that M1 and M2 macrophages have a different HP metabolic signature, with both HP [1-13C]pyruvate and HP [1-13C]DHA. It is important to note that incubation with LPS and IL-13 is only one way to induce M1 and M2 activation, respectively. Other cytokines, or cytokine cocktails, could be used to induce M1 and M2 activation states (e.g., IL-14 for M2 [71], or interferon-gamma (IFN-γ) for M1 [72]), and further studies would be needed to confirm that the HP results observed in this study hold across activation protocols, as well as in vivo in preclinical models. Further, potential changes in metabolism caused by the change in cellular environment from flask to NMR tube would require additional investigation. Nevertheless, this study further establishes HP metabolic imaging as an interesting tool to assess inflammation, and our results could help increase the understanding of the metabolic readouts observed in vivo in preclinical models and patients.

4. Materials and Methods

4.1. Cell Culture

J774a.1 mouse macrophages (ATCC, Manassas, VA, USA) were grown in Dulbecco’s modified Eagle’s media (DMEM) containing 10% fetal bovine serum and 5% penicillin/streptomycin (UCSF). M1 activation was achieved with 100 ng/mL LPS treatment for 24 h (E. coli; Sigma Aldrich), and M2 activation with 5 ng/mL of murine IL-13 for 24 h (Peprotech), as previously described [32,36]. A control group was established with a vehicle treatment of sterile PBS. All passage numbers used were ~4–14 to reduce the risk of genetic drift, and a mycoplasma testing kit (ATCC) confirmed the culture was contamination-free. Figure 1 presents a schematic of the full experimental design.
For HP 13C experiments, cells were studied as paired samples of either M1 or M2 activation and paired controls. The definition of paired samples were as follows: three T225 flasks were split into ten T225 flasks, five of which were activated towards either M1 or M2, and the other five with vehicle as control. The adherent macrophages were incubated with 0.04% EDTA in calcium and magnesium-free PBS solution (Cell Culture Facility, UCSF) for approximately 10 min, collected, and then centrifuged at 125× g for 5 min. The pellet was resuspended in 200 μL of fresh DMEM (no additives), and a 20 μL sample was taken and washed with PBS to be saved at −80 °C for paired spectrophotometric assays (for all assays except ROS). Another 20 μL sample was taken for cell counting (referred to as subsample in the rest of this manuscript), and the remaining slurry suspension (~20 million cells) was transferred to a 5 mm NMR tube. All injections of HP probes were done within 5 min of cell resuspension and transfer to the NMR tube.

4.2. MR Acquisitions

A total of 24 μL of [1-13C]pyruvate (15 M pyruvic acid (Sigma Aldrich, St Louis, MO, USA), 15 mM trityl radical (GE), 500 mM Gd-DOTA (Guerbet, Roissy, France)) or 25 μL of [1-13C]DHA (2.2 M dehydroascorbic acid (Sigma) prepared as previously described [36]) was polarized for 1 h on a Hypersense dDNP polarizer (Oxford Instruments), then dissolved in 4.5 mL or 3.5 mL buffer (pyruvate buffer: 80 mM NaOH, 40 mM Tris HCl, 3 mM EDTA in ddH2O; DHA buffer: 3 mM EDTA in ddH2O), to yield a final solution of 80 mM or 15.72 mM, respectively. Previous formulations of [1-13C]pyruvate and [1-13C]DHA polarized on the Hypersense polarizer achieved 13.9–27.5% and ~10% polarization, respectively [55,73]. Within 20 s of dissolution, approximately 400 μL of HP [1-13C]pyruvate (n = 3 control vs. M1-activated pairs, n = 4 control vs. M2-activated pairs) or [1-13C]DHA (DHA: n = 6 control vs. M1-activated pairs, n = 5 control vs. M2-activated pairs) was injected into a 5 mm NMR tube containing a ~20 million cell slurry in 200 μL DMEM. Hyperpolarized spectra were then acquired on a 1.47 T Oxford Pulsar NMR system using a 1D pulse acquire sequence with the following parameters: flip angle = 20°, repetition time (TR) = 3 s, pulse type = WALTZ-4, pulse length = 4 μs, and number of scans (NS) = 100, for a total acquisition of 5 min. Analysis was performed with Mestrenova (Mestrelab, Santiago de Compostela, Spain) software. Signal to noise ratio (SNR) for the injected substrates and detected products were calculated from the total summed spectra as area under curve divided by standard deviation of the noise. Contaminants were identified via blank experiments with hyperpolarized substrates injected into NMR tubes with media only. Spin-lattice relaxation time T1 of each HP probe was also calculated from such blank experiments. All HP data are represented as mean ± standard error of the mean (SEM), and are normalized to cell number and volume of injection.

4.3. Spectrophotometric Assays

ROS levels, arginase activity, LDH activity, PDH activity, and GSH levels were measured with spectrophotometry on paired samples collected from the same flasks as the ones used for HP experiments. ROS data of control (N = 6), M1-activated (N = 6), and M2-activated (N = 3) were reported as fold-change from control using a commercial intracellular ROS fluorescence assay kit (Abcam, Cambridge, UK), used according to manufacturer’s instructions). Arginase assay (Abcam) activity of control (N = 6), M1-activated (N = 3), and M2-activated (N = 3) was reported in units/Liter (U/L) and normalized to 105 cells per well. An in-house LDH assay measuring the rate of NADH (Sigma) depletion for control (N = 6) and activated groups (N = 3 for both M1 and M2) was performed and reported as µM NADH/minute normalized to protein concentration quantified by Bradford assay (Thermofisher, Waltham, MA, USA). A PDH assay kit (Abcam, Cambridge, UK) was used to measure PDH enzyme activity between groups (N = 3 for each control, M1, and M2), and reported as optical density (milliOD)/minute with normalization to protein concentration. GSH and its oxidized form GSSG were measured with a commercial kit (Biovision, San Francisco, CA, USA). The total glutathione levels were first measured, then subtracted from measured levels of GSH to obtain GSSG values, with the subsequent GSH/GSSG ratio reported with normalization to 105 cells per well. All spectrophotometric data are reported as mean ± standard deviation.

4.4. High Resolution 1H NMR of Extracted Cell Metabolites

Metabolites from M1-activated (N = 5), M2-activated (N = 5), and control (N = 4) J774a.1 cells were extracted using equal parts methanol–water–chloroform, as previously described [74]. Cold 4 °C saline (5 mL) was added directly to T75 flasks 2–3 times and removed to rinse, and −20 °C methanol (3 mL) was subsequently added. The adherent macrophages were scraped off into the methanol—this mixture was transferred to a clean tube. Equal parts −20 °C chloroform and 4 °C H2O were homogenously mixed, and the fractions separated by centrifuging at 125× g at 4 °C. The methanol fraction was collected, 0.65 mM trimethylsilylpropanoic acid (TSP) (Acros Organics) added, and the mixture lyophilized. The resultant extracts were reconstituted in 420 μL D2O, and the samples were scanned on an 800 MHz NMR system (Bruker, Billerica, MA, USA) with a 1D NOESY presaturation sequence with TR = 3.31 s, mixing time = 50 ms, and NS = 384. A subsequent fully relaxed scan was performed with a relaxation delay of 30 s to ensure a time of at least 5 times the longest T1 based on literature values [75]. This spectrum was used to generate correction factors that were then subsequently applied to all spectra to enable absolute quantification of metabolites. Spectral processing was performed with Mestrenova (Mestrelab, Santiago de Compostela, Spain), and a select group of metabolites of interest previously reported in macrophage studies [33] were fitted and quantified using Chenomx NMR Suite (Chenomx Inc, Edmonton, AB, Canada) with reference to the Human Metabolomics Database [76]. Concentrations of quantified metabolites were normalized to cell number and TSP reference, and reported as mean ± standard deviation.

4.5. Statistical Analyses

The sample sizes of HP experiments were determined using an 80% power calculation of preliminary paired data between activated and nonactivated groups. All data were tested with two-way ANOVA between activated and nonactivated, with Sidak’s multiple comparisons test. All tests were performed with Prism 8 (GraphPad) software.

Supplementary Materials

The following are available online at https://www.mdpi.com/article/10.3390/metabo11070410/s1, Figure S1: M1 and M2 activation of J774a.1 macrophages.

Author Contributions

K.Q. performed experiments, analyzed and interpreted data, and drafted the manuscript. L.M.L.P. helped perform experiments and reviewed the manuscript. M.M.C. designed the study, reviewed experiments, and drafted the manuscript. All authors have read and agreed to the published version of the manuscript.

Funding

This research was funded by NIH R01NS102156, NMSS research grant RG-1701-26630, Hilton Foundation–Marilyn Hilton Award for Innovation in MS Research #17319, Dana Foundation: The David Mahoney Neuroimaging program.

Institutional Review Board Statement

Not applicable.

Informed Consent Statement

Not applicable.

Data Availability Statement

The data presented in this study are available on request from the corresponding author.

Acknowledgments

The authors acknowledge technical support from the NIH Hyperpolarized MRI Technology Resource Center #P41EB013598.

Conflicts of Interest

The authors declare no conflict of interest.

References

  1. Galli, S.J.; Borregaard, N.; Wynn, T.A. Phenotypic and functional plasticity of cells of innate immunity: Macrophages, mast cells and neutrophils. Nat. Immunol. 2011, 12, 1035–1044. [Google Scholar] [CrossRef] [Green Version]
  2. Okabe, Y.; Medzhitov, R. Tissue biology perspective on macrophages. Nat. Immunol. 2016, 17, 9–17. [Google Scholar] [CrossRef]
  3. Gasteiger, G.; D’Osualdo, A.; Schubert, D.A.; Weber, A.; Bruscia, E.M.; Hartl, D. Cellular Innate Immunity: An Old Game with New Players. J. Innate Immun. 2017, 9, 111–125. [Google Scholar] [CrossRef] [PubMed]
  4. Shiomi, A.; Usui, T. Pivotal roles of GM-CSF in autoimmunity and inflammation. Mediat. Inflamm. 2015, 2015, 568543. [Google Scholar] [CrossRef] [PubMed] [Green Version]
  5. Kraakman, M.J.; Murphy, A.J.; Jandeleit-Dahm, K.; Kammoun, H.L. Macrophage polarization in obesity and type 2 diabetes: Weighing down our understanding of macrophage function? Front. Immunol. 2014, 5, 470. [Google Scholar] [CrossRef]
  6. Dandekar, R.; Kingaonkar, A.; Dhabekar, G. Role of macrophages in malignancy. Ann. Maxillofac. Surg. 2011, 1, 150–154. [Google Scholar] [CrossRef] [Green Version]
  7. Mills, C.D.; Kincaid, K.; Alt, J.M.; Heilman, M.J.; Hill, A.M. M-1/M-2 macrophages and the Th1/Th2 paradigm. J. Immunol. 2000, 164, 6166–6173. [Google Scholar] [CrossRef] [Green Version]
  8. Stunault, M.I.; Bories, G.; Guinamard, R.R.; Ivanov, S. Metabolism Plays a Key Role during Macrophage Activation. Mediat. Inflamm. 2018, 2018, 2426138. [Google Scholar] [CrossRef]
  9. Tan, H.-Y.; Wang, N.; Li, S.; Hong, M.; Wang, X.; Feng, Y. The Reactive Oxygen Species in Macrophage Polarization: Reflecting Its Dual Role in Progression and Treatment of Human Diseases. Oxid. Med. Cell. Longev. 2016, 2016, 2795090. [Google Scholar] [CrossRef] [Green Version]
  10. Raza, H.; John, A.; Shafarin, J. NAC attenuates LPS-induced toxicity in aspirin-sensitized mouse macrophages via suppression of oxidative stress and mitochondrial dysfunction. PLoS ONE 2014, 9, e103379. [Google Scholar] [CrossRef] [PubMed] [Green Version]
  11. Rendra, E.; Riabov, V.; Mossel, D.M.; Sevastyanova, T.; Harmsen, M.C.; Kzhyshkowska, J. Reactive oxygen species (ROS) in macrophage activation and function in diabetes. Immunobiology 2019, 224, 242–253. [Google Scholar] [CrossRef] [PubMed]
  12. De Santa, F.; Vitiello, L.; Torcinaro, A.; Ferraro, E. The Role of Metabolic Remodeling in Macrophage Polarization and Its Effect on Skeletal Muscle Regeneration. Antioxid. Redox Signal. 2019, 30, 1553–1598. [Google Scholar] [CrossRef] [PubMed] [Green Version]
  13. Mantovani, A.; Sica, A.; Sozzani, S.; Allavena, P.; Vecchi, A.; Locati, M. The chemokine system in diverse forms of macrophage activation and polarization. Trends Immunol. 2004, 25, 677–686. [Google Scholar] [CrossRef]
  14. Deng, Z.; Shi, F.; Zhou, Z.; Sun, F.; Sun, M.H.; Sun, Q.; Chen, L.; Li, D.; Jiang, C.Y.; Zhao, R.Z.; et al. M1 macrophage mediated increased reactive oxygen species (ROS) influence wound healing via the MAPK signaling in vitro and in vivo. Toxicol. Appl. Pharm. 2019, 366, 83–95. [Google Scholar] [CrossRef]
  15. Mills, E.L.; O’Neill, L.A. Reprogramming mitochondrial metabolism in macrophages as an anti-inflammatory signal. Eur. J. Immunol. 2016, 46, 13–21. [Google Scholar] [CrossRef] [PubMed]
  16. Garg, S.K.; Delaney, C.; Shi, H.; Yung, R. Changes in adipose tissue macrophages and T cells during aging. Crit. Rev. Immunol. 2014, 34, 1–14. [Google Scholar] [CrossRef] [PubMed]
  17. Murphy, B.S.; Sundareshan, V.; Cory, T.J.; Hayes, D., Jr.; Anstead, M.I.; Feola, D.J. Azithromycin alters macrophage phenotype. J. Antimicrob. Chemother. 2008, 61, 554–560. [Google Scholar] [CrossRef] [PubMed] [Green Version]
  18. Lin, L.; Hu, K. Tissue-type plasminogen activator modulates macrophage M2 to M1 phenotypic change through annexin A2-mediated NF-kappaB pathway. Oncotarget 2017, 8, 88094–88103. [Google Scholar] [CrossRef] [PubMed] [Green Version]
  19. Yang, Z.; Ming, X.F. Functions of arginase isoforms in macrophage inflammatory responses: Impact on cardiovascular diseases and metabolic disorders. Front. Immunol. 2014, 5, 533. [Google Scholar] [CrossRef] [Green Version]
  20. Rath, M.; Muller, I.; Kropf, P.; Closs, E.I.; Munder, M. Metabolism via Arginase or Nitric Oxide Synthase: Two Competing Arginine Pathways in Macrophages. Front. Immunol. 2014, 5, 532. [Google Scholar] [CrossRef] [Green Version]
  21. Weisser, S.B.; Kozicky, L.K.; Brugger, H.K.; Ngoh, E.N.; Cheung, B.; Jen, R.; Menzies, S.C.; Samarakoon, A.; Murray, P.J.; Lim, C.J.; et al. Arginase activity in alternatively activated macrophages protects PI3Kp110delta deficient mice from dextran sodium sulfate induced intestinal inflammation. Eur. J. Immunol. 2014, 44, 3353–3367. [Google Scholar] [CrossRef]
  22. Martinez, F.O.; Gordon, S. The M1 and M2 paradigm of macrophage activation: Time for reassessment. F1000prime Rep. 2014, 6, 13. [Google Scholar] [CrossRef] [Green Version]
  23. Ardenkjaer-Larsen, J.H.; Fridlund, B.; Gram, A.; Hansson, G.; Hansson, L.; Lerche, M.H.; Servin, R.; Thaning, M.; Golman, K. Increase in signal-to-noise ratio of > 10,000 times in liquid-state NMR. Proc. Natl. Acad. Sci. USA 2003, 100, 10158–10163. [Google Scholar] [CrossRef] [Green Version]
  24. Chaumeil, M.M.; Larson, P.E.Z.; Yoshihara, H.A.I.; Danforth, O.M.; Vigneron, D.B.; Nelson, S.J.; Pieper, R.O.; Phillips, J.J.; Ronen, S.M. Non-invasive in vivo assessment of IDH1 mutational status in glioma. Nat. Commun. 2013, 4, 2429. [Google Scholar] [CrossRef] [Green Version]
  25. Le Page, L.M.; Guglielmetti, C.; Najac, C.F.; Tiret, B.; Chaumeil, M.M. Hyperpolarized 13 C magnetic resonance spectroscopy detects toxin-induced neuroinflammation in mice. NMR Biomed. 2019, 32, e4164. [Google Scholar] [CrossRef] [Green Version]
  26. Yoshihara, H.A.; Bastiaansen, J.A.; Berthonneche, C.; Comment, A.; Schwitter, J. An intact small animal model of myocardial ischemia-reperfusion: Characterization of metabolic changes by hyperpolarized 13C MR spectroscopy. Am. J. Physiol. Heart Circ. Physiol. 2015, 309, H2058–H2066. [Google Scholar] [CrossRef] [Green Version]
  27. Kurhanewicz, J.; Vigneron, D.B.; Ardenkjaer-Larsen, J.H.; Bankson, J.A.; Brindle, K.; Cunningham, C.H.; Gallagher, F.A.; Keshari, K.R.; Kjaer, A.; Laustsen, C.; et al. Hyperpolarized (13)C MRI: Path to Clinical Translation in Oncology. Neoplasia 2019, 21, 1–16. [Google Scholar] [CrossRef]
  28. ClinicalTrials.gov. Imaging of Traumatic Brain Injury Metabolism Using Hyperpolarized Carbon-13 Pyruvate; U.S. National Library of Medicine: Bethesda, MD, USA, 2018.
  29. Nelson, S.J.; Kurhanewicz, J.; Vigneron, D.B.; Larson, P.E.Z.; Harzstark, A.L.; Ferrone, M.; van Criekinge, M.; Chang, J.W.; Bok, R.; Park, I.; et al. Metabolic imaging of patients with prostate cancer using hyperpolarized [1-¹3C]pyruvate. Sci. Transl. Med. 2013, 5, 198ra108. [Google Scholar] [CrossRef] [PubMed] [Green Version]
  30. Le Page, L.M.; Guglielmetti, C.; Taglang, C.; Chaumeil, M.M. Imaging Brain Metabolism Using Hyperpolarized 13C Magnetic Resonance Spectroscopy. Trends Neurosci. 2020, 43, 343–354. [Google Scholar] [CrossRef] [PubMed]
  31. Grist, J.T.; Miller, J.J.; Zaccagna, F.; McLean, M.A.; Riemer, F.; Matys, T.; Tyler, D.J.; Laustsen, C.; Coles, A.J.; Gallagher, F.A. Hyperpolarized (13)C MRI: A novel approach for probing cerebral metabolism in health and neurological disease. J. Cereb. Blood Flow Metab. 2020, 40, 1137–1147. [Google Scholar] [CrossRef] [PubMed]
  32. Najac, C.; Chaumeil, M.M.; Kohanbash, G.; Guglielmetti, C.; Gordon, J.W.; Okada, H.; Ronen, S.M. Detection of inflammatory cell function using 13C magnetic resonance spectroscopy of hyperpolarized [6-13C]-arginine. Sci. Rep. 2016, 6, 31397. [Google Scholar] [CrossRef] [Green Version]
  33. Sriram, R.; Nguyen, J.; Santos, J.D.; Nguyen, L.; Sun, J.; Vigneron, S.; Van Criekinge, M.; Kurhanewicz, J.; MacKenzie, J.D. Molecular detection of inflammation in cell models using hyperpolarized (13)C-pyruvate. Theranostics 2018, 8, 3400–3407. [Google Scholar] [CrossRef] [PubMed]
  34. Lewis, A.J.M.; Miller, J.J.; Lau, A.Z.; Curtis, M.K.; Rider, O.J.; Choudhury, R.P.; Neubauer, S.; Cunningham, C.H.; Carr, C.A.; Tyler, D.J. Noninvasive Immunometabolic Cardiac Inflammation Imaging Using Hyperpolarized Magnetic Resonance. Circ. Res. 2018, 122, 1084–1093. [Google Scholar] [CrossRef] [Green Version]
  35. Kohler, S.J.; Yen, Y.; Wolber, J.; Chen, A.P.; Albers, M.J.; Bok, R.; Zhang, V.; Tropp, J.; Nelson, S.; Vigneron, D.B.; et al. In vivo 13 carbon metabolic imaging at 3T with hyperpolarized 13C-1-pyruvate. Magn. Reson. Med. 2007, 58, 65–69. [Google Scholar] [CrossRef]
  36. Keshari, K.R.; Kurhanewicz, J.; Bok, R.; Larson, P.E.Z.; Vigneron, D.B.; Wilson, D.M. Hyperpolarized 13C dehydroascorbate as an endogenous redox sensor for in vivo metabolic imaging. Proc. Natl. Acad. Sci. USA 2011, 108, 18606–18611. [Google Scholar] [CrossRef] [PubMed] [Green Version]
  37. Csóka, B.; Selmeczy, Z.; Koscsó, B.; Németh, Z.H.; Pacher, P.; Murray, P.J.; Kepka-Lenhart, D.; Morris, S.M., Jr.; Gause, W.C.; Leibovich, S.J.; et al. Adenosine promotes alternative macrophage activation via A2A and A2B receptors. FASEB J. 2012, 26, 376–386. [Google Scholar] [CrossRef] [Green Version]
  38. Koo, S.-J.; Chowdhury, I.H.; Szczesny, B.; Wan, X.; Garg, N.J. Macrophages Promote Oxidative Metabolism To Drive Nitric Oxide Generation in Response to Trypanosoma cruzi. Infect. Immun. 2016, 84, 3527–3541. [Google Scholar] [CrossRef] [Green Version]
  39. Palmieri, E.M.; Gonzalez-Cotto, M.; Baseler, W.A.; Davies, L.C.; Ghesquière, B.; Maio, N.; Rice, C.M.; Rouault, T.A.; Cassel, T.; Higashi, R.M.; et al. Nitric oxide orchestrates metabolic rewiring in M1 macrophages by targeting aconitase 2 and pyruvate dehydrogenase. Nat. Commun. 2020, 11, 698. [Google Scholar] [CrossRef] [PubMed]
  40. Michelucci, A.; Cordes, T.; Ghelfi, J.; Pailot, A.; Reiling, N.; Goldmann, O.; Binz, T.; Wegner, A.; Tallam, A.; Rausell, A.; et al. Immune-responsive gene 1 protein links metabolism to immunity by catalyzing itaconic acid production. Proc. Natl. Acad. Sci. USA 2013, 110, 7820. [Google Scholar] [CrossRef] [PubMed] [Green Version]
  41. Cordes, T.; Wallace, M.; Michelucci, A.; Divakaruni, A.S.; Sapcariu, S.C.; Sousa, C.; Koseki, H.; Cabrales, P.; Murphy, A.N.; Hiller, K.; et al. Immunoresponsive Gene 1 and Itaconate Inhibit Succinate Dehydrogenase to Modulate Intracellular Succinate Levels. J. Biol. Chem. 2016, 291, 14274–14284. [Google Scholar] [CrossRef] [Green Version]
  42. Tavakoli, S.; Downs, K.; Short, J.D.; Nguyen, H.N.; Lai, Y.; Jerabek, P.A.; Goins, B.; Toczek, J.; Sadeghi, M.M.; Asmis, R. Characterization of Macrophage Polarization States Using Combined Measurement of 2-Deoxyglucose and Glutamine Accumulation: Implications for Imaging of Atherosclerosis. Arterioscl. Thromb. Vasc. Biol. 2017, 37, 1840–1848. [Google Scholar] [CrossRef] [PubMed] [Green Version]
  43. Fuchs, A.L.; Schiller, S.M.; Keegan, W.J.; Ammons, M.C.B.; Eilers, B.; Tripet, B.; Copié, V. Quantitative (1)H NMR Metabolomics Reveal Distinct Metabolic Adaptations in Human Macrophages Following Differential Activation. Metabolites 2019, 9, 248. [Google Scholar] [CrossRef] [Green Version]
  44. Andreu, N.; Phelan, J.; de Sessions, P.F.; Cliff, J.M.; Clark, T.G.; Hibberd, M.L. Primary macrophages and J774 cells respond differently to infection with Mycobacterium tuberculosis. Sci. Rep. 2017, 7, 42225. [Google Scholar] [CrossRef] [Green Version]
  45. Hu, S.; Balakrishnan, A.; Bok, R.A.; Anderton, B.; Larson, P.E.Z.; Nelson, S.J.; Kurhanewicz, J.; Vigneron, D.B.; Goga, A. 13C-pyruvate imaging reveals alterations in glycolysis that precede c-Myc-induced tumor formation and regression. Cell Metab. 2011, 14, 131–142. [Google Scholar] [CrossRef] [PubMed] [Green Version]
  46. Huang, S.C.-C.; Smith, A.M.; Everts, B.; Colonna, M.; Pearce, E.L.; Schilling, J.D.; Pearce, E.J. Metabolic Reprogramming Mediated by the mTORC2-IRF4 Signaling Axis Is Essential for Macrophage Alternative Activation. Immunity 2016, 45, 817–830. [Google Scholar] [CrossRef] [PubMed] [Green Version]
  47. Min, B.-K.; Park, S.; Kang, H.-J.; Kim, D.W.; Ham, H.J.; Ha, C.-M.; Choi, B.-J.; Lee, J.Y.; Oh, C.J.; Yoo, E.K.; et al. Pyruvate Dehydrogenase Kinase Is a Metabolic Checkpoint for Polarization of Macrophages to the M1 Phenotype. Front. Immunol. 2019, 10, 944. [Google Scholar] [CrossRef] [PubMed] [Green Version]
  48. Merritt, M.E.; Harrison, C.; Sherry, A.D.; Malloy, C.R.; Burgess, S.C. Flux through hepatic pyruvate carboxylase and phosphoenolpyruvate carboxykinase detected by hyperpolarized 13C magnetic resonance. Proc. Natl. Acad. Sci. USA 2011, 108, 19084–19089. [Google Scholar] [CrossRef] [Green Version]
  49. Merritt, M.E.; Harrison, C.; Storey, C.; Jeffrey, F.M.; Sherry, A.D.; Malloy, C.R. Hyperpolarized 13C allows a direct measure of flux through a single enzyme-catalyzed step by NMR. Proc. Natl. Acad. Sci. USA 2007, 104, 19773–19777. [Google Scholar] [CrossRef] [Green Version]
  50. Hong, C.S.; Graham, N.A.; Gu, W.; Espindola Camacho, C.; Mah, V.; Maresh, E.L.; Alavi, M.; Bagryanova, L.; Krotee, P.A.L.; Gardner, B.K.; et al. MCT1 Modulates Cancer Cell Pyruvate Export and Growth of Tumors that Co-express MCT1 and MCT4. Cell Rep. 2016, 14, 1590–1601. [Google Scholar] [CrossRef] [Green Version]
  51. Vincent, S.J.; Zwahlen, C.; Post, C.B.; Burgner, J.W.; Bodenhausen, G. The conformation of NAD+ bound to lactate dehydrogenase determined by nuclear magnetic resonance with suppression of spin diffusion. Proc. Natl. Acad. Sci. USA 1997, 94, 4383–4388. [Google Scholar] [CrossRef] [Green Version]
  52. Chaumeil, M.M.; Najac, C.; Ronen, S.M. Studies of Metabolism Using (13)C MRS of Hyperpolarized Probes. Methods Enzym. 2015, 561, 1–71. [Google Scholar] [CrossRef]
  53. Armstrong, J.S.; Steinauer, K.K.; Hornung, B.; Irish, J.M.; Lecane, P.; Birrell, G.W.; Peehl, D.M.; Knox, S.J. Role of glutathione depletion and reactive oxygen species generation in apoptotic signaling in a human B lymphoma cell line. Cell Death Differ. 2002, 9, 252–263. [Google Scholar] [CrossRef] [PubMed] [Green Version]
  54. Linster, C.L.; Van Schaftingen, E. Vitamin C. Biosynthesis, recycling and degradation in mammals. FEBS J. 2007, 274, 1–22. [Google Scholar] [CrossRef] [PubMed]
  55. Qin, H.; Carroll, V.N.; Sriram, R.; Villanueva-Meyer, J.E.; von Morze, C.; Wang, Z.J.; Mutch, C.A.; Keshari, K.R.; Flavell, R.R.; Kurhanewicz, J.; et al. Imaging glutathione depletion in the rat brain using ascorbate-derived hyperpolarized MR and PET probes. Sci. Rep. 2018, 8, 7928. [Google Scholar] [CrossRef] [PubMed] [Green Version]
  56. Kadl, A.; Meher, A.K.; Sharma, P.R.; Lee, M.Y.; Doran, A.C.; Johnstone, S.R.; Elliott, M.R.; Gruber, F.; Han, J.; Chen, W.; et al. Identification of a novel macrophage phenotype that develops in response to atherogenic phospholipids via Nrf2. Circ. Res. 2010, 107, 737–746. [Google Scholar] [CrossRef]
  57. Vera, J.C.; Rivas, C.I.; Fischbarg, J.; Golde, D.W. Mammalian facilitative hexose transporters mediate the transport of dehydroascorbic acid. Nature 1993, 364, 79–82. [Google Scholar] [CrossRef] [PubMed]
  58. Viola, A.; Munari, F.; Sanchez-Rodriguez, R.; Scolaro, T.; Castegna, A. The Metabolic Signature of Macrophage Responses. Front. Immunol. 2019, 10, 1462. [Google Scholar] [CrossRef] [Green Version]
  59. Obaid, M.; Udden, S.M.N.; Alluri, P.; Mandal, S.S. LncRNA HOTAIR regulates glucose transporter Glut1 expression and glucose uptake in macrophages during inflammation. Sci. Rep. 2021, 11, 232. [Google Scholar] [CrossRef]
  60. Satomi, T.; Ogawa, M.; Mori, I.; Ishino, S.; Kubo, K.; Magata, Y.; Nishimoto, T. Comparison of contrast agents for atherosclerosis imaging using cultured macrophages: FDG versus ultrasmall superparamagnetic iron oxide. J. Nucl. Med. 2013, 54, 999–1004. [Google Scholar] [CrossRef] [Green Version]
  61. Autry, A.W.; Gordon, J.W.; Carvajal, L.; Mareyam, A.; Chen, H.Y.; Park, I.; Mammoli, D.; Vareth, M.; Chang, S.M.; Wald, L.L.; et al. Comparison between 8- and 32-channel phased-array receive coils for in vivo hyperpolarized (13) C imaging of the human brain. Magn. Reson. Med. 2019, 82, 833–841. [Google Scholar] [CrossRef]
  62. Chung, B.T.; Chen, H.Y.; Gordon, J.; Mammoli, D.; Sriram, R.; Autry, A.W.; Le Page, L.M.; Chaumeil, M.M.; Shin, P.; Slater, J.; et al. First hyperpolarized [2-(13)C]pyruvate MR studies of human brain metabolism. J. Magn. Reson. 2019, 309, 106617. [Google Scholar] [CrossRef] [PubMed]
  63. Gordon, J.W.; Chen, H.Y.; Autry, A.; Park, I.; Van Criekinge, M.; Mammoli, D.; Milshteyn, E.; Bok, R.; Xu, D.; Li, Y.; et al. Translation of Carbon-13 EPI for hyperpolarized MR molecular imaging of prostate and brain cancer patients. Magn. Reson. Med. 2019, 81, 2702–2709. [Google Scholar] [CrossRef] [PubMed]
  64. Lee, C.Y.; Soliman, H.; Geraghty, B.J.; Chen, A.P.; Connelly, K.A.; Endre, R.; Perks, W.J.; Heyn, C.; Black, S.E.; Cunningham, C.H. Lactate topography of the human brain using hyperpolarized (13)C-MRI. Neuroimage 2019, 204, 116202. [Google Scholar] [CrossRef] [PubMed]
  65. Miloushev, V.Z.; Granlund, K.L.; Boltyanskiy, R.; Lyashchenko, S.K.; DeAngelis, L.M.; Mellinghoff, I.K.; Brennan, C.W.; Tabar, V.; Yang, T.J.; Holodny, A.I.; et al. Metabolic Imaging of the Human Brain with Hyperpolarized (13)C Pyruvate Demonstrates (13)C Lactate Production in Brain Tumor Patients. Cancer Res. 2018, 78, 3755–3760. [Google Scholar] [CrossRef] [PubMed] [Green Version]
  66. Park, I.; Larson, P.E.Z.; Gordon, J.W.; Carvajal, L.; Chen, H.Y.; Bok, R.; Van Criekinge, M.; Ferrone, M.; Slater, J.B.; Xu, D.; et al. Development of methods and feasibility of using hyperpolarized carbon-13 imaging data for evaluating brain metabolism in patient studies. Magn. Reson. Med. 2018, 80, 864–873. [Google Scholar] [CrossRef] [Green Version]
  67. Gallagher, F.A.; Woitek, R.; McLean, M.A.; Gill, A.B.; Manzano Garcia, R.; Provenzano, E.; Riemer, F.; Kaggie, J.; Chhabra, A.; Ursprung, S.; et al. Imaging breast cancer using hyperpolarized carbon-13 MRI. Proc. Natl. Acad. Sci. USA 2020, 117, 2092–2098. [Google Scholar] [CrossRef] [Green Version]
  68. Granlund, K.L.; Tee, S.S.; Vargas, H.A.; Lyashchenko, S.K.; Reznik, E.; Fine, S.; Laudone, V.; Eastham, J.A.; Touijer, K.A.; Reuter, V.E.; et al. Hyperpolarized MRI of Human Prostate Cancer Reveals Increased Lactate with Tumor Grade Driven by Monocarboxylate Transporter 1. Cell Metab. 2020, 31, 105–114.e3. [Google Scholar] [CrossRef]
  69. Grist, J.T.; Hansen, E.S.S.; Sanchez-Heredia, J.D.; McLean, M.A.; Tougaard, R.; Riemer, F.; Schulte, R.F.; Kaggie, J.D.; Ardenkjaer-Larsen, J.H.; Laustsen, C.; et al. Creating a clinical platform for carbon-13 studies using the sodium-23 and proton resonances. Magn. Reson. Med. 2020, 84, 1817–1827. [Google Scholar] [CrossRef] [Green Version]
  70. Woitek, R.; McLean, M.A.; Gill, A.B.; Grist, J.T.; Provenzano, E.; Patterson, A.J.; Ursprung, S.; Torheim, T.; Zaccagna, F.; Locke, M.; et al. Hyperpolarized (13)C MRI of Tumor Metabolism Demonstrates Early Metabolic Response to Neoadjuvant Chemotherapy in Breast Cancer. Radiol. Imaging Cancer 2020, 2, e200017. [Google Scholar] [CrossRef]
  71. Heller, N.M.; Qi, X.; Junttila, I.S.; Shirey, K.A.; Vogel, S.N.; Paul, W.E.; Keegan, A.D. Type I IL-4Rs selectively activate IRS-2 to induce target gene expression in macrophages. Sci. Signal. 2008, 1, ra17. [Google Scholar] [CrossRef] [Green Version]
  72. Wang, F.; Zhang, S.; Jeon, R.; Vuckovic, I.; Jiang, X.; Lerman, A.; Folmes, C.D.; Dzeja, P.D.; Herrmann, J. Interferon Gamma Induces Reversible Metabolic Reprogramming of M1 Macrophages to Sustain Cell Viability and Pro-Inflammatory Activity. EBioMedicine 2018, 30, 303–316. [Google Scholar] [CrossRef] [PubMed] [Green Version]
  73. Larson, P.E.Z.; Bok, R.; Kerr, A.B.; Lustig, M.; Hu, S.; Chen, A.P.; Nelson, S.J.; Pauly, J.M.; Kurhanewicz, J.; Vigneron, D.B. Investigation of tumor hyperpolarized [1-13C]-pyruvate dynamics using time-resolved multiband RF excitation echo-planar MRSI. Magn. Reson. Med. 2010, 63, 582–591. [Google Scholar] [CrossRef] [PubMed] [Green Version]
  74. Sapcariu, S.C.; Kanashova, T.; Weindl, D.; Ghelfi, J.; Dittmar, G.; Hiller, K. Simultaneous extraction of proteins and metabolites from cells in culture. MethodsX 2014, 1, 74–80. [Google Scholar] [CrossRef] [PubMed]
  75. de Graaf, R.A.; Brown, P.B.; McIntyre, S.; Nixon, T.W.; Behar, K.L.; Rothman, D.L. High magnetic field water and metabolite proton T1 and T2 relaxation in rat brain in vivo. Magn. Reson. Med. 2006, 56, 386–394. [Google Scholar] [CrossRef]
  76. Wishart, D.S.; Feunang, Y.D.; Marcu, A.; Guo, A.C.; Liang, K.; Vázquez-Fresno, R.; Sajed, T.; Johnson, D.; Li, C.; Karu, N.; et al. HMDB 4.0: The human metabolome database for 2018. Nucleic Acids Res. 2018, 46, D608–D617. [Google Scholar] [CrossRef]
Figure 1. Overall design. (A) Schematic of hyperpolarized 13C probes and their metabolic fates in J774a.1 macrophages. LDH = lactate dehydrogenase; PDH = pyruvate dehydrogenase; TCA = tricarboxylic acid cycle; GSH = glutathione; GSSG = glutathione disulfide; ROS = reactive oxygen species. (B) Overall experimental design of the study. Activation was achieved with either lipopolysaccharide (LPS, M1 activation) or interleukin-13 (IL-13, M2 activation). Control and M1/M2 activated samples were paired for HP studies and for spectrophotometric assays. N = number of repeats.
Metabolites 11 00410 g001
Figure 2. HP [1-13C]lactate production is differentially increased by M1/M2 macrophage activation. (A) Dynamic spectra acquired at 1.47 Tesla post HP [1-13C]pyruvate injection into M1-activated J774a.1 macrophages, and corresponding sum spectra over 100 TRs in background. Insert shows HP [1-13C]lactate dynamics. († symmetric splitting of pyruvate due to 1.1% 13C natural abundance in C2 position; # alanine peak; * contaminants). (B) Signal to noise ratio (SNR) of HP [1-13C]pyruvate decay from all injections (black, left y-axis) and HP [1-13C]lactate production (right y-axis) in M1-activated (red), M2-activated (orange), and control cells (blue) over 120 s. (C) HP lactate-to-pyruvate ratios measured in controls (blue) and their activation pairs (M1-activated red, M2-activated orange) (Non Significant NS: p = 0.1866, ** p < 0.01, *** p < 0.001).
Metabolites 11 00410 g002
Figure 3. HP [1-13C]AA production is increased with M1 activation. (A) Dynamic spectra acquired at 1.47 Tesla post HP [1-13C]DHA injection into M1-activated J774a.1 macrophages, and sum spectra over 100 TRs in background (‡ contaminants). (B) Signal-to-noise ratio (SNR) of HP [1-13C]DHA decay from all injections (black, left y-axis) and HP [1-13C]AA production (right y-axis) in M1-activated (red), M2-activated (orange), and control cells (blue) over 120 s. (C) HP AA-to-DHA ratios measured in controls (blue) and their activation pairs (M1-activated red, M2-activated orange) (NS: p = 0.9581, * p < 0.05, ** p < 0.01).
Metabolites 11 00410 g003
Figure 4. LDH and PDH activities are differentially modulated with M1/M2 activation (A) Lactate dehydrogenase (LDH) enzyme activity for control (blue), M1-activated (red), and M2-activated (orange) macrophages (* p < 0.05, ** p < 0.01, normalized to protein concentration). (B) Pyruvate dehydrogenase (PDH) enzyme activity measured by spectrophotometry for control (blue), M1-activated (red), and M2-activated (orange) macrophages (* p < 0.05, ** p < 0.01, normalized to protein concentration). (C) Reduced glutathione (GSH) over oxidized glutathione (glutathione disulfide, GSSH) GSH/GSSG ratio per 105 cells for control (blue), M1-activated (red), and M2-activated (orange) macrophages (NS control vs. M1: p = 0.1265; NS control vs. M2: p = 0.8326; NS M1 vs. M2: p = 0.1083).
Metabolites 11 00410 g004
Figure 5. High resolution 1H NMR detects significant differences in extracted metabolites between control, M1, and M2 macrophages. (A) Representative high resolution 1H NMR 1D NOESY spectra of control (blue), M1-activated (red), and M2-activated (orange) J774a.1 macrophage extracts (water region omitted; normalized to cell number with axes scaled identically). (B) Metabolite concentrations between control (blue; N = 4), M1-activated (red; N = 5), and M2-activated (orange; N = 5) determined from 1H NMR data. Data reported in log for purpose of presentation, with statistics performed on metabolite concentration (µM) normalized to cell number and TSP. Significance from two-way ANOVA shown between relevant groups with * p < 0.05, ** p < 0.01, *** p < 0.001, **** p < 0.0001.
Metabolites 11 00410 g005
Table 1. Metabolite concentrations for control (blue), M1-activated (red), and M2-activated (orange) J774a.1 macrophages, calculated from high resolution 800 MHz 1H NMR spectra of J774a.1 macrophage extracts. Concentration is reported as mean ± standard deviation. N.B.: Metabolites with any significance between groups are underlined and italicized, with p-values for significant differences shown in Figure 5B.
J774a.1 Non-Activated vs. Activated Metabolite Concentrations (µM)
MetaboliteControlM1-ActivatedM2-Activated
Acetate27 ± 12.726.52 ± 11.115.18 ± 6.58
Alanine54.91 ± 24.336.48 ± 9.3443.02 ± 7.98
Arginine20.37 ± 7.6826.17 ± 7.2414.28 ± 4.75
Aspartate76.93 ± 36.121.05 ± 20.8950.57 ± 10.53
Choline5.86 ± 2.2313.13 ± 12.52.58 ± 0.72
Citrate21.16 ± 10.5710.03 ± 2.6911.76 ± 2.38
Creatine16.72 ± 7.5422.59 ± 4.3113.69 ± 3.45
Glutamate111.09 ± 54.1449.98 ± 6.8969.95 ± 14.23
Glutamine36.97 ± 14.9978.15 ± 31.5624.51 ± 7.28
Glutathione48.79 ± 19.1668.46 ± 26.9446.3 ± 17.43
Itaconic acid2.13 ± 1.7440.27 ± 4.590.74 ± 0.71
Lactate406.03 ± 83.92748.64 ± 310.05280.91 ± 49.32
NAD6.2 ± 1.453.93 ± 1.092.94 ± 0.45
Succinate4.93 ± 5.8119.86 ± 1.43.38 ± 1.34
Taurine90.85 ± 21.66244.7 ± 92.42113.2 ± 49.72
Publisher’s Note: MDPI stays neutral with regard to jurisdictional claims in published maps and institutional affiliations.

