
Fructose Causes Liver Damage, Polyploidy, and Dysplasia in the Setting of Short Telomeres and p53 Loss

 ,
,
Abstract
:1. Introduction
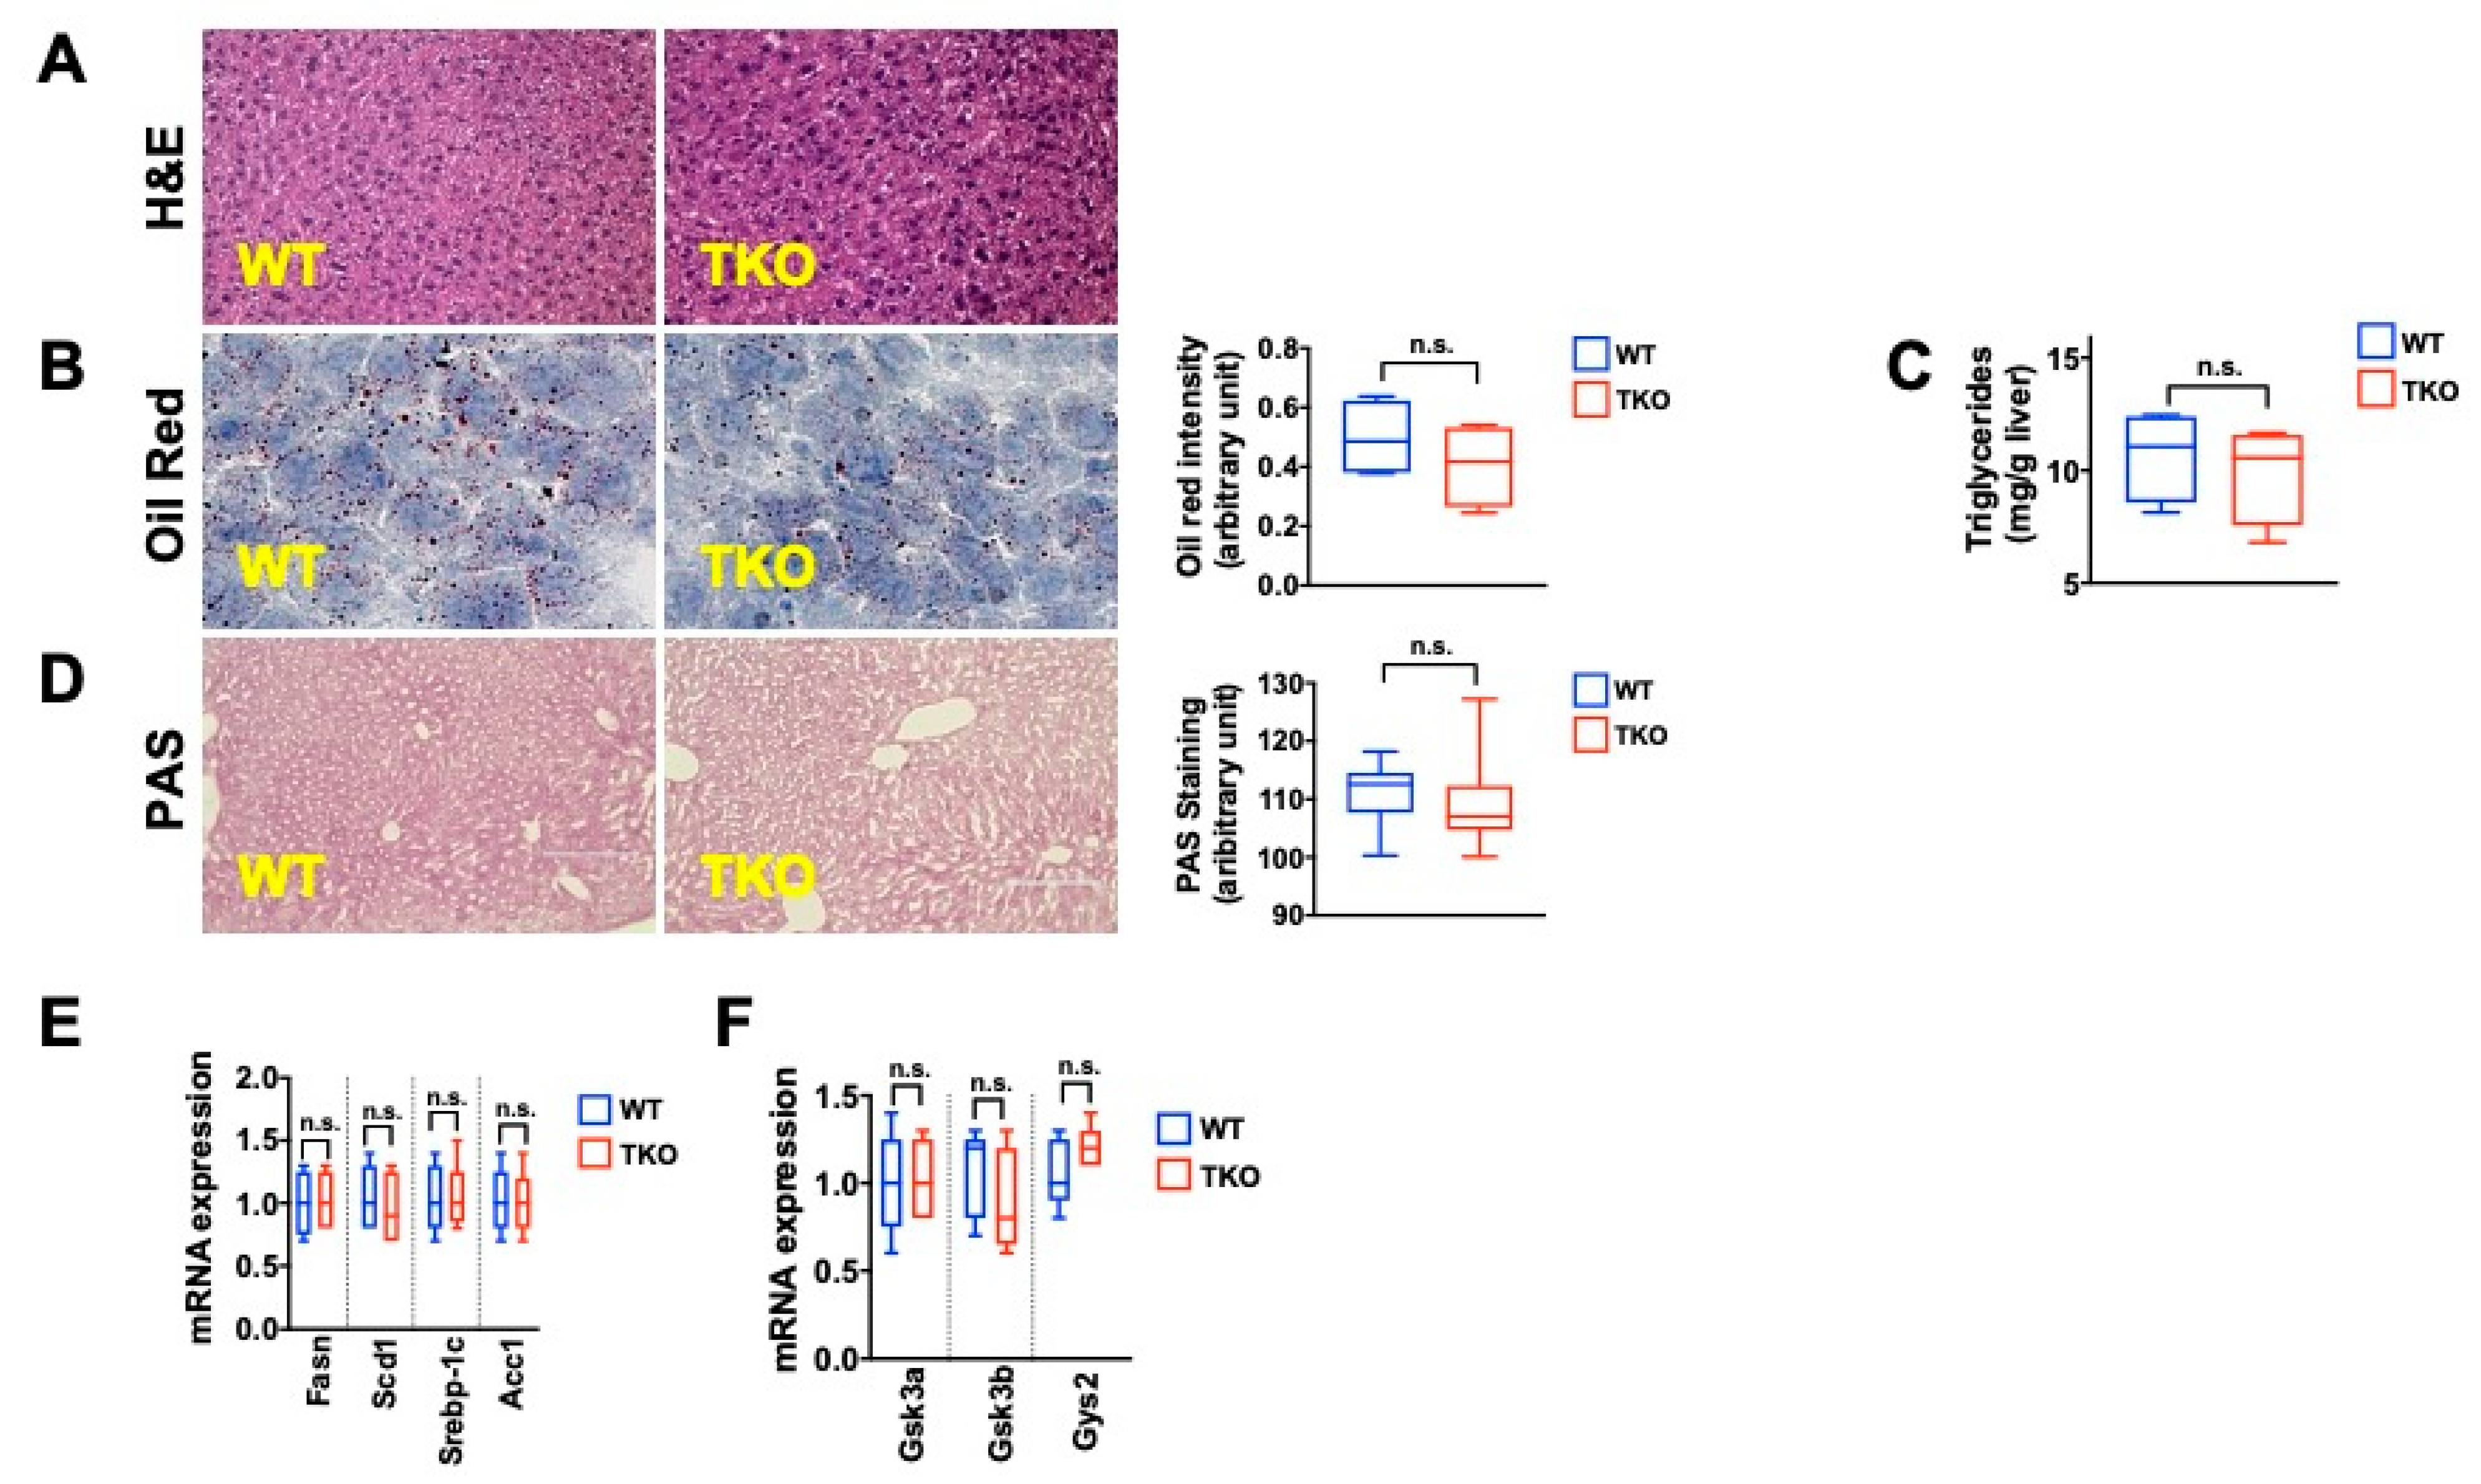
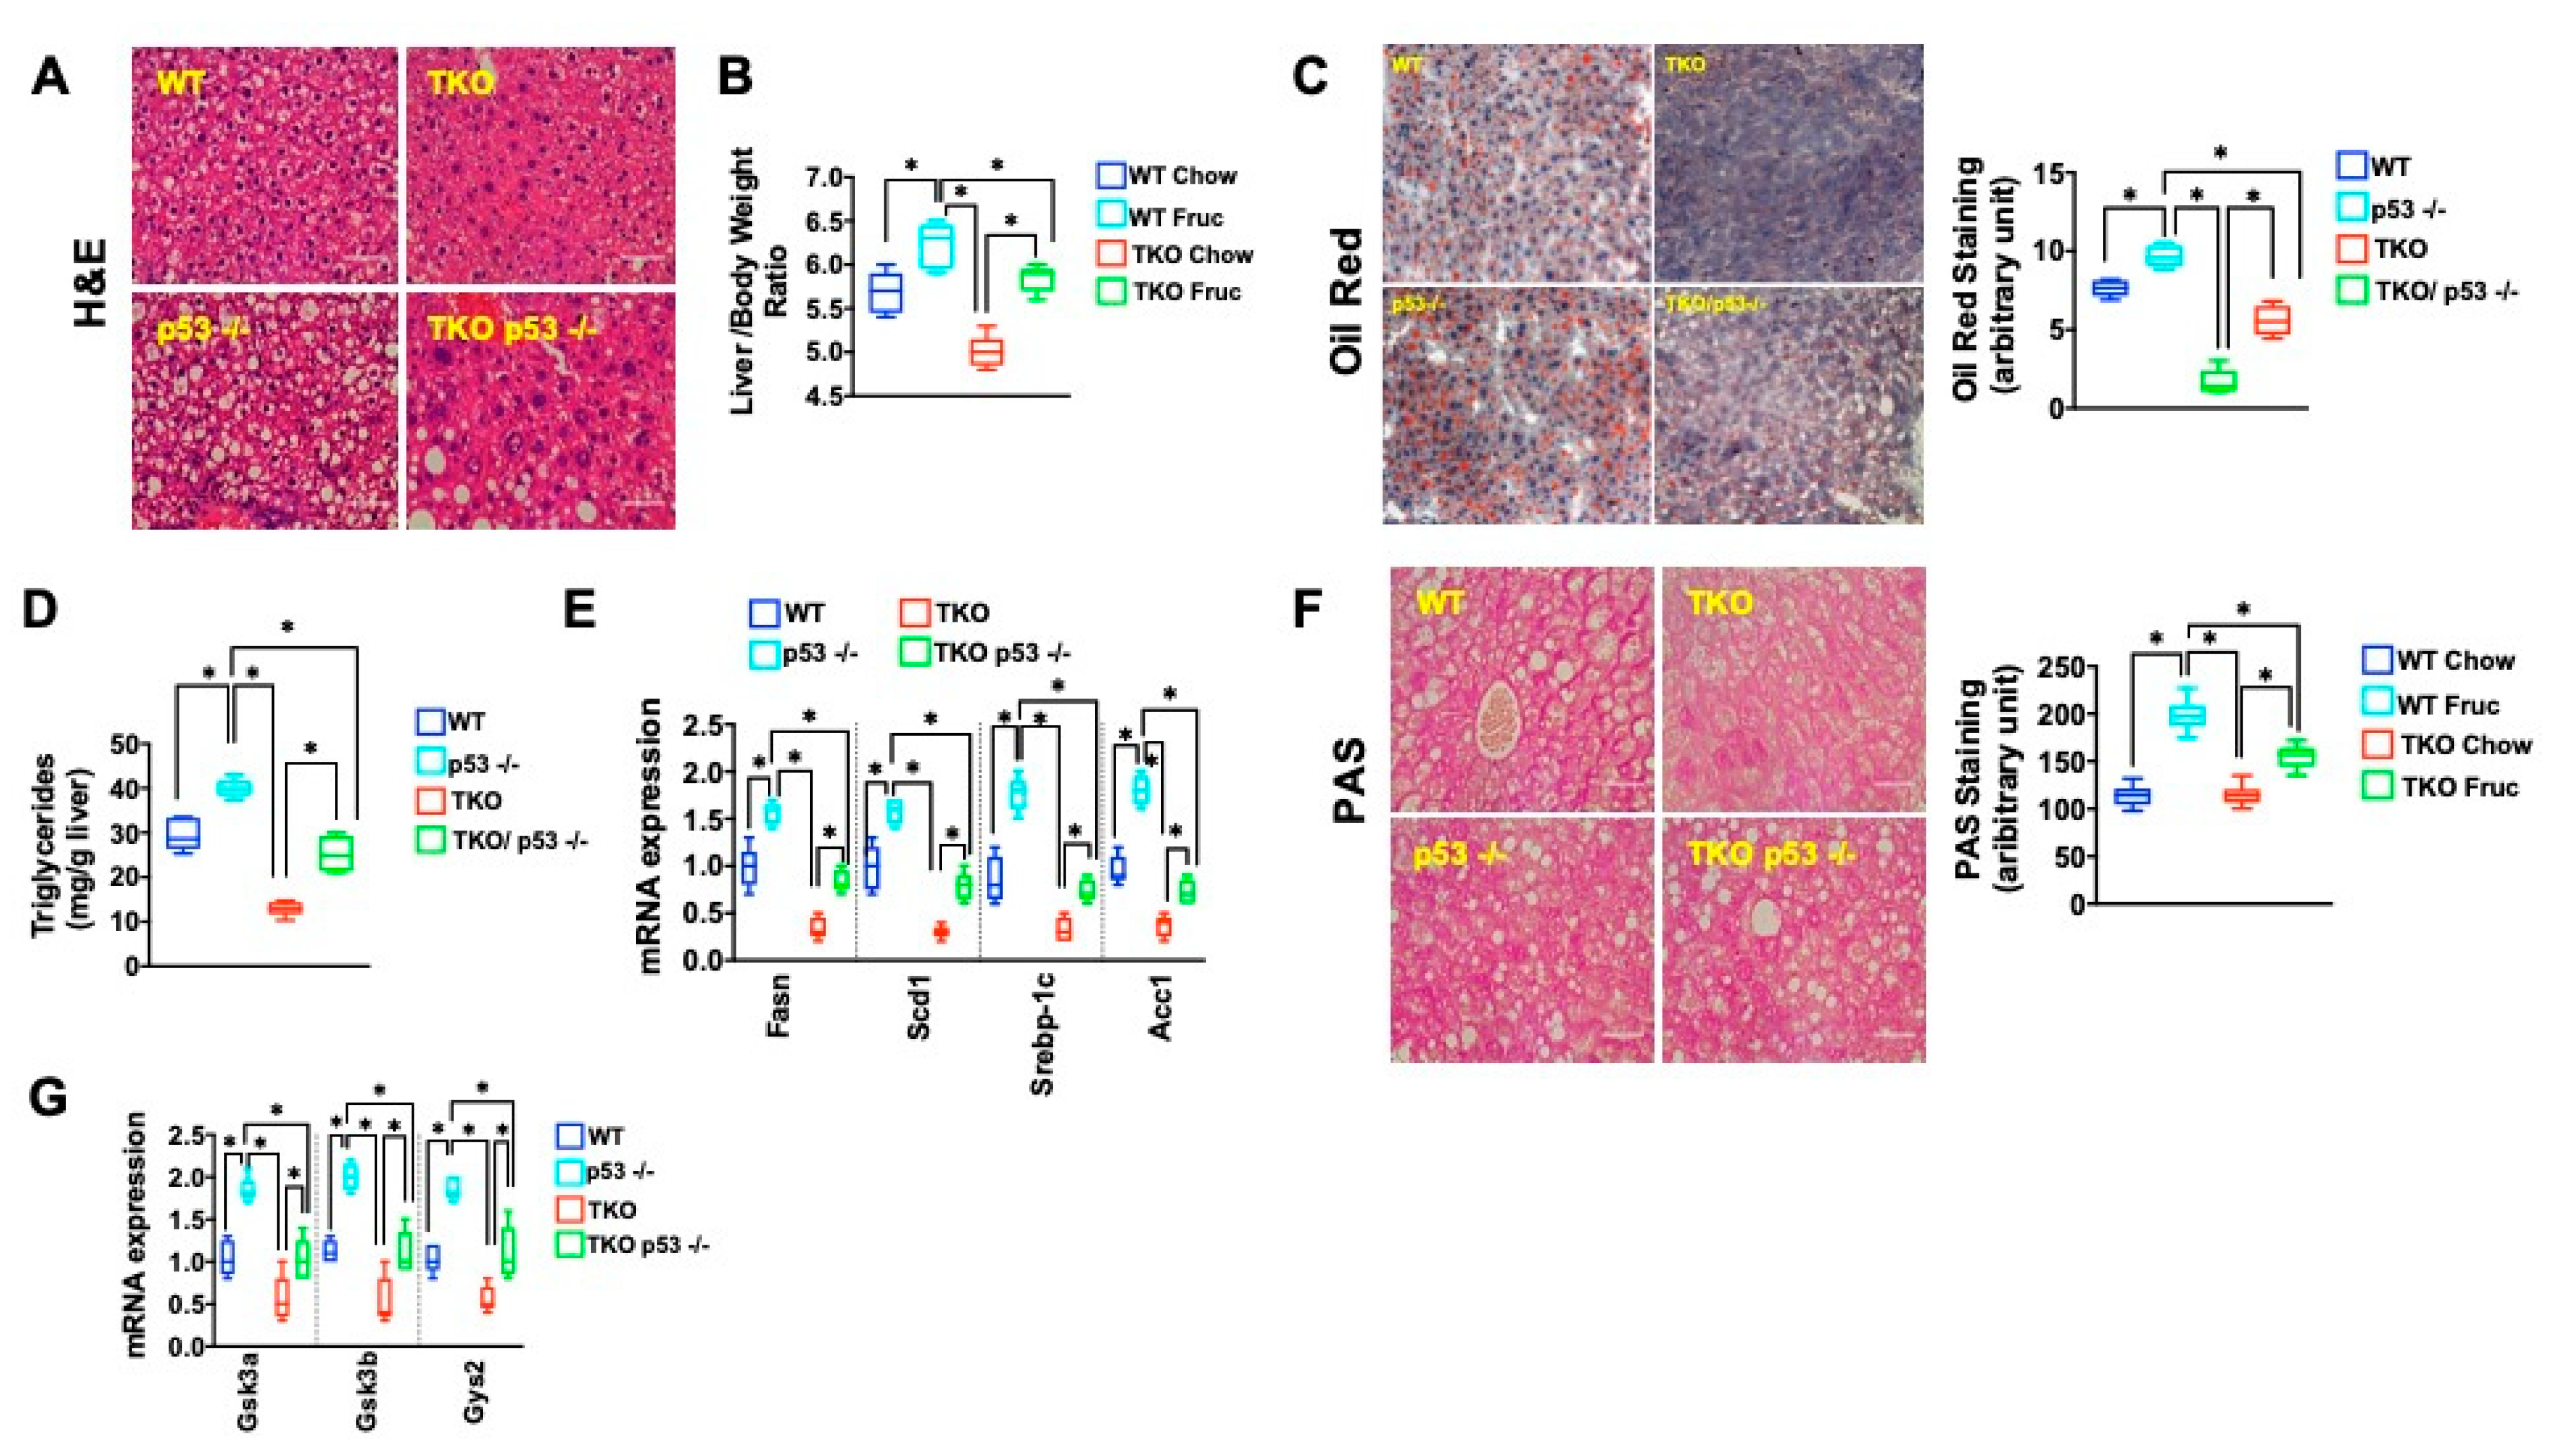
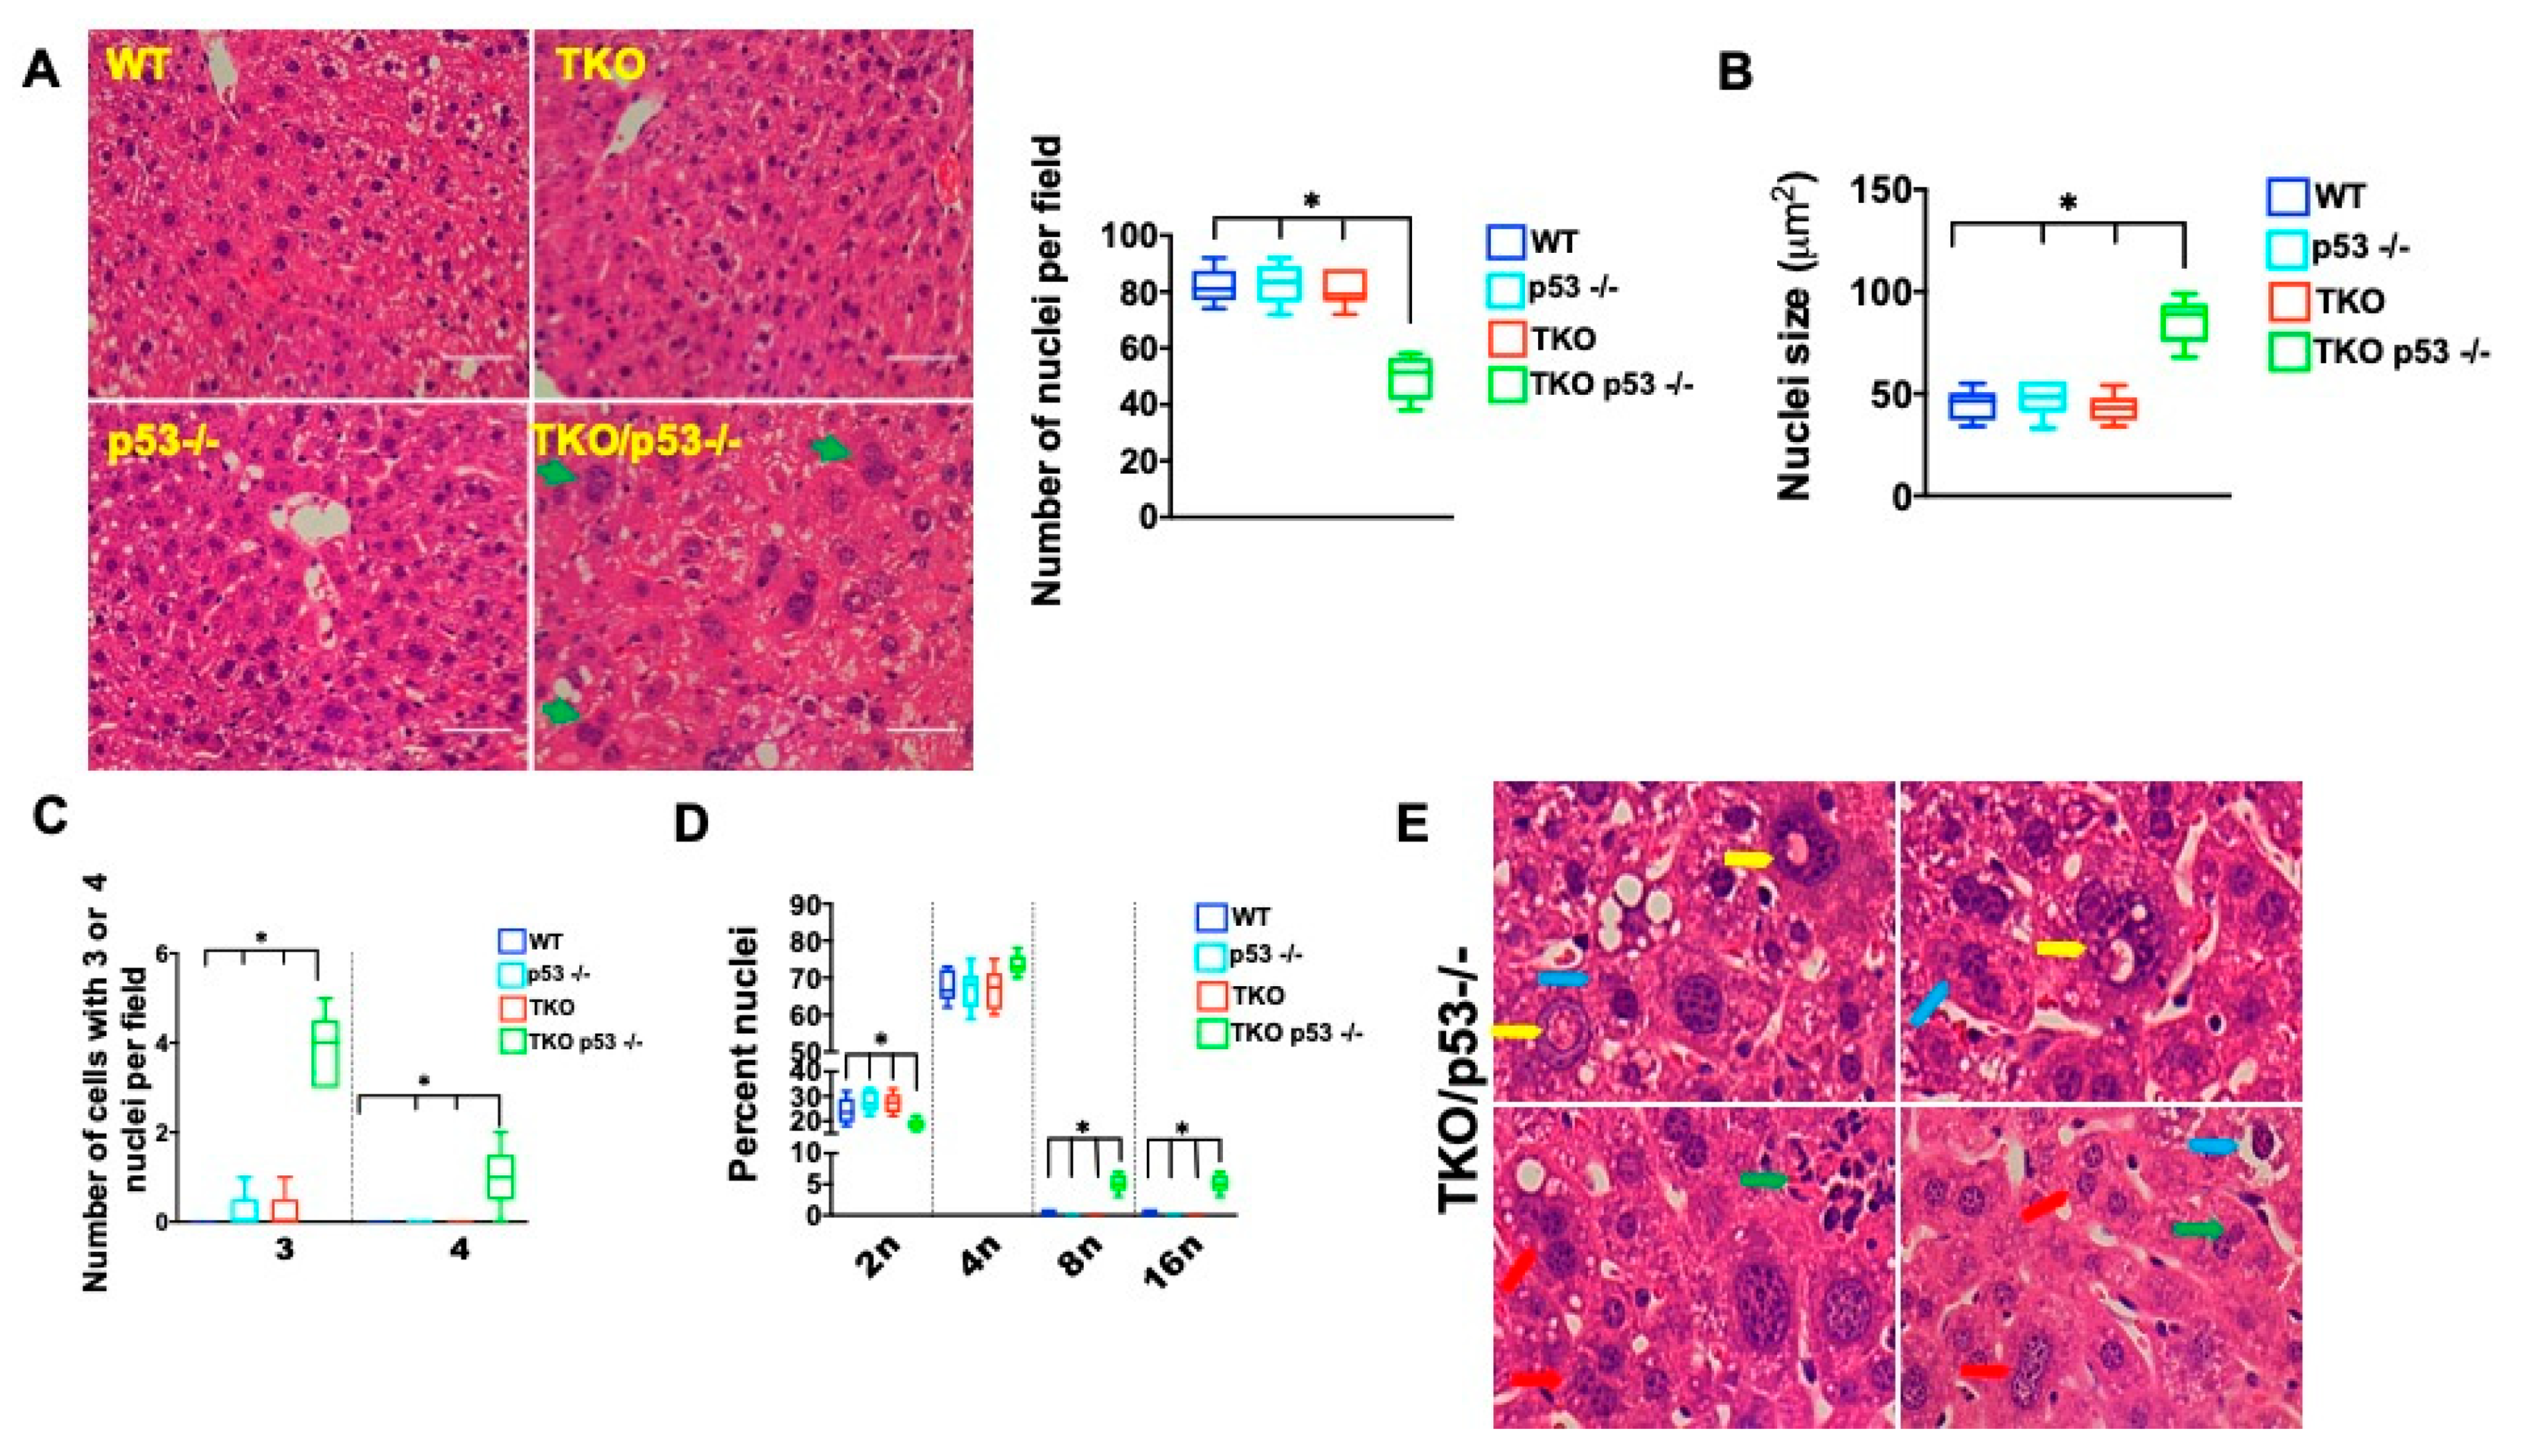
2. Results
3. Discussion
4. Materials and Methods
4.1. Mice
4.1.1. TERT Deficient Mice
4.1.2. TERT/p53 −/− Double Mutant Mice
4.1.3. TERT/p53 fl/fl/AlbCre Mice
4.2. AAV Experiments to Generate Liver Specific p53 Null Mice
4.3. Fructose Diet
4.4. CLAMS Analysis
4.5. Assays for Liver Function
4.6. RNA Isolation, cDNA Synthesis, and Real-Time PCR
4.7. Immunoblotting
4.8. Histology and Immunohistochemistry
4.9. Immunofluorescence
4.10. Fibrosis Studies
4.10.1. Sirius Red
4.10.2. Hepatic Hydroxyproline Content
4.11. Ploidy Determination
4.12. Statistics
Supplementary Materials
Author Contributions
Funding
Institutional Review Board Statement
Informed Consent Statement
Data Availability Statement
Conflicts of Interest
References
- Blackburn, E.H.; Gall, J.G. A tandemly repeated sequence at the termini of the extrachromosomal ribosomal RNA genes in Tetrahymena. J. Mol. Biol. 1978, 120, 33–53. [Google Scholar] [CrossRef]
- Szostak, J.W.; Blackburn, E.H. Cloning yeast telomeres on linear plasmid vectors. Cell 1982, 29, 245–255. [Google Scholar] [CrossRef]
- Greider, C.; Blackburn, E.H. Identification of a specific telomere terminal transferase activity in tetrahymena extracts. Cell 1985, 43, 405–413. [Google Scholar] [CrossRef]
- Greider, C.; Blackburn, E.H. The telomere terminal transferase of tetrahymena is a ribonucleoprotein enzyme with two kinds of primer specificity. Cell 1987, 51, 887–898. [Google Scholar] [CrossRef]
- Greider, C.; Blackburn, E.H. A telomeric sequence in the RNA of Tetrahymena telomerase required for telomere repeat synthesis. Nat. Cell Biol. 1989, 337, 331–337. [Google Scholar] [CrossRef] [PubMed]
- Harley, C.B.; Futcher, A.B.; Greider, C. Telomeres shorten during ageing of human fibroblasts. Nat. Cell Biol. 1990, 345, 458–460. [Google Scholar] [CrossRef] [PubMed]
- Hastie, N.D.; Dempster, M.; Dunlop, M.G.; Thompson, A.M.; Green, D.K.; Allshire, R.C. Telomere reduction in human colorectal carcinoma and with ageing. Nat. Cell Biol. 1990, 346, 866–868. [Google Scholar] [CrossRef] [PubMed]
- Takai, H.; Smogorzewska, A.; de Lange, T. DNA Damage Foci at Dysfunctional Telomeres. Curr. Biol. 2003, 13, 1549–1556. [Google Scholar] [CrossRef] [Green Version]
- di Fagagna, F.D.; Reaper, P.M.; Clay-Farrace, L.; Fiegler, H.; Carr, P.; von Zglinicki, T.; Saretzki, G.; Carter, N.P.; Jackson, S.P. A DNA damage checkpoint response in telomere-initiated senescence. Nature 2003, 426, 194–198. [Google Scholar] [CrossRef]
- Bodnar, A.G.; Ouellette, M.; Frolkis, M.; Holt, S.E.; Chiu, C.-P.; Morin, G.; Harley, C.B.; Shay, J.W.; Lichtsteiner, S.; Wright, W.E. Extension of Life-Span by Introduction of Telomerase into Normal Human Cells. Science 1998, 279, 349–352. [Google Scholar] [CrossRef] [Green Version]
- Chin, L.; Artandi, S.E.; Shen, Q.; Tam, A.; Lee, S.-L.; Gottlieb, G.J.; Greider, C.W.; DePinho, R.A. p53 deficiency rescues the adverse effects of telomere loss and cooperates with telomere dysfunction to acceler-ate carcinogenesis. Cell 1999, 97, 527–538. [Google Scholar] [CrossRef] [Green Version]
- Herbig, U.; Ajobling, W.; Chen, B.P.; Chen, D.J.; Sedivy, J.M. Telomere Shortening Triggers Senescence of Human Cells through a Pathway Involving ATM, p53, and p21CIP1, but Not p16INK4a. Mol. Cell 2004, 14, 501–513. [Google Scholar] [CrossRef]
- Armanios, M.; Blackburn, E.H. The telomere syndromes. Nat. Rev. Genet. 2012, 13, 693–704. [Google Scholar] [CrossRef]
- Sahin, E.; Depinho, R.A. Linking functional decline of telomeres, mitochondria and stem cells during ageing. Nat. Cell Biol. 2010, 464, 520–528. [Google Scholar] [CrossRef]
- Donate, L.E.; Blasco, M.A. Telomeres in cancer and ageing. Philos. Trans. R. Soc. B 2011, 366, 76–84. [Google Scholar] [CrossRef] [PubMed]
- O’Sullivan, J.N.; Bronner, M.P.; Brentnall, T.A.; Finley, J.C.; Shen, W.-T.; Emerson, S.; Emond, M.J.; Gollahon, K.A.; Moskovitz, A.H.; Crispin, D.A.; et al. Chromosomal instability in ulcerative colitis is related to telomere shortening. Nat. Genet. 2002, 32, 280–284. [Google Scholar] [CrossRef] [PubMed]
- Risques, R.A.; Rabinovitch, P.S.; Brentnall, T.A. Cancer surveillance in inflammatory bowel disease: New molecular approaches. Curr. Opin. Gastroenterol. 2006, 22, 382–390. [Google Scholar] [CrossRef] [PubMed]
- Risques, R.A.; Lai, L.A.; Brentnall, T.A.; Li, L.; Feng, Z.; Gallaher, J.; Mandelson, M.T.; Potter, J.D.; Bronner, M.P.; Rabinovitch, P.S. Ulcerative Colitis Is a Disease of Accelerated Colon Aging: Evidence From Telomere Attrition and DNA Damage. Gastroenterology 2008, 135, 410–418. [Google Scholar] [CrossRef] [Green Version]
- Vallejo, A.N. T-cell senescence: A culprit of immune abnormalities in chronic inflammation and persistent infection. Trends Mol. Med. 2004, 10, 119–124. [Google Scholar] [CrossRef]
- Armanios, M. Telomerase and idiopathic pulmonary fibrosis. Mutat. Res. 2012, 730, 52–58. [Google Scholar] [CrossRef]
- Armanios, M. Syndromes of Telomere Shortening. Annu. Rev. Genom. Hum. Genet. 2009, 10, 45–61. [Google Scholar] [CrossRef] [PubMed] [Green Version]
- Calado, R.T.; Young, N.S. Telomere Diseases. N. Engl. J. Med. 2009, 361, 2353–2365. [Google Scholar] [CrossRef] [PubMed]
- Garcia, C.K.; Wright, W.E.; Shay, J.W. Human diseases of telomerase dysfunction: Insights into tissue aging. Nucleic Acids Res. 2007, 35, 7406–7416. [Google Scholar] [CrossRef] [PubMed] [Green Version]
- Choudhury, A.R.; Ju, Z.; Djojosubroto, M.W.; Schienke, A.; Lechel, A.; Schaetzlein, S.; Jiang, H.; Stepczynska, A.; Wang, C.; Buer, J.; et al. Cdkn1a deletion improves stem cell function and lifespan of mice with dysfunctional telomeres without accelerating cancer formation. Nat. Genet. 2006, 39, 99–105. [Google Scholar] [CrossRef]
- Sperka, T.; Wang, J.; Rudolph, K.L. DNA damage checkpoints in stem cells, ageing and cancer. Nat. Rev. Mol. Cell Biol. 2012, 13, 579–590. [Google Scholar] [CrossRef] [PubMed]
- Savage, S.A.; Bertuch, A.A. The genetics and clinical manifestations of telomere biology disorders. Genet. Med. 2010, 12, 753–764. [Google Scholar] [CrossRef] [Green Version]
- Savage, S.A.; Dokal, I.; Armanios, M.; Aubert, G.; Cowen, E.W.; Domingo, D.L.; Giri, N.; Greene, M.H.; Orchard, P.J.; Tolar, J.; et al. Dyskeratosis congenita: The first NIH clinical research workshop. Pediatr. Blood Cancer 2009, 53, 520–523. [Google Scholar] [CrossRef] [Green Version]
- Iredale, J. Defining therapeutic targets for liver fibrosis: Exploiting the biology of inflammation and repair. Pharmacol. Res. 2008, 58, 129–136. [Google Scholar] [CrossRef]
- Savage, S.A. Human Telomeres and Telomere Biology Disorders. Prog. Mol. Biol. Transl. Sci. 2014, 125, 41–66. [Google Scholar] [CrossRef]
- Sheka, A.C.; Adeyi, O.; Thompson, J.; Hameed, B.; Crawford, P.A.; Ikramuddin, S. Nonalcoholic Steatohepatitis. JAMA 2020, 323, 1175–1183. [Google Scholar] [CrossRef]
- Younossi, Z.; Anstee, Q.M.; Marietti, M.; Hardy, T.; Henry, L.; Eslam, M.; George, J.; Bugianesi, E. Global burden of NAFLD and NASH: Trends, predictions, risk factors and prevention. Nat. Rev. Gastroenterol. Hepatol. 2018, 15, 11–20. [Google Scholar] [CrossRef]
- Bray, G.A.; Popkin, B. Dietary Sugar and Body Weight: Have We Reached a Crisis in the Epidemic of Obesity and Diabetes? Diabetes Care 2014, 37, 950–956. [Google Scholar] [CrossRef] [PubMed] [Green Version]
- Abdelmalek, M.F.; Suzuki, A.; Guy, C.D.; Unalp-Arida, A.; Colvin, R.; Johnson, R.J.; Diehl, A.M. For the Nonalcoholic Steatohepatitis Clinical Research Network Increased fructose consumption is associated with fibrosis severity in patients with nonalcoholic fatty liver disease. Hepatology 2010, 51, 1961–1971. [Google Scholar] [CrossRef] [Green Version]
- Spruss, A.; Kanuri, G.; Stahl, C.; Bischoff, S.C.; Bergheim, I. Metformin protects against the development of fructose-induced steatosis in mice: Role of the intestinal barrier function. Lab. Investig. 2012, 92, 1020–1032. [Google Scholar] [CrossRef] [PubMed] [Green Version]
- Sellmann, C.; Priebs, J.; Landmann, M.; Degen, C.; Engstler, A.J.; Jin, C.J.; Gärttner, S.; Spruss, A.; Huber, O.; Bergheim, I. Diets rich in fructose, fat or fructose and fat alter intestinal barrier function and lead to the development of nonalcoholic fatty liver disease over time. J. Nutr. Biochem. 2015, 26, 1183–1192. [Google Scholar] [CrossRef]
- Basaranoglu, G. Fructose as a key player in the development of fatty liver disease. World J. Gastroenterol. 2013, 19, 1166–1172. [Google Scholar] [CrossRef]
- Stanhope, K.L.; Schwarz, J.M.; Keim, N.L.; Griffen, S.C.; Bremer, A.A.; Graham, J.; Hatcher, B.; Cox, C.L.; Dyachenko, A.; Zhang, W.; et al. Consuming fructose-sweetened, not glucose-sweetened, beverages increases visceral adiposity and lipids and decreases insulin sensitivity in overweight/obese humans. J. Clin. Investig. 2009, 119, 1322–1334. [Google Scholar] [CrossRef] [Green Version]
- Federico, A.; Rosato, V.; Masarone, M.; Torre, P.; Dallio, M.; Romeo, M.; Persico, M. The Role of Fructose in Non-Alcoholic Steatohepatitis: Old Relationship and New Insights. Nutrition 2021, 13, 1314. [Google Scholar] [CrossRef]
- Samuel, V.T. Fructose induced lipogenesis: From sugar to fat to insulin resistance. Trends Endocrinol. Metab. 2011, 22, 60–65. [Google Scholar] [CrossRef]
- Sahin, E.; Colla, S.; Liesa, M.; Moslehi, J.; Müller, F.L.; Guo, M.; Cooper, M.; Kotton, D.N.; Fabian, A.J.; Walkley, C.; et al. Telomere dysfunction induces metabolic and mitochondrial compromise. Nature 2011, 470, 359–365. [Google Scholar] [CrossRef] [Green Version]
- Amano, H.; Chaudhury, A.; Rodriguez-Aguayo, C.; Lu, L.; Akhanov, V.; Catic, A.; Popov, Y.V.; Verdin, E.; Johnson, H.; Stossi, F.; et al. Telomere Dysfunction Induces Sirtuin Repression that Drives Telomere-Dependent Disease. Cell Metab. 2019, 29, 1274–1290. [Google Scholar] [CrossRef]
- Dong, K.; Zhang, Y.; Huang, J.-J.; Xia, S.-S.; Yang, Y. Shorter leucocyte telomere length as a potential biomarker for nonalcoholic fatty liver disease-related advanced fibrosis in T2DM patients. Ann. Transl. Med. 2020, 8, 308. [Google Scholar] [CrossRef]
- Lechel, A.; Manns, M.P.; Rudolph, K.L. Telomeres and telomerase: New targets for the treatment of liver cirrhosis and hepatocellular carcinoma. J. Hepatol. 2004, 41, 491–497. [Google Scholar] [CrossRef]
- Farazi, P.A.; Glickman, J.; Horner, J.; Depinho, R.A. Cooperative Interactions of p53 Mutation, Telomere Dysfunction, and Chronic Liver Damage in Hepatocellular Carcinoma Progression. Cancer Res. 2006, 66, 4766–4773. [Google Scholar] [CrossRef] [Green Version]
- Jiang, P.; Du, W.; Wang, X.; Mancuso, A.; Gao, X.; Wu, M.; Yang, X. p53 regulates biosynthesis through direct inactivation of glucose-6-phosphate dehydrogenase. Nat. Cell Biol. 2011, 13, 310–316. [Google Scholar] [CrossRef] [Green Version]
- Wang, X.; Zhao, X.; Gao, X.; Mei, Y.; Wu, M. A new role of p53 in regulating lipid metabolism. J. Mol. Cell Biol. 2012, 5, 147–150. [Google Scholar] [CrossRef] [PubMed] [Green Version]
- Davoli, T.; de Lange, T. The causes and consequences of polyploidy in normal development and cancer. Annu. Rev. Cell Dev. Biol. 2011, 27, 585–610. [Google Scholar] [CrossRef] [PubMed] [Green Version]
- Davoli, T.; Denchi, E.L.; de Lange, T. Persistent Telomere Damage Induces Bypass of Mitosis and Tetraploidy. Cell 2010, 141, 81–93. [Google Scholar] [CrossRef] [PubMed] [Green Version]
- Sheahan, S.; Bellamy, C.O.; Treanor, L.; Harrison, D.J.; Prost, S. Additive effect of p53, p21 and Rb deletion in triple knockout primary hepatocytes. Oncogene 2003, 23, 1489–1497. [Google Scholar] [CrossRef] [Green Version]
- Lim, J.S.; Mietus-Snyder, M.; Valente, A.; Schwarz, J.-M.; Lustig, R.H. The role of fructose in the pathogenesis of NAFLD and the metabolic syndrome. Nat. Rev. Gastroenterol. Hepatol. 2010, 7, 251–264. [Google Scholar] [CrossRef]
- Labuschagne, C.F.; Zani, F.; Vousden, K.H. Control of metabolism by p53—Cancer and beyond. Biochim. Biophys. Acta Bioenerg. 2018, 1870, 32–42. [Google Scholar] [CrossRef]
- Alves-Paiva, R.M.; Kajigaya, S.; Feng, X.; Chen, J.; Desierto, M.; Wong, S.; Townsley, D.M.; Donaires, F.S.; Bertola, A.; Gao, B.; et al. Telomerase enzyme deficiency promotes metabolic dysfunction in murine hepatocytes upon dietary stress. Liver Int. 2017, 38, 144–154. [Google Scholar] [CrossRef]
- Missios, P.; Zhou, Y.; Guachalla, L.M.; Von Figura, G.; Wegner, A.; Chakkarappan, S.R.; Binz, T.; Gompf, A.; Hartleben, G.; Burkhalter, M.; et al. Glucose substitution prolongs maintenance of energy homeostasis and lifespan of telomere dysfunctional mice. Nat. Commun. 2014, 5, 4924. [Google Scholar] [CrossRef] [PubMed] [Green Version]
- Porteiro, B.; Fondevila, M.F.; Delgado, T.C.; Iglesias, C.; Imbernon, M.; Iruzubieta, P.; Crespo, J.; Zabala-Letona, A.; Fernø, J.; González-Terán, B.; et al. Hepatic p63 regulates steatosis via IKKβ/ER stress. Nat. Commun. 2017, 8, 15111. [Google Scholar] [CrossRef]
- Yahagi, N.; Shimano, H.; Matsuzaka, T.; Najima, Y.; Sekiya, M.; Nakagawa, Y.; Ide, T.; Tomita, S.; Okazaki, H.; Tamura, Y.; et al. p53 Activation in Adipocytes of Obese Mice. J. Biol. Chem. 2003, 278, 25395–25400. [Google Scholar] [CrossRef] [Green Version]
- Hockemeyer, D.; Daniels, J.-P.; Takai, H.; De Lange, T. Recent Expansion of the Telomeric Complex in Rodents: Two Distinct POT1 Proteins Protect Mouse Telomeres. Cell 2006, 126, 63–77. [Google Scholar] [CrossRef] [PubMed] [Green Version]
- Kibe, T.; Osawa, G.A.; Keegan, C.E.; de Lange, T. Telomere Protection by TPP1 Is Mediated by POT1a and POT1b. Mol. Cell. Biol. 2010, 30, 1059–1066. [Google Scholar] [CrossRef] [PubMed] [Green Version]
- Denchi, E.L.; Celli, G.; De Lange, T. Hepatocytes with extensive telomere deprotection and fusion remain viable and regenerate liver mass through endoreduplication. Genes Dev. 2006, 20, 2648–2653. [Google Scholar] [CrossRef] [PubMed] [Green Version]
- Kurinna, S.; Stratton, S.A.; Coban, Z.; Schumacher, J.M.; Grompe, M.; Duncan, A.W.; Barton, M.C. p53 regulates a mitotic transcription program and determines ploidy in normal mouse liver. Hepatology 2013, 57, 2004–2013. [Google Scholar] [CrossRef] [Green Version]
- Sansregret, L.; Vanhaesebroeck, B.; Swanton, C. Determinants and clinical implications of chromosomal instability in cancer. Nat. Rev. Clin. Oncol. 2018, 15, 139–150. [Google Scholar] [CrossRef] [Green Version]
- Fujiwara, T.; Bandi, M.; Nitta, M.; Ivanova, E.V.; Bronson, R.T.; Pellman, D. Cytokinesis failure generating tetraploids promotes tumorigenesis in p53-null cells. Nat. Cell Biol. 2005, 437, 1043–1047. [Google Scholar] [CrossRef] [PubMed]
- Jacks, T.; Remington, L.; Williams, B.; Schmitt, E.M.; Halachmi, S.; Bronson, R.T.; Weinberg, R.A. Tumor spectrum analysis in p53-mutant mice. Curr. Biol. 1994, 4, 1–7. [Google Scholar] [CrossRef]
- Marino, S.; Vooijs, M.; Van Der Gulden, H.; Jonkers, J.; Berns, A. Induction of medulloblastomas in p53-null mutant mice by somatic inactivation of Rb in the external granular layer cells of the cerebellum. Genes Dev. 2000, 14, 994–1004. [Google Scholar] [PubMed]
- Postic, C.; Shiota, M.; Niswender, K.D.; Jetton, T.L.; Chen, Y.; Moates, J.M.; Shelton, K.D.; Lindner, J.; Cherrington, A.D.; Magnuson, M.A. Dual roles for glucokinase in glucose homeostasis as determined by liver and pancreatic beta cell-specific gene knock-outs using Cre recombinase. J. Biol Chem. 1999, 274, 305–315. [Google Scholar] [CrossRef] [PubMed] [Green Version]
- Mehlem, A.; Hagberg, C.E.; Muhl, L.; Eriksson, U.; Falkevall, A. Imaging of neutral lipids by oil red O for analyzing the metabolic status in health and disease. Nat. Protoc. 2013, 8, 1149–1154. [Google Scholar] [CrossRef] [PubMed] [Green Version]
- Saitoh, Y.; Terada, N.; Saitoh, S.; Ohno, N.; Fujii, Y.; Ohno, S. Histochemical approach of cryobiopsy for glycogen distribution in living mouse livers under fasting and local circulation loss conditions. Histochem. Cell Biol. 2010, 133, 229–239. [Google Scholar] [CrossRef] [PubMed]
- Serrano, M.; Lin, A.W.; McCurrach, M.E.; Beach, D.; Lowe, S.W. Oncogenic ras Provokes Premature Cell Senescence Associated with Accumulation of p53 and p16INK4a. Cell 1997, 88, 593–602. [Google Scholar] [CrossRef] [Green Version]
- MacKenzie, B.; Henneke, I.; Hezel, S.; Al Alam, D.; El Agha, E.; Chao, C.-M.; Quantius, J.; Wilhelm, J.; Jones, M.; Goth, K.; et al. Attenuating endogenous Fgfr2b ligands during bleomycin-induced lung fibrosis does not compromise murine lung repair. Am. J. Physiol. Cell. Mol. Physiol. 2015, 308, L1014–L1024. [Google Scholar] [CrossRef] [Green Version]
- Loyer, X.; Paradis, V.; Hénique, C.; Vion, A.-C.; Colnot, N.; Guerin, C.L.; Devue, C.; On, S.; Scetbun, J.; Romain, M.; et al. Liver microRNA-21 is overexpressed in non-alcoholic steatohepatitis and contributes to the disease in experimental models by inhibiting PPARα expression. Gut 2016, 65, 1882–1894. [Google Scholar] [CrossRef] [Green Version]
- Overturf, K.; Al-Dhalimy, M.; Tanguay, R.; Brantly, M.; Ou, C.-N.; Finegold, M.; Grompe, M. Hepatocytes corrected by gene therapy are selected in vivo in a murine model of hereditary tyrosinaemia type I. Nat. Genet. 1996, 12, 266–273. [Google Scholar] [CrossRef]


| Primer | Sequence |
|---|---|
| Bax Forward | CAGGATGCGTCCACCAAGAA |
| Bax Reverse | AGTCCGTGTCCACGTCAGCA |
| Puma Forward | ACGACCTCAACGCGCAGTACG |
| Puma Reverse | GAGGAGTCCCATGAAGAGATTG |
| p21 Forward | AGATCCACAGCGATATCCAGAC |
| p21 Reverse | ACCGAAGAGACAACGGCACACT |
| Gys2 Forward | CCTGGGCAGATATTACCAGCAT |
| Gys2 Reverse | TTCCCCTTTGGAAAGTGGTTCA |
| Gsk3b Forward | CAGCAGCCTTCAGCTTTTGG |
| Gsk3b Reverse | AGCTCTCGGTTCTTAAATCGCT |
| Pygl Forward | AACACTATGCGCCTCTGGTC |
| Pygl Reverse | GCTGGATGGCTACCTGATCT |
| mSCD1 Forward | CCGGAGACCCCTTAGATCGA |
| mSCD1 Reverse | TAGCCTGTAAAAGATTTCTGCAAACC |
| mACC1 Forward | TGACAGACTGATCGCAGAGAAAG |
| mACC1 Reverse | TGGAGAGCCCCACACACA |
| mSREBP-1c Forward | GGAGCCATGGATTGCACATT |
| mSREBP-1c Reverse | GGCCCGGGAAGTCACTGT |
| mFASN Forward | GCTGCGGAAACTTCAGGAAAT |
| mFASN Reverse | AGAGACGTGTCACTCCTGGACTT |
| beta Actin Forward | CCCTGTATGCCTCTGGTCGTACCAC |
| beta Actin Reverse | GCCAGCCAGGTCCAGACGCAGGATG |
| Antibody | Vendor | Cat Number | Dilution |
|---|---|---|---|
| Recombinant Anti-p21 antibody [EPR18021] | Abcam | ab188224 | 1:1000 (IHC/WB) |
| Phospho-p53 (Ser15) Antibody | Cell Signaling | #9284 | 1:100 (WB) |
| Cleaved Caspase-3 Antibody (Asp175) (D3E9) | Cell Signaling | #9579 | 1:250 (IHC) |
Publisher’s Note: MDPI stays neutral with regard to jurisdictional claims in published maps and institutional affiliations. |
© 2021 by the authors. Licensee MDPI, Basel, Switzerland. This article is an open access article distributed under the terms and conditions of the Creative Commons Attribution (CC BY) license (https://creativecommons.org/licenses/by/4.0/).
Share and Cite
Chronowski, C.; Akhanov, V.; Chan, D.; Catic, A.; Finegold, M.; Sahin, E. Fructose Causes Liver Damage, Polyploidy, and Dysplasia in the Setting of Short Telomeres and p53 Loss. Metabolites 2021, 11, 394. https://doi.org/10.3390/metabo11060394
Chronowski C, Akhanov V, Chan D, Catic A, Finegold M, Sahin E. Fructose Causes Liver Damage, Polyploidy, and Dysplasia in the Setting of Short Telomeres and p53 Loss. Metabolites. 2021; 11(6):394. https://doi.org/10.3390/metabo11060394
Chicago/Turabian StyleChronowski, Christopher, Viktor Akhanov, Doug Chan, Andre Catic, Milton Finegold, and Ergün Sahin. 2021. "Fructose Causes Liver Damage, Polyploidy, and Dysplasia in the Setting of Short Telomeres and p53 Loss" Metabolites 11, no. 6: 394. https://doi.org/10.3390/metabo11060394