
Serum Metabolites Responding in a Dose-Dependent Manner to the Intake of a High-Fat Meal in Normal Weight Healthy Men Are Associated with Obesity

 , ,
, , 
Abstract
:1. Introduction
2. Results
3. Discussion
4. Materials and Methods
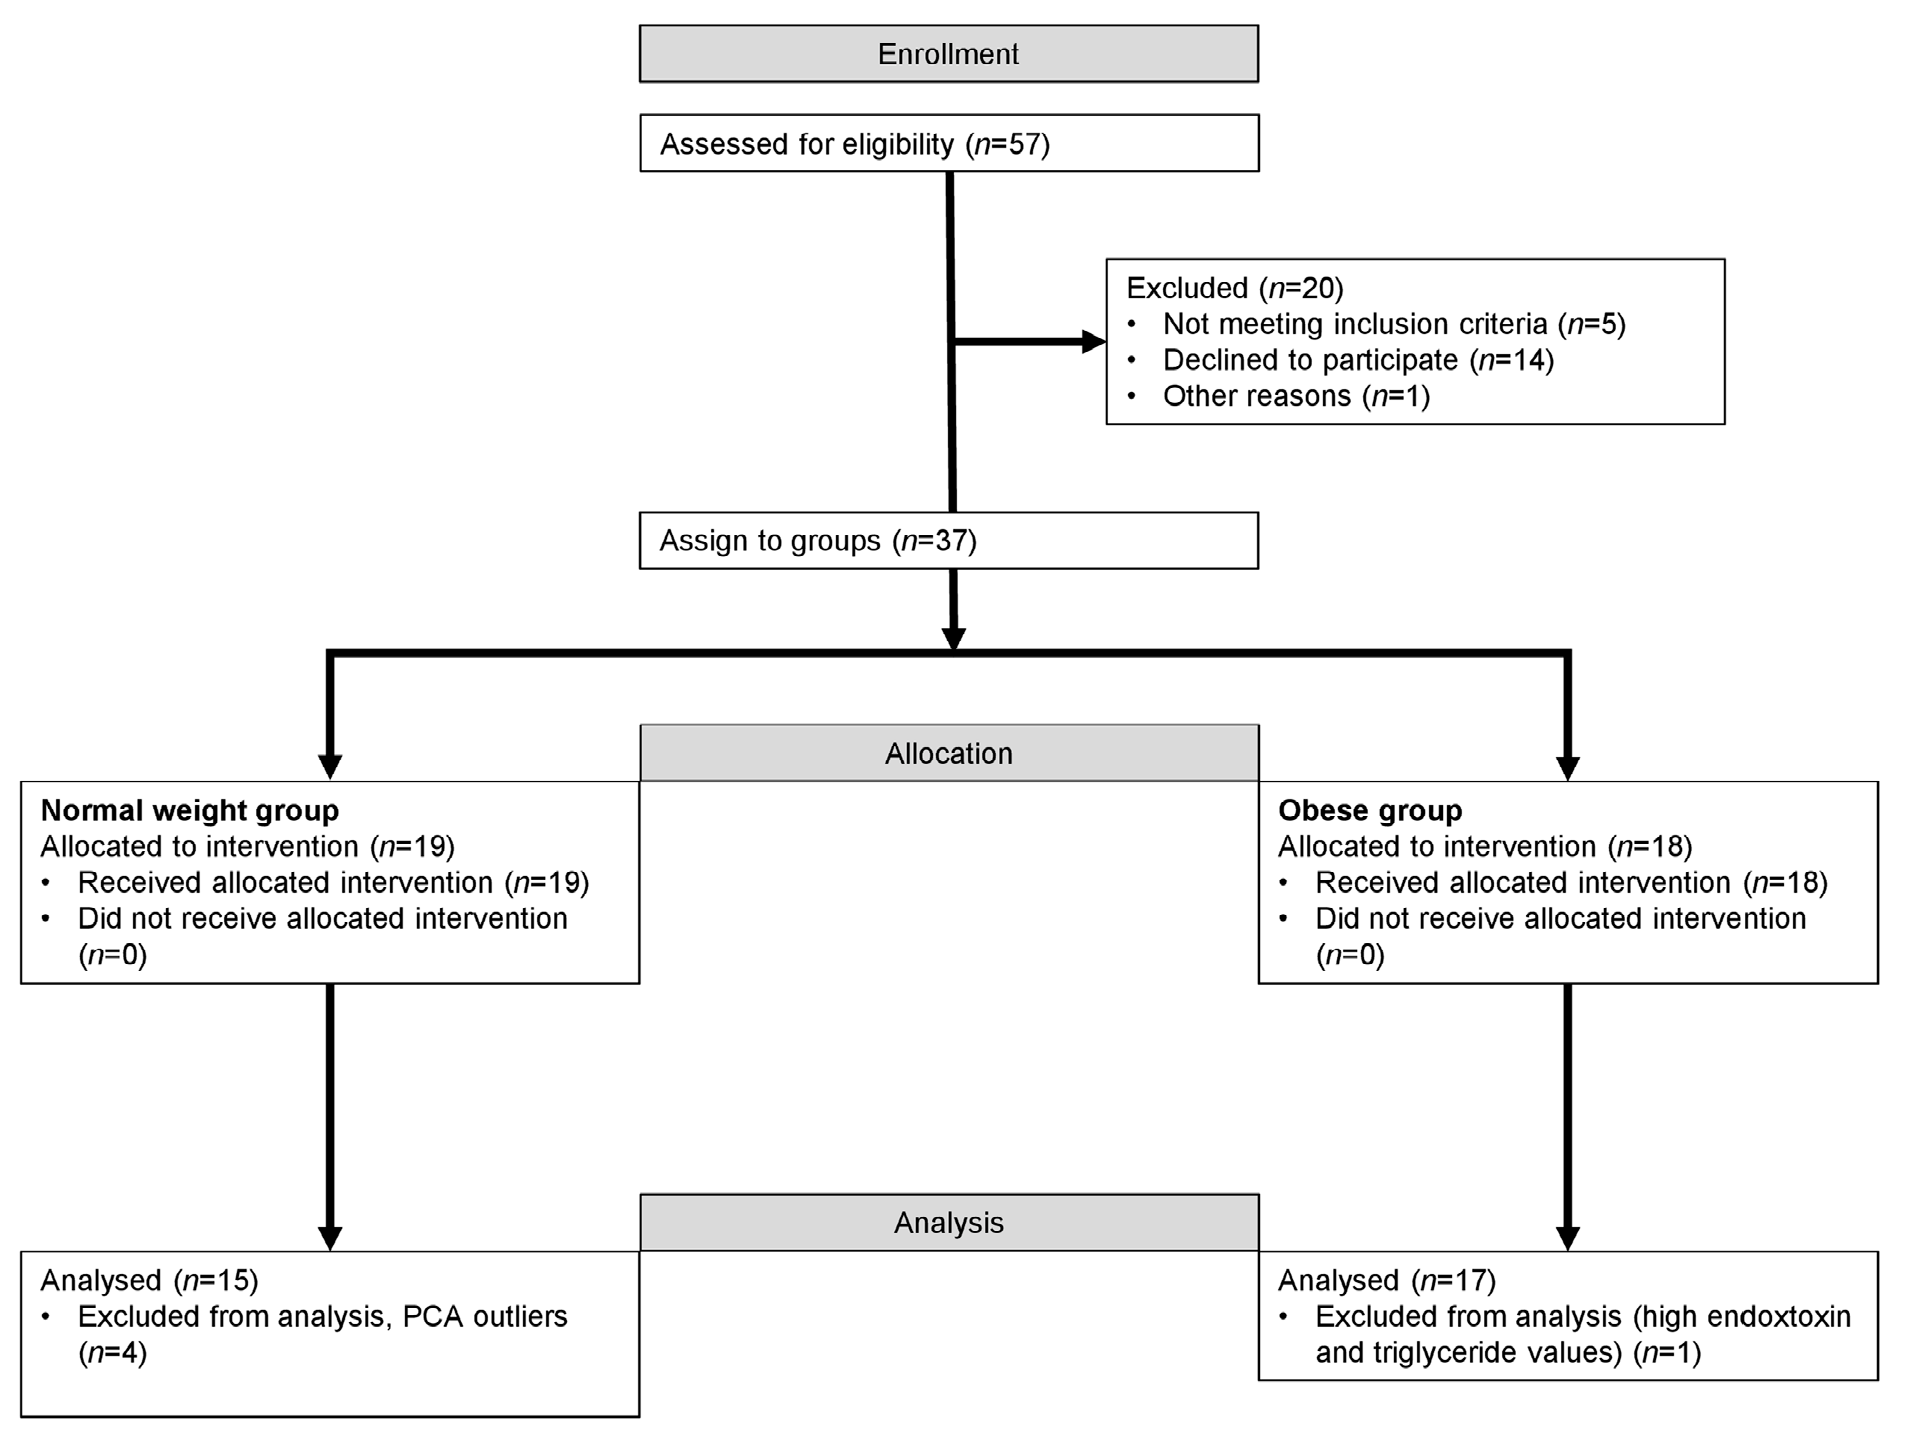
4.1. Subjects
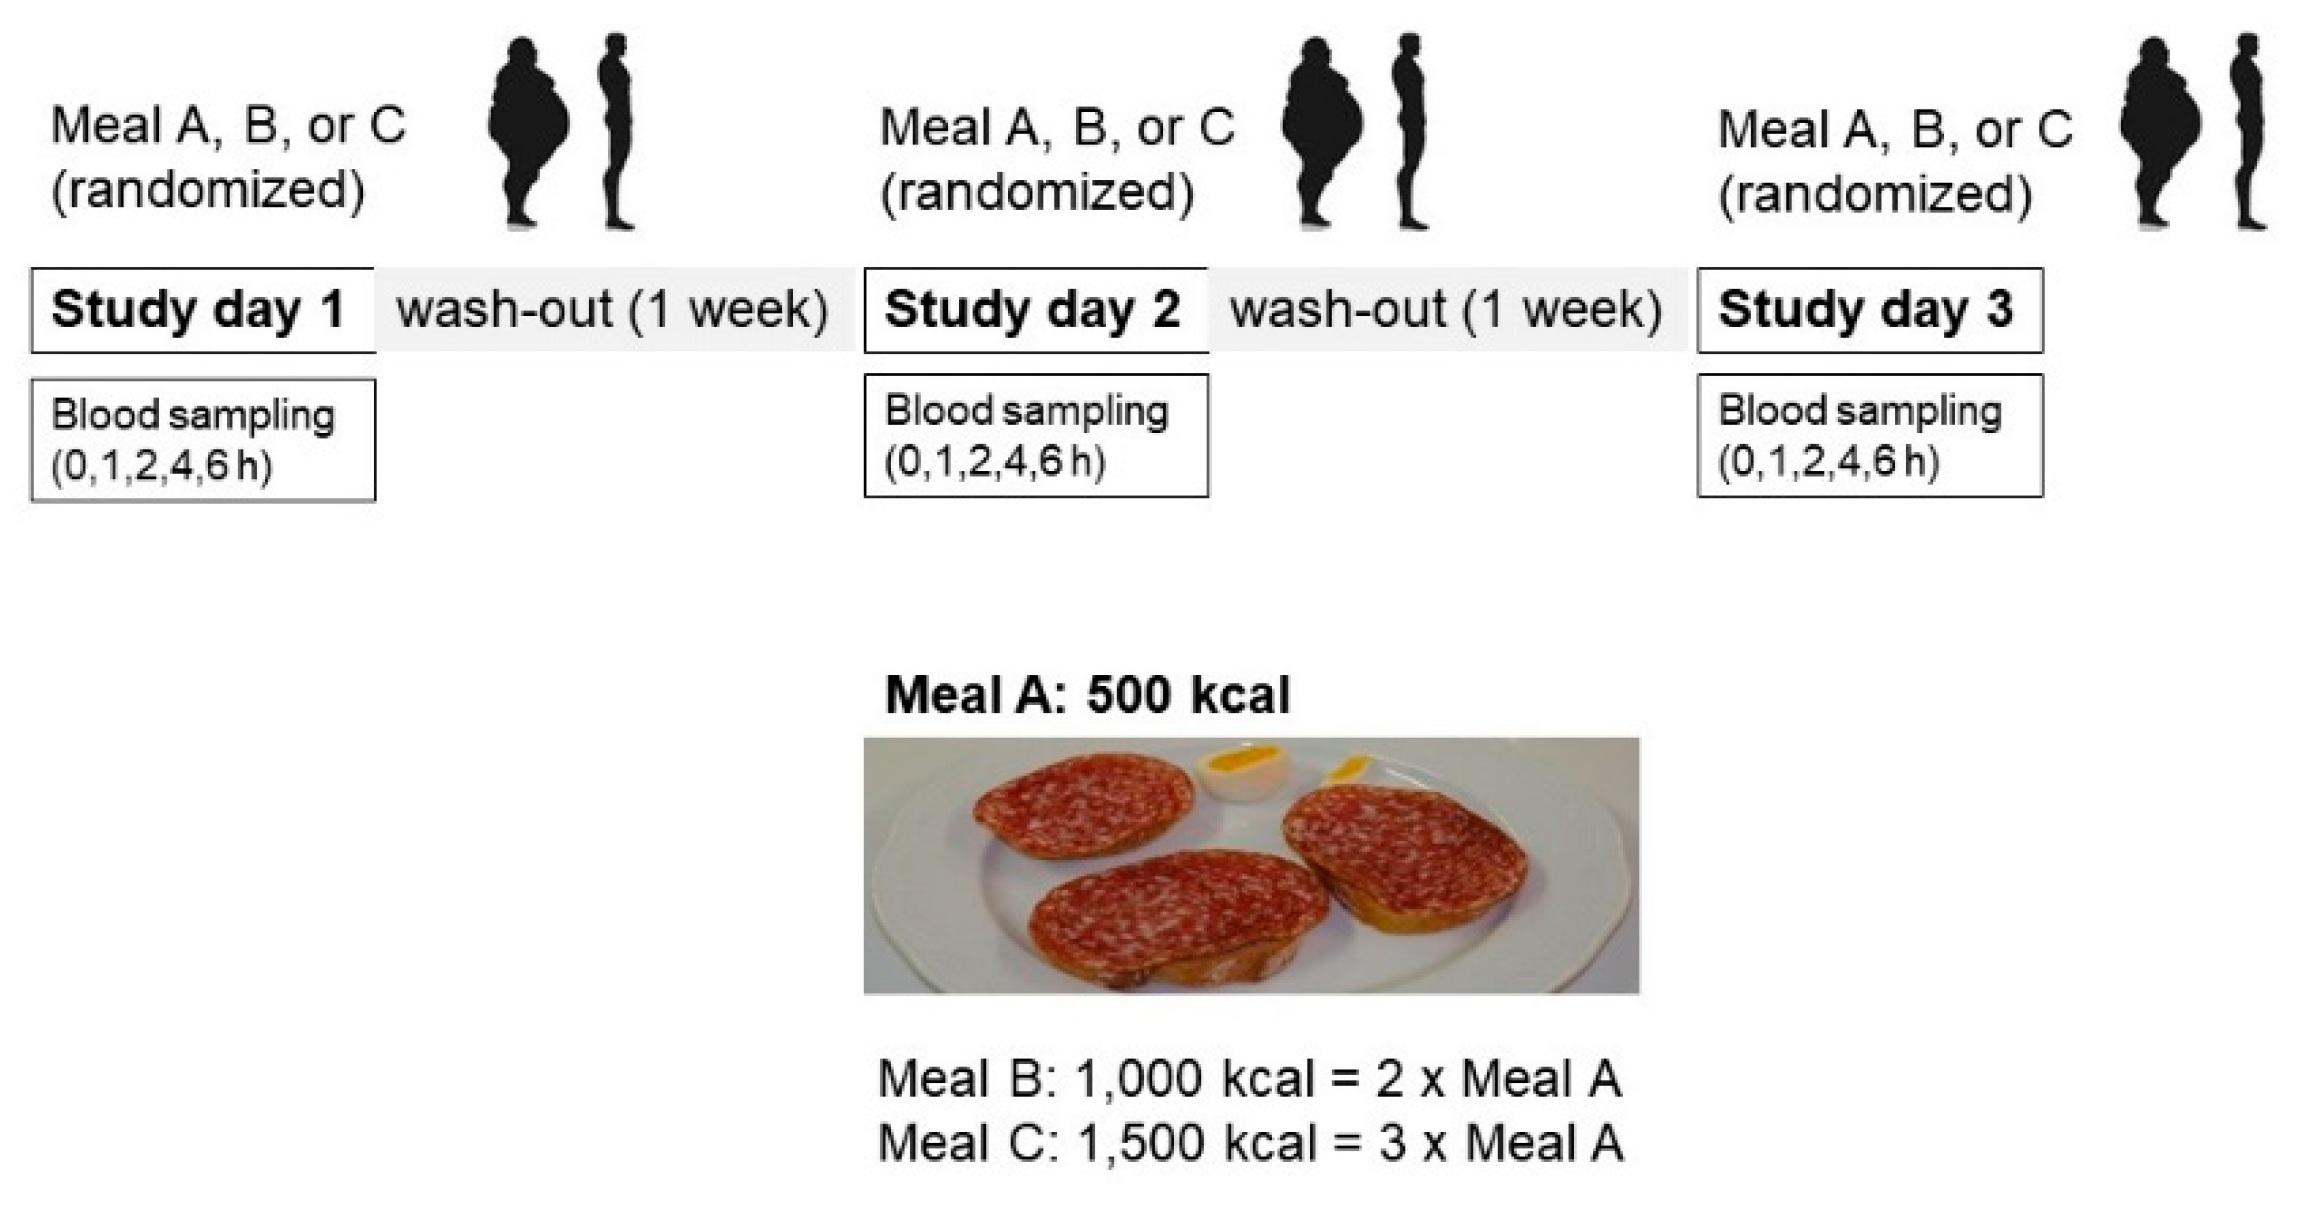
4.2. Study Design
4.3. Meal Composition
4.4. Untargeted Metabolomics with LC-MS
4.5. Data Processing and Statistical Analysis of Untargeted LC-MS Data
4.6. Measures of Amino Acids by GC-MS
4.7. Clinical Chemistry
Supplementary Materials
Author Contributions
Funding
Institutional Review Board Statement
Informed Consent Statement
Data Availability Statement
Conflicts of Interest
References
- Vázquez-Manjarrez, N.; Weinert, C.H.; Ulaszewska, M.M.; Mack, C.I.; Micheau, P.; Pétéra, M.; Durand, S.; Pujos-Guillot, E.; Egert, B.; Mattivi, F.; et al. Discovery and Validation of Banana Intake Biomarkers Using Untargeted Metabolomics in Human Intervention and Cross-sectional Studies. J. Nutr. 2019, 149, 1701–1713. [Google Scholar] [CrossRef] [PubMed]
- Cuparencu, C.; Rinnan, Å.; Dragsted, L.O. Combined Markers to Assess Meat Intake-Human Metabolomic Studies of Discovery and Validation. Mol. Nutr. Food Res. 2019, 63, e1900106. [Google Scholar] [CrossRef]
- Sri Harsha, P.S.C.; Abdul Wahab, R.; Cuparencu, C.; Dragsted, L.O.; Brennan, L. A Metabolomics Approach to the Identification of Urinary Biomarkers of Pea Intake. Nutrients 2018, 10, 1911. [Google Scholar] [CrossRef] [PubMed] [Green Version]
- Lopes Krüger, R.; Costa Teixeira, B.; Boufleur Farinha, J.; Cauduro Oliveira Macedo, R.; Pinto Boeno, F.; Rech, A.; Lopez, P.; Silveira Pinto, R.; Reischak-Oliveira, A. Effect of exercise intensity on postprandial lipemia, markers of oxidative stress, and endothelial function after a high-fat meal. Appl. Physiol. Nutr. Metab. 2016, 41, 1278–1284. [Google Scholar] [CrossRef] [PubMed] [Green Version]
- López-Moreno, J.; García-Carpintero, S.; Jimenez-Lucena, R.; Haro, C.; Rangel-Zúñiga, O.A.; Blanco-Rojo, R.; Yubero-Serrano, E.M.; Tinahones, F.J.; Delgado-Lista, J.; Pérez-Martínez, P.; et al. Effect of Dietary Lipids on Endotoxemia Influences Postprandial Inflammatory Response. J. Agric. Food Chem. 2017, 65, 7756–7763. [Google Scholar] [CrossRef] [PubMed]
- Meng, H.; Matthan, N.R.; Ausman, L.M.; Lichtenstein, A.H. Effect of prior meal macronutrient composition on postprandial glycemic responses and glycemic index and glycemic load value determinations. Am. J. Clin. Nutr. 2017, 106, 1246–1256. [Google Scholar] [CrossRef] [PubMed] [Green Version]
- Madec, S.; Corretti, V.; Santini, E.; Ferrannini, E.; Solini, A. Effect of a fatty meal on inflammatory markers in healthy volunteers with a family history of type 2 diabetes. Br. J. Nutr. 2011, 106, 364–368. [Google Scholar] [CrossRef] [PubMed]
- Irvin, M.R.; Aslibekyan, S.; Do, A.; Zhi, D.; Hidalgo, B.; Claas, S.A.; Srinivasasainagendra, V.; Horvath, S.; Tiwari, H.K.; Absher, D.M.; et al. Metabolic and inflammatory biomarkers are associated with epigenetic aging acceleration estimates in the GOLDN study. Clin. Epigenetics 2018, 10, 56. [Google Scholar] [CrossRef] [PubMed] [Green Version]
- O’Grada, C.M.; Morine, M.J.; Morris, C.; Ryan, M.; Dillon, E.T.; Walsh, M.; Gibney, E.R.; Brennan, L.; Gibney, M.J.; Roche, H.M. PBMCs reflect the immune component of the WAT transcriptome—implications as biomarkers of metabolic health in the postprandial state. Mol. Nutr. Food Res. 2014, 58, 808–820. [Google Scholar] [CrossRef]
- Gao, Q.; Pratico, G.; Scalbert, A.; Vergeres, G.; Kolehmainen, M.; Manach, C.; Brennan, L.; Afman, L.A.; Wishart, D.S.; Andres-Lacueva, C.; et al. A scheme for a flexible classification of dietary and health biomarkers. Genes Nutr. 2017, 12, 34. [Google Scholar] [CrossRef] [Green Version]
- Dragsted, L.O.; Gao, Q.; Scalbert, A.; Vergères, G.; Kolehmainen, M.; Manach, C.; Brennan, L.; Afman, L.A.; Wishart, D.S.; Andres Lacueva, C.; et al. Validation of biomarkers of food intake-Critical assessment of candidate biomarkers. Genes Nutr. 2018, 13. [Google Scholar] [CrossRef] [PubMed] [Green Version]
- Olza, J.; Calder, P.C. Metabolic and inflammatory responses to different caloric loads of a high-fat meal are distinct between normal-weight and obese individuals. J. Nutr. 2014, 144, 1493–1494. [Google Scholar] [CrossRef] [PubMed] [Green Version]
- Schwander, F.; Kopf-Bolanz, K.A.; Buri, C.; Portmann, R.; Egger, L.; Chollet, M.; McTernan, P.G.; Piya, M.; Gijs, M.A.M.; Vionnet, N.; et al. A dose-response strategy reveals differences between normal weight and obese men in their metabolic and inflammatory responses to a high-fat meal. J. Nutr. 2014, 144, 1517–1523. [Google Scholar] [CrossRef] [PubMed]
- Brouwer-Brolsma, E.M.; Brennan, L.; Drevon, C.A.; van Kranen, H.; Manach, C.; Dragsted, L.O.; Roche, H.M.; Andres-Lacueva, C.; Bakker, S.J.L.; Bouwman, J.; et al. Combining traditional dietary assessment methods with novel metabolomics techniques: Present efforts by the Food Biomarker Alliance. Proc. Nutr. Soc. 2017, 76, 619–627. [Google Scholar] [CrossRef] [Green Version]
- Ulaszewska, M.M.; Weinert, C.H.; Trimigno, A.; Portmann, R.; Andres Lacueva, C.; Badertscher, R.; Brennan, L.; Brunius, C.; Bub, A.; Capozzi, F.; et al. Nutrimetabolomics: An Integrative Action for Metabolomic Analyses in Human Nutritional Studies. Mol. Nutr. Food Res. 2018, e1800384. [Google Scholar] [CrossRef] [PubMed]
- Papandreou, C.; Bulló, M.; Ruiz-Canela, M.; Dennis, C.; Deik, A.; Wang, D.; Guasch-Ferré, M.; Yu, E.; Razquin, C.; Corella, D.; et al. Plasma metabolites predict both insulin resistance and incident type 2 diabetes: A metabolomics approach within the Prevención con Dieta Mediterránea (PREDIMED) study. Am. J. Clin. Nutr. 2019, 109, 626–634. [Google Scholar] [CrossRef] [PubMed]
- Pallister, T.; Jackson, M.A.; Martin, T.C.; Zierer, J.; Jennings, A.; Mohney, R.P.; MacGregor, A.; Steves, C.J.; Cassidy, A.; Spector, T.D.; et al. Hippurate as a metabolomic marker of gut microbiome diversity: Modulation by diet and relationship to metabolic syndrome. Sci. Rep. 2017, 7, 13670. [Google Scholar] [CrossRef] [PubMed] [Green Version]
- Chambers, E.S.; Byrne, C.S.; Morrison, D.J.; Murphy, K.G.; Preston, T.; Tedford, C.; Garcia-Perez, I.; Fountana, S.; Serrano-Contreras, J.I.; Holmes, E.; et al. Dietary supplementation with inulin-propionate ester or inulin improves insulin sensitivity in adults with overweight and obesity with distinct effects on the gut microbiota, plasma metabolome and systemic inflammatory responses: A randomised cross-over trial. Gut 2019, 68, 1430–1438. [Google Scholar] [CrossRef] [PubMed]
- Gao, X.; Zhang, W.; Wang, Y.; Pedram, P.; Cahill, F.; Zhai, G.; Randell, E.; Gulliver, W.; Sun, G. Serum metabolic biomarkers distinguish metabolically healthy peripherally obese from unhealthy centrally obese individuals. Nutr. Metab. 2016, 13, 33. [Google Scholar] [CrossRef] [Green Version]
- Gille, D.; Zangger, N.; Soneson, C.; Bütikofer, U.; Delorenzi, M.; Schwander, F.; Kopf-Bolanz, K.A.; Chollet, M.; Walther, B.; Laederach, K.; et al. Caloric dose-responsive genes in blood cells differentiate the metabolic status of obese men. J. Nutr. Biochem. 2017, 43, 156–165. [Google Scholar] [CrossRef] [PubMed]
- Goodpaster, B.H.; Sparks, L.M. Metabolic Flexibility in Health and Disease. Cell Metab. 2017, 25, 1027–1036. [Google Scholar] [CrossRef] [Green Version]
- Wopereis, S.; Stroeve, J.H.M.; Stafleu, A.; Bakker, G.C.M.; Burggraaf, J.; van Erk, M.J.; Pellis, L.; Boessen, R.; Kardinaal, A.A.F.; van Ommen, B. Multi-parameter comparison of a standardized mixed meal tolerance test in healthy and type 2 diabetic subjects: The PhenFlex challenge. Genes Nutr. 2017, 12, 21. [Google Scholar] [CrossRef]
- Krug, S.; Kastenmuller, G.; Stuckler, F.; Rist, M.J.; Skurk, T.; Sailer, M.; Raffler, J.; Romisch-Margl, W.; Adamski, J.; Prehn, C.; et al. The dynamic range of the human metabolome revealed by challenges. FASEB J. 2012, 26, 2607–2619. [Google Scholar] [CrossRef] [PubMed]
- Xu, M.; Zhong, F.; Bruno, R.S.; Ballard, K.D.; Zhang, J.; Zhu, J. Comparative Metabolomics Elucidates Postprandial Metabolic Modifications in Plasma of Obese Individuals with Metabolic Syndrome. J. Proteome Res. 2018, 17, 2850–2860. [Google Scholar] [CrossRef] [PubMed]
- Stroeve, J.H.M.; van Wietmarschen, H.; Kremer, B.H.A.; van Ommen, B.; Wopereis, S. Phenotypic flexibility as a measure of health: The optimal nutritional stress response test. Genes Nutr. 2015, 10, 13. [Google Scholar] [CrossRef] [PubMed] [Green Version]
- van Dijk, S.J.; Mensink, M.; Esser, D.; Feskens, E.J.; Muller, M.; Afman, L.A. Responses to high-fat challenges varying in fat type in subjects with different metabolic risk phenotypes: A randomized trial. PLoS ONE 2012, 7, e41388. [Google Scholar] [CrossRef] [PubMed]
- Pellis, L.; van Erk, M.J.; van Ommen, B.; Bakker, G.C.; Hendriks, H.F.; Cnubben, N.H.; Kleemann, R.; van Someren, E.P.; Bobeldijk, I.; Rubingh, C.M.; et al. Plasma metabolomics and proteomics profiling after a postprandial challenge reveal subtle diet effects on human metabolic status. Metabolomics 2012, 8, 347–359. [Google Scholar] [CrossRef] [Green Version]
- Fiamoncini, J.; Rundle, M.; Gibbons, H.; Thomas, E.L.; Geillinger-Kastle, K.; Bunzel, D.; Trezzi, J.P.; Kiselova-Kaneva, Y.; Wopereis, S.; Wahrheit, J.; et al. Plasma metabolome analysis identifies distinct human metabotypes in the postprandial state with different susceptibility to weight loss-mediated metabolic improvements. FASEB J. 2018, 32, 5447–5458. [Google Scholar] [CrossRef] [Green Version]
- Bouwman, J.; Vogels, J.T.; Wopereis, S.; Rubingh, C.M.; Bijlsma, S.; Ommen, B. Visualization and identification of health space, based on personalized molecular phenotype and treatment response to relevant underlying biological processes. BMC Med. Genom. 2012, 5, 1. [Google Scholar] [CrossRef] [Green Version]
- van den Broek, T.J.; Bakker, G.C.M.; Rubingh, C.M.; Bijlsma, S.; Stroeve, J.H.M.; van Ommen, B.; van Erk, M.J.; Wopereis, S. Ranges of phenotypic flexibility in healthy subjects. Genes Nutr. 2017, 12, 32. [Google Scholar] [CrossRef]
- Pai, M.P. Drug dosing based on weight and body surface area: Mathematical assumptions and limitations in obese adults. Pharmacotherapy 2012, 32, 856–868. [Google Scholar] [CrossRef] [PubMed]
- Heni, M.; Kullmann, S.; Ketterer, C.; Guthoff, M.; Bayer, M.; Staiger, H.; Machicao, F.; Haring, H.U.; Preissl, H.; Veit, R.; et al. Differential effect of glucose ingestion on the neural processing of food stimuli in lean and overweight adults. Hum. Brain Mapp. 2014, 35, 918–928. [Google Scholar] [CrossRef] [PubMed]
- Verdich, C.; Toubro, S.; Buemann, B.; Lysgård Madsen, J.; Juul Holst, J.; Astrup, A. The role of postprandial releases of insulin and incretin hormones in meal-induced satiety—Effect of obesity and weight reduction. Int. J. Obes. Relat. Metab. Disord. 2001, 25, 1206–1214. [Google Scholar] [CrossRef] [PubMed] [Green Version]
- Jones, D.Y.; Judd, J.T.; Taylor, P.R.; Campbell, W.S.; Nair, P.P. Influence of caloric contribution and saturation of dietary fat on plasma lipids in premenopausal women. Am. J. Clin. Nutr. 1987, 45, 1451–1456. [Google Scholar] [CrossRef] [PubMed]
- Vors, C.; Pineau, G.; Drai, J.; Meugnier, E.; Pesenti, S.; Laville, M.; Laugerette, F.; Malpuech-Brugere, C.; Vidal, H.; Michalski, M.C. Postprandial Endotoxemia Linked With Chylomicrons and Lipopolysaccharides Handling in Obese Versus Lean Men: A Lipid Dose-Effect Trial. J. Clin. Endocrinol. Metab. 2015, 100, 3427–3435. [Google Scholar] [CrossRef] [PubMed]
- Cirulli, E.T.; Guo, L.; Leon Swisher, C.; Shah, N.; Huang, L.; Napier, L.A.; Kirkness, E.F.; Spector, T.D.; Caskey, C.T.; Thorens, B.; et al. Profound Perturbation of the Metabolome in Obesity Is Associated with Health Risk. Cell Metab. 2019, 29, 488–500.e482. [Google Scholar] [CrossRef] [Green Version]
- Bellissimo, M.P.; Cai, Q.; Ziegler, T.R.; Liu, K.H.; Tran, P.H.; Vos, M.B.; Martin, G.S.; Jones, D.P.; Yu, T.; Alvarez, J.A. Plasma High-Resolution Metabolomics Differentiates Adults with Normal Weight Obesity from Lean Individuals. Obesity 2019, 27, 1729–1737. [Google Scholar] [CrossRef] [Green Version]
- Moore, S.C.; Matthews, C.E.; Sampson, J.N.; Stolzenberg-Solomon, R.Z.; Zheng, W.; Cai, Q.; Tan, Y.T.; Chow, W.H.; Ji, B.T.; Liu, D.K.; et al. Human metabolic correlates of body mass index. Metabolomics 2014, 10, 259–269. [Google Scholar] [CrossRef]
- Newgard, C.B. Metabolomics and Metabolic Diseases: Where Do We Stand? Cell Metab. 2017, 25, 43–56. [Google Scholar] [CrossRef] [Green Version]
- Newgard, C.B.; An, J.; Bain, J.R.; Muehlbauer, M.J.; Stevens, R.D.; Lien, L.F.; Haqq, A.M.; Shah, S.H.; Arlotto, M.; Slentz, C.A.; et al. A branched-chain amino acid-related metabolic signature that differentiates obese and lean humans and contributes to insulin resistance. Cell Metab. 2009, 9, 311–326. [Google Scholar] [CrossRef] [Green Version]
- Adams, S.H. Emerging perspectives on essential amino acid metabolism in obesity and the insulin-resistant state. Adv. Nutr. 2011, 2, 445–456. [Google Scholar] [CrossRef] [Green Version]
- Chen, H.H.; Tseng, Y.J.; Wang, S.Y.; Tsai, Y.S.; Chang, C.S.; Kuo, T.C.; Yao, W.J.; Shieh, C.C.; Wu, C.H.; Kuo, P.H. The metabolome profiling and pathway analysis in metabolic healthy and abnormal obesity. Int. J. Obes. 2015, 39, 1241–1248. [Google Scholar] [CrossRef]
- Rauschert, S.; Uhl, O.; Koletzko, B.; Hellmuth, C. Metabolomic biomarkers for obesity in humans: A short review. Ann. Nutr. Metab. 2014, 64, 314–324. [Google Scholar] [CrossRef] [Green Version]
- Boulet, M.M.; Chevrier, G.; Grenier-Larouche, T.; Pelletier, M.; Nadeau, M.; Scarpa, J.; Prehn, C.; Marette, A.; Adamski, J.; Tchernof, A. Alterations of plasma metabolite profiles related to adipose tissue distribution and cardiometabolic risk. Am. J. Physiol. Endocrinol. Metab. 2015, 309, E736–E746. [Google Scholar] [CrossRef] [Green Version]
- Badoud, F.; Lam, K.P.; Perreault, M.; Zulyniak, M.A.; Britz-McKibbin, P.; Mutch, D.M. Metabolomics Reveals Metabolically Healthy and Unhealthy Obese Individuals Differ in their Response to a Caloric Challenge. PLoS ONE 2015, 10, e0134613. [Google Scholar] [CrossRef] [Green Version]
- Bondia-Pons, I.; Maukonen, J.; Mattila, I.; Rissanen, A.; Saarela, M.; Kaprio, J.; Hakkarainen, A.; Lundbom, J.; Lundbom, N.; Hyotylainen, T.; et al. Metabolome and fecal microbiota in monozygotic twin pairs discordant for weight: A Big Mac challenge. FASEB J. 2014, 28, 4169–4179. [Google Scholar] [CrossRef] [Green Version]
- Bloomgarden, Z. Diabetes and branched-chain amino acids: What is the link? J. Diabetes 2018, 10, 350–352. [Google Scholar] [CrossRef] [Green Version]
- Newgard, C.B. Interplay between lipids and branched-chain amino acids in development of insulin resistance. Cell Metab. 2012, 15, 606–614. [Google Scholar] [CrossRef] [PubMed] [Green Version]
- White, P.J.; Newgard, C.B. Branched-chain amino acids in disease. Science 2019, 363, 582–583. [Google Scholar] [CrossRef] [PubMed]
- Lee, S.G.; Yim, Y.S.; Lee, Y.H.; Lee, B.W.; Kim, H.S.; Kim, K.S.; Lee, Y.W.; Kim, J.H. Fasting serum amino acids concentration is associated with insulin resistance and pro-inflammatory cytokines. Diabetes Res. Clin. Pract. 2018, 140, 107–117. [Google Scholar] [CrossRef] [PubMed]
- Fukushima, K.; Harada, S.; Takeuchi, A.; Kurihara, A.; Iida, M.; Fukai, K.; Kuwabara, K.; Kato, S.; Matsumoto, M.; Hirata, A.; et al. Association between dyslipidemia and plasma levels of branched-chain amino acids in the Japanese population without diabetes mellitus. J. Clin. Lipidol. 2019, 13, 932–939.e932. [Google Scholar] [CrossRef] [PubMed] [Green Version]
- Liu, L.; Feng, R.; Guo, F.; Li, Y.; Jiao, J.; Sun, C. Targeted metabolomic analysis reveals the association between the postprandial change in palmitic acid, branched-chain amino acids and insulin resistance in young obese subjects. Diabetes Res. Clin. Pract. 2015, 108, 84–93. [Google Scholar] [CrossRef] [PubMed]
- Mook-Kanamori, D.O.; Römisch-Margl, W.; Kastenmüller, G.; Prehn, C.; Petersen, A.K.; Illig, T.; Gieger, C.; Wang-Sattler, R.; Meisinger, C.; Peters, A.; et al. Increased amino acids levels and the risk of developing of hypertriglyceridemia in a 7-year follow-up. J. Endocrinol. Investig. 2014, 37, 369–374. [Google Scholar] [CrossRef] [PubMed] [Green Version]
- Yamakado, M.; Nagao, K.; Imaizumi, A.; Tani, M.; Toda, A.; Tanaka, T.; Jinzu, H.; Miyano, H.; Yamamoto, H.; Daimon, T.; et al. Plasma Free Amino Acid Profiles Predict Four-Year Risk of Developing Diabetes, Metabolic Syndrome, Dyslipidemia, and Hypertension in Japanese Population. Sci. Rep. 2015, 5, 11918. [Google Scholar] [CrossRef] [PubMed]
- Yang, P.; Hu, W.; Fu, Z.; Sun, L.; Zhou, Y.; Gong, Y.; Yang, T.; Zhou, H. The positive association of branched-chain amino acids and metabolic dyslipidemia in Chinese Han population. Lipids Health Dis. 2016, 15, 120. [Google Scholar] [CrossRef] [Green Version]
- Liu, L.; Wang, M.; Yang, X.; Bi, M.; Na, L.; Niu, Y.; Li, Y.; Sun, C. Fasting serum lipid and dehydroepiandrosterone sulfate as important metabolites for detecting isolated postchallenge diabetes: Serum metabolomics via ultra-high-performance LC-MS. Clin. Chem. 2013, 59, 1338–1348. [Google Scholar] [CrossRef]
- Kelley, D.E.; Mandarino, L.J. Fuel selection in human skeletal muscle in insulin resistance: A reexamination. Diabetes 2000, 49, 677–683. [Google Scholar] [CrossRef] [Green Version]
- Adams, S.; Che, D.; Qin, G.; Farouk, M.H.; Hailong, J.; Rui, H. Novel Biosynthesis, Metabolism and Physiological Functions of L-Homoarginine. Curr. Protein. Pept. Sci. 2019, 20, 184–193. [Google Scholar] [CrossRef]
- May, M.; Kayacelebi, A.A.; Batkai, S.; Jordan, J.; Tsikas, D.; Engeli, S. Plasma and tissue homoarginine concentrations in healthy and obese humans. Amino Acids 2015, 47, 1847–1852. [Google Scholar] [CrossRef] [PubMed]
- Al-Aama, J.Y.; Al Mahdi, H.B.; Salama, M.A.; Bakur, K.H.; Alhozali, A.; Mosli, H.H.; Bahijri, S.M.; Bahieldin, A.; Willmitzer, L.; Edris, S. Detection of Secondary Metabolites as Biomarkers for the Early Diagnosis and Prevention of Type 2 Diabetes. Diabetes Metab. Syndr. Obes. 2019, 12, 2675–2684. [Google Scholar] [CrossRef] [PubMed] [Green Version]
- Brosnan, J.T.; Brosnan, M.E. Creatine: Endogenous metabolite, dietary, and therapeutic supplement. Annu. Rev. Nutr. 2007, 27, 241–261. [Google Scholar] [CrossRef] [Green Version]
- Kazak, L.; Chouchani, E.T.; Lu, G.Z.; Jedrychowski, M.P.; Bare, C.J.; Mina, A.I.; Kumari, M.; Zhang, S.; Vuckovic, I.; Laznik-Bogoslavski, D.; et al. Genetic Depletion of Adipocyte Creatine Metabolism Inhibits Diet-Induced Thermogenesis and Drives Obesity. Cell Metab. 2017, 26, 660–671.e663. [Google Scholar] [CrossRef] [Green Version]
- Almanza-Aguilera, E.; Brunius, C.; Bernal-Lopez, M.R.; Garcia-Aloy, M.; Madrid-Gambin, F.; Tinahones, F.J.; Gómez-Huelgas, R.; Landberg, R.; Andres-Lacueva, C. Impact in Plasma Metabolome as Effect of Lifestyle Intervention for Weight-Loss Reveals Metabolic Benefits in Metabolically Healthy Obese Women. J. Proteome Res. 2018, 17, 2600–2610. [Google Scholar] [CrossRef]
- Gruber, J.; Tang, S.Y.; Jenner, A.M.; Mudway, I.; Blomberg, A.; Behndig, A.; Kasiman, K.; Lee, C.Y.; Seet, R.C.; Zhang, W.; et al. Allantoin in human plasma, serum, and nasal-lining fluids as a biomarker of oxidative stress: Avoiding artifacts and establishing real in vivo concentrations. Antioxid. Redox Signal. 2009, 11, 1767–1776. [Google Scholar] [CrossRef] [Green Version]
- Skalicky, J.; Muzakova, V.; Kandar, R.; Meloun, M.; Rousar, T.; Palicka, V. Evaluation of oxidative stress and inflammation in obese adults with metabolic syndrome. Clin. Chem. Lab. Med. 2008, 46, 499–505. [Google Scholar] [CrossRef]
- Papandreou, C.; Li, J.; Liang, L.; Bullo, M.; Zheng, Y.; Ruiz-Canela, M.; Yu, E.; Guasch-Ferre, M.; Razquin, C.; Clish, C.; et al. Metabolites related to purine catabolism and risk of type 2 diabetes incidence; modifying effects of the TCF7L2-rs7903146 polymorphism. Sci. Rep. 2019, 9, 2892. [Google Scholar] [CrossRef]
- Trabado, S.; Al-Salameh, A.; Croixmarie, V.; Masson, P.; Corruble, E.; Feve, B.; Colle, R.; Ripoll, L.; Walther, B.; Boursier-Neyret, C.; et al. The human plasma-metabolome: Reference values in 800 French healthy volunteers; impact of cholesterol, gender and age. PLoS ONE 2017, 12, e0173615. [Google Scholar] [CrossRef] [PubMed] [Green Version]
- Pimentel, G.; Burton, K.J.; von Ah, U.; Butikofer, U.; Pralong, F.P.; Vionnet, N.; Portmann, R.; Vergeres, G. Metabolic Footprinting of Fermented Milk Consumption in Serum of Healthy Men. J. Nutr. 2018, 148, 851–860. [Google Scholar] [CrossRef] [PubMed]
- Wishart, D.S.; Feunang, Y.D.; Marcu, A.; Guo, A.C.; Liang, K.; Vazquez-Fresno, R.; Sajed, T.; Johnson, D.; Li, C.; Karu, N.; et al. HMDB 4.0: The human metabolome database for 2018. Nucleic Acids Res. 2017. [Google Scholar] [CrossRef] [PubMed]
- MassBank of North America (MoNA). Available online: http://mona.fiehnlab.ucdavis.edu (accessed on 1 May 2021).
- Smith, C.A.; O’Maille, G.; Want, E.J.; Qin, C.; Trauger, S.A.; Brandon, T.R.; Custodio, D.E.; Abagyan, R.; Siuzdak, G. METLIN: A metabolite mass spectral database. Ther. Drug Monit. 2005, 27, 747–751. [Google Scholar] [CrossRef]
- Dunn, W.B.; Broadhurst, D.; Begley, P.; Zelena, E.; Francis-McIntyre, S.; Anderson, N.; Brown, M.; Knowles, J.D.; Halsall, A.; Haselden, J.N.; et al. Procedures for large-scale metabolic profiling of serum and plasma using gas chromatography and liquid chromatography coupled to mass spectrometry. Nat. Protoc. 2011, 6, 1060–1083. [Google Scholar] [CrossRef] [PubMed]
- Ekstrøm, C.T. Miscellaneous Esoteric Statistical Scripts. 2020. Available online: https://cran.r-project.org/web/packages/MESS/index.html (accessed on 1 May 2021).
- Noguchi, K.; Gel, Y.R.; Brunner, E.; Konietschke, F. nparLD: An R Software Package for the Nonparametric Analysis of Longitudinal Data in Factorial Experiments. J. Stat. Softw. 2012, 50, 1–23. [Google Scholar] [CrossRef] [Green Version]
- Lucas, A. Package ‘Amap’. Available online: https://cran.r-project.org/web/packages/amap/index.html (accessed on 1 May 2021).
- Galili, T. dendextend: An R package for visualizing, adjusting and comparing trees of hierarchical clustering. Bioinformatics 2015, 31, 3718–3720. [Google Scholar] [CrossRef] [Green Version]
- Dinno, A. Package ‘Conover.Test’. 2017, pp. 1–7. Available online: https://cran.r-project.org/web/packages/conover.test/index.html (accessed on 1 May 2021).
- Begley, P.; Francis-McIntyre, S.; Dunn, W.B.; Broadhurst, D.I.; Halsall, A.; Tseng, A.; Knowles, J.; Goodacre, R.; Kell, D.B. Development and Performance of a Gas Chromatography−Time-of-Flight Mass Spectrometry Analysis for Large-Scale Nontargeted Metabolomic Studies of Human Serum. Anal. Chem. 2009, 81, 7038–7046. [Google Scholar] [CrossRef]
- Pimentel, G.; Burton, K.J.; Rosikiewicz, M.; Freiburghaus, C.; von Ah, U.; Münger, L.H.; Pralong, F.P.; Vionnet, N.; Greub, G.; Badertscher, R.; et al. Blood lactose after dairy product intake in healthy men. Br. J. Nutr. 2017, 118, 1070–1077. [Google Scholar] [CrossRef] [PubMed] [Green Version]


 NW group;
  OB group; meals
  A,
A,  B, and
  C.
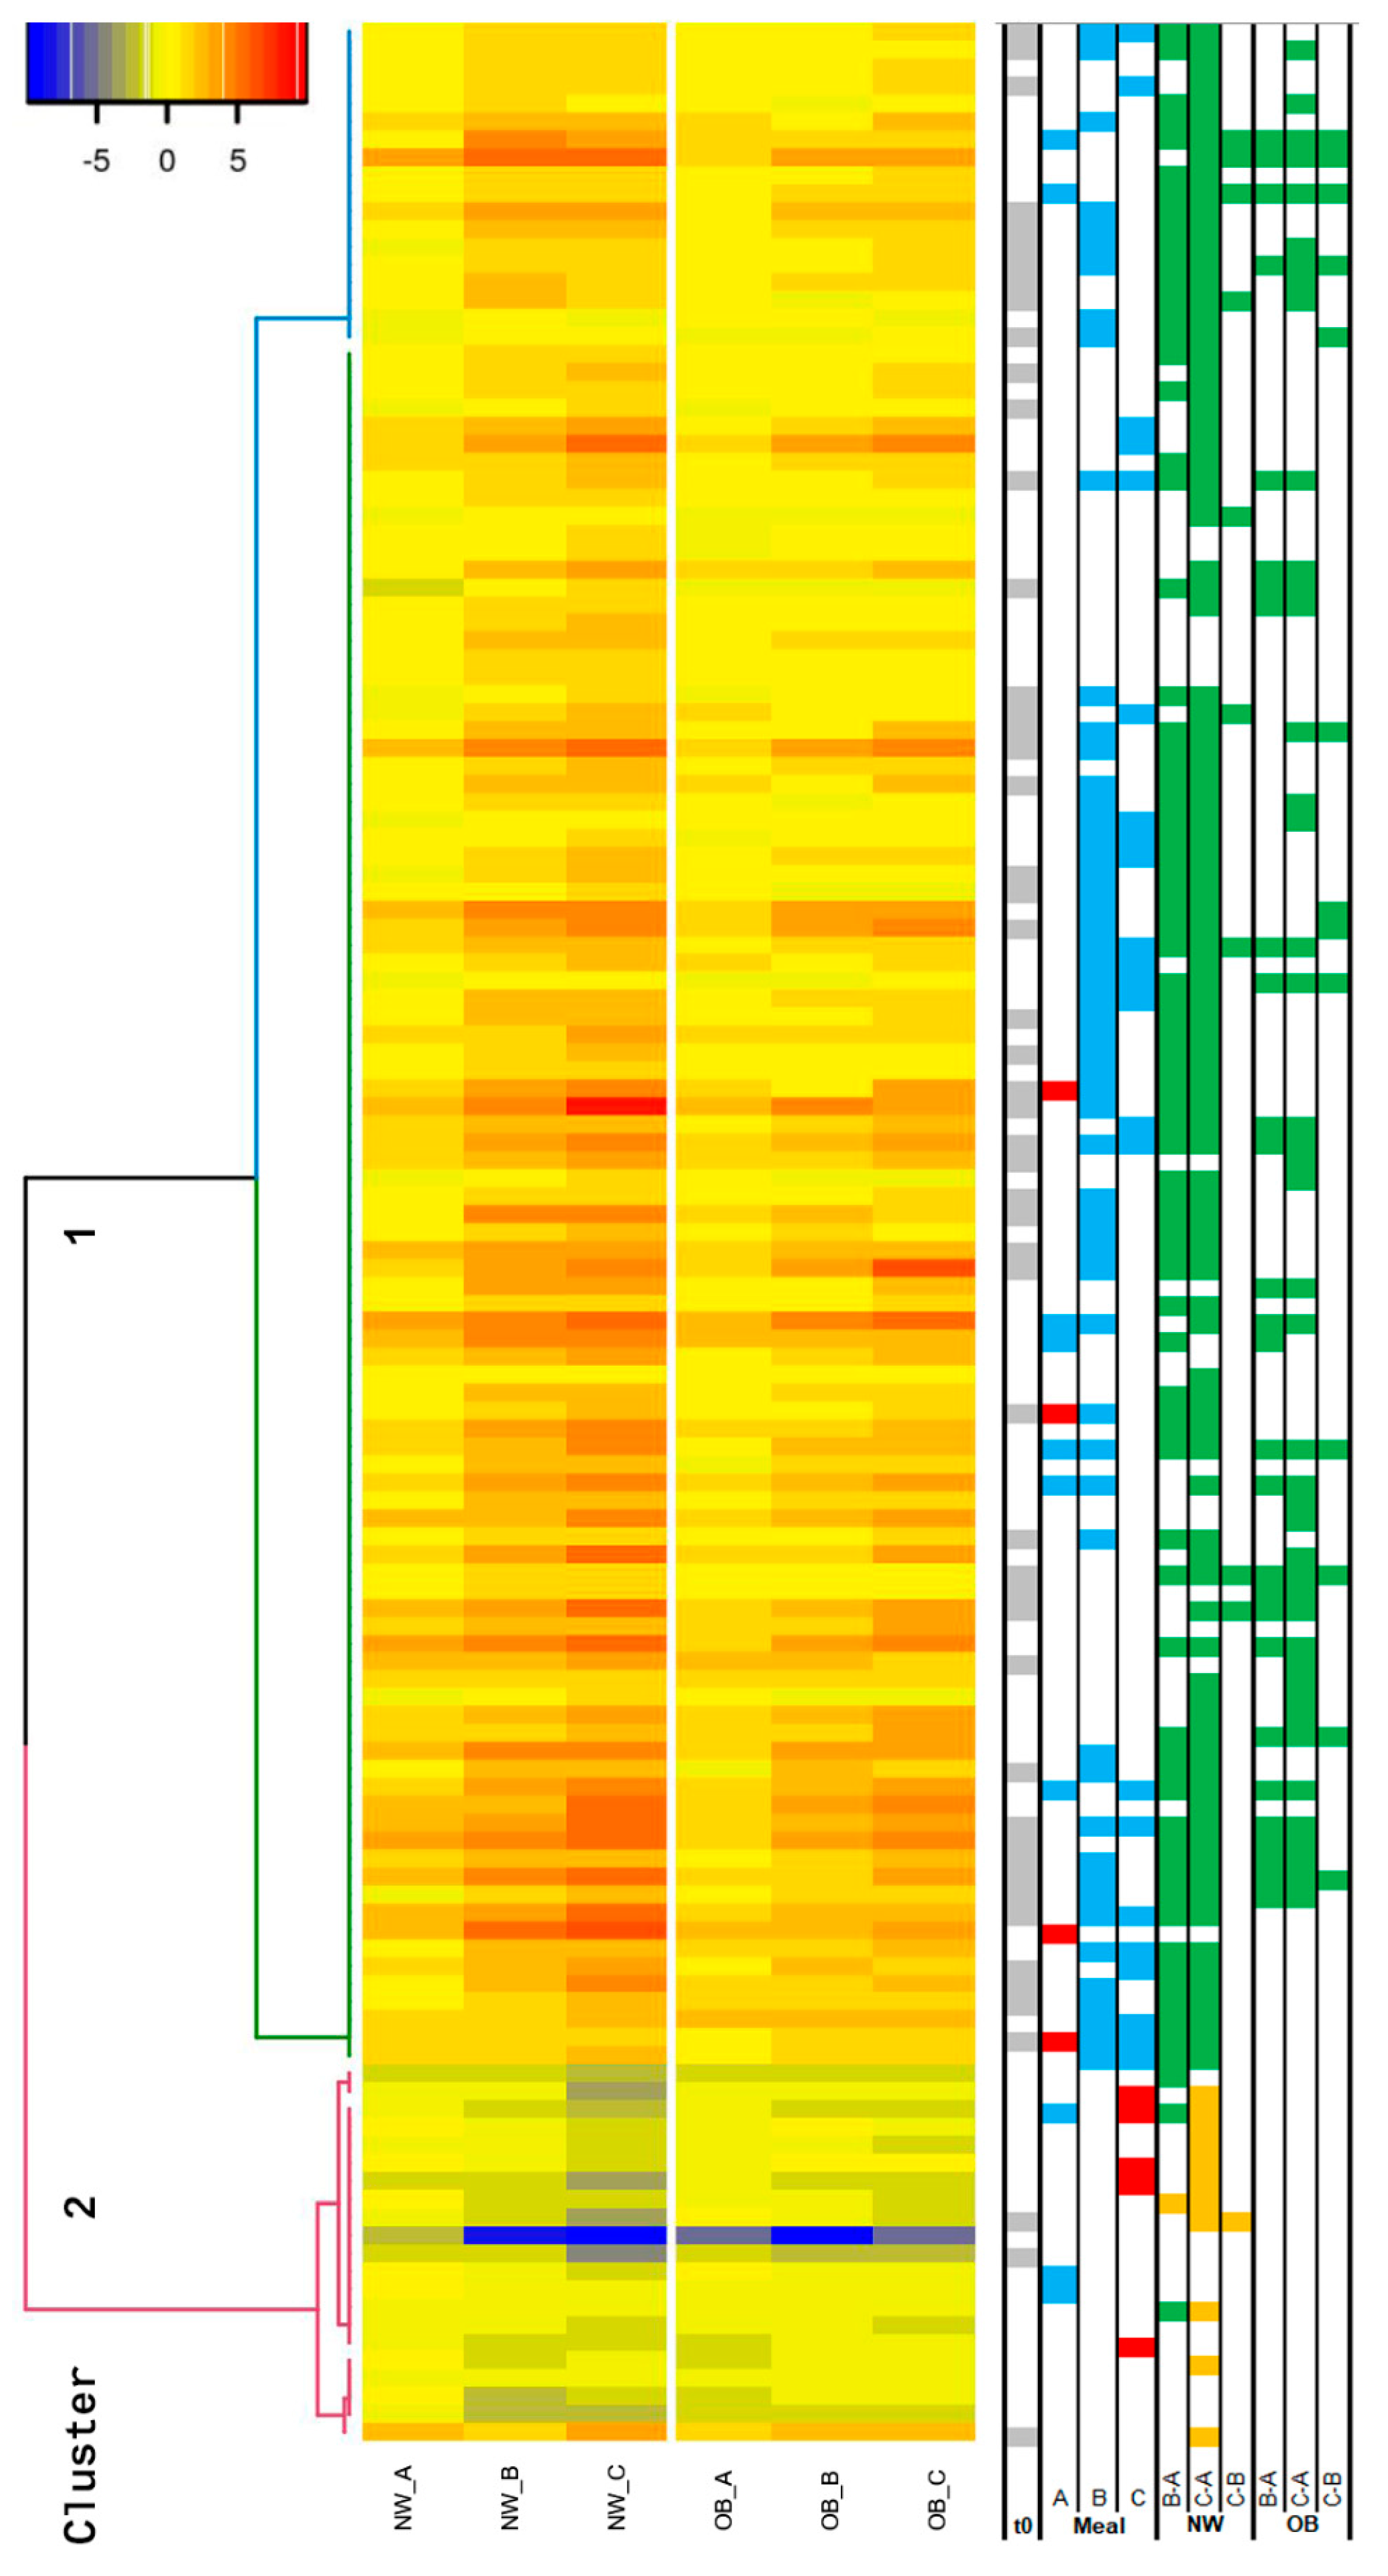
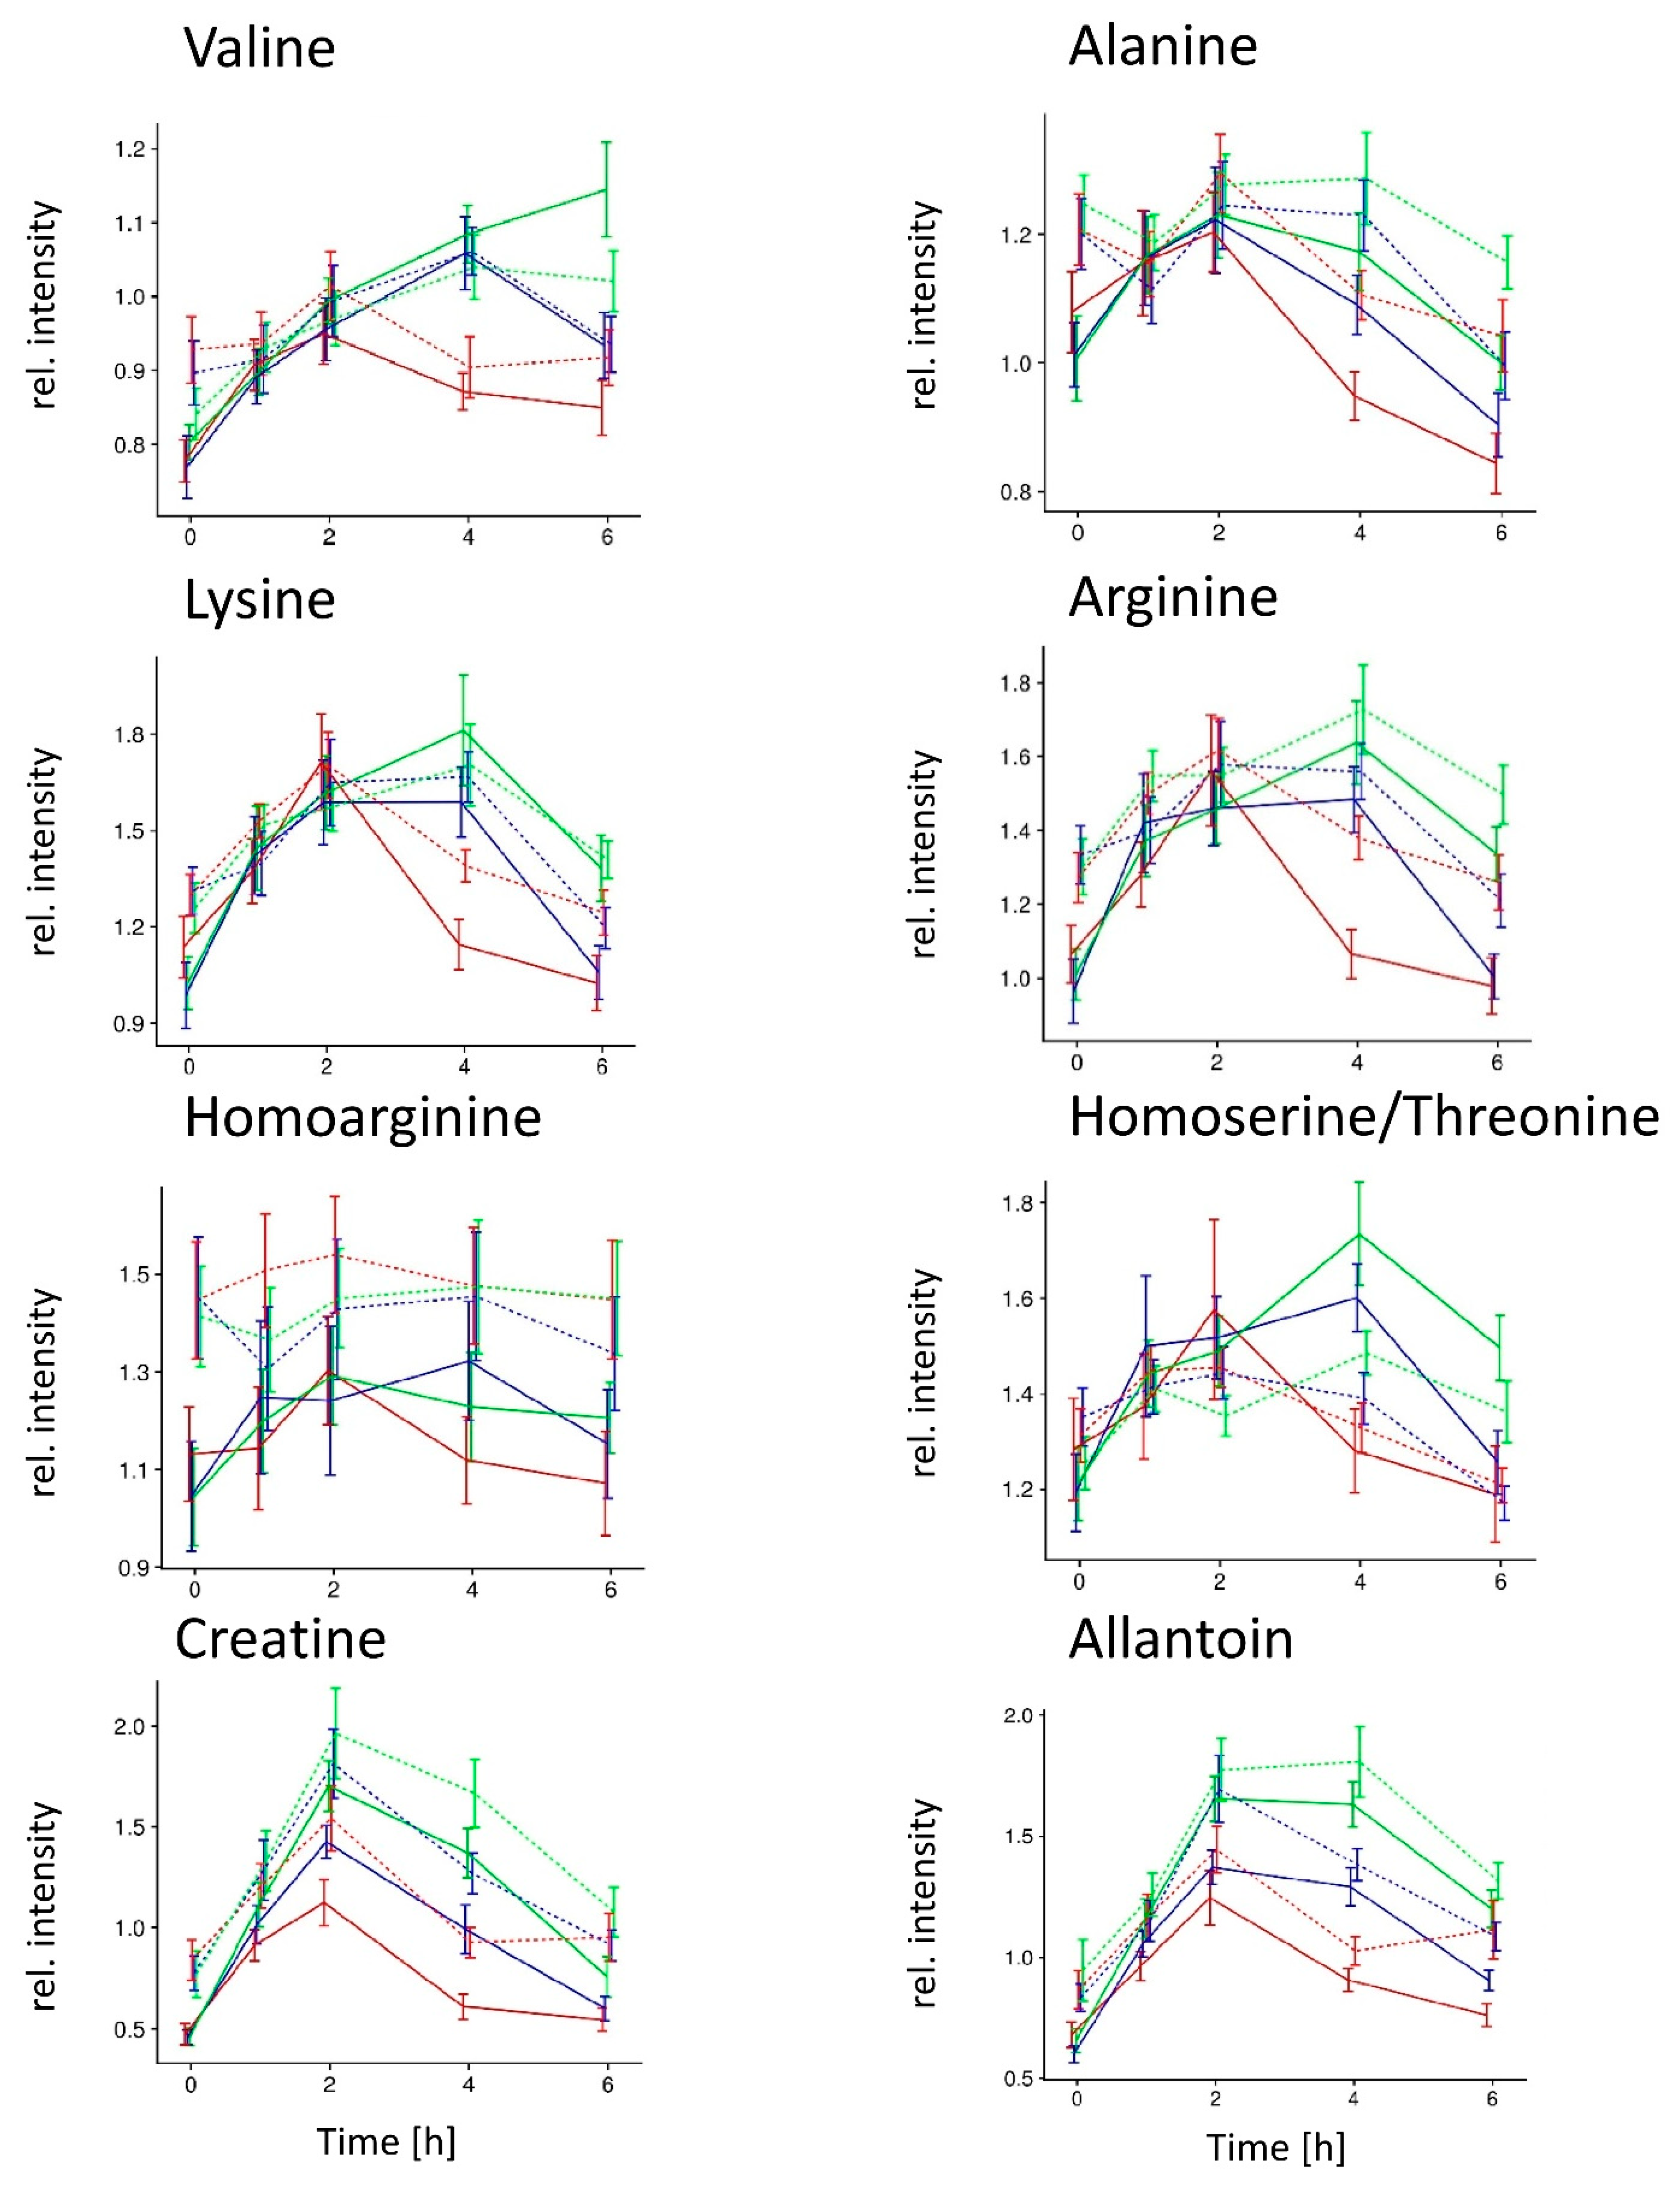
NW group; OB group; meals A, B, and C.
C.
NW group; OB group; meals A, B, and C.

Publisher’s Note: MDPI stays neutral with regard to jurisdictional claims in published maps and institutional affiliations. |
© 2021 by the authors. Licensee MDPI, Basel, Switzerland. This article is an open access article distributed under the terms and conditions of the Creative Commons Attribution (CC BY) license (https://creativecommons.org/licenses/by/4.0/).
Share and Cite
Bütikofer, U.; Burnand, D.; Portmann, R.; Blaser, C.; Schwander, F.; Kopf-Bolanz, K.A.; Laederach, K.; Badertscher, R.; Walther, B.; Vergères, G. Serum Metabolites Responding in a Dose-Dependent Manner to the Intake of a High-Fat Meal in Normal Weight Healthy Men Are Associated with Obesity. Metabolites 2021, 11, 392. https://doi.org/10.3390/metabo11060392
Bütikofer U, Burnand D, Portmann R, Blaser C, Schwander F, Kopf-Bolanz KA, Laederach K, Badertscher R, Walther B, Vergères G. Serum Metabolites Responding in a Dose-Dependent Manner to the Intake of a High-Fat Meal in Normal Weight Healthy Men Are Associated with Obesity. Metabolites. 2021; 11(6):392. https://doi.org/10.3390/metabo11060392
Chicago/Turabian StyleBütikofer, Ueli, David Burnand, Reto Portmann, Carola Blaser, Flurina Schwander, Katrin A. Kopf-Bolanz, Kurt Laederach, René Badertscher, Barbara Walther, and Guy Vergères. 2021. "Serum Metabolites Responding in a Dose-Dependent Manner to the Intake of a High-Fat Meal in Normal Weight Healthy Men Are Associated with Obesity" Metabolites 11, no. 6: 392. https://doi.org/10.3390/metabo11060392