Article

Metabolite Profiling in Arabidopsisthaliana with Moderately Impaired Photorespiration Reveals Novel Metabolic Links and Compensatory Mechanisms of Photorespiration

1
Plant Physiology Department, University of Rostock, Albert-Einstein-Straße 3, 18059 Rostock, Germany
2
Max Planck Institute of Molecular Plant Physiology, Am Mühlenberg 1, D-14476 Golm, Germany
3
Departamento de Biologia Vegetal, Universidade Federal de Viçosa, Viçosa 36570-900, Minas Gerais, Brazil
4
Institute of Plant Biochemistry, Cluster of Excellence on Plant Science (CEPLAS), Heinrich Heine University Düsseldorf, Universitätsstrasse 1, 40225 Düsseldorf, Germany
5
Centre for Organismal Studies, University of Heidelberg, Im Neuenheimer Feld 360, D-69120 Heidelberg, Germany
6
Department of Molecular Systems Biology, University of Vienna, Althanstrasse 14, 1090 Vienna, Austria
*
Authors to whom correspondence should be addressed.
Metabolites 2021, 11(6), 391; https://doi.org/10.3390/metabo11060391
Submission received: 25 May 2021 / Revised: 9 June 2021 / Accepted: 11 June 2021 / Published: 15 June 2021
(This article belongs to the Special Issue Photorespiration on Plant Metabolism)

Abstract

:
Photorespiration is an integral component of plant primary metabolism. Accordingly, it has been often observed that impairing the photorespiratory flux negatively impacts other cellular processes. In this study, the metabolic acclimation of the Arabidopsis thaliana wild type was compared with the hydroxypyruvate reductase 1 (HPR1; hpr1) mutant, displaying only a moderately reduced photorespiratory flux. Plants were analyzed during development and under varying photoperiods with a combination of non-targeted and targeted metabolome analysis, as well as 13C- and 14C-labeling approaches. The results showed that HPR1 deficiency is more critical for photorespiration during the vegetative compared to the regenerative growth phase. A shorter photoperiod seems to slowdown the photorespiratory metabolite conversion mostly at the glycerate kinase and glycine decarboxylase steps compared to long days. It is demonstrated that even a moderate impairment of photorespiration severely reduces the leaf-carbohydrate status and impacts on sulfur metabolism. Isotope labeling approaches revealed an increased CO2 release from hpr1 leaves, most likely occurring from enhanced non-enzymatic 3-hydroxypyruvate decarboxylation and a higher flux from serine towards ethanolamine through serine decarboxylase. Collectively, the study provides evidence that the moderate hpr1 mutant is an excellent tool to unravel the underlying mechanisms governing the regulation of metabolic linkages of photorespiration with plant primary metabolism.

1. Introduction

Plants are exposed to a frequently changing environment throughout all stages of development. Among others, this especially includes sudden alterations in the prevailing temperature, water and nutrient availability, the CO2/O2 ratio and light availability. Therefore, dynamic regulation of metabolism to either long- or short-term environmental changes is required to sustain metabolic robustness for efficient photosynthesis and growth [1,2,3]. In this regard, photorespiration emerged as one of the key determinants for an optimal acclimation capacity towards a multitude of environmental factors in oxygenic phototrophs [4,5,6,7]. This is because the pathway represents the second highest carbon flux during illumination and is orchestrated in four different subcellular compartments (chloroplasts, peroxisomes, mitochondria and the cytoplasm) and as such eventually impacts on a multitude of other processes [8,9,10].
The term photorespiration describes the light-induced CO2 release and O2 uptake in C3 plants. The photorespiratory metabolism is mainly required to remove 2-phosphoglycolate (2PG), the major side product of ribulose-1,5-bisphosphate (RuBP) carboxylase/oxygenase (RubisCO) in the O2-rich atmosphere. This process is essential because 2PG severely inhibits key enzymes involved in carbon assimilation and utilization pathways, such as the Calvin-Benson cycle, glycolysis and starch metabolism [11,12,13,14]. Accordingly, acceleration of the photorespiratory flux, i.e., faster 2PG degradation, stimulates the operation of the afore-mentioned pathways, which ultimately culminates in improved photosynthesis, growth and abiotic stress tolerance [13,15,16,17]. However, the significance of photorespiratory metabolism is not restricted to 2PG removal alone. A broad line of evidence exists for the contribution of photorespiration to the operation of other metabolic and physiological processes. To date, well-established intercepts are reported for C1 carbon metabolism [18] and nitrogen assimilation [19,20], while initial evidence was recently obtained that optimal photorespiration is also needed for the assimilation of sulfur [21]. Furthermore, it was demonstrated that photorespiration strongly impacts on the overall cellular redox-homeostasis [22], the abiotic stress tolerance [5,6], the stomatal movements [7], and was suggested to play a role in photoprotection [4]. Hence, it is reasonable to conclude that photorespiration makes a major contribution to the metabolic robustness of the plant during different stages of development.
Interestingly, comprehensive studies on different photorespiratory mutants during high to low CO2 transition [7,23] and experiments with wild-type plants exposed to environmental conditions [24,25] that promote photorespiration (i.e., RuBP oxygenation) suggested further links of the pathway with other metabolic branches. For instance, clear metabolic alterations were frequently observed in the tricarboxylic acid (TCA) cycle, amino acid metabolism or the urea cycle in response to impaired photorespiration [26,27,28]. While such responses were observed in independent studies, the regulatory mechanisms governing such metabolic linkages are still largely unknown and require further attention [29,30]. Enlarging our current understanding of the underlying regulatory mechanisms is thus mandatory to enhance overall metabolic robustness of plant metabolism towards future climate scenarios [31,32]. For such purposes, mutants showing only moderate photorespiratory phenotypes are seemingly the most valuable tools, because most pathway deletion mutants cannot survive under ambient conditions and show many pleiotropic responses [7,23].
In this study, the metabolic acclimation of Arabidopsis thaliana (Arabidopsis) with normal and moderately impaired photorespiration was analyzed. For this purpose, relative and absolute metabolite quantification were combined with isotope labeling approaches. Air-grown Arabidopsis wild-type plants (Col-0) were compared with the hpr1 single mutant (deficient in hydroxypyruvate (3HP) reductase 1; HPR1—At1g68010) at different developmental stages and photoperiods. Metabolite profiling during development reveals that impairing the photorespiratory flux is more critical during vegetative growth compared to the reproductive phase and that a shorter photoperiod seems to slowdown the photorespiratory metabolite conversion compared to long days, especially due to altered regulation of glycerate 3-kinase (GLYK) and the glycine decarboxylase (GDC) activity. Despite moderately impaired photorespiration and growth of hpr1 in air [33,34], we demonstrate that the mutant displays severe alterations in the leaf-carbohydrate status, impacting on carbohydrate derivates related to cell wall biosynthesis, and a significantly higher fraction of CO2 release from illuminated leaves. The obtained results are discussed mainly in the context of novel interactions of photorespiration, such as those with cell wall and ethanolamine (ETA) biosynthesis, as well as additional decarboxylation reactions in response to impaired photorespiration, mainly non-enzymatic decarboxylation of 3HP. The most critical photorespiratory steps for acclimation towards altered photoperiods were also determined.

2. Results

To assess the impact of moderately impaired photorespiration on the metabolic acclimation capacity of Arabidopsis, especially during developmental and photoperiodic alterations, three sets of experiments were designed. First, targeted absolute metabolite quantification combined with [U-13C]-glucose and [U-14C]-glycine labeling approaches were carried out to obtain a higher resolution of the key metabolic changes in hpr1 compared to the wild type (Col-0) grown in normal air. Second, metabolic profiles of the wild type with the hpr1 mutant during different developmental stages were compared. Third, diurnal metabolic cycles of selected photorespiratory intermediates of the wild type and the hpr1 mutant grown in air under two different photoperiods were analyzed.

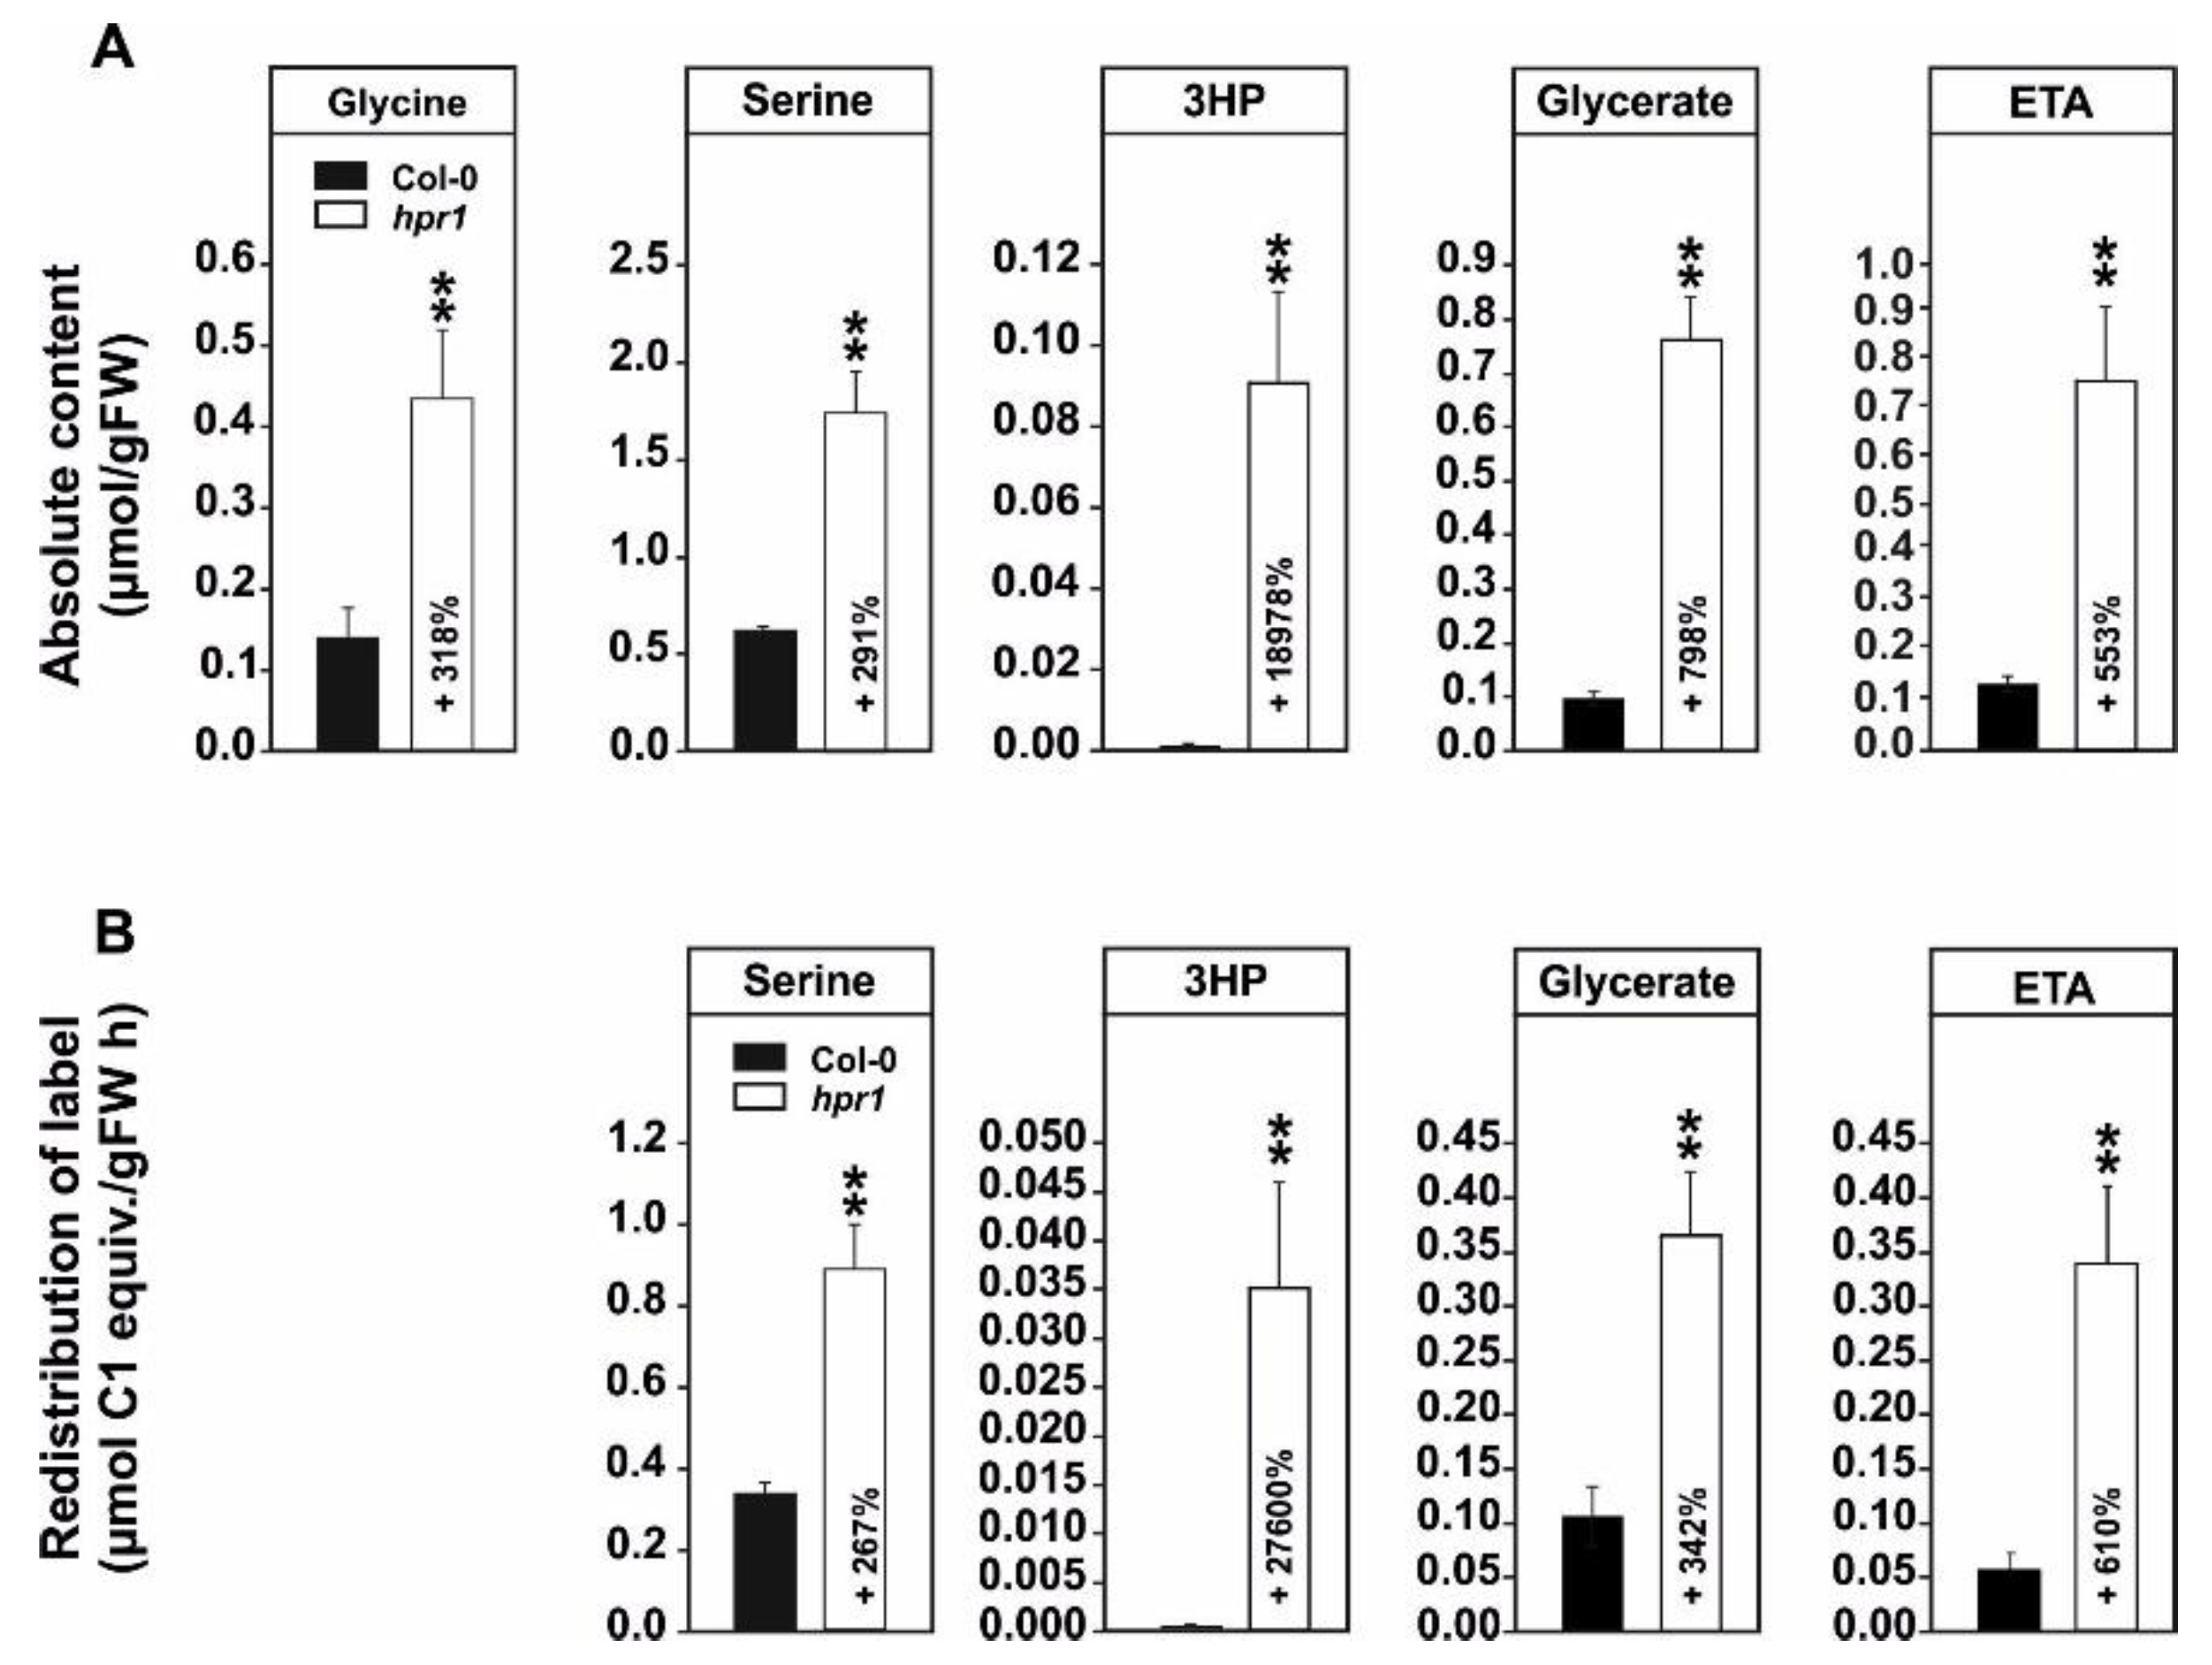
2.1. Absolute Metabolite Quantification and 13C-Glucose Feeding Suggests Enhanced Non-Enzymatic 3HP Decarboxylation and Increased Flux towards Ethanolamine in hpr1

Compared to most other photorespiration mutants, previous metabolome studies on the hpr1 mutant revealed only very few, but specific, metabolic changes, demonstrating its value to specifically analyze metabolic interactions of photorespiration [23,33,35]. However, in all these studies, metabolites were determined only as relative changes. In order to gain a higher resolution of the metabolic alterations in hpr1, especially of those linked to the photorespiratory pathway, an absolute metabolite quantification approach using plants grown in normal air was employed. As shown in Figure 1A, hpr1 showed significant increases in the absolute amounts of photorespiratory intermediates including glycine (3.2-fold), serine (2.9-fold), and glycerate (8.0-fold). Expectedly, the strongest relative increase was seen in 3HP (190-fold). Given that some alterations in the ethanolamine (ETA) content was observed during previous studies [23,33], this intermediate was also in focus. Interestingly, an approximately 5.5-fold higher absolute amount of ETA was determined in hpr1.
Increased steady-state amounts can originate from increased synthesis or decreased breakdown, the latter is clearly the case for 3HP in the hpr1 mutant. To directly gain insights in the turnover of the mentioned intermediates, the incorporation of 13C in those representatives was measured following [U-13C]-glucose feeding. The relative 13C incorporation into serine (2.7-fold; flux from glycine), glycerate (3.4-fold; flux from 3HP) and ETA (6.1 fold; flux from serine) was significantly enhanced in the mutant hpr1 compared to the wild type. Interestingly, all flux enhancements were in a comparable range as the increases in the absolute values. Accordingly, the increase in steady-state levels of these intermediates is well supported by an increased 13C incorporation into these pools. Exceptionally, a significantly higher proportion of 13C incorporation into 3HP (276-fold; flux from serine) in hpr1 was measured compared to the increase in its steady-state level (Figure 1B). In the case of 3HP, the labeling increase was almost 60% higher than expected from its accumulation, which indicates an increased breakdown of 3HP in the mutant independent from the HPR1 reaction. This statement agrees well with a decrease (~57%) in 13C labeling in glycerate if compared to its absolute steady-state amount (Figure 1A,B).

2.2. 14C-Glycine Labeling Reveals a Strong Reduction of the Leaf Carbohydrate and Organic Acid Status and an Increased CO2 Release from hpr1 Leaves

The next aim was to classify the metabolic alterations in the hpr1 mutant through carbon isotope fractionation following [U-14C]-glycine labeling. For this purpose, plants grown for 5 weeks under photorespiratory conditions in normal air with a 12/12 h day/night cycle were used. In general, hpr1 showed a significantly increased labeling in the fraction of free amino acids (+106%), while organic acids (–29%), soluble sugars (–51%), and the high molecular mass fraction including starch, the cell wall and proteins (–60%) were less labeled compared to the wild type (Figure 2A). Interestingly, hpr1 displayed an increased CO2 release (~29% on average) from the leaves compared to the wild type (Figure 2B).

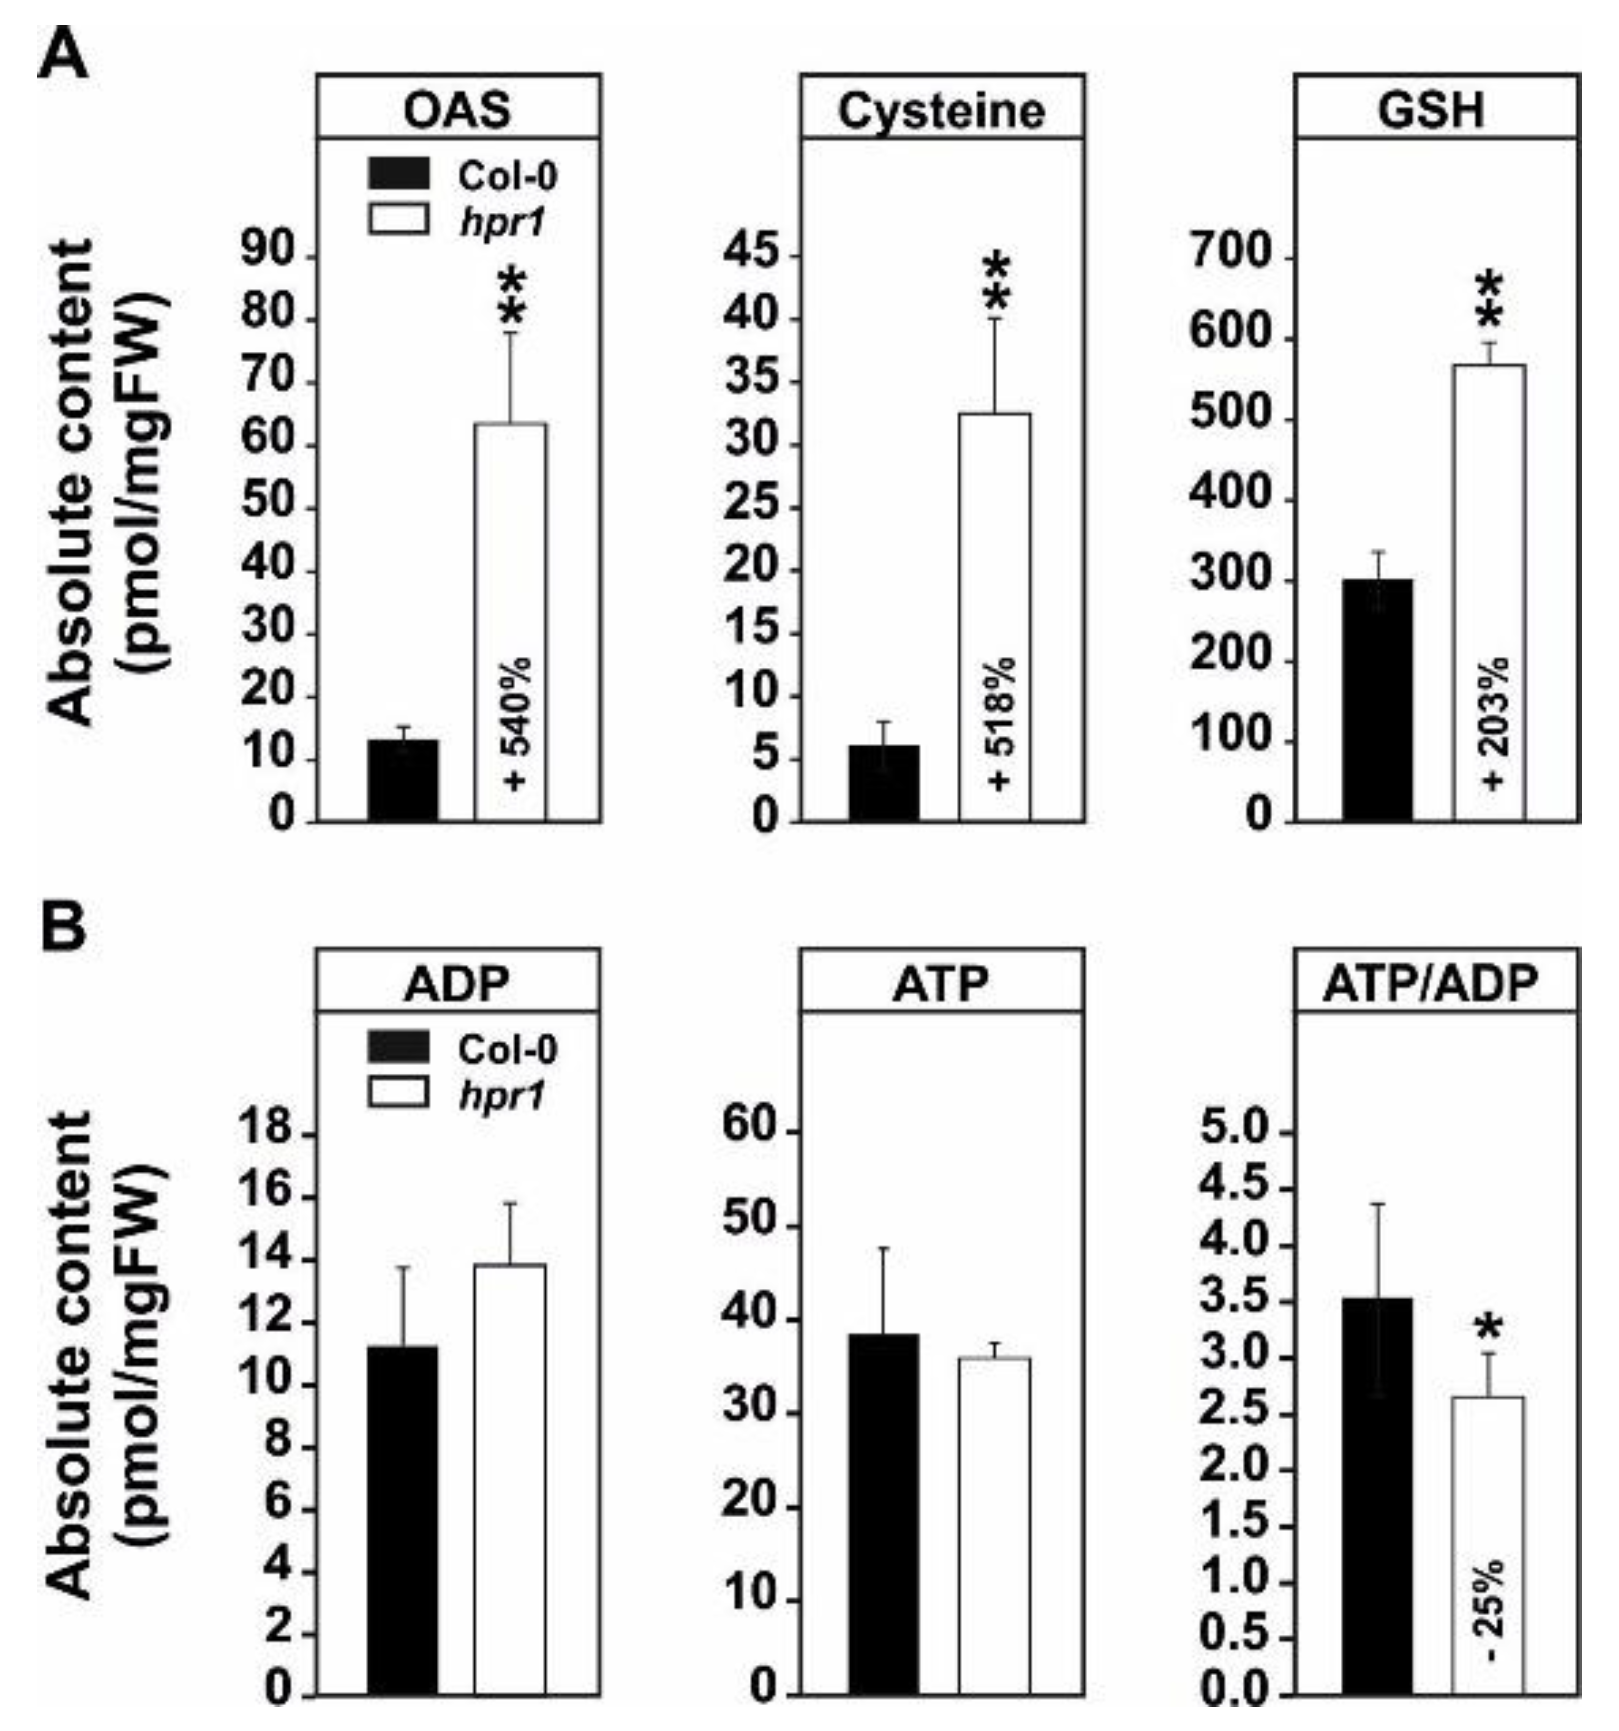
2.3. The Elevated Serine Content in hpr1 Enhances Glutathione Biosynthesis

In addition to the expected impact of HPR1 deficiency on photorespiratory serine and 3HP accumulation, clear indications were observed that other pathways also respond to elevation of these intermediates, particularly serine. As shown in Figure 3A, hpr1 accumulated O-acetylserine (OAS, +540%), the precursor of cysteine biosynthesis, as well as cysteine (+518%) itself. Additionally, an increase was found in glutathione (GSH; sum parameter of GSH + GSSG, +203%) in hpr1 compared to wild type (Figure 3A). Despite these changes, only minor changes in the amounts of adenosine phosphates were detected. In detail, a slight, but non-significant, increase in ADP was seen in hpr1, while ATP was mostly unaltered. However, the ATP/ADP ratio was significantly reduced (~25%) in the hpr1 mutant compared to the wild type (Figure 3B).

2.4. HPR1 Deficiency Increasingly Impairs Photorespiration during Vegetative Growth

Photorespiration is essential to activate photosynthesis already during postembryonic growth after the transition from night to day in normal air [36,37]. Hence, it seems reasonable that the pathway needs to operate efficiently in leaves throughout all stages of plant development. To analyze this from the metabolic point of view, the wild type and the hpr1 mutant were grown in air and leaf-material harvested for subsequent metabolome analysis at five selected stages (3 to 7 weeks after germination; WAG). While material of the first three time points (3–5 WAG) is characteristic for vegetative growth, the latter two (6–7 WAG) are representative for the reproductive phase. In the wild type, five diagnostic intermediates of photorespiration (glycolate, glycine, serine, 3HP and glycerate) did not show many variations during development, except for a stable increase in serine after week 5 (Figure 4A). In contrast, the mild reduction in the photorespiratory flux in hpr1 [34] caused a characteristic over-accumulation pattern of these photorespiratory intermediates. All pathway intermediates increased in their abundances during the vegetative phase, reaching highest levels after 5 weeks, but subsequently declined after bolting (between week 5 and 6), which induces the transition to the reproductive phase. However, glycolate and glycine remained elevated (3–5-fold) after 6–7 weeks compared to the wild type (Figure 4A).

2.5. Impaired Photorespiration Lowers the Accumulation of Sugars

Reduction of the photorespiratory flux feeds back to the operation of photosynthesis, especially the operation of the Calvin–Benson cycle and carbon export thereof [13,38,39]. Therefore, the accumulation of soluble sugars and higher mass carbohydrates were followed. Except for trehalose, the wild type increasingly accumulated sugars including glucose, sucrose, fructose and maltose during the course of our experiment, reaching highest levels in the reproductive growth phase. A similar pattern was seen also for raffinose and selected carbohydrates and carbohydrate derivates related to cell wall metabolism including galactinol, melibiose, fucose and myo-inositol (Figure 4B, lower panel). In hpr1, glucose, sucrose and fructose were generally less abundant and present at similar amounts over the analyzed time points. Maltose differed a bit from that pattern, as it appeared slightly elevated in the early phase of the experiment but tended to decrease in the late stages. Again, no consistent change and pattern was seen in the amounts of trehalose in hpr1 (Figure 4B, upper panel). However, HPR1 deficiency caused a strong and consistent reduction in raffinose, galactinol and myo-inositol over all analyzed time points. Fucose was present at similar amounts during the first two weeks, but also significantly reduced at the latter 3 time points. Melibiose showed a biphasic accumulation pattern, as it was present at higher amounts during the first three weeks but declined after transition to the reproductive growth phase (Figure 4B. lower panel). Collectively, these results demonstrate that reduction in the photorespiratory flux in hpr1 impacts on high molecular mass carbohydrate accumulation and, possibly, cell wall biosynthesis, due to lowered substrate availability. In addition to the metabolic changes observed in course of the current study, previous characterization of hpr1 via mRNA sequencing supports this hypothesis. The transcript abundance of the enzyme myo-inositol 1-phosphate synthase 1 (MIPS1, [40]), the major myo-inositol biosynthesizing enzyme, was strongly reduced in hpr1 upon transition to ambient CO2 conditions (Figure A1; [7]).

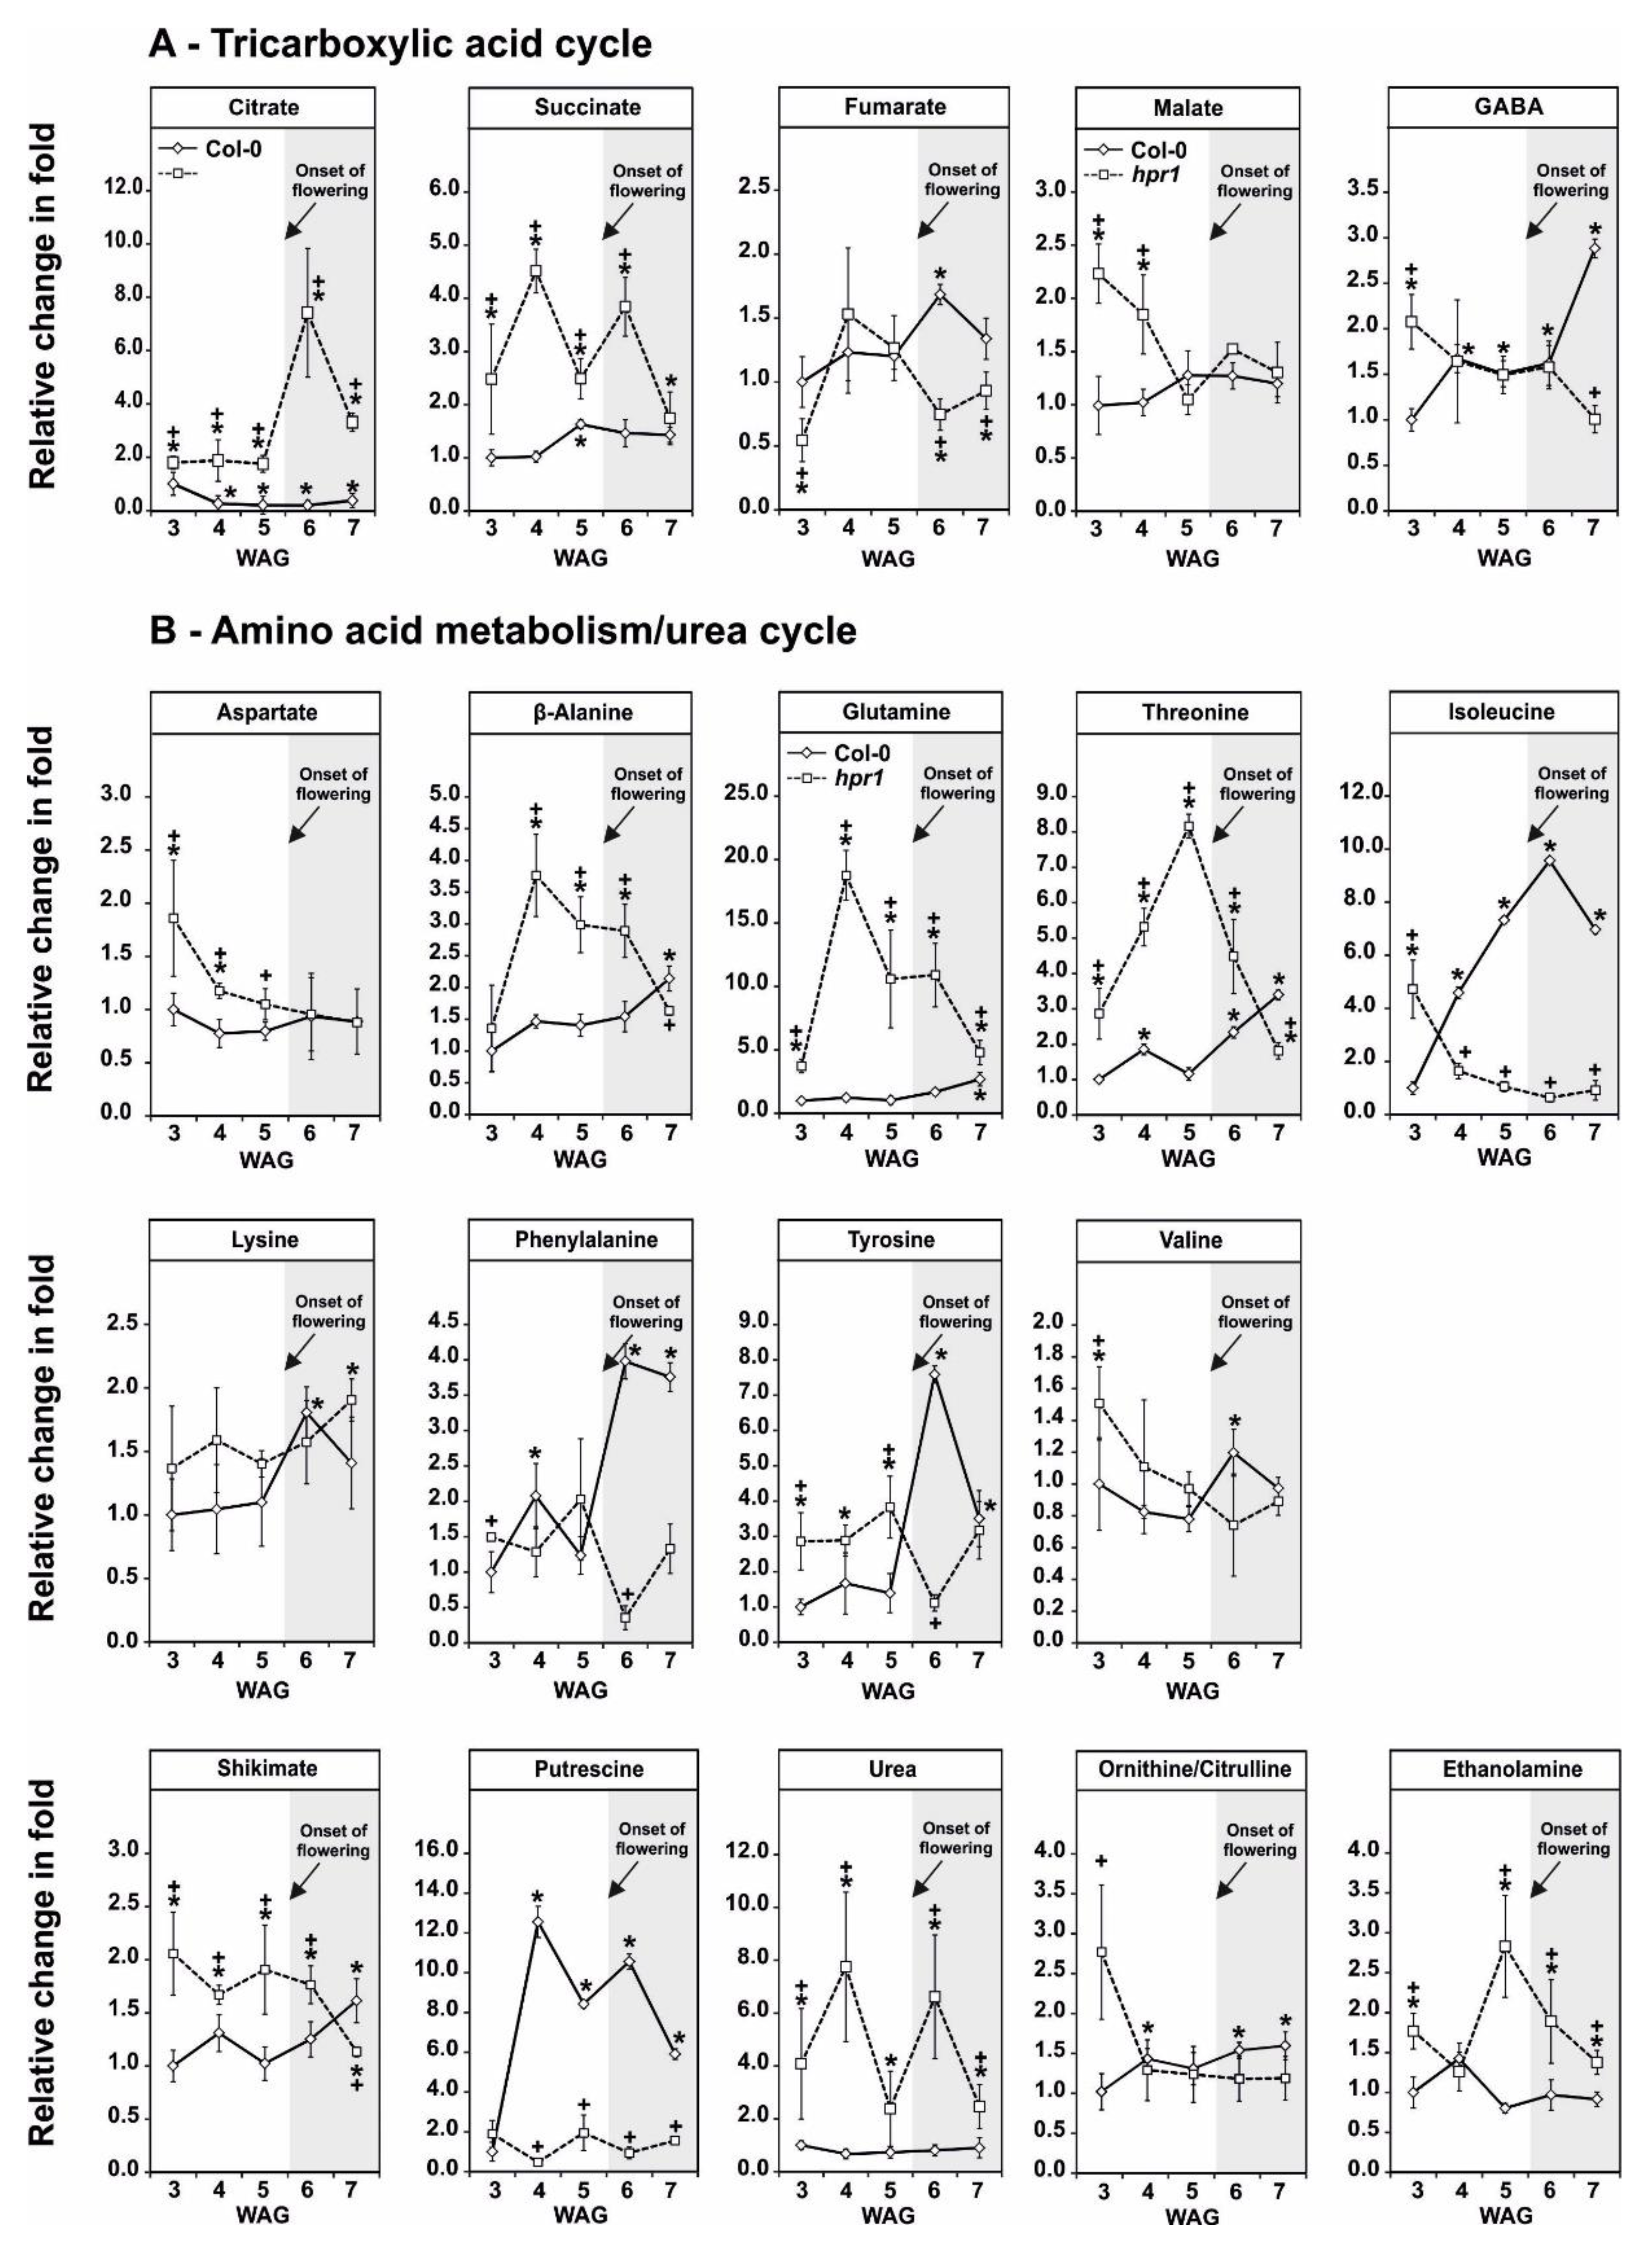
2.6. HPR1 Deficiency Impacts on the TCA Cycle and Amino Acid Metabolism during Development

An impact on the operation of the TCA cycle was previously observed in photorespiratory mutants during CO2 transition [7,23]. Therefore, five selected representatives of, or associated to, the pathway were profiled during development. Minor fluctuations (~1.5-fold) in citrate, succinate, fumarate and malate were seen in the wild type. Only GABA increased during the experiment, with highest levels (~2.5-fold) 7 WAG (Figure 5A). Deletion of HPR1, however, impacted those accumulation patterns. Citrate and succinate were generally higher in the hpr1 mutant over time, while minor fluctuations were seen in fumarate (decreased at week 6 and 7) and malate (increased in weeks 3 and 4). The accumulation of GABA was inverse of that in the wild type, which was elevated at week 3 and gradually decreasing until week 7 (Figure 5A).
Among the analyzed amino acids, aspartate and valine showed almost no changes over the entire period of the experiment in the wild type. However, many others continuously increase over time (glutamine, threonine, alanine, isoleucine, lysine, phenylalanine and tyrosine) with highest values in the reproductive growth phase (Figure 5B). A similar pattern was seen for the aromatic amino acid biosynthesis precursor shikimate or the amino acid breakdown product putrescine, while representatives of the urea cycle (urea, ornithine/citrulline) were largely invariant. ETA, a major integral part of important phospholipids, also showed only minor fluctuations in the wild type (Figure 5B). The slowdown in the photorespiratory flux in hpr1 altered the wild-type patterns of specific metabolites. For example, alanine, glutamine, threonine and ETA showed an accumulation pattern comparable to typical photorespiratory intermediates in hpr1 (Figure 4A, Figure 5B). In contrast, isoleucine, phenylalanine, tyrosine, shikimate, putrescine and ornithine/citrulline showed inverse accumulation pattern as in the wild type, while the amount of urea was elevated at all of the analyzed time points in hpr1. Small, but significant changes between the control and the mutant were, however, seen with aspartate, lysine and valine (Figure 6B).

2.7. Short Day Growth seems to Slowdown the Photorespiratory Flux Mainly at the GDC and GLYK Steps

Since daylength eventually impacts on photorespiration and overall metabolism [42,43], metabolite accumulation patterns in response to alterations of the photoperiod were examined. For this reason, the wild type and hpr1 were grown in normal air with two different day/night-cycles (short day [SD], 10/14 h day/night cycle and long day [LD], 16/8 h day/night cycle) and samples taken at four diagnostic time points (end of night (EoN); mid of day (MoD); end of day (EoD) and mid of night (MoN), respectively) were analyzed.
Among the five representative photorespiratory intermediates (glycolate, glycine, serine, 3HP, and glycerate), specific differences in the diurnal accumulation pattern in the wild type between the two photoperiods were observed. In general, glycolate, serine and 3HP showed comparably minor fluctuations (~2–4-fold compared to EoN) during the day/night cycles, which were also very similar in both photoperiods. In detail, glycolate and serine increased in response to illumination with virtually highest amounts at EoD (Figure 6A). 3HP fluctuations were a bit less consistent given that almost equal amounts were seen at EoN and MoD, while some accumulation is visible at EoD and MoN. Apart from that, glycine and glycerate showed a clear diurnal pattern with highest increases (between 25–35-fold increase during illumination) among the photorespiratory intermediates. Interestingly, the accumulation of both intermediates was significantly pronounced in SD compared to LD (Figure 6A).
In hpr1, these rhythms were even stronger. Glycolate fluctuations were comparable to the wild type, with similar patterns in both photoperiods, but the contents were elevated to about 8–10-fold during illumination followed by a decline at MoN (Figure 6B). A comparable pattern is also visible for 3HP in hpr1 in SD and LD, while the increases are distinctly higher during illumination (up to ~20–25-fold increase at EoD) as excepted due to the lack of HPR1. As described for the wild type, glycine and glycerate showed a clear diurnal rhythm in both photoperiods, again with the strongest amplitudes in SD. Most distinctly, glycine showed the highest increases in SD (up to 160-fold) at MoD and EoD. Comparable to a previous study [35], hpr1 has almost equal amounts of serine at all timepoints during the day/night cycle in both photoperiods but its elevation was double as high in LD (~12-fold) compared to SD (~6-fold) (Figure 6B).

3. Discussion

The aim of this study was to gain insights into the metabolic acclimation of Arabidopsis with moderately impaired photorespiration, i.e., in a mutant deficient in peroxisomal HPR1 (hpr1). The hpr1 mutant was in focus given that it is able to thrive in normal air, allowing us to particularly study the long-term metabolic acclimation without the necessity of short-term CO2-transitions used for most other pathway mutants before e.g., [7,23,44]. For this purpose, different metabolomics approaches during different developmental stages and photoperiods were employed. The main aim was to identify yet unknown metabolic links of photorespiration and potential compensatory mechanisms that occur in response to an impaired photorespiratory flux.

3.1. HPR1 Deficiency Causes Enhanced Leaf CO2 Release by Both, Increased Non-Enzymatic 3HP Decarboxylation and Higher Flux from Serine to ETA

First, a higher resolution on the metabolic alterations within the photorespiratory pathway, especially of that close to the HPR1 reaction through a combination of absolute metabolite quantification as well as 13C- and 14C-labeling approaches was obtained. This was done to eventually distinguish between changes in the steady-state contents and the flux through the pathway. In good agreement with previous studies [23,35], hpr1 accumulates most photorespiratory intermediates in the range of ~3–8-fold (Figure 1A). Compared to many other pathway mutants, these alterations are relatively moderate (7, 23). This is best explained due to the operation of the cytoplasmic HPR2 bypass, compensating the vast amount of the pathway flux [34,35]. However, absolute metabolite quantification reveals a strong overaccumulation of 3HP, the HPR substrate, which was in the similar range as for other photorespiration mutants including that of glycerate 3-kinase (glyk1), serine hydroxymethyltransferase 1 (shm1), and 2-phosphoglycolate phosphatase 1 (pglp1) [7,13,45]. Relatively moderate metabolite changes were supported by the analysis of the redistribution of 13C in the same photorespiratory intermediates (glycine, serine and glycerate) following 13C-glucose labeling (Figure 1B). While accumulation of glycine and serine is likely caused by negative backlog on the pathway flux due to the impaired HPR reaction, accumulation in glycerate is not directly intuitive. Currently, the best explanation would be glycerate accumulation in the cytosol, resulting from enhanced 3HP reduction through HPR2. Given its reintegration into the chloroplasts by the plastidal glycolate/glycerate transporter (PLGG1) is in counter exchange with glycolate [46], the perturbed photorespiratory flux in hpr1 might cause an imbalance in the operation of PLGG1. Notably, a significantly higher fraction of 13C incorporation into 3HP was observed in comparison to the change seen in the steady-state amounts in hpr1. This result can serve as indication for a higher 3HP turnover independent of HPR1. As a likely explanation for the observed effect, an increased non-enzymatic decarboxylation of 3HP can be anticipated. This assumption agrees well with previous studies on isolated peroxisomes [47] and the elevated CO2 release from hpr1 leaves observed during this study (Figure 2B). Another mechanism by which an increased CO2 release from hpr1 mutant leaves can be partially explained is the glucose-6-phosphate shunt as recently suggested [48,49]. Given the cytosolic HPR2 bypass is NADPH dependent, an upregulation in this pathway is a likely scenario in hpr1 in order to provide more reductant for an elevated flux through the cytoplasm. However, and based on the data presented here, a partially redirected photorespiratory flux from serine could also serve as a likely additional source contributing to the elevated CO2 liberation from hpr1. Serine decarboxylase (SDC), a pyridoxal phosphate dependent enzyme, was suggested to be the major source of ethanolamine (ETA) used for choline biosynthesis in plants [50,51]. Since an increase in the steady-state ETA content and an elevated 13C incorporation into this intermediate in hpr1 was observed (Figure 1A,B), it is tempting to speculate that a fraction of the photorespiratory serine leaks from the mitochondria into the cytoplasm where SDC resides [52]. This potential compensatory mechanism could also serve as explanation why hpr1 maintains constantly equal serine levels during day/night cycles in different photoperiods (Figure 6B). Keeping the serine level under tight control is key because it negatively affects the transcription and translation of genes associated with photorespiration, i.e., the induction in response to onset of illumination [35].

3.2. Even a Moderate Impairment in the Photorespiratory Flux Reduces the Leaf-Carbohydrate Status including a Reduction in Metabolites Related to Cell Wall Biosynthesis

Taking advantage of a 14C-glycine labeling approach, a more global overview on the carbon allocation in hpr1 (Figure 2A) was obtained. Compared to the wild type, a larger fraction of photo-assimilated carbon was shifted towards amino acids biosynthesis in hpr1. Significant reductions were seen in the fractions combining either, organic acids, soluble sugars and high molecular mass components including starch, the cell wall and proteins (Figure 2A). Rationally, the increase in the amino acid pool was presumably due to the accumulation of photorespiratory glycine and serine (Figure 1A,B, Figure 4; Figure 6), while hpr1 also showed some accumulations in other amino acids (Figure 5). A part of the explanation for amino acid accumulation could also be enhanced chlorophyll and protein degradation due to the decreased carbohydrate availability. This hypothesis is, at least to some extent, supported by elevated urea and putrescine levels in hpr1 (Figure 5B). Moreover, hpr1 contains reduced chlorophyll amounts [34] and has yellowish leaves in air (Figure A2). Thus, it seems likely that proteins are used as alternative respiratory substrates under circumstances were carbon is limited as suggested [53]. Such metabolic reprograming agrees well also with the alteration in the TCA-cycle intermediates observed during this study (Figure 5A).
The reduction in either, the fraction of soluble sugars (mainly glucose, sucrose and fructose), as well as higher molecular/storage carbohydrates including starch and intermediates related to cell wall biosynthesis (raffinose, galactinol, myo-inositol) was present on a short-term during the 14C-labeling approach and consistently seen during plant development in hpr1 (Figure 2A, Figure 4A). While reduction in the soluble sugars and starch was seen for other photorespiratory mutants before, e.g., [7,13,23], mainly because of impaired Calvin–Benson cycle operation and carbon export thereof, the likely additional impact on cell wall biosynthesis was not yet reported. However, it is possible that the general reduction in the availability of soluble sugars impacts on the synthesis of higher molecular mass carbohydrates. This effect seems to extent to a decrease in cell wall components (Figure 2A, Figure 4B). In addition to the lower substrate availability, a strong decrease in the transcript abundance of the major myo-inositol biosynthesizing enzyme myo-inositol 1-phosphate synthase 1 was observed (MIPS1, [40]) in hpr1 during CO2 transition (Figure A1). Compared to that genes encoding galactinol, raffinose and stachyose synthases were not differentially expressed in the same experiment [7]. Collectively, it is likely to hypothesize that a combination of lowered substrate availability and deregulated MIPS1 account for the reduction in higher molecular mass carbohydrates including cell wall constituents. This altered metabolism might also serve as an explanation for the thinner and softer hpr1 leaves (Figure A2) [33].

3.3. HPR1 Deficiency Impacts on Glutathione Biosynthesis

During photorespiration, HPR1 converts 3HP to glycerate in peroxisomes, using NADH as cofactor [34]. Therefore, it was tempting to speculate that lack of HPR1 eventually impacts on the peroxisomal redox-homeostasis and, in turn, the overall cellular redox status through the action of the malate valve [54]. To encounter imbalances in the subcellular redox-status, and to ultimately prevent oxidative damage, plants synthesize and accumulate glutathione (GSH) as redox-buffer in various subcellular compartments [55]. Indeed, we measured a significant increase (2-fold) in total GSH in hpr1 during illumination (Figure 3A), suggesting alterations in the subcellular redox-state. Given we did not further characterize redox-metabolism in hpr1 during this study, future work is needed in order to shed more light on this aspect. However, impairment of the photorespiratory flux in hpr1 not only leads to the specific accumulation of GSH, but also to that of O-acetylserine (OAS) and cysteine compared to the wild type (Figure 3A). Therefore, and in light of the absolute increases in glycine and serine (Figure 1; Figure 6), the changes in GSH are more likely due to a partially redirected carbon flux from both amino acids towards GSH in illuminated leaves as observed for ETA via SDC (Figure 1). We can currently only hypothesize that increased cellular GSH is to protect cellular membranes are a matter of a general stress response as previously discussed [56].

3.4. Impairment of the Photorespiratory Flux in hpr1 Is Strongest during Vegetative Growth in a Fully Developed Rosette

Photorespiration is essential for the transition from heterotrophic to photoautotrophic growth, i.e., to establish photosynthesis in air [36,37]. Therefore, one can assume similar rates of photorespiration during plant development including equal abundances of photorespiratory intermediates. Indeed, the wild type showed only very minor alterations in the photorespiratory intermediates during both, vegetative and regenerative growth, respectively (Figure 4A). However, a slowdown of the photorespiratory flux in hpr1 leads to a specific accumulation pattern of all pathway intermediates, that is increasing accumulation until onset of illumination, followed by decreasing amounts during regenerative growth (Figure 4A). From this result, it is reasonable to conclude that the need for a high photorespiratory flux is more required in the developing rosette but declines once plant shifts its metabolism to the reproductive phase. Accordingly, the growth reduction of hpr1 was more pronounced during the vegetative phase, while the mutant is of similar size in the reproductive growth phase (Figure A2) [33,34].

3.5. A Shorter Photoperiod Intensifies the Photorespiratory Defect, Mainly at the GDC Step

Photoperiods can differentially affect plant metabolism including photorespiration. For example, by using Arabidopsis mutants deficient in peroxisomal catalase (cat2), it was shown that a longer photoperiod (16/8 h day/night cycle) increases phenotypic symptoms (i.e., formation of leaf-lesions) related to H2O2 accumulation, while a shorter photoperiod (8/16 h day/night cycle) enhances the perturbation of the intracellular redox state [42,43]. Considering the latter fact in combination with the presented day/night metabolite data of the wild type and the hpr1 mutant grown in short- and long-days (Figure 6A,B), it seems reasonable to conclude that such shifts in the cellular redox state in shorter photoperiods mainly affect the activities of glycine decarboxylase (GDC) and, perhaps, glycerate kinase (GLYK) during the daily diurnal cycle. This statement is in good agreement with the observation that the photorespiratory intermediates glycine and glycerate showed the highest accumulation amplitude after onset of illumination in short days. Compared to that, glycolate, serine and 3HP showed only minor fluctuations that are also largely invariant between the two photoperiods in the wild type (Figure 6A). However, the described effects are significantly amplified in hpr1, displaying an impaired redox status (Figure 3A), especially at the glycine-to-serine conversion catalyzed by GDC (Figure 6B).
Onset of illumination induces photorespiration, which ultimately leads to a massive production of NADH in mitochondria through GDC activity [22]. Interestingly, it is known that GDC becomes inhibited at high NADH/NAD+ ratios [57], which eventually represents a mechanism to protect the mitochondria from overreduction if NADH recycling is suboptimal [14]. The strongly amplified glycine accumulation in the hpr1 mutant, which is unable to directly re-oxidize NADH in peroxisomes, supports this statement. It seems likely that wild-type mitochondria are susceptible towards this mechanism to control GDC activity especially under short-days, given that glycine accumulates to a much lesser extent under long-days in the wild type and hpr1 (Figure 6A,B). Accordingly, growth retardation of hpr1 compared to the wildtype is more pronounced under short-days (Figure A2). Finally, this hypothesis could potentially also explain, why overexpression of the GDC H- and L-protein stimulates photosynthesis and plant growth mainly under shorter photoperiods [15,16].
Redox regulation of GLYK was observed only for C4 plants to date [58]. Therefore, the higher amplitude of glycerate accumulation in short-days might not be a matter of impaired redox regulation of the GLYK protein, but rather be explained better by relatively low light-induction of the GLYK protein amounts during the day/night cycle compared to other photorespiratory proteins [35]. Another argument against redox regulation of the C3 plant GLYK protein is the fact that glycerate fluctuations are comparable between the wild type and hpr1 in short-days (Figure 6). However, elevation of glycerate amounts in hpr1 grown under long-days are likely due to the higher fraction of 3HP conversion in the cytosol and the need to reincorporate the resulting glycerate into the chloroplast, where the reimport eventually limits the overall photorespiratory flux.

3.6. Conclusion

We have shown that primary metabolism in an Arabidopsis mutant deficient in HPR1 is capable to adapt to moderate impairments in the photorespiratory flux to allow proper plant growth in normal air. In addition to a functional cytosolic HPR2 bypass [33], this is achieved via usage of compensatory mechanisms, preventing overaccumulation of inhibitory pathway intermediates. This includes non-enzymatic decarboxylation of 3HP and alternative serine degrading routes, including increased flux towards ETA and GSH (Figure 1 and Figure 3). Draining carbon from the core photorespiratory cycle towards other metabolisms, however, seems to reduce the overall leaf-carbon status, ultimately reducing starch and cell wall biosynthesis (Figure 4 and Figure 5, Figure A1). These reductions cause phenotypic alterations, particularly in short-days and during vegetative growth, eventually resulting from impaired GDC activity due to mitochondrial redox imbalances. This negative feed-back becomes alleviated in log-days and the transition to regenerative growth, where hpr1 is of similar size as the wildtype (Figure A2). Collectively, the moderate phenotype of hpr1, lacking strong pleiotropic responses, will be a valuable tool in the future in order to identify the underlying regulation mechanisms of photorespiration and other cellular metabolic routes.

4. Materials and Methods

4.1. Plant Material and Growth

During this study Arabidopsis thaliana (Arabidopsis) ecotype Columbia (Col-0) was used as wild-type reference. A T-DNA insertional line of hydroxypyruvate reductase 1 (HPR1, hpr1-1, SALK067724) was obtained from the Nottingham Arabidopsis Stock Centre and homozygous plants isolated as previously described [33]. Seeds were sterilized with chloric acid, sown on soil and incubated at 4 °C to break dormancy for at least 2 days. Plants were grown in controlled environment chambers (Percival or Conviron; 12/12 h day/night cycle, 22/18 °C, ~120 µmol·m−2·s−1 irradiance, 390 µL L−1 CO2) on a 4:1 mixture of soil (Type Mini Tray; Einheitserdewerk, Uetersen, Germany) and vermiculite and regularly watered with 0.2% Wuxal liquid fertilizer (Aglukon, Düsseldorf, Germany). Where stated in the text, the photoperiod was changed to a 10/14 h (short-day) or 16/8 h (long-day) day/night cycle, with otherwise equal conditions. For most experiments we used plants at growth stage 5.1 [41].

4.2. Metabolite Analysis

4.2.1. Gas-Chromatography Coupled to Mass Spectrometry (GC-MS)

To determine relative metabolite abundances during the development of Arabidopsis rosettes, the wildtype and the hpr1 mutant were grown in normal air with a balanced photoperiod (12/12 h day/night cycle). Approximately 50 mg of leaf-material from five different biological individuals was harvested in the middle of the light phase (6 h illumination) after 3, 4, 5, 6 and 7 weeks after germination (WAG). For the analysis of metabolic alterations during growth in different photoperiods, we grew the wildtype and hpr1 in normal air and harvested ~50 mg leaf-material from five biological replicates (growth stage 5.1. [41]) at four different time points during a day/night cycle as follows: short-day (10/14 h day/night cycle)—mid of day (MoD, 5 h illumination), end of day (EoD, 9 h illumination), mid of night (MoN, 7 h darkness) and end of night (EoN, 13 h darkness) and long-day (16/8 h day/night cycle)—MoD (8 h illumination), EoD (15 h illumination), MoN (4 h darkness) and EoN (7 h darkness). At each time point leaf material was harvested, immediately frozen in liquid nitrogen and stored at −80 °C until further processing as recommended before [59]. Metabolite extraction, derivatization, and analysis were performed as described previously [60,61]. Whereas stated in the text that values were determined as absolute metabolite contents, calibration curves of the respective metabolites were included in the same batch.

4.2.2. High-Performance Liquid Chromatography (HPLC)

Quantification of the cysteine precursor O-acetylserine (OAS), the thiols (cysteine and glutathione—GSH+GSSG) and adenosine phosphates (ADP, ATP) was performed after selective labeling with fluorescent dyes and separation of the resulting metabolite-conjugates by HPLC as described previously [62,63]. For this purpose, we used ~100 mg of leaf tissue harvested from the wildtype and the hpr1 mutant grown in normal air (12/12 h day/night cycle, EoD—9 h illumination) to growth stage 5.1 [41].

4.3. 14C-Glycine and 13C-Glucose-Feeding and Determination of Isotope Accumulation

For this purpose, we grew the wild type and the hpr1-1 mutant in normal air (12/12 h day/night cycle) to growth stage 5.1 [41]. For the [U-14C]-glycine feeding experiment fully expanded leaves from at least five biological replicates were harvested from five-weeks-old plants after 4 h of illumination. Five leaf-discs (6 mm diameter) were cut from the leaf underwater and incubated in 5 mL of 5 mM HEPES-KOH, pH 7.0, containing 10 mM glycine supplemented with 37 kBq of [U-14C]-glycine (final specific radioactivity of 740 kBq mmol−1). The leaf-discs were incubated for 6 h under plant growth conditions (22 °C, light—120 µmol m−2 s−1, 390 ppm CO2 and 21% O2, and 70% relative humidity). Afterwards, samples were washed three times in unlabeled incubation medium, frozen in liquid nitrogen and stored at –80 °C until further analysis, as described by Fernie et al. [64]. During the incubation period the 14CO2 evolved was captured (in hourly intervals) in a KOH trap and the amount of released radiolabel was subsequently quantified by liquid scintillation counting.
For 13C-glucose feeding, we prepared 5 leaf-discs from at least 5 biological individuals after 4 h of illumination during the day/night cycle and incubated them for 2 h in a 10 mM MES-KOH solution (pH 6.5), containing either 10 mM [U-12C]-glucose or [U-13C]-glucose for 2 h (in principle MoD, 6 h after onset of illumination) under the same plant growth conditions mentioned above. The leaf discs were harvested after three washing steps with 10 mM MES-KOH solution (pH 6.5) by freezing with liquid nitrogen and stored at −80 until further analysis. Metabolite extraction, quantification and determination of the molecular accumulation of isotope was carried out as described before [60,65].

4.4. Statistical Analysis

As values are described to be significantly different from the control within the text, the differences were determined due to the performance of the two tailed Student’s t-test algorithm incorporated into Microsoft Excel 10.0 (Microsoft, Seattle, WA, USA).

Author Contributions

Conceptualization, S.T., A.R.F. and H.B.; methodology, formal analysis and investigation, S.T., A.N.-N., A.F., M.E., K.M. and M.W.; resources, R.H., W.W., M.H., A.R.F. and H.B.; data curation, S.T., A.N.-N., A.F., M.E., K.M. and M.W.; writing—original draft preparation, S.T.; writing—review and editing, S.T., A.N.-N., M.E., M.W., M.H., A.R.F. and H.B.; visualization, S.T.; supervision, R.H., W.W., A.R.F. and H.B.; funding acquisition, M.E., M.W., R.H., M.H., A.R.F. and H.B. All authors have read and agreed to the published version of the manuscript.

Funding

This work was supported through grants received from the Deutsche Forschungsgemeinschaft (DFG, BA 1177/7 to H.B.; WI 3560/1-2 to M.W. and HE 1848/15-2 to R.H.; PROMICS - FOR 1186 to M.E., M.H., A.R.F., and H.B.).

Institutional Review Board Statement

Not applicable.

Informed Consent Statement

Not applicable.

Data Availability Statement

The data presented in this study are available in article.

Acknowledgments

We gratefully acknowledge excellent technical assistance from Kathrin Jahnke (University of Rostock). The support of the Metabolomics Core Technology Platform of the Excellence cluster “CellNetworks” (University of Heidelberg) with liquid chromatography-based metabolite quantification is highly appreciated.

Conflicts of Interest

The authors declare no conflict of interest.

Appendix A

Figure A1. Transcript abundance of MIPS1-3 genes in the wild type and hpr1 8 h after transition from elevated (1% CO2 in air) to normal ambient (0.038% CO2 in air) CO2 conditions. Transcript abundances are given as individual values of each biological replicate and mean of RPKM (reads per kilobase of transcript per million reads mapped). Significance was tested with the two-tailed Student’s t-test. ** p < 0.01; ns, not significant. Data was extracted from a previous study [7].
Metabolites 11 00391 g0a1
Figure A2. Phenotype of wild-type and hpr1 mutant plants at different growth stages and conditions. (A) The wildtype in comparison to hpr1-1 grown in normal air (390 ppm CO2) for 5 weeks in a 12/12 h day/night cycle. Data presented in Figure 1, Figure 2 and Figure 3 were obtained from plants at this specific growth stage. Scale bar within the picture is 2 cm. (B) Phenotype of the wildtype (Col-0 and Ler) and two independent HPR1 mutant alleles (hpr1-1 and hpr1-2; [33]) grown in normal air (390 ppm CO2) for ~7 weeks in a 12/12 h day/night cycle. The photograph illustrates that at this stage the growth retardation of hpr1 mutants is minor and onset of flowering similar between the mutants and the wildtype. Therefore, the metabolome analysis during development is comparable between both genotypes. (C) Phenotype at growth stage 5.1 [41] in short day (upper panel, after ~7 weeks) and long day (lower panel, ~4 weeks), at which leaf-material for metabolome analysis presented in Figure 6 was taken in both photoperiods. Scale bar within the picture is 2 cm.
Metabolites 11 00391 g0a2

References

  1. Betti, M.; Bauwe, H.; Busch, F.; Fernie, A.R.; Keech, O.; Levey, M.; Ort, D.R.; Parry, M.A.J.; Sage, R.; Timm, S.; et al. Manipulating photorespiration to increase plant productivity: Recent advances and perspectives for crop improvement. J. Exp. Bot. 2016, 67, 2977–2988. [Google Scholar] [CrossRef] [PubMed]
  2. Simkin, A.J.; López-Calcagno, P.; Raines, C. Feeding the world: Improving photosynthetic efficiency for sustainable crop production. J. Exp. Bot. 2019, 70, 1119–1140. [Google Scholar] [CrossRef] [PubMed] [Green Version]
  3. Walker, B.J.; Kramer, D.M.; Fisher, N.; Fu, X. Flexibility in the energy balancing network of photosynthesis enables safe op-eration under changing environmental conditions. Plants 2020, 9, 301. [Google Scholar] [CrossRef] [PubMed] [Green Version]
  4. Kozaki, A.; Takeba, G. Photorespiration protects C3 plants from photooxidation. Nat. Cell Biol. 1996, 384, 557–560. [Google Scholar] [CrossRef]
  5. Wingler, A.; Quick, W.P.; Bungard, R.A.; Bailey, K.J.; Lea, P.J.; Leegood, R.C. The role of photorespiration during drought stress: An analysis utilizing barley mutants with reduced activities of photorespiratory enzymes. Plant Cell Environ. 1999, 22, 361–373. [Google Scholar] [CrossRef]
  6. Voss, I.; Sunil, B.; Scheibe, R.; Raghavendra, A.S. Emerging concept for the role of photorespiration as an important part of abiotic stress response. Plant Biol. 2013, 15, 713–722. [Google Scholar] [CrossRef] [PubMed]
  7. Eisenhut, M.; Bräutigam, A.; Timm, S.; Florian, A.; Tohge, T.; Fernie, A.R.; Bauwe, H.; Weber, A. Photorespiration is crucial to the dynamic response of photosynthetic metabolism to altered CO2 availability. Mol. Plant 2017, 10, 437–461. [Google Scholar] [CrossRef] [Green Version]
  8. Busch, F.A. Photorespiration in the context of Rubisco biochemistry, CO2diffusion and metabolism. Plant J. 2020, 101, 919–939. [Google Scholar] [CrossRef] [PubMed] [Green Version]
  9. Timm, S. The impact of photorespiration on plant primary metabolism through metabolic and redox regulation. Biochem. Soc. Trans. 2020, 48, 2495–2504. [Google Scholar] [CrossRef]
  10. Shi, X.; Bloom, A. Photorespiration: The futile cycle? Plants 2021, 10, 908. [Google Scholar] [CrossRef]
  11. Anderson, L.E. Chloroplast and cytoplasmic enzymes II. Pea leaf triose phosphate isomerases. Biochim. Biophys. Acta Enzym. 1971, 235, 237–244. [Google Scholar] [CrossRef]
  12. Kelly, G.; Latzko, E. Inhibition of spinach-leaf phosphofructokinase by 2-phosphoglycollate. FEBS Lett. 1976, 68, 55–58. [Google Scholar] [CrossRef] [Green Version]
  13. Flügel, F.; Timm, S.; Arrivault, S.; Florian, A.; Stitt, M.; Fernie, A.R.; Bauwe, H. The photorespiratory metabolite 2-phosphoglycolate regulates photosynthesis and starch accumulation in arabidopsis. Plant Cell 2017, 29, 2537–2551. [Google Scholar] [CrossRef] [PubMed] [Green Version]
  14. Timm, S.; Hagemann, M. Photorespiration—How is it regulated and how does it regulate overall plant metabolism? J. Exp. Bot. 2020, 71, 3955–3965. [Google Scholar] [CrossRef]
  15. Timm, S.; Florian, A.; Arrivault, S.; Stitt, M.; Fernie, A.R.; Bauwe, H. Glycine decarboxylase controls photosynthesis and plant growth. FEBS Lett. 2012, 586, 3692–3697. [Google Scholar] [CrossRef] [PubMed] [Green Version]
  16. Timm, S.; Wittmiß, M.; Gamlien, S.; Ewald, R.; Florian, A.; Frank, M.; Wirtz, M.; Hell, R.; Fernie, A.R.; Bauwe, H. Mitochondrial dihydrolipoyl dehydrogenase activity shapes photosynthesis and photorespiration of Arabidopsis thaliana. Plant Cell 2015, 27, 1968–1984. [Google Scholar] [CrossRef] [Green Version]
  17. Timm, S.; Woitschach, F.; Heise, C.; Hagemann, M.; Bauwe, H. Faster removal of 2-phosphoglycolate through photorespiration improves abiotic stress tolerance of arabidopsis. Plants 2019, 8, 563. [Google Scholar] [CrossRef] [Green Version]
  18. Collakova, E.; Goyer, A.; Naponelli, V.; Krassovskaya, I.; Gregory, J.; Hanson, A.D.; Shachar-Hill, Y. Arabidopsis 10-formyl tetrahydrofolate deformylases are essential for photorespiration. Plant Cell 2008, 20, 1818–1832. [Google Scholar] [CrossRef] [Green Version]
  19. Keys, A.J. The re-assimilation of ammonia produced by photorespiration and the nitrogen economy of C3 higher plants. Photosynth. Res. 2006, 87, 165–175. [Google Scholar] [CrossRef]
  20. Bloom, A.J.; Burger, M.; Asensio, J.S.R.; Cousins, A.B. Carbon dioxide enrichment inhibits nitrate assimilation in wheat and arabidopsis. Science 2010, 328, 899–903. [Google Scholar] [CrossRef] [Green Version]
  21. Abadie, C.; Tcherkez, G. Plant sulphur metabolism is stimulated by photorespiration. Commun. Biol. 2019, 2, 379. [Google Scholar] [CrossRef]
  22. Lim, S.-L.; Voon, C.P.; Guan, X.; Yang, Y.; Gardeström, P.; Lim, B.L. In planta study of photosynthesis and photorespiration using NADPH and NADH/NAD+ fluorescent protein sensors. Nat. Commun. 2020, 11, 1–12. [Google Scholar] [CrossRef]
  23. Timm, S.; Mielewczik, M.; Florian, A.; Frankenbach, S.; Dreissen, A.; Hocken, N.; Fernie, A.R.; Walter, A.; Bauwe, H. High-to-low CO2 acclimation reveals plasticity in the photorespiratory pathway and indicates regulatory links to other me-tabolism of Arabidopsis. PLoS ONE 2012, 7, e42009. [Google Scholar] [CrossRef] [Green Version]
  24. Florian, A.; Nikoloski, Z.; Sulpice, R.; Timm, S.; Araújo, W.L.; Tohge, T.; Bauwe, H.; Fernie, A.R. Analysis of short-term met-abolic alterations in Arabidopsis following changes in the prevailing environmental conditions. Mol. Plant 2014, 7, 893–911. [Google Scholar] [CrossRef] [PubMed] [Green Version]
  25. Florian, A.; Timm, S.; Nikoloski, Z.; Tohge, T.; Bauwe, H.; Araújo, W.; Fernie, A.R. Analysis of metabolic alterations in Ara-bidopsis following changes in the carbon dioxide and oxygen partial pressures. J. Integr. Plant Biol. 2014, 56, 941–959. [Google Scholar] [CrossRef] [PubMed]
  26. Florian, A.; Araújo, W.L.; Fernie, A.R. New insights into photorespiration obtained from metabolomics. Plant Biol. 2013, 15, 656–666. [Google Scholar] [CrossRef]
  27. Obata, T.; Florian, A.; Timm, S.; Bauwe, H.; Fernie, A.R. On the metabolic interactions of (photo)respiration. J. Exp. Bot. 2016, 67, 3003–3014. [Google Scholar] [CrossRef] [Green Version]
  28. Blume, C.; Ost, J.; Mühlenbruch, M.; Peterhänsel, C.; Laxa, M. Low CO2 induces urea cycle intermediate accumulation in Arabidopsis thaliana. PLoS ONE 2019, 14, e0210342. [Google Scholar] [CrossRef] [PubMed]
  29. Fernie, A.R.; Bauwe, H.; Eisenhut, M.; Florian, A.; Hanson, D.T.; Hagemann, M.; Keech, O.; Mielewczik, M.; Nikoloski, Z.; Peterhansel, C.; et al. Perspectives on plant photorespiratory metabolism. Plant Biol. 2013, 15, 748–753. [Google Scholar] [CrossRef]
  30. Fernie, A.R.; Bauwe, H. Wasteful, essential, evolutionary stepping stone? The multiple personalities of the photorespiratory pathway. Plant J. 2020, 102, 666–677. [Google Scholar] [CrossRef]
  31. Ort, D.R.; Merchant, S.S.; Alric, J.; Barkan, A.; Blankenship, R.E.; Bock, R.; Croce, R.; Hanson, M.R.; Hibberd, J.M.; Long, S.P. Redesigning photosynthesis to sustainably meet global food and bioenergy demand. Proc. Natl. Acad. Sci. USA 2015, 112, 8529–8536. [Google Scholar] [CrossRef] [PubMed] [Green Version]
  32. Walker, B.J.; Vanloocke, A.; Bernacchi, C.J.; Ort, D.R. The costs of photorespiration to food production now and in the future. Annu. Rev. Plant Biol. 2016, 67, 107–129. [Google Scholar] [CrossRef] [PubMed] [Green Version]
  33. Timm, S.; Nunes-Nesi, A.; Pärnik, T.; Morgenthal, K.; Wienkoop, S.; Keerberg, O.; Weckwerth, W.; Kleczkowski, L.A.; Fernie, A.R.; Bauwe, H. A cytoplasmic pathway for the conversion of hydroxypyruvate to glycerate during photorespiration in arabidopsis. Plant Cell 2008, 20, 2848–2859. [Google Scholar] [CrossRef] [PubMed] [Green Version]
  34. Timm, S.; Florian, A.; Jahnke, K.; Nunes-Nesi, A.; Fernie, A.R.; Bauwe, H. The hydroxypyruvate-reducing system in Ara-bidopsis: Multiple enzymes for the same end. Plant Physiol. 2011, 155, 694–705. [Google Scholar] [CrossRef] [PubMed] [Green Version]
  35. Timm, S.; Florian, A.; Wittmiß, M.; Jahnke, K.; Hagemann, M.; Fernie, A.R.; Bauwe, H. Serine acts as a metabolic signal for the transcriptional control of photorespiration-related genes in arabidopsis. Plant Physiol. 2013, 162, 379–389. [Google Scholar] [CrossRef] [PubMed] [Green Version]
  36. Lawand, S.; Dorne, A.-J.; Long, D.; Coupland, G.; Mache, R.; Carol, P. Arabidopsis a bout de souffle, which is homologous with mammalian carnitine acyl carrier, is required for postembryonic growth in the light. Plant Cell 2002, 14, 2161–2173. [Google Scholar] [CrossRef] [PubMed] [Green Version]
  37. Eisenhut, M.; Planchais, S.; Cabassa, C.; Guivarc’H, A.; Justin, A.-M.; Taconnat, L.; Renou, J.-P.; Linka, M.; Gagneul, D.; Timm, S.; et al. Arabidopsis a bout de souffle is a putative mitochondrial transporter involved in photorespiratory metabolism and is required for meristem growth at ambient CO2 levels. Plant J. 2013, 73, 836–849. [Google Scholar] [CrossRef] [Green Version]
  38. Timm, S.; Florian, A.; Fernie, A.R.; Bauwe, H. The regulatory interplay between photorespiration and photosynthesis. J. Exp. Bot. 2016, 67, 2923–2929. [Google Scholar] [CrossRef] [PubMed] [Green Version]
  39. Levey, M.; Timm, S.; Mettler-Altmann, T.; Borghi, G.L.; Koczor, M.; Arrivault, S.; Weber, A.P.; Bauwe, H.; Gowik, U.; Westhoff, P. Efficient 2-phosphoglycolate degradation is required to maintain carbon assimilation and allocation in the C4 plant Flaveria bidentis. J. Exp. Bot. 2019, 70, 575–587. [Google Scholar] [CrossRef] [PubMed] [Green Version]
  40. Eckardt, N.A. Myo-inositol biosynthesis genes in arabidopsis: Differential patterns of gene expression and role in cell death. Plant Cell 2010, 22, 537. [Google Scholar] [CrossRef] [Green Version]
  41. Boyes, D.C.; Zayed, A.M.; Ascenzi, R.; McCaskill, A.J.; Hofman, N.E.; Davis, K.R.; Gorlach, J. Growth stage-based phenotypic analysis of Arabidopsis: A model for high throughput functional genomics in plants. Plant Cell 2001, 13, 1499–1510. [Google Scholar] [CrossRef] [Green Version]
  42. Queval, G.; Issakidis-Bourguet, E.; Hoeberichts, F.A.; Vandorpe, M.; Gakière, B.; Vanacker, H.; Miginiac-Maslow, M.; Van Breusegem, F.; Noctor, G. Conditional oxidative stress responses in the Arabidopsis photorespiratory mutant cat2 demonstrate that redox state is a key modulator of daylength dependent gene expression, and define photoperiod as a crucial factor in the regulation of H2O2-induced cell death. Plant J. 2007, 52, 640–657. [Google Scholar]
  43. Queval, G.; Neukermans, J.; Vanderauwera, S.; Van Breusegem, F.; Noctor, G. Day length is a key regulator of transcriptomic responses to both CO2 and H2O2 in Arabidopsis. Plant Cell Environ. 2012, 35, 374–387. [Google Scholar] [CrossRef]
  44. Dellero, Y.; Lamothe-Sibold, M.; Jossier, M.; Hodges, M. Arabidopsis thaliana ggt1photorespiratory mutants maintain leaf carbon/nitrogen balance by reducing RuBisCO content and plant growth. Plant J. 2015, 83, 1005–1018. [Google Scholar] [CrossRef] [PubMed]
  45. Boldt, R.; Edner, C.; Kolukisaoglu, Ü.; Hagemann, M.; Weckwerth, W.; Wienkoop, S.; Morgenthal, K.; Bauwe, H. D-glycerate 3-kinase, the last unknown enzyme in the photorespiratory cycle in arabidopsis, belongs to a novel kinase family. Plant Cell 2005, 17, 2413–2420. [Google Scholar] [CrossRef] [PubMed] [Green Version]
  46. Howitz, K.T.; McCarty, R.E. d-Glycerate transport by the pea chloroplast glycolate carrier: Studies on [1-C]d-glycerate uptake and d-glycerate dependent O(2) evolution. Plant Physiol. 1986, 80, 390–395. [Google Scholar] [CrossRef] [PubMed] [Green Version]
  47. Walton, N.J.; Butt, V.S. Metabolism and decarboxylation of glycollate and serine in leaf peroxisomes. Planta 1981, 153, 225–231. [Google Scholar] [CrossRef] [PubMed]
  48. Li, J.; Weraduwage, S.M.; Preiser, A.L.; Tietz, S.; Weise, S.E.; Strand, D.D.; Froehlich, J.E.; Kramer, D.M.; Hu, J.; Sharkey, T.D. A cytoplasmic bypass and G6P shunt in plants lacking peroxisomal hydroxypyruvate reductase. Plant Physiol. 2019, 180, 783–792. [Google Scholar] [CrossRef] [Green Version]
  49. Xu, Y.; Sharkey, T.D.; Sachar-Hill, Y.; Walker, B.J. The metabolic origins of non-photorespiratory CO2 release during photo-synthesis: A metabolic flux analysis. Plant Physiol. 2021, 186, 297–314. [Google Scholar] [CrossRef]
  50. Rontein, D.; Nishida, I.; Tashiro, G.; Yoshioka, K.; Wu, W.I.; Voelker, D.R.; Basset, G.; Hanson, A.D. Plants synthesize ethan-olamine by direct decarboxylation of serine using a pyridoxal phosphate enzyme. J. Biol. Chem. 2001, 276, 35523–35529. [Google Scholar] [CrossRef] [Green Version]
  51. Rontein, D.; Rhodes, D.; Hanson, A.D. Evidence from engineering that decarboxylation of free serine is the major source of ethanolamine moieties in plants. Plant Cell Physiol. 2003, 44, 1185–1191. [Google Scholar] [CrossRef] [PubMed] [Green Version]
  52. Kwon, Y.; Yu, S.-I.; Lee, H.; Yim, J.H.; Zhu, J.-K.; Lee, B.-H. Arabidopsis serine decarboxylase mutants implicate the roles of ethanolamine in plant growth and development. Int. J. Mol. Sci. 2012, 13, 3176–3188. [Google Scholar] [CrossRef] [PubMed] [Green Version]
  53. Araújo, W.L.; Tohge, T.; Ishizaki, K.; Leaver, C.J.; Fernie, A.R. Protein degradation—An alternative respiratory substrate for stressed plants. Trends Plant Sci. 2011, 16, 489–498. [Google Scholar] [CrossRef]
  54. Selinski, J.; Scheibe, R. Malate valves: Old shuttles with new perspectives. Plant Biol. 2018, 21, 21–30. [Google Scholar] [CrossRef] [PubMed] [Green Version]
  55. Noctor, G.; Mhamdi, A.; Chaouch, S.; Han, Y.; Neukermans, J.; Marquez-Garcia, B.; Queval, G.; Foyer, C.H. Glutathione in plants: An integrated overview. Plant Cell Environ. 2012, 35, 454–484. [Google Scholar] [CrossRef]
  56. Hasanuzzaman, M.; Nahar, K.; Anee, T.I.; Fujita, M. Glutathione in plants: Biosynthesis and physiological role in environ-mental stress tolerance. Physiol. Mol. Biol. Plants 2017, 23, 249–268. [Google Scholar] [CrossRef]
  57. Bourguignon, J.; Neuburger, M.; Douce, R. Resolution and characterization of the glycine cleavage reaction in pea leaf mito-chondria. Properties of the forward reaction catalyzed by glycine decarboxylase and serine hydroxymethyltransferase. Biochem. J. 1988, 255, 169–178. [Google Scholar] [CrossRef] [PubMed] [Green Version]
  58. Bartsch, O.; Mikkat, S.; Hagemann, M.; Bauwe, H. An Autoinhibitory domain confers redox regulation to maize glycerate kinase. Plant Physiol. 2010, 153, 832–840. [Google Scholar] [CrossRef] [PubMed] [Green Version]
  59. Fernie, A.R.; Aharoni, A.; Willmitzer, L.; Stitt, M.; Tohge, T.; Kopka, J.; Carroll, A.J.; Saito, K.; Fraser, P.D.; DeLuca, V. Rec-ommendations for reporting metabolite data. Plant Cell 2011, 23, 2477–2482. [Google Scholar] [CrossRef] [Green Version]
  60. Lisec, J.; Schauer, N.; Kopka, J.; Willmitzer, L.; Fernie, A.R. Gas chromatography mass spectrometry–based metabolite profiling in plants. Nat. Protoc. 2006, 1, 387–396. [Google Scholar] [CrossRef]
  61. Engel, N.; Daele, K.V.D.; Kolukisaoglu, U.; Morgenthal, K.; Weckwerth, W.; Pärnik, T.; Keerberg, O.; Bauwe, H. Deletion of glycine decarboxylase in arabidopsis is lethal under nonphotorespiratory conditions. Plant Physiol. 2007, 144, 1328–1335. [Google Scholar] [CrossRef] [PubMed] [Green Version]
  62. Rzewuski, G.; Cornell, K.A.; Rooney, L.; Bürstenbinder, K.; Wirtz, M.; Hell, R.; Sauter, M. OsMTN encodes a 5′-methylthioadenosine nucleosidase that is up-regulated during submergence-induced ethylene synthesis in rice (Oryza sativa L.). J. Exp. Bot. 2007, 58, 1505–1514. [Google Scholar] [CrossRef] [Green Version]
  63. Heeg, C.; Kruse, C.; Jost, R.; Gutensohn, M.; Ruppert, T.; Wirtz, M.; Hell, R. Analysis of the Arabidopsis o-acetylserine(thiol)lyase gene family demonstrates compartment-specific differences in the regulation of cysteine synthesis. Plant Cell 2008, 20, 168–185. [Google Scholar] [CrossRef] [PubMed] [Green Version]
  64. Fernie, A.R.; Roessner, U.; Trethewey, R.N.; Willmitzer, L. The contribution of plastidial phosphoglucomutase to the control of starch synthesis within the potato tuber. Planta 2001, 213, 418–426. [Google Scholar] [CrossRef] [PubMed]
  65. Sienkiewicz-Porzucek, A.; Nunes-Nesi, A.; Sulpice, R.; Lisec, J.; Centeno, D.C.; Carillo, P.; Leisse, A.; Urbanczyk-Wochniak, E.; Fernie, A.R. Mild reductions in mitochondrial citrate synthase activity result in a compromised nitrate assimilation and reduced leaf pigmentation but have no effect on photosynthetic performance or growth. Plant Physiol. 2008, 147, 115–127. [Google Scholar] [CrossRef] [Green Version]
Figure 1. Absolute amounts and carbon isotope redistribution in photorespiratory intermediates and ethanolamine. Shown are (A) absolute amounts of selected photorespiratory intermediates and ethanolamine (ETA) and (B) redistribution of 13C in selected photorespiratory intermediates (serine (flux from glycine), 3HP (flux from serine) and glycerate (flux from 3HP)) and ETA (flux from serine) following [U-13C]-glucose labeling in the wild type and the hpr1 mutant. Plants were grown under controlled environmental conditions (390 ppm CO2, ~120 µmol m−2 light intensity, 20/18 °C day/night temperature, ~70% relative humidity) for 5 weeks (12/12 h day/night cycle). At this time point, leaf-discs were obtained for absolute metabolite quantification and carbon isotope labeling. Shown are means ± SD of five biological replicates (5 leaf-discs per plant) and asterisks show significant changes compared with the wild type according to Student’s t-test (** p < 0.01).
Metabolites 11 00391 g001
Figure 2. Carbon isotope redistribution following 14C-glycine-labeling. Shown is (A) the redistribution of 14C in four major fractions of cellular compounds and (B) the 14CO2 evolved from leaf-discs harvested from the wild type in comparison with the hpr1 mutant. Plants were grown under controlled environmental conditions (390 ppm CO2, ~120 µmol m−2 s−1 light intensity, 20/18 °C day/night temperature, ~70% relative humidity) for 5 weeks (12/12 h day/night cycle). At this time point, leaf-discs were fed with [U-14C]-glycine for 6 h and then harvested for subsequent analysis. The 14CO2 evolved was captured (in hourly intervals) in a KOH trap and the amount of radiolabel released was subsequently quantified. Shown are means ± SD of five biological replicates (5 leaf-discs per plant) and asterisks show significant changes compared with the wild type according to Student’s t-test (** p < 0.01).
Metabolites 11 00391 g002
Figure 3. Absolute metabolite contents of selected intermediates related to serine and energy metabolism. Shown are (A) absolute amounts of O-acetylserine (OAS), cysteine and glutathione (GSH; sum parameter of GSH + GSSG) and (B) energy equivalents (adenosine diphosphate [ADP], adenosine triphosphate [ATP]) form air grown wild-type and hpr1 mutant plants. Shown are means ± SD (five biological replicates) and asterisks show significant changes compared with the wild type according to Student’s t-test (* p < 0.05; ** p < 0.01).
Metabolites 11 00391 g003
Figure 4. Metabolic acclimation patterns of photorespiration and carbohydrates during development. Relative metabolite abundances of selected intermediates of (A) photorespiration and (B) carbohydrate metabolism in Arabidopsis wild-type and hpr1 mutant plants during development (3–7 weeks after germination (WAG)). Plants were grown under controlled environmental conditions (390 ppm CO2, ~120 µmol m-2 s-1 light intensity, 20/18 °C day/night temperature, ~70% relative humidity) in a balanced photoperiod (12/12 h day/night cycle). Mutant-to-wild-type ratios ± SD (five biological replicates) are shown (relative amounts, arbitrary units mg−1 fresh weight), with the mean wild-type value at 3 WAG arbitrarily set to 1 (wild type, solid line; hpr1, dashed line). The white shaded part of the graph represents the vegetative phase, while grey shading the reproductive phase. Asterisks show significant changes compared to the wildtype at 3 WAG and plusses (* p < 0.05) between the wild type and the hpr1 mutant at the respective timepoint according to Student’s t-test (* p < 0.05).
Metabolites 11 00391 g004
Figure 5. Metabolic acclimation patterns of the TCA cycle and amino acid metabolism during development. Metabolite abundances of selected intermediates of (A) the TCA-cycle and (B) amino acid metabolism and the urea cycle in Arabidopsis wild-type and hpr1 mutant plants during development (3–7 weeks after germination [WAG]). Plants were grown under controlled environmental conditions (390 ppm CO2, ~120 µmol m−2 s−1 light intensity, 20/18°C day/night temperature, ~70% relative humidity) in a balanced photoperiod (12/12 h day/night cycle). Mutant-to-wild-type ratios ± SD (five biological replicates) are shown (relative amounts, arbitrary units mg−1 fresh weight), with the mean wild-type value at 3 WAG arbitrarily set to 1 (wild type, solid line; hpr1, dashed line). The white shaded part of the graph represents the vegetative phase, while grey shading the reproductive phase. Asterisks show significant changes compared with the wild-type time point, and plus signs (* p < 0.05) show them compared with the wild type at 3 WAG according to Student’s t-test (* p < 0.05).
Metabolites 11 00391 g005
Figure 6. Selected intermediates of photorespiration of plants grown under two different photoperiods. Shown are relative amounts of selected photorespiratory intermediates form air grown wild-type and hpr1 mutant plants in two photoperiods (SD—10/14 h day/night cycle, and LD—16/8 h day/night cycle) with otherwise equal conditions. Plants were grown to growth stage 5.1 [41] and metabolites determined at four diagnostic timepoints during the day/night cycle (end of night (EoN), mid of day (MoD), end of day (EoD) and mid of night (MoN)). Shown are means ± SD (five biological replicates) with the wildtype EoN time point was arbitrary set to 1. Asterisks show significant changes compared with the wild-type EoN timepoint, plusses indicate significant changes between SD and LD and rhombus indicate significant changes at the respective timepoint between the wild type and hpr1 according to Student’s t-test (** p < 0.01). The figure was redrawn, using data that were in part previously published [35], with permission (www.plantphysiol.org).
Metabolites 11 00391 g006
Publisher’s Note: MDPI stays neutral with regard to jurisdictional claims in published maps and institutional affiliations.

