
Alterations of Striato-Thalamic Metabolism in Normal Aging Human Brain—An MR Metabolic Imaging Study

 , ,
, ,
Abstract
:1. Introduction
2. Results
3. Discussion
4. Materials and Methods
4.1. Subjects
4.2. MR Examination and Data Processing
4.3. Quality Assessment of the Spectral Data
4.4. Statistical Analysis
5. Conclusions
Author Contributions
Funding
Institutional Review Board Statement
Informed Consent Statement
Data Availability Statement
Acknowledgments
Conflicts of Interest
References
- Lustig, C.; Snyder, A.Z.; Bhakta, M.; O’Brien, K.C.; McAvoy, M.; Raichle, M.E.; Morris, J.C.; Buckner, R.L. Functional deactivations: Change with age and dementia of the alzheimer type. Proc. Natl. Acad. Sci. USA 2003, 100, 14504–14509. [Google Scholar] [CrossRef] [PubMed] [Green Version]
- Seidler, R.D.; Bernard, J.A.; Burutolu, T.B.; Fling, B.W.; Gordon, M.T.; Gwin, J.T.; Kwak, Y.; Lipps, D.B. Motor control and aging: Links to age-related brain structural, functional, and biochemical effects. Neurosci. Biobehav. Rev. 2010, 34, 721–733. [Google Scholar] [CrossRef] [PubMed] [Green Version]
- Moffett, J.R.; Ross, B.; Arun, P.; Madhavarao, C.N.; Namboodiri, A.M.A. N-acetylaspartate in the cns: From neurodiagnostics to neurobiology. Prog. Neurobiol. 2007, 81, 89–131. [Google Scholar] [CrossRef] [Green Version]
- Maudsley, A.A.; Domenig, C.; Sheriff, S. Reproducibility of serial whole-brain mr spectroscopic imaging. NMR Biomed. 2010, 23, 251–256. [Google Scholar] [CrossRef]
- Maghsudi, H.; Schmitz, B.; Maudsley, A.A.; Sheriff, S.; Bronzlik, P.; Schütze, M.; Lanfermann, H.; Ding, X. Regional metabolite concentrations in aging human brain: Comparison of short-te whole brain mr spectroscopic imaging and single voxel spectroscopy at 3t. Clin. Neuroradiol. 2020, 30, 251–261. [Google Scholar] [CrossRef]
- Maudsley, A.A.; Govind, V.; Arheart, K.L. Associations of age, gender and body mass with 1h mr-observed brain metabolites and tissue distributions. NMR Biomed. 2012, 25, 580–593. [Google Scholar] [CrossRef] [Green Version]
- Ding, X.Q.; Maudsley, A.A.; Sabati, M.; Sheriff, S.; Schmitz, B.; Schutze, M.; Bronzlik, P.; Kahl, K.G.; Lanfermann, H. Physiological neuronal decline in healthy aging human brain—An in vivo study with mri and short echo-time whole-brain h mr spectroscopic imaging. Neuroimage 2016, 137, 45–51. [Google Scholar] [CrossRef] [PubMed] [Green Version]
- Eylers, V.V.; Maudsley, A.A.; Bronzlik, P.; Dellani, P.R.; Lanfermann, H.; Ding, X.-Q. Detection of normal aging effects on human brain metabolite concentrations and microstructure with whole-brain mr spectroscopic imaging and quantitative mr imaging. AJNR Am. J. Neuroradiol. 2016, 37, 447–454. [Google Scholar] [CrossRef] [Green Version]
- Maghsudi, H.; Schütze, M.; Maudsley, A.A.; Dadak, M.; Lanfermann, H.; Ding, X.Q. Age-related brain metabolic changes up to seventh decade in healthy humans: Whole-brain magnetic resonance spectroscopic imaging study. Clin. Neuroradiol. 2020, 30, 581–589. [Google Scholar] [CrossRef] [PubMed]
- Goryawala, M.Z.; Sheriff, S.; Maudsley, A.A. Regional distributions of brain glutamate and glutamine in normal subjects. NMR Biomed. 2016, 29, 1108–1116. [Google Scholar] [CrossRef] [Green Version]
- Ghandili, M.; Munakomi, S. Neuroanatomy, putamen. In Statpearls; StatPearls Publishing LLC.: Treasure Island, FL, USA, 2021. [Google Scholar]
- Driscoll, M.E.; Bollu, P.C.; Tadi, P. Neuroanatomy, nucleus caudate. In Statpearls; StatPearls Publishing LLC.: Treasure Island, FL, USA, 2021. [Google Scholar]
- Nambu, A. Seven problems on the basal ganglia. Curr. Opin. Neurobiol. 2008, 18, 595–604. [Google Scholar] [CrossRef] [PubMed]
- Haga, K.K.; Khor, Y.P.; Farrall, A.; Wardlaw, J.M. A systematic review of brain metabolite changes, measured with 1h magnetic resonance spectroscopy, in healthy aging. Neurobiol. Aging 2009, 30, 353–363. [Google Scholar] [CrossRef]
- Cleeland, C.; Pipingas, A.; Scholey, A.; White, D. Neurochemical changes in the aging brain: A systematic review. Neurosci. Biobehav. Rev. 2019, 98, 306–319. [Google Scholar] [CrossRef] [PubMed]
- Kreis, R. The trouble with quality filtering based on relative cramer-rao lower bounds. Magn. Reson. Med. 2016, 75, 15–18. [Google Scholar] [CrossRef]
- Chao, L.L.; Mueller, S.G.; Buckley, S.T.; Peek, K.; Raptentsetseng, S.; Elman, J.; Yaffe, K.; Miller, B.L.; Kramer, J.H.; Madison, C.; et al. Evidence of neurodegeneration in brains of older adults who do not yet fulfill mci criteria. Neurobiol. Aging 2010, 31, 368–377. [Google Scholar] [CrossRef] [Green Version]
- Brooks, J.C.; Roberts, N.; Kemp, G.J.; Gosney, M.A.; Lye, M.; Whitehouse, G.H. A proton magnetic resonance spectroscopy study of age-related changes in frontal lobe metabolite concentrations. Cerebral Cortex (New York, N.Y. 1991) 2001, 11, 598–605. [Google Scholar] [CrossRef] [PubMed] [Green Version]
- Grachev, I.D.; Apkarian, A.V. Aging alters regional multichemical profile of the human brain: An in vivo 1h-mrs study of young versus middle-aged subjects. J. Neurochem. 2001, 76, 582–593. [Google Scholar] [CrossRef]
- Barker, P.B.; Bizzi, A.; De Stefano, N.; Gullapalli, R.; Lin, D.D. Clinical mr Spectroscopy: Techniques and Applications; Cambridge University Press: Cambridge, UK, 2009; p. 264. [Google Scholar]
- Harada, M.; Miyoshi, H.; Otsuka, H.; Nishitani, H.; Uno, M. Multivariate analysis of regional metabolic differences in normal ageing on localised quantitative proton mr spectroscopy. Neuroradiology 2001, 43, 448–452. [Google Scholar] [CrossRef]
- Charles, H.C.; Lazeyras, F.; Krishnan, K.R.; Boyko, O.B.; Patterson, L.J.; Doraiswamy, P.M.; McDonald, W.M. Proton spectroscopy of human brain: Effects of age and sex. Prog. Neuro-Psychopharmacol. Biol. Psychiatry 1994, 18, 995–1004. [Google Scholar] [CrossRef]
- Gruber, S.; Pinker, K.; Riederer, F.; Chmelik, M.; Stadlbauer, A.; Bittsansky, M.; Mlynarik, V.; Frey, R.; Serles, W.; Bodamer, O.; et al. Metabolic changes in the normal ageing brain: Consistent findings from short and long echo time proton spectroscopy. Eur. J. Radiol. 2008, 68, 320–327. [Google Scholar] [CrossRef]
- Zahr, N.M.; Mayer, D.; Rohlfing, T.; Chanraud, S.; Gu, M.; Sullivan, E.V.; Pfefferbaum, A. In vivo glutamate measured with magnetic resonance spectroscopy: Behavioral correlates in aging. Neurobiol. Aging 2013, 34, 1265–1276. [Google Scholar] [CrossRef] [PubMed] [Green Version]
- Chang, L.; Ernst, T.; Poland, R.E.; Jenden, D.J. In vivo proton magnetic resonance spectroscopy of the normal aging human brain. Life Sci. 1996, 58, 2049–2056. [Google Scholar] [CrossRef]
- Lind, A.; Boraxbekk, C.-J.; Petersen, E.T.; Paulson, O.B.; Siebner, H.R.; Marsman, A. Regional myo-inositol, creatine, and choline levels are higher at older age and scale negatively with visuospatial working memory: A cross-sectional proton mr spectroscopy study at 7 tesla on normal cognitive ageing. J. Neurosci. 2020, 40, 8149. [Google Scholar] [CrossRef] [PubMed]
- Marjanska, M.; McCarten, J.R.; Hodges, J.; Hemmy, L.S.; Grant, A.; Deelchand, D.K.; Terpstra, M. Region-specific aging of the human brain as evidenced by neurochemical profiles measured noninvasively in the posterior cingulate cortex and the occipital lobe using (1)h magnetic resonance spectroscopy at 7 t. Neuroscience 2017, 354, 168–177. [Google Scholar] [CrossRef]
- Kirov, I.I.; Fleysher, L.; Fleysher, R.; Patil, V.; Liu, S.; Gonen, O. Age dependence of regional proton metabolites t2 relaxation times in the human brain at 3 t. Magn. Reson. Med. 2008, 60, 790–795. [Google Scholar] [CrossRef] [Green Version]
- Marjanska, M.; Emir, U.E.; Deelchand, D.K.; Terpstra, M. Faster metabolite (1)h transverse relaxation in the elder human brain. PLoS ONE 2013, 8, e77572. [Google Scholar] [CrossRef] [Green Version]
- Mitsumori, F.; Watanabe, H.; Takaya, N. Estimation of brain iron concentration in vivo using a linear relationship between regional iron and apparent transverse relaxation rate of the tissue water at 4.7t. Magn. Reson. Med. 2009, 62, 1326–1330. [Google Scholar] [CrossRef]
- Ashraf, A.; Clark, M.; So, P.W. The aging of iron man. Front. Aging Neurosci. 2018, 10, 65. [Google Scholar] [CrossRef] [Green Version]
- Steer, R.A.; Clark, D.A.; Beck, A.T.; Ranieri, W.F. Common and specific dimensions of self-reported anxiety and depression: The bdi-ii versus the bdi-ia. Behav. Res. Ther. 1999, 37, 183–190. [Google Scholar] [CrossRef]
- Kalbe, E.; Kessler, J.; Calabrese, P.; Smith, R.; Passmore, A.P.; Brand, M.; Bullock, R. Demtect: A new, sensitive cognitive screening test to support the diagnosis of mild cognitive impairment and early dementia. Int. J. Geriatr. Psychiatry 2004, 19, 136–143. [Google Scholar] [CrossRef]
- Ding, X.Q.; Maudsley, A.A.; Sabati, M.; Sheriff, S.; Dellani, P.R.; Lanfermann, H. Reproducibility and reliability of short-te whole-brain mr spectroscopic imaging of human brain at 3t. Magn. Reson. Med. 2015, 73, 921–928. [Google Scholar] [CrossRef] [PubMed] [Green Version]
- Maudsley, A.A.; Darkazanli, A.; Alger, J.R.; Hall, L.O.; Schuff, N.; Studholme, C.; Yu, Y.; Ebel, A.; Frew, A.; Goldgof, D.; et al. Comprehensive processing, display and analysis for in vivo mr spectroscopic imaging. NMR Biomed. 2006, 19, 492–503. [Google Scholar] [CrossRef] [Green Version]
- Maudsley, A.A.; Domenig, C.; Govind, V.; Darkazanli, A.; Studholme, C.; Arheart, K.; Bloomer, C. Mapping of brain metabolite distributions by volumetric proton mr spectroscopic imaging (mrsi). Magn. Reson. Med. 2009, 61, 548–559. [Google Scholar] [CrossRef] [Green Version]
- Mazziotta, J.C.; Toga, A.W.; Evans, A.; Fox, P.; Lancaster, J. A probabilistic atlas of the human brain: Theory and rationale for its development. The international consortium for brain mapping (icbm). Neuroimage 1995, 2, 89–101. [Google Scholar] [CrossRef] [PubMed]
- Tzourio-Mazoyer, N.; Landeau, B.; Papathanassiou, D.; Crivello, F.; Etard, O.; Delcroix, N.; Mazoyer, B.; Joliot, M. Automated anatomical labeling of activations in spm using a macroscopic anatomical parcellation of the mni mri single-subject brain. Neuroimage 2002, 15, 273–289. [Google Scholar] [CrossRef] [PubMed]
- Soher, B.J.; Young, K.; Govindaraju, V.; Maudsley, A.A. Automated spectral analysis iii: Application to in vivo proton mr spectroscopy and spectroscopic imaging. Magn. Reson. Med. 1998, 40, 822–831. [Google Scholar] [CrossRef]
- Öz, G.; Deelchand, D.K.; Wijnen, J.P.; Mlynárik, V.; Xin, L.; Mekle, R.; Noeske, R.; Scheenen, T.W.J.; Tkáč, I. Advanced single voxel (1) h magnetic resonance spectroscopy techniques in humans: Experts’ consensus recommendations. NMR Biomed. 2020, e4236. [Google Scholar] [CrossRef] [PubMed]


| Region | NAA | tCr | |||||||||||||||
|---|---|---|---|---|---|---|---|---|---|---|---|---|---|---|---|---|---|
| N a | Mean b | SD b | R | p | Intercept b | Slope b | Variations c | N a | Mean b | SD b | R | p | Intercept b | Slope b | Variations c | ||
| Right caudate nucleus | 74 | 11.28 | 2.28 | −0.31 | 0.0072 | 13.53 ± 0.85 | −0.0523 ± 0.0189 | −5.2 | 74 | 10.82 | 1.83 | 0.02 | 0.8830 | ||||
| Left caudate nucleus | 76 | 11.40 | 2.21 | −0.29 | 0.0103 | 13.41 ± 0.80 | −0.0482 ± 0.0183 | −4.8 | 76 | 11.13 | 2.55 | −0.02 | 0.8378 | ||||
| Right putamen | 80 | 9.30 | 1.63 | −0.31 | 0.0050 | 10.87 ± 0.57 | −0.0367 ± 0.0127 | −3.7 | 80 | 9.01 | 1.25 | −0.12 | 0.2910 | ||||
| Left putamen | 80 | 9.22 | 1.40 | −0.52 | 0.0000 | 11.48 ± 0.44 | −0.0531 ± 0.0098 | −5.3 | 80 | 9.19 | 1.13 | −0.25 | 0.0254 | 10.07 ± 0.40 | −0.0205 ± 0.0090 | −2.0 | |
| Right pallidum | 75 | 8.41 | 1.91 | −0.16 | 0.1819 | 75 | 8.09 | 1.38 | −0.33 | 0.0044 | 9.45 ± 0.49 | −0.0322 ± 0.0110 | −3.2 | ||||
| Left pallidum | 77 | 8.33 | 2.11 | −0.24 | 0.0330 | 9.91 ± 0.76 | −0.0374 ± 0.0172 | −3.7 | 77 | 8.80 | 2.02 | −0.29 | 0.0102 | 10.61 ± 0.72 | −0.0428 ± 0.0162 | −4.3 | |
| Right thalamus | 80 | 8.82 | 1.17 | −0.16 | 0.1534 | 80 | 8.63 | 1.33 | 0.11 | 0.3333 | |||||||
| Left thalamus | 80 | 9.02 | 1.64 | −0.34 | 0.0022 | 10.73 ± 0.57 | −0.0400 ± 0.0127 | −4.0 | 80 | 8.63 | 1.30 | −0.04 | 0.7362 | ||||
| Region | Cho | Glu | Gln | ||||||||||||||
| N a | Mean b | SD b | R | p | N a | Mean b | SD b | R | p | N a | Mean b | SD b | R | p | |||
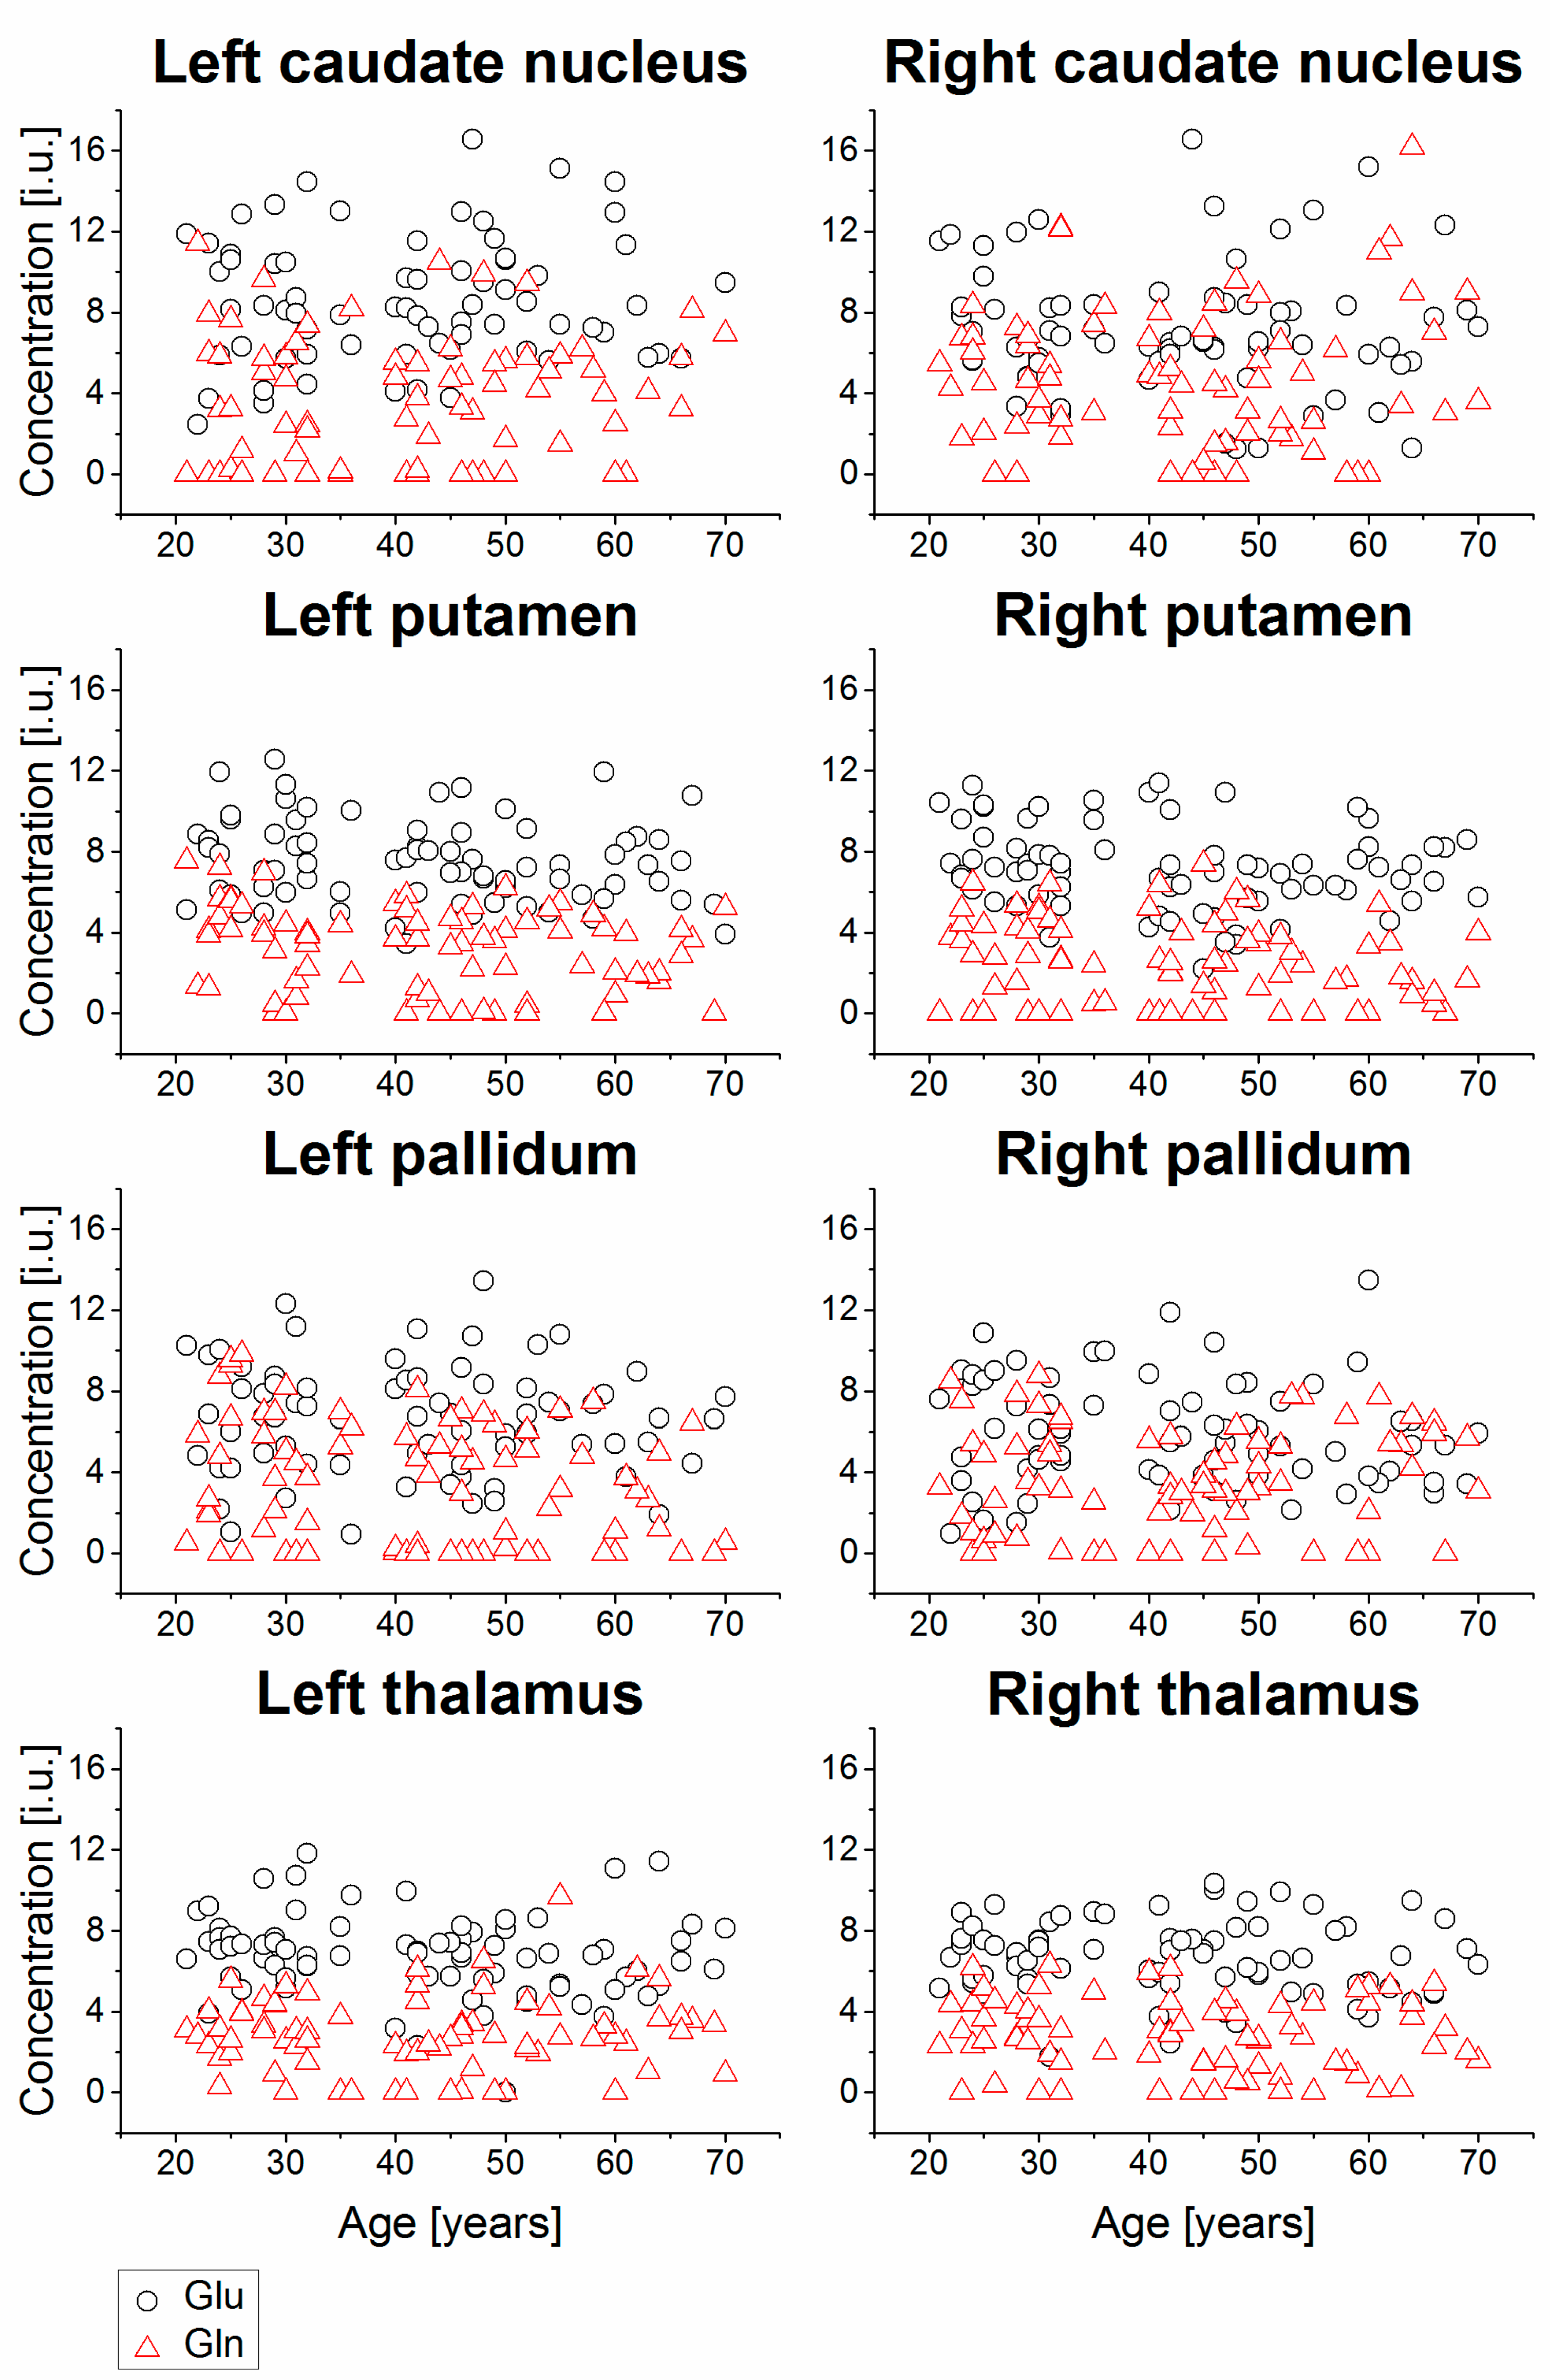
| Right caudate nucleus | 74 | 2.61 | 0.70 | 0.07 | 0.5784 | 72 | 7.20 | 3.16 | −0.07 | 0.5483 | 72 | 4.72 | 3.46 | 0.06 | 0.6276 | ||
| Left caudate nucleus | 75 | 2.77 | 0.66 | 0.00 | 0.9856 | 70 | 8.59 | 3.09 | 0.10 | 0.4282 | 73 | 3.69 | 3.12 | 0.08 | 0.5064 | ||
| Right putamen | 79 | 1.95 | 0.38 | 0.15 | 0.1905 | 75 | 7.15 | 2.07 | −0.20 | 0.0915 | 78 | 2.53 | 2.05 | −0.18 | 0.1113 | ||
| Left putamen | 80 | 1.93 | 0.41 | 0.02 | 0.8555 | 76 | 7.53 | 2.05 | −0.19 | 0.1076 | 77 | 3.08 | 2.07 | −0.19 | 0.0901 | ||
| Right pallidum | 75 | 1.76 | 0.50 | 0.13 | 0.2689 | 74 | 5.90 | 2.63 | −0.11 | 0.3585 | 71 | 3.64 | 2.59 | 0.08 | 0.5121 | ||
| Left pallidum | 77 | 1.71 | 0.53 | 0.00 | 0.9845 | 73 | 6.67 | 2.71 | −0.07 | 0.5825 | 76 | 3.46 | 3.00 | −0.21 | 0.0740 | ||
| Right thalamus | 80 | 2.11 | 0.45 | 0.06 | 0.6059 | 75 | 6.68 | 1.80 | −0.08 | 0.4979 | 76 | 2.72 | 1.83 | −0.11 | 0.3600 | ||
| Left thalamus | 80 | 2.09 | 0.46 | −0.02 | 0.8782 | 78 | 6.81 | 2.01 | −0.16 | 0.1613 | 76 | 2.79 | 1.89 | 0.04 | 0.7213 | ||
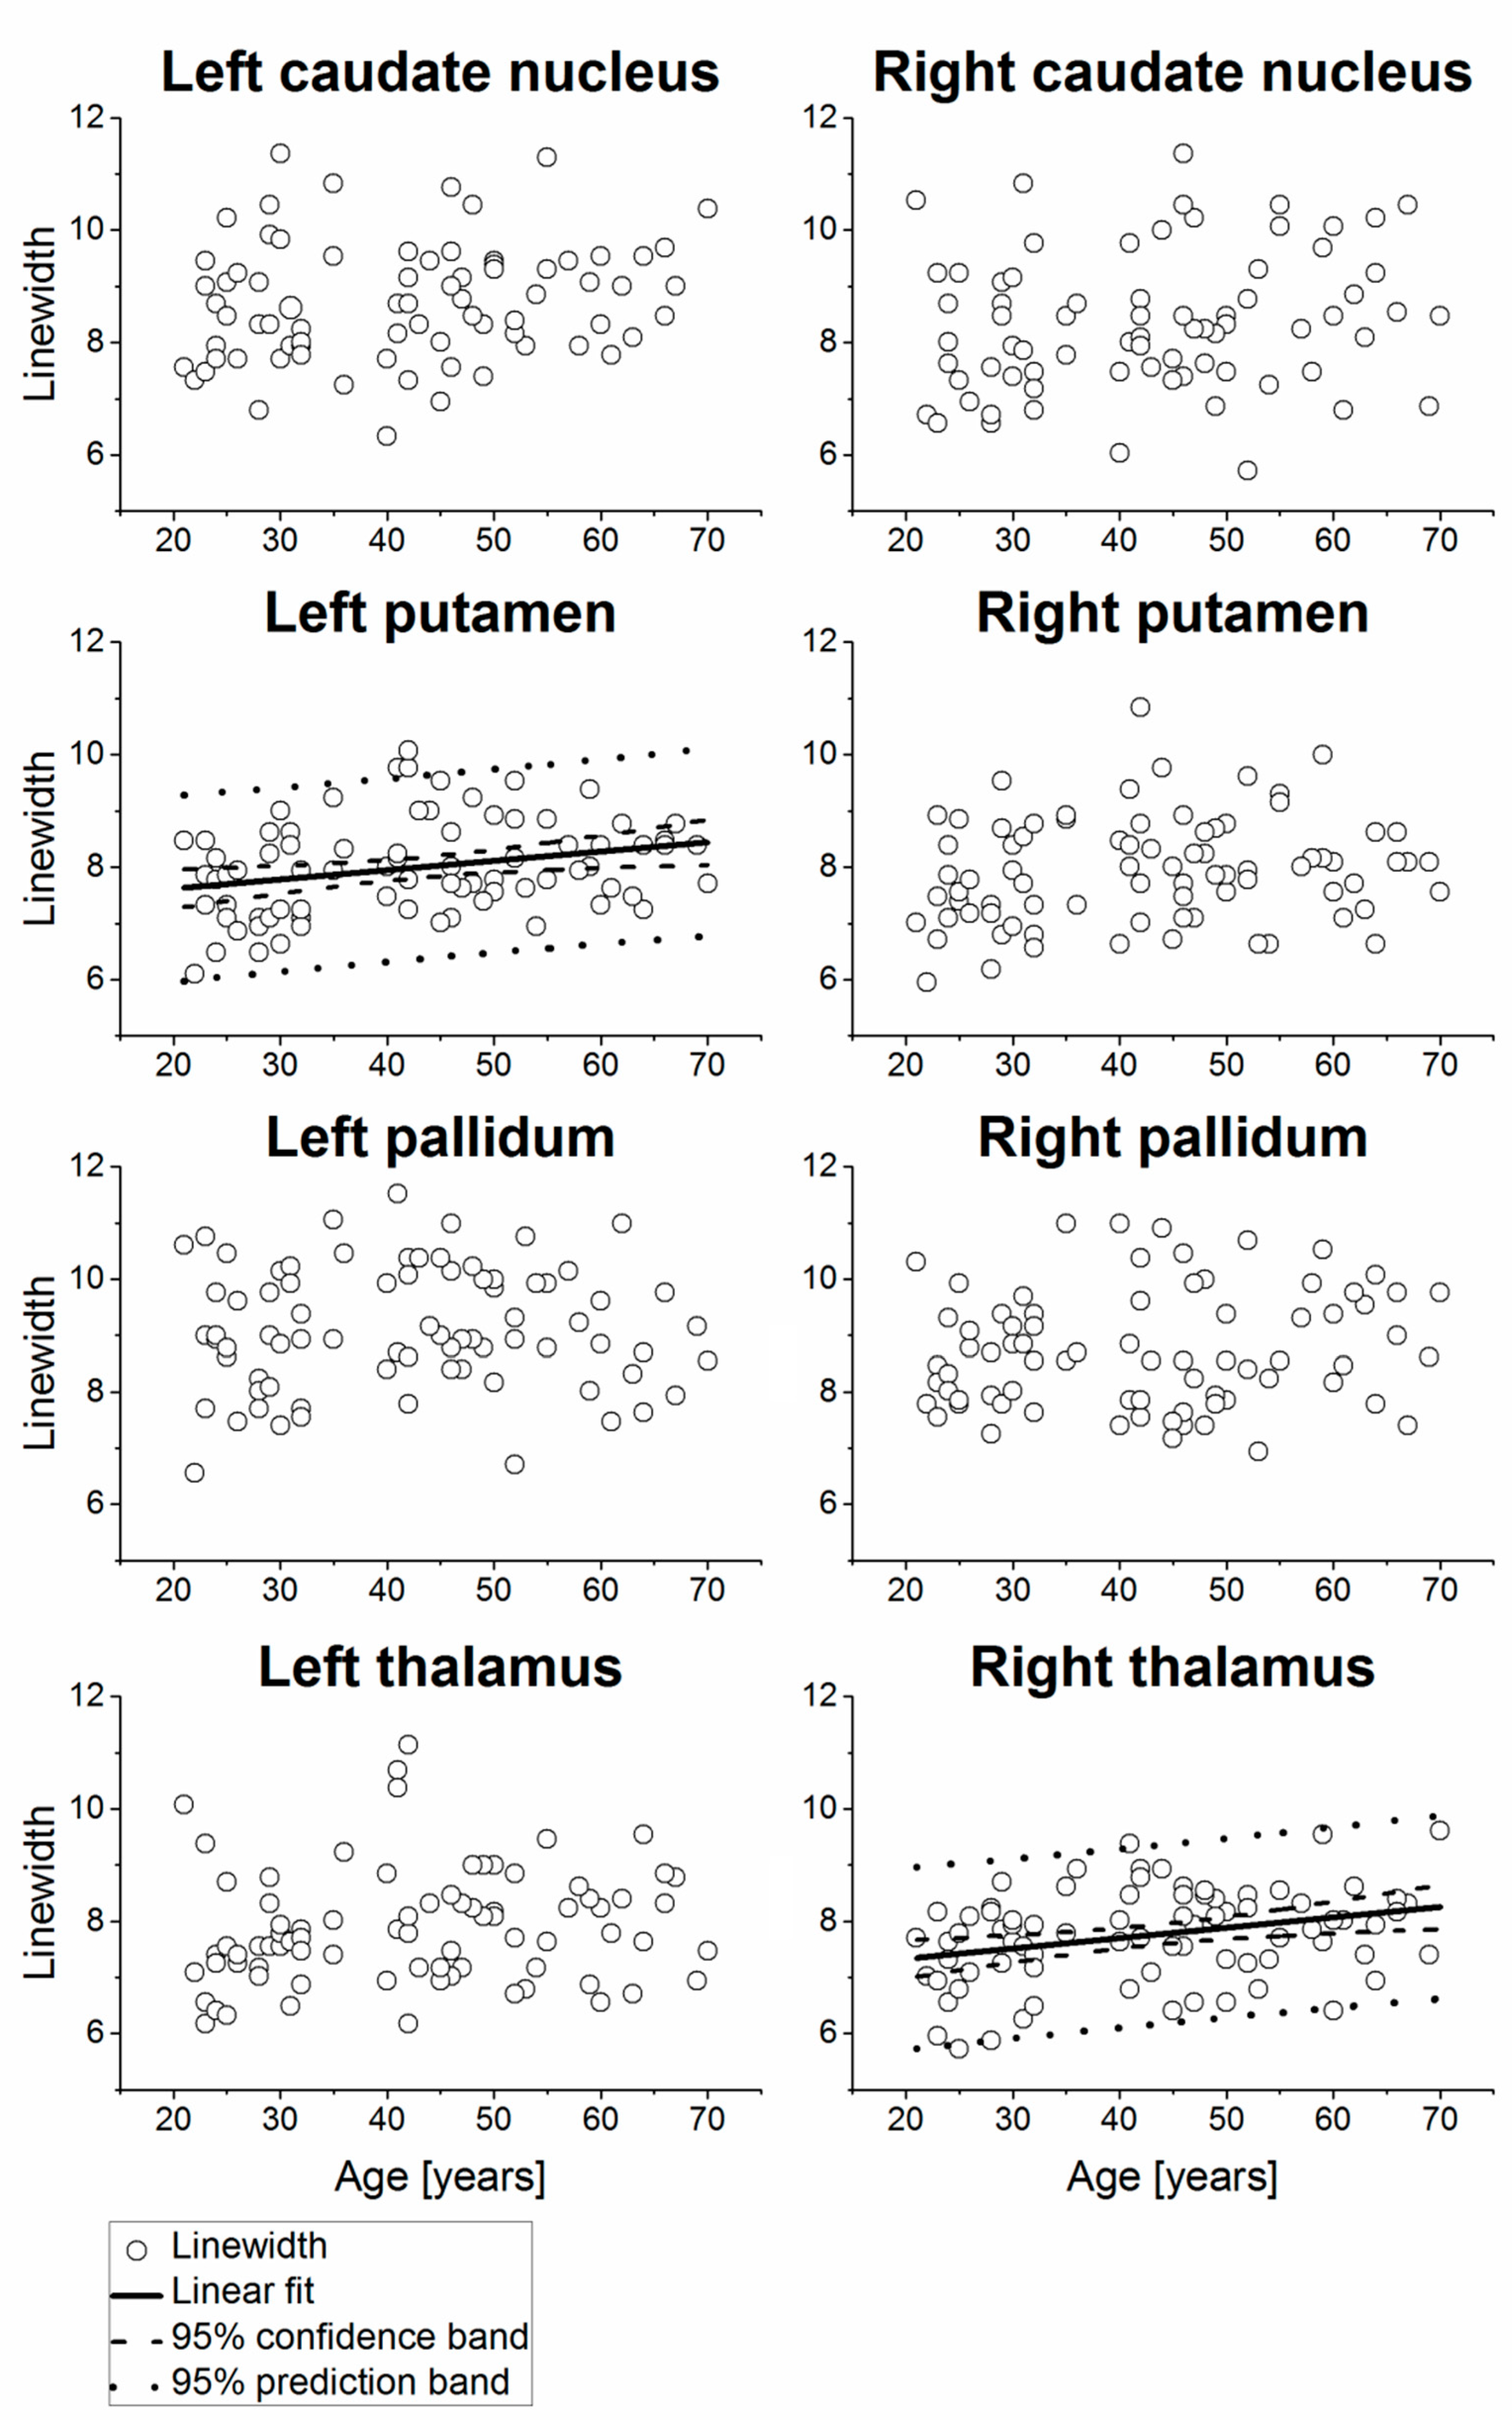
| Region | mI | Linewidth (Hz) | |||||||||||||||
| N a | Mean b | SD b | R | p | Intercept b | Slope b | Variations c | N a | Mean | SD | R | p | Intercept b | Slope b | Variations c | ||
| Right caudate nucleus | 74 | 3.95 | 2.00 | 0.26 | 0.0261 | 2.31 ± 0.76 | 0.0382 ± 0.0168 | 3.8 | 74 | 8.34 | 1.22 | 0.19 | 0.1119 | ||||
| Left caudate nucleus | 76 | 4.51 | 2.19 | 0.25 | 0.0283 | 2.80 ± 0.80 | 0.0410 ± 0.0184 | 4.1 | 76 | 8.72 | 1.05 | 0.17 | 0.1324 | ||||
| Right putamen | 78 | 3.24 | 1.15 | 0.14 | 0.2199 | 80 | 7.94 | 0.93 | 0.17 | 0.1287 | |||||||
| Left putamen | 75 | 3.36 | 1.16 | 0.11 | 0.3382 | 80 | 7.99 | 0.84 | 0.27 | 0.0142 | 7.28 ± 0.30 | 0.0166 ± 0.0066 | 1.7 | ||||
| Right pallidum | 74 | 3.39 | 1.56 | 0.00 | 0.9889 | 75 | 8.74 | 1.04 | 0.13 | 0.2482 | |||||||
| Left pallidum | 68 | 3.53 | 1.43 | −0.19 | 0.1160 | 77 | 9.13 | 1.08 | 0.02 | 0.8503 | |||||||
| Right thalamus | 77 | 3.60 | 1.02 | 0.25 | 0.0286 | 2.82 ± 0.37 | 0.0183 ± 0.0082 | 1.8 | 80 | 7.74 | 0.83 | 0.31 | 0.0054 | 6.96 ± 0.29 | 0.0185 ± 0.0065 | 1.8 | |
| Left thalamus | 77 | 3.53 | 1.25 | 0.12 | 0.3082 | 80 | 7.89 | 1.02 | 0.15 | 0.1920 | |||||||
| Brain Region | mI | Gln | Glu | |||
|---|---|---|---|---|---|---|
| Mean | SD | Mean | SD | Mean | SD | |
| Right caudate nucleus | 6.07 | 2.02 | 13.23 | 7.21 | 13.69 | 5.40 |
| Left caudate nucleus | 6.27 | 2.55 | 10.23 | 8.06 | 13.07 | 5.35 |
| Right putamen | 5.33 | 1.05 | 9.46 | 6.04 | 10.71 | 3.02 |
| Left putamen | 4.86 | 0.97 | 10.57 | 6.30 | 11.07 | 4.22 |
| Right pallidum | 7.38 | 2.49 | 16.89 | 10.96 | 17.97 | 8.14 |
| Left pallidum | 7.63 | 1.96 | 14.29 | 10.94 | 18.09 | 7.30 |
| Right thalamus | 5.37 | 1.21 | 10.72 | 6.28 | 11.65 | 4.45 |
| Left thalamus | 5.02 | 1.17 | 11.01 | 6.81 | 11.15 | 4.48 |
| Brain Region | R | p | n |
|---|---|---|---|
| Right caudate nucleus | −0.51 | <0.001 | 70 |
| Left caudate nucleus | −0.57 | <0.001 | 68 |
| Right putamen | −0.59 | <0.001 | 73 |
| Left putamen | −0.53 | <0.001 | 75 |
| Right pallidum | −0.71 | <0.001 | 71 |
| Left pallidum | −0.54 | <0.001 | 72 |
| Right thalamus | −0.59 | <0.001 | 73 |
| Left thalamus | −0.40 | <0.001 | 74 |
Publisher’s Note: MDPI stays neutral with regard to jurisdictional claims in published maps and institutional affiliations. |
© 2021 by the authors. Licensee MDPI, Basel, Switzerland. This article is an open access article distributed under the terms and conditions of the Creative Commons Attribution (CC BY) license (https://creativecommons.org/licenses/by/4.0/).
Share and Cite
Ahlswede, M.; Nösel, P.; Maudsley, A.A.; Sheriff, S.; Mahmoudi, N.; Bronzlik, P.; Lanfermann, H.; Ding, X.-Q. Alterations of Striato-Thalamic Metabolism in Normal Aging Human Brain—An MR Metabolic Imaging Study. Metabolites 2021, 11, 371. https://doi.org/10.3390/metabo11060371
Ahlswede M, Nösel P, Maudsley AA, Sheriff S, Mahmoudi N, Bronzlik P, Lanfermann H, Ding X-Q. Alterations of Striato-Thalamic Metabolism in Normal Aging Human Brain—An MR Metabolic Imaging Study. Metabolites. 2021; 11(6):371. https://doi.org/10.3390/metabo11060371
Chicago/Turabian StyleAhlswede, Mareike, Patrick Nösel, Andrew A. Maudsley, Sulaiman Sheriff, Nima Mahmoudi, Paul Bronzlik, Heinrich Lanfermann, and Xiao-Qi Ding. 2021. "Alterations of Striato-Thalamic Metabolism in Normal Aging Human Brain—An MR Metabolic Imaging Study" Metabolites 11, no. 6: 371. https://doi.org/10.3390/metabo11060371