
Pre-Diagnostic Circulating Metabolites and Colorectal Cancer Risk in the Cancer Prevention Study-II Nutrition Cohort


Abstract
:
1. Introduction
2. Results
3. Discussion
4. Materials and Methods
4.1. Study Population and Design
4.2. Metabolomics Assessment
4.3. Statistical Analysis
Supplementary Materials
Author Contributions
Funding
Institutional Review Board Statement
Informed Consent Statement
Data Availability Statement
Acknowledgments
Conflicts of Interest
References
- Campbell, P.T. The role of diabetes and diabetes treatments in colorectal cancer mortality, incidence and survival. Curr. Nutr. Rep. 2013, 2, 37–47. [Google Scholar] [CrossRef] [Green Version]
- Murphy, N.; Jenab, M.; Gunter, M.J. Adiposity and gastrointestinal cancers: Epidemiology, mechanisms and future directions. Nat. Rev. Gastroenterol. Hepatol. 2018, 15, 659–670. [Google Scholar] [CrossRef]
- Wu, K.; Keum, N.; Nishihara, R.; Giovannucci, E.L. Cancers of the Colon and Rectum. In Cancer Epidemiology and Prevention, 4th ed.; Thun, M.J., Linet, M.S., Cerhan, J.R., Haiman, C.A., Schottenfeld, D., Eds.; Oxford University Press: New York, NY, USA, 2018; pp. 681–705. [Google Scholar]
- Farshidfar, F.; Weljie, A.M.; Kopciuk, A.K.; Hilsden, R.; McGregor, S.E.; Buie, W.D.; MacLean, A.; Vogel, H.J.; Bathe, O.F. A validated metabolomic signature for colorectal cancer: Exploration of the clinical value of metabolomics. Br. J. Cancer 2016, 115, 848–857. [Google Scholar] [CrossRef] [Green Version]
- Zhang, F.; Zhang, Y.; Zhao, W.; Deng, K.; Wang, Z.; Yang, C.; Ma, L.; Openkova, M.S.; Hou, Y.; Li, K. Metabolomics for biomarker discovery in the diagnosis, prognosis, survival and recurrence of colorectal cancer: A systematic review. Oncotarget 2017, 8, 35460–35472. [Google Scholar] [CrossRef] [Green Version]
- Hashim, N.A.A.; Ab-Rahim, S.; Suddin, L.S.; Saman, M.S.A.; Mazlan, M. Global serum metabolomics profiling of colorectal cancer. Mol. Clin. Oncol. 2019, 11, 3–14. [Google Scholar] [CrossRef] [Green Version]
- Shu, X.; Xiang, Y.-B.; Rothman, N.; Yu, D.; Li, H.-L.; Yang, G.; Cai, H.; Ma, X.; Lan, Q.; Gao, Y.-T.; et al. Prospective study of blood metabolites associated with colorectal cancer risk. Int. J. Cancer 2018, 143, 527–534. [Google Scholar] [CrossRef] [Green Version]
- Cross, A.J.; Moore, S.C.; Boca, S.; Huang, W.-Y.; Xiong, X.; Stolzenberg-Solomon, R.; Sinha, R.; Sampson, J.N. A prospective study of serum metabolites and colorectal cancer risk. Cancer 2014, 120, 3049–3057. [Google Scholar] [CrossRef]
- Sampson, J.N.; Boca, S.M.; Shu, X.O.; Stolzenberg-Solomon, R.Z.; Matthews, C.E.; Hsing, A.W.; Tan, Y.T.; Ji, B.-T.; Chow, W.-H.; Cai, Q.; et al. Metabolomics in epidemiology: Sources of variability in metabolite measurements and implications. Cancer Epidemiol. Biomark. Prev. 2013, 22, 631–640. [Google Scholar] [CrossRef] [PubMed] [Green Version]
- Goedert, J.J.; Sampson, J.N.; Moore, S.C.; Xiao, Q.; Xiong, X.; Hayes, R.B.; Ahn, J.; Shi, J.; Sinha, R. Fecal metabolomics: Assay performance and association with colorectal cancer. Carcinogenesis 2014, 35, 2089–2096. [Google Scholar] [CrossRef] [PubMed] [Green Version]
- Lieu, E.L.; Nguyen, T.; Rhyne, S.; Kim, J. Amino acids in cancer. Exp. Mol. Med. 2020, 52, 15–30. [Google Scholar] [CrossRef]
- Jirásková, A.; Novotný, J.; Novotný, L.; Vodička, P.; Pardini, B.; Naccarati, A.; Schwertner, H.A.; Hubáček, J.A.; Punčochářová, L.; Šmerhovský, Z.; et al. Association of serum bilirubin and promoter variations in HMOX1 and UGT1A1 genes with sporadic colorectal cancer. Int. J. Cancer 2012, 131, 1549–1555. [Google Scholar] [CrossRef]
- Peng, Y.-F.; Goyal, H.; Xu, G.-D. Serum bilirubin has an important role in multiple clinical applications. J. Lab. Precis. Med. 2017, 2, 82. [Google Scholar] [CrossRef]
- Zucker, S.D.; Horn, P.S.; Sherman, K.E. Serum bilirubin levels in the U.S. population: Gender effect and inverse correlation with colorecal cancer. Hepatology 2004, 40, 827–835. [Google Scholar] [CrossRef]
- Kuhn, T.; Sookthai, D.; Graf, M.E.; Schubel, R.; Freisling, H.; Johnson, T.; Katzke, V.; Kaaks, R. Albumin, bilirubin, uric acid and cancer risk: Results from a prospective population-based study. Br. J. Cancer 2017, 117, 1572–1579. [Google Scholar] [CrossRef] [PubMed] [Green Version]
- Ioannou, G.N.; Liou, I.W.; Weiss, N.S. Serum bilirubin and colorectal cancer risk: A population-based cohort study. Aliment. Pharmacol. Ther. 2006, 23, 1637–1642. [Google Scholar] [CrossRef] [PubMed]
- Wang, Y.; Gapstur, S.M.; Carter, B.D.; Hartman, T.J.; Stevens, V.L.; Gaudet, M.M.; McCullough, M.L. Untargeted metabolomics identifies novel potential biomarkers of habitual food intake in a cross-sectional study of postmenopausal women. J. Nutr. 2018, 148, 932–943. [Google Scholar] [CrossRef]
- Gapstur, S.M.; Anderson, R.L.; Campbell, P.T.; Jacobs, E.J.; Hartman, T.J.; Hildebrand, J.S.; Wang, Y.; McCullough, M.L. Associations of Coffee Drinking and Cancer Mortality in the Cancer Prevention Study-II. Cancer Epidemiol. Biomark. Prev. 2017, 26, 1477–1486. [Google Scholar] [CrossRef] [Green Version]
- Um, C.Y.; McCullough, M.L.; Guinter, M.A.; Campbell, P.T.; Jacobs, E.J.; Gapstur, S.M. Coffee consumption and risk of colorectal cancer in the Cancer Prevention Study-II Nutrition Cohort. Cancer Epidemiol. 2020, 67, 101730. [Google Scholar] [CrossRef] [PubMed]
- Guertin, K.A.; Loftfield, E.; Boca, S.M.; Sampson, J.N.; Moore, S.C.; Xiao, Q.; Huang, W.-Y.; Xiong, X.; Freedman, N.D.; Cross, A.J.; et al. Serum biomarkers of habitual coffee consumption may provide insight into the mechanism underlying the association between coffee consumption and colorectal cancer. Am. J. Clin. Nutr. 2015, 101, 1000–1011. [Google Scholar] [CrossRef]
- Wang, Y.; Carter, B.D.; Gapstur, S.M.; McCullough, M.L.; Gaudet, M.M.; Stevens, V.L. Reproducibility of non-fasting plasma metabolomics measurements across processing delays. Metabolomics 2018, 14, 129. [Google Scholar] [CrossRef]
- Calle, E.E.; Rodriguez, C.; Jacobs, E.J.; Almon, M.L.; Chao, A.; McCullough, M.L.; Feigelson, H.S.; Thun, M.J. The American Cancer Society Cancer Prevention Study II Nutrition Cohort—Rationale, Study Design, and Baseline Characteristics. Cancer 2002, 94, 2490–2501. [Google Scholar] [CrossRef] [PubMed]
- Evans, A.M.; DeHaven, C.D.; Barrett, T.; Mitchell, M.; Milgram, E. Integrated, nontargeted ultrahigh performance liquid chromatography/electrospray ionization tandem mass spectrometry platform for the identification and relative quantification of the small-molecule complement of biological systems. Anal. Chem. 2009, 81, 6656–6667. [Google Scholar] [CrossRef] [PubMed]
- McCullough, M.L.; Patel, A.V.; Kushi, L.H.; Patel, R.; Willett, W.C.; Doyle, C.; Thun, M.J.; Gapstur, S.M. Following cancer prevention guidelines reduces risk of cancer, cardiovascular disease, and all-cause mortality. Cancer Epidemiol. Biomark. Prev. 2011, 20, 1089–1097. [Google Scholar] [CrossRef] [PubMed] [Green Version]
- Benjamini, Y.; Hochberg, Y. Controlling the false discovery rate: A practical and powerful approach to multiple testing. J. R. Stat. Soc. Ser. B Methodol. 1995, 57, 289–300. [Google Scholar] [CrossRef]
- Moore, S.C.; Playdon, M.C.; Sampson, J.N.; Hoover, R.N.; Trabert, B.; Matthews, E.C.; Ziegler, R.G. A Metabolomics Analysis of Body Mass Index and Postmenopausal Breast Cancer Risk. J. Nat. Cancer Inst. 2018, 110, 588–597. [Google Scholar] [CrossRef]
- Wang, Y.; Jacobs, E.J.; Carter, B.D.; Gapstur, S.M.; Stevens, V.L. Plasma Metabolomic Profiles and Risk of Advanced and Fatal Prostate Cancer. Eur. Urol. Oncol. 2019, 4, 56–65. [Google Scholar] [CrossRef] [Green Version]
- Wang, M.; Spiegelman, D.; Kuchiba, A.; Lochhead, P.; Kim, S.; Chan, A.T.; Poole, E.M.; Tamimi, R.M.; Tworoger, S.S.; Giovannucci, E.; et al. Statistical methods for studying disease subtype heterogeneity. Stat. Med. 2016, 35, 782–800. [Google Scholar] [CrossRef]
- R Core Team. R: A Language and Environment for Statistical Computing. Available online: https://www.R-project.org/ (accessed on 13 July 2020).

| Cases (n = 517) | Controls (n = 517) | p-Value b | |
|---|---|---|---|
| Age at Blood Draw c, Mean (SD) | 70.2 (5.5) | 70.2 (5.5) | Matched |
| Sex, n (%) | Matched | ||
| Male | 229 (44.3) | 229 (44.3) | |
| Female | 288 (55.7) | 288 (55.7) | |
| Race, n (%) | Matched | ||
| White | 505 (97.7) | 506 (97.9) | |
| Black | 4 (0.8) | 4 (0.8) | |
| Other/Unknown | 8 (1.5) | 7 (1.4) | |
| Highest Education Level, n (%) | 0.217 | ||
| Less than High School | 13 (2.5) | 12 (2.3) | |
| High School Grad | 130 (25.1) | 107 (20.7) | |
| Some College | 157 (30.4) | 169 (32.7) | |
| College Grad | 113 (21.9) | 111 (21.5) | |
| Grad School | 101 (19.5) | 118 (22.8) | |
| Unknown | 3 (0.6) | 0 (0.0) | |
| Body Mass Index (kg/m2), Mean (SD) | 26.5 (4.7) | 25.7 (4.1) | 0.004 |
| Hours Since Last Meal c, Mean (SD) | 2.3 (2.2) | 2.2 (1.9) | 0.232 |
| Smoking Status, n (%) | 0.773 | ||
| Never | 245 (47.4) | 251 (48.5) | |
| Former | 247 (47.8) | 247 (47.8) | |
| Current | 14 (2.7) | 12 (2.3) | |
| Unknown | 11 (2.1) | 7 (1.4) | |
| Physical Activity, (MET-h/week), n (%) | 0.825 | ||
| <8.75 | 194 (37.5) | 189 (36.6) | |
| 8.75–<17 | 143 (27.7) | 137 (26.5) | |
| 17+ | 173 (33.5) | 181 (35.0) | |
| Missing | 7 (1.4) | 10 (1.9) | |
| Alcohol Consumption c, n (%) | 0.662 | ||
| <1 Drink/D | 408 (78.9) | 410 (79.3) | |
| 1+ Drinks/D | 97 (18.8) | 99 (19.1) | |
| Unknown | 12 (2.3) | 8 (1.5) | |
| NSAID User | 0.161 | ||
| No | 213 (41.2) | 190 (36.8) | |
| Yes | 304 (58.8) | 327 (63.2) | |
| Postmenopausal Hormone Use c,d, n (%) | 0.093 | ||
| Not a Current User | 168 (58.3) | 142 (49.3) | |
| Current User | 118 (41.0) | 144 (50.0) | |
| Unknown | 2 (0.1) | 2 (0.1) | |
| Cancer Subsite | N/A | ||
| Control | 0 (0.0) | 515 (99.6) | |
| Proximal Colon | 204 (39.5) | 2 (0.4) | |
| Distal Colon | 95 (18.4) | 0 (0.0) | |
| Rectum | 74 (14.3) | 0 (0.0) | |
| Colon | 137 (26.5) | 0 (0.0) | |
| Unknown | 7 (1.4) | 0 (0.0) | |
| Cancer stage | N/A | ||
| Control | 0 (0.0) | 515 (99.6) | |
| Local | 195 (37.7) | 1 (0.2) | |
| Regional | 225 (43.5) | 1 (0.2) | |
| Distant (Metastatic) | 53 (10.3) | 0 (0.0) | |
| Unknown | 44 (8.5) | 0 (0.0) | |
| Colorectal Screening | 0.003 | ||
| Never Screened | 159 (30.8) | 120 (23.2) | |
| Screened in the Past | 302 (58.4) | 355 (68.7) | |
| Unknown Screening Status | 56 (10.8) | 42 (8.1) | |
| Diet and Nutrients, Mean (SD) | |||
| Red Meat (servings/day) | 0.7 (0.5) | 0.6 (0.4) | 0.042 |
| Processed Meat (servings/day) | 0.3 (0.3) | 0.3 (0.3) | 0.769 |
| Caffeinated Coffee (drinks/day) | 0.9 (1.2) | 0.9 (1.3) | 0.961 |
| Decaffeinated Coffee (drinks/d) | 0.6 (0.9) | 0.6 (1.0) | 0.770 |
| Total Folate (mcg) | 620 (287) | 625 (282) | 0.788 |
| Dietary Fiber (g) | 18.7 (7.0) | 18.8 (7.2) | 0.734 |
| Total calcium (mg) | 1102 (555) | 1161 (537) | 0.091 |
| Total Vitamin D (IU) | 395 (246) | 418 (246) | 0.138 |
| Total Calories | 1725 (493) | 1734 (549) | 0.769 |
| Diet Score, mean (SD) | |||
| ACS Diet Score (range: 0–9 patients) | 4.3 (1.9) | 4.6 (2.0) | 0.039 |
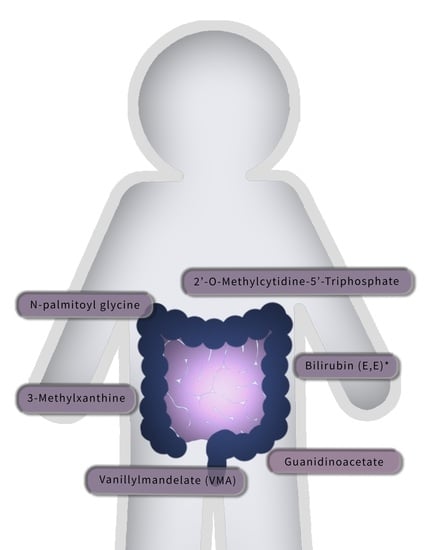
| Guanidinoacetate | Vanillylmandelate (VMA) | 3-methylxanthine | 2’-O-methylcytidine | Bilirubin (E,E) | N-palmitoylglycine | |
|---|---|---|---|---|---|---|
| Multivariable Adjusted Continuous Model a | ||||||
| Per SD | 1.32 (1.14, 1.52) | 1.29 (1.12, 1.49) | 0.79 (0.69, 0.89) | 1.27 (1.11, 1.46) | 1.29 (1.11, 1.50) | 1.27 (1.11, 1.45) |
| p | <0.001 | <0.001 | <0.001 | <0.001 | 0.001 | 0.001 |
| FDR | 0.090 | 0.090 | 0.090 | 0.090 | 0.121 | 0.106 |
| Continuous, Mutually Adjusted Model b | ||||||
| Per SD | 1.24 (1.07, 1.45) | 1.28 (1.09, 1.49) | 0.74 (0.64, 0.85) | 1.18 (1.02, 1.36) | 1.15 (0.97, 1.36) | 1.12 (0.96, 1.30) |
| p | 0.005 | 0.002 | <0.001 | 0.028 | 0.099 | 0.139 |
| Multivariable Adjusted Quartiles a | ||||||
| Q1 (ref) | 1.00 (ref) | 1.00 (ref) | 1.00 (ref) | 1.00 (ref) | 1.00 (ref) | 1.00 (ref) |
| Q2 | 1.26 (0.86, 1.83) | 1.64 (1.13, 2.40) | 0.63 (0.44, 0.91) | 1.26 (0.89, 1.80) | 1.10 (0.76, 1.60) | 1.23 (0.85, 1.78) |
| Q3 | 1.42 (0.98, 2.06) | 1.51 (1.04, 2.18) | 0.65 (0.46, 0.93) | 1.71 (1.18, 2.47) | 1.51 (1.02, 2.24) | 1.40 (0.97, 2.01) |
| Q4 | 1.87 (1.26, 2.77) | 1.94 (1.31, 2.89) | 0.51 (0.35, 0.73) | 1.73 (1.20, 2.50) | 1.64 (1.10, 2.45) | 1.97 (1.36, 2.87) |
| ptrendc | 0.001 | 0.003 | <0.001 | 0.001 | 0.008 | <0.001 |
| FDR | 0.220 | 0.236 | 0.220 | 0.220 | 0.272 | 0.220 |
| Model | Guanidinoacetate | Vanillylmandelate (VMA) | 3-methylxanthine | 2’-O-methylcytidine | Bilirubin (E,E) | N-palmitoylglycine |
|---|---|---|---|---|---|---|
| Individual Metabolites (continuous) | ||||||
| Follow-Up ≤5 years (229 cases) | ||||||
| Per SD | 1.22 (0.99, 1.52) | 1.34 (1.08, 1.66) | 0.79 (0.65, 0.97) | 1.30 (1.06, 1.60) | 1.21 (0.97, 1.51) | 1.47 (1.18, 1.83) |
| p | 0.067 | 0.008 | 0.024 | 0.011 | 0.095 | 0.001 |
| Follow-Up >5 years (288 cases) | ||||||
| Per SD | 1.42 (1.17, 1.74) | 1.26 (1.03, 1.53) | 0.76 (0.63, 0.90) | 1.27 (1.05, 1.53) | 1.35 (1.09, 1.66) | 1.15 (0.96, 1.37) |
| p | 0.001 | 0.023 | 0.002 | 0.014 | 0.006 | 0.138 |
| pinteraction | 0.582 | 0.591 | 0.717 | 0.537 | 0.550 | 0.042 |
| Men Only (229 cases) | ||||||
| Per SD | 1.52 (1.21, 1.91) | 1.33 (1.08, 1.64) | 0.84 (0.68, 1.03) | 1.54 (1.23, 1.92) | 1.32 (1.05, 1.66) | 1.19 (0.96, 1.47) |
| p | <0.001 | 0.007 | 0.093 | <0.001 | 0.018 | 0.109 |
| Women Only (288 cases) | ||||||
| Per SD | 1.20 (0.99, 1.44) | 1.25 (1.02, 1.53) | 0.74 (0.63, 0.88) | 1.11 (0.93, 1.33) | 1.29 (1.05, 1.58) | 1.34 (1.12, 1.61) |
| p | 0.063 | 0.028 | 0.001 | 0.252 | 0.015 | 0.002 |
| pinteraction | 0.173 | 0.741 | 0.341 | 0.043 | 0.849 | 0.343 |
Publisher’s Note: MDPI stays neutral with regard to jurisdictional claims in published maps and institutional affiliations. |
© 2021 by the authors. Licensee MDPI, Basel, Switzerland. This article is an open access article distributed under the terms and conditions of the Creative Commons Attribution (CC BY) license (http://creativecommons.org/licenses/by/4.0/).
Share and Cite
McCullough, M.L.; Hodge, R.A.; Campbell, P.T.; Stevens, V.L.; Wang, Y. Pre-Diagnostic Circulating Metabolites and Colorectal Cancer Risk in the Cancer Prevention Study-II Nutrition Cohort. Metabolites 2021, 11, 156. https://doi.org/10.3390/metabo11030156
McCullough ML, Hodge RA, Campbell PT, Stevens VL, Wang Y. Pre-Diagnostic Circulating Metabolites and Colorectal Cancer Risk in the Cancer Prevention Study-II Nutrition Cohort. Metabolites. 2021; 11(3):156. https://doi.org/10.3390/metabo11030156
Chicago/Turabian StyleMcCullough, Marjorie L., Rebecca A. Hodge, Peter T. Campbell, Victoria L. Stevens, and Ying Wang. 2021. "Pre-Diagnostic Circulating Metabolites and Colorectal Cancer Risk in the Cancer Prevention Study-II Nutrition Cohort" Metabolites 11, no. 3: 156. https://doi.org/10.3390/metabo11030156