Article

Metabolite Genome-Wide Association Study (mGWAS) and Gene-Metabolite Interaction Network Analysis Reveal Potential Biomarkers for Feed Efficiency in Pigs

Quantitative Genomics, Bioinformatics and Computational Biology Group, Department of Applied Mathematics and Computer Science, Technical University of Denmark, Richard Petersens Plads, Building 324, 2800 Kongens Lyngby, Denmark
*
Author to whom correspondence should be addressed.
Metabolites 2020, 10(5), 201; https://doi.org/10.3390/metabo10050201
Submission received: 1 April 2020 / Revised: 10 May 2020 / Accepted: 11 May 2020 / Published: 15 May 2020
(This article belongs to the Special Issue Metabolomic Applications in Animal Science)

Abstract

:
Metabolites represent the ultimate response of biological systems, so metabolomics is considered the link between genotypes and phenotypes. Feed efficiency is one of the most important phenotypes in sustainable pig production and is the main breeding goal trait. We utilized metabolic and genomic datasets from a total of 108 pigs from our own previously published studies that involved 59 Duroc and 49 Landrace pigs with data on feed efficiency (residual feed intake (RFI)), genotype (PorcineSNP80 BeadChip) data, and metabolomic data (45 final metabolite datasets derived from LC-MS system). Utilizing these datasets, our main aim was to identify genetic variants (single-nucleotide polymorphisms (SNPs)) that affect 45 different metabolite concentrations in plasma collected at the start and end of the performance testing of pigs categorized as high or low in their feed efficiency (based on RFI values). Genome-wide significant genetic variants could be then used as potential genetic or biomarkers in breeding programs for feed efficiency. The other objective was to reveal the biochemical mechanisms underlying genetic variation for pigs’ feed efficiency. In order to achieve these objectives, we firstly conducted a metabolite genome-wide association study (mGWAS) based on mixed linear models and found 152 genome-wide significant SNPs (p-value < 1.06 × 10⁻⁶) in association with 17 metabolites that included 90 significant SNPs annotated to 52 genes. On chromosome one alone, 51 significant SNPs associated with isovalerylcarnitine and propionylcarnitine were found to be in strong linkage disequilibrium (LD). SNPs in strong LD annotated to FBXL4, and CCNC consisted of two haplotype blocks where three SNPs (ALGA0004000, ALGA0004041, and ALGA0004042) were in the intron regions of FBXL4 and CCNC. The interaction network revealed that CCNC and FBXL4 were linked by the hub gene N6AMT1 that was associated with isovalerylcarnitine and propionylcarnitine. Moreover, three metabolites (i.e., isovalerylcarnitine, propionylcarnitine, and pyruvic acid) were clustered in one group based on the low-high RFI pigs. This study performed a comprehensive metabolite-based genome-wide association study (GWAS) analysis for pigs with differences in feed efficiency and provided significant metabolites for which there is significant genetic variation as well as biological interaction networks. The identified metabolite genetic variants, genes, and networks in high versus low feed efficient pigs could be considered as potential genetic or biomarkers for feed efficiency.

1. Introduction

Large populations are generally essential for genome-wide association study (GWAS) to obtain sufficient statistical power for the identification of genetic polymorphisms [1]. However, some intermediate phenotypes like metabolites could potentially avoid this problem, as they are directly involved in metabolite conversion modification [2,3]. As the end products of cellular regulatory processes, metabolites represent the ultimate response of biological systems associated with genetic changes, so metabolomics is considered the link between genotypes and phenotypes [4]. Metabolomics refers to the measurements of all endogenous metabolites, intermediates, and products of metabolism and has been applied to measure the dynamic metabolic responses in pigs [5,6] and dairy cows [7,8]. Additionally, metabolites could provide details of physiological state, so genetic variant-associated metabolites are expected to display larger effect sizes [9]. Gieger et al. (2008) firstly used metabolite concentrations as quantitative traits in association with genotypes and found their available applications in GWAS [9]. Do et al. (2014) [10] conducted GWAS using residual feed intake (RFI) phenotypes to identify single-nucleotide polymorphisms (SNPs) that explain significant variation in feed efficiency for pigs. Our previous study found two metabolites (i.e., α-ketoglutarate and succinic acid) in a RFI-related network of dairy cows which could represent biochemical mechanisms underlying variation for phenotypes of feed efficiency [8].
In this study, we aimed to identify genetic variants (SNP markers) affecting concentrations of metabolites and to reveal the biochemical mechanisms underlying genetic variation for pigs’ feed efficiency. Our study is based on two of our previously published papers and datasets used therein [6,11]. Briefly, the experiment consisted of 59 Duroc and 49 Landrace pigs with data on feed efficiency (RFI), genotype (PorcineSNP80 BeadChip) data, and metabolomic data (45 final metabolite datasets derived from liquid chromatography-mass spectrometry (LC-MS) system). While our previous studies only looked at metabolome-phenotype associations [6], we report an integrated systems genomics approach to identify quantitative trait loci (QTLs) or SNPs affecting metabolite concentration via metabolite GWAS methods (mGWAS), where each metabolite is itself a phenotype. To the best of our knowledge, this is the first study to link the genomics with metabolomics to identify significant genetic variants associated with known metabolites that differ in pigs with different levels of feed efficiency. Main aims of our study are as follows:
  • Find significant SNP markers associated with all the metabolites in the metabolomics dataset using mGWAS method and then reveal the biochemical mechanisms underlying genetic variation for porcine feed efficiency using 108 Danish pigs in low and high RFI conditions, genotyped by 68K PorcineSNP80 BeadChip array.
  • Annotate identified significant SNP markers to porcine genes.
  • Annotate metabolites and identify enriched metabolic pathways and gene-metabolite networks to find the potential biomarkers that were strongly associated with feed efficiency.

2. Results

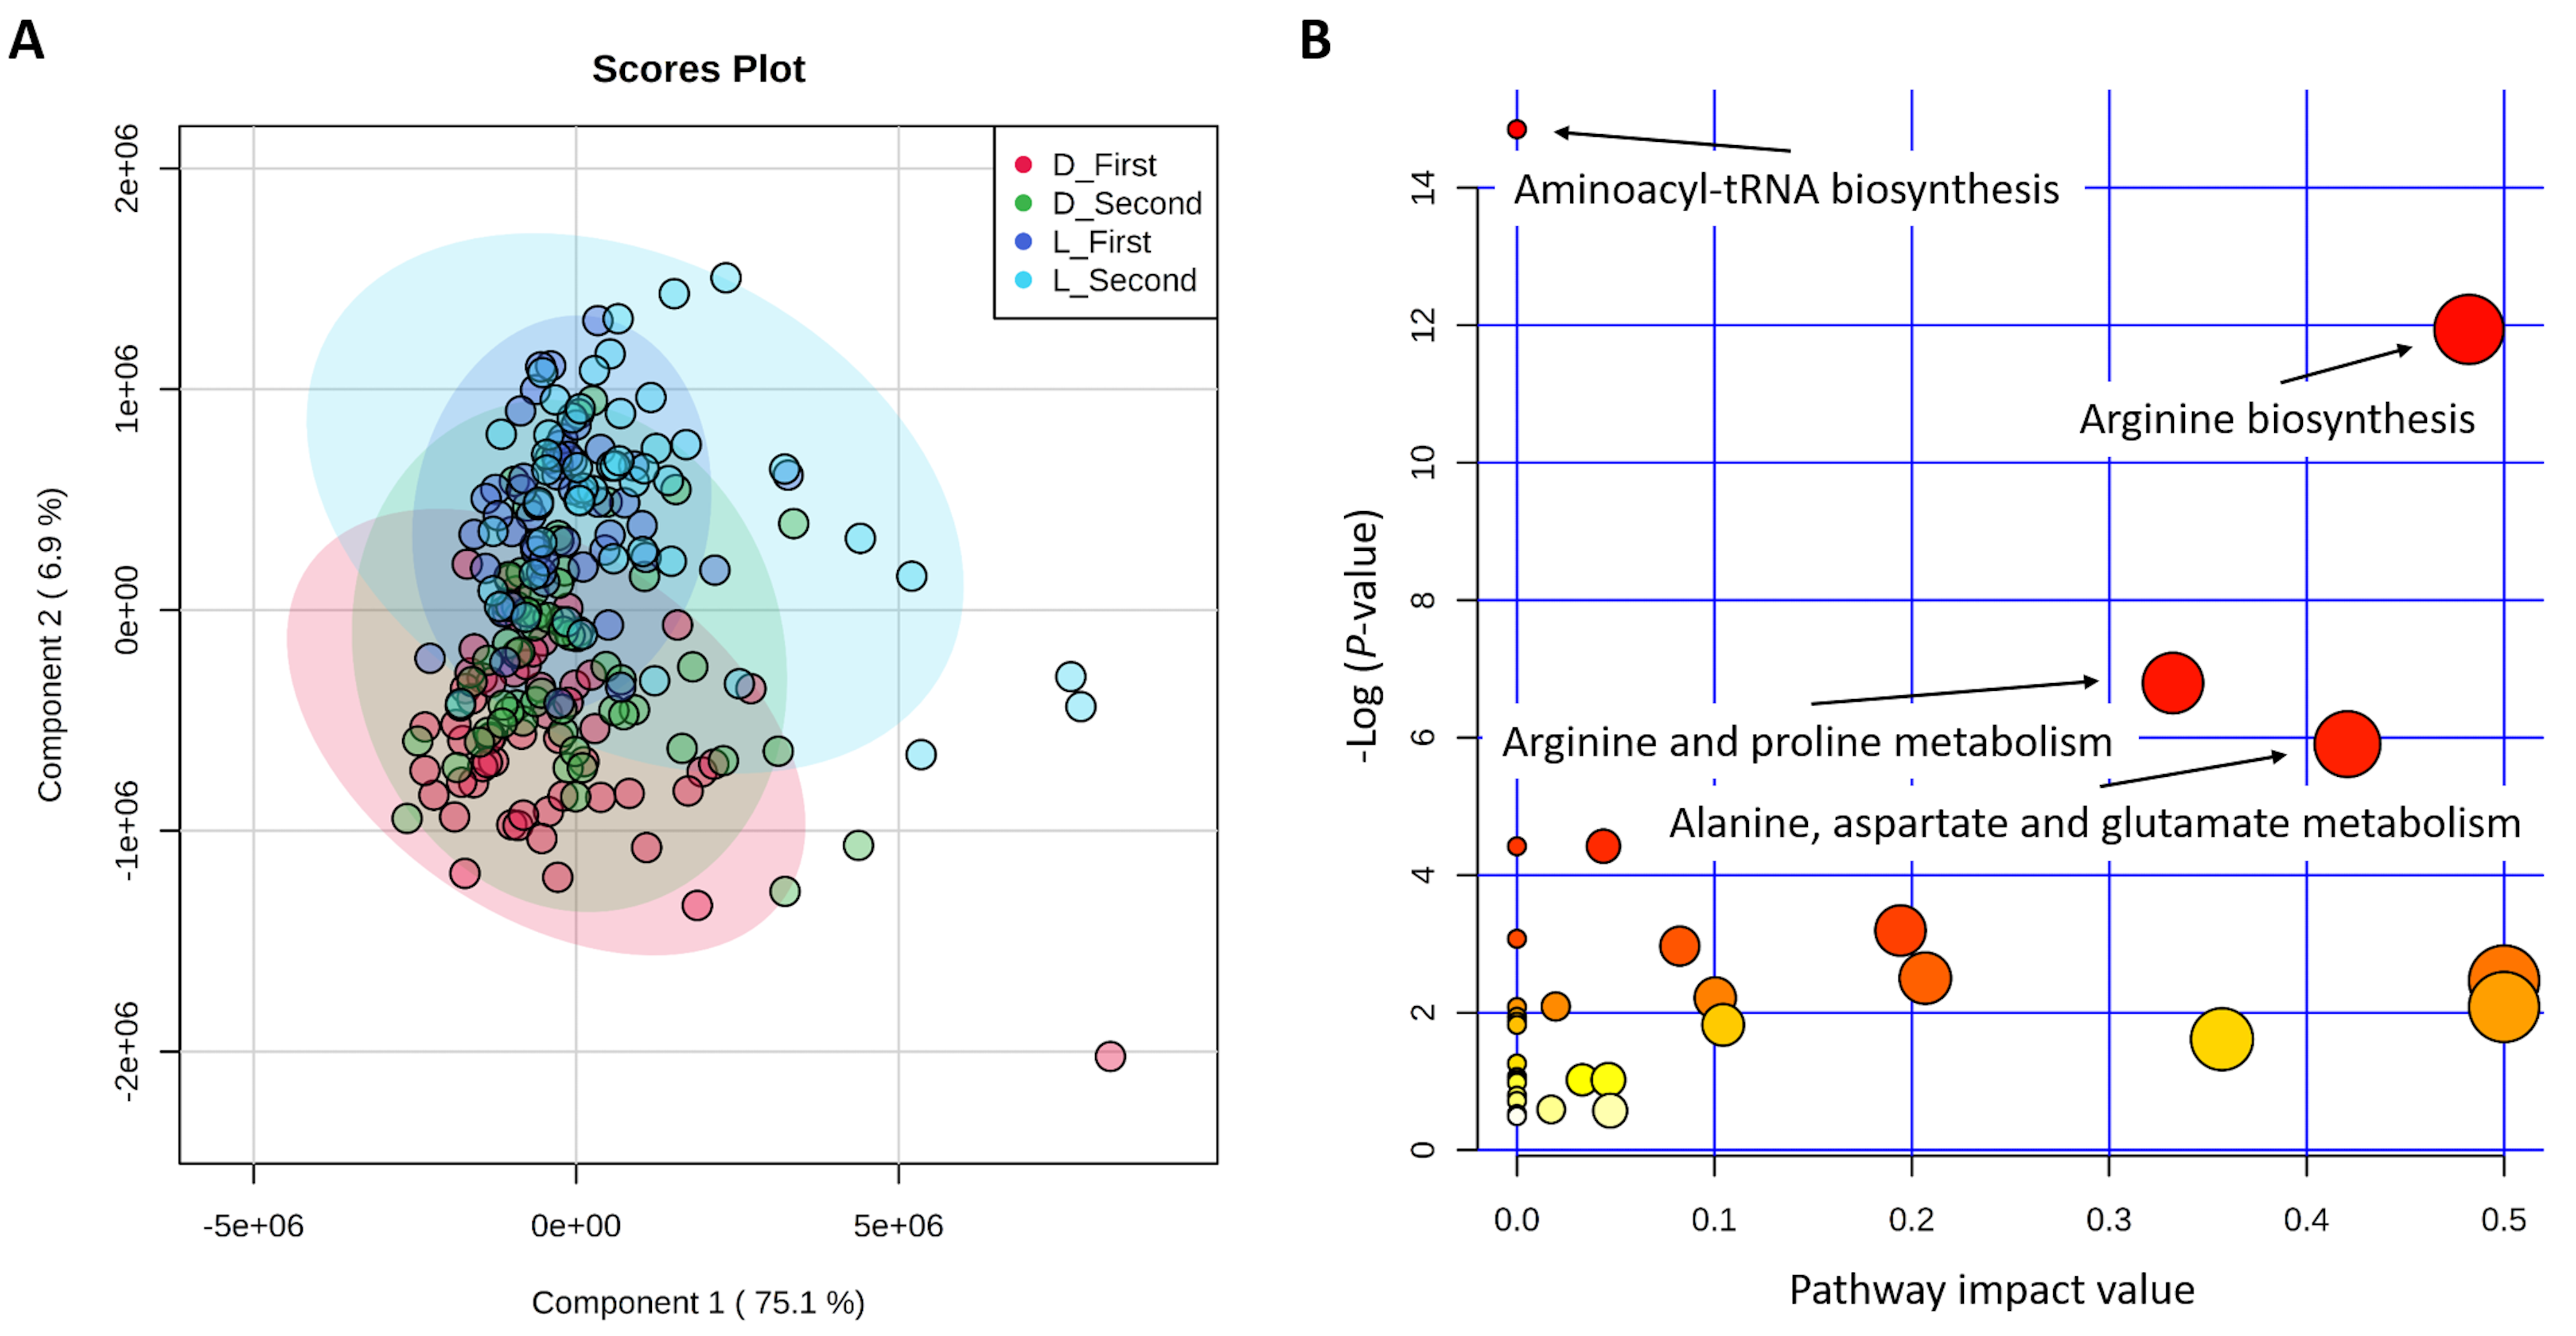
2.1. First Component Score and Significant Metabolic Pathways of 45 Metabolites

The partial least squares-discriminant analysis (PLS-DA) results revealed that the first component score (component 1) explained more than 75% variation of all 45 metabolites (Figure 1A). It showed that metabolite values of Duroc were higher than those of Landrace, the same as metabolites from second sampling time higher than those from first sampling time. In addition, the Duroc and Landrace pigs were clearly stratified, especially using the metabolite values between Duroc from first sampling time and Landrace from second sampling time (Figure 1A). The most significant metabolic pathways were the aminoacyl-tRNA biosynthesis; following by the arginine biosynthesis; the arginine and proline metabolism; and the alanine, aspartate, and glutamate metabolism (Figure 1B). As the pathway impact of the aminoacyl-tRNA biosynthesis was zero, we discarded this significant pathway and only used the metabolites enriched in the other three significant pathways for GWAS (Table 1). Thus, the metabolite means for 5 compounds in the arginine biosynthesis (arginine, aspartic acid, citrulline, glutamic acid, and ornithine); 5 compounds in the arginine and proline metabolism (arginine, glutamic acid, ornithine, proline, and pyruvic acid); and 4 compounds in the alanine, aspartate, and glutamate metabolism (alanine, aspartic acid, glutamic acid, and pyruvic acid) metabolites were calculated and shown in Table 1.

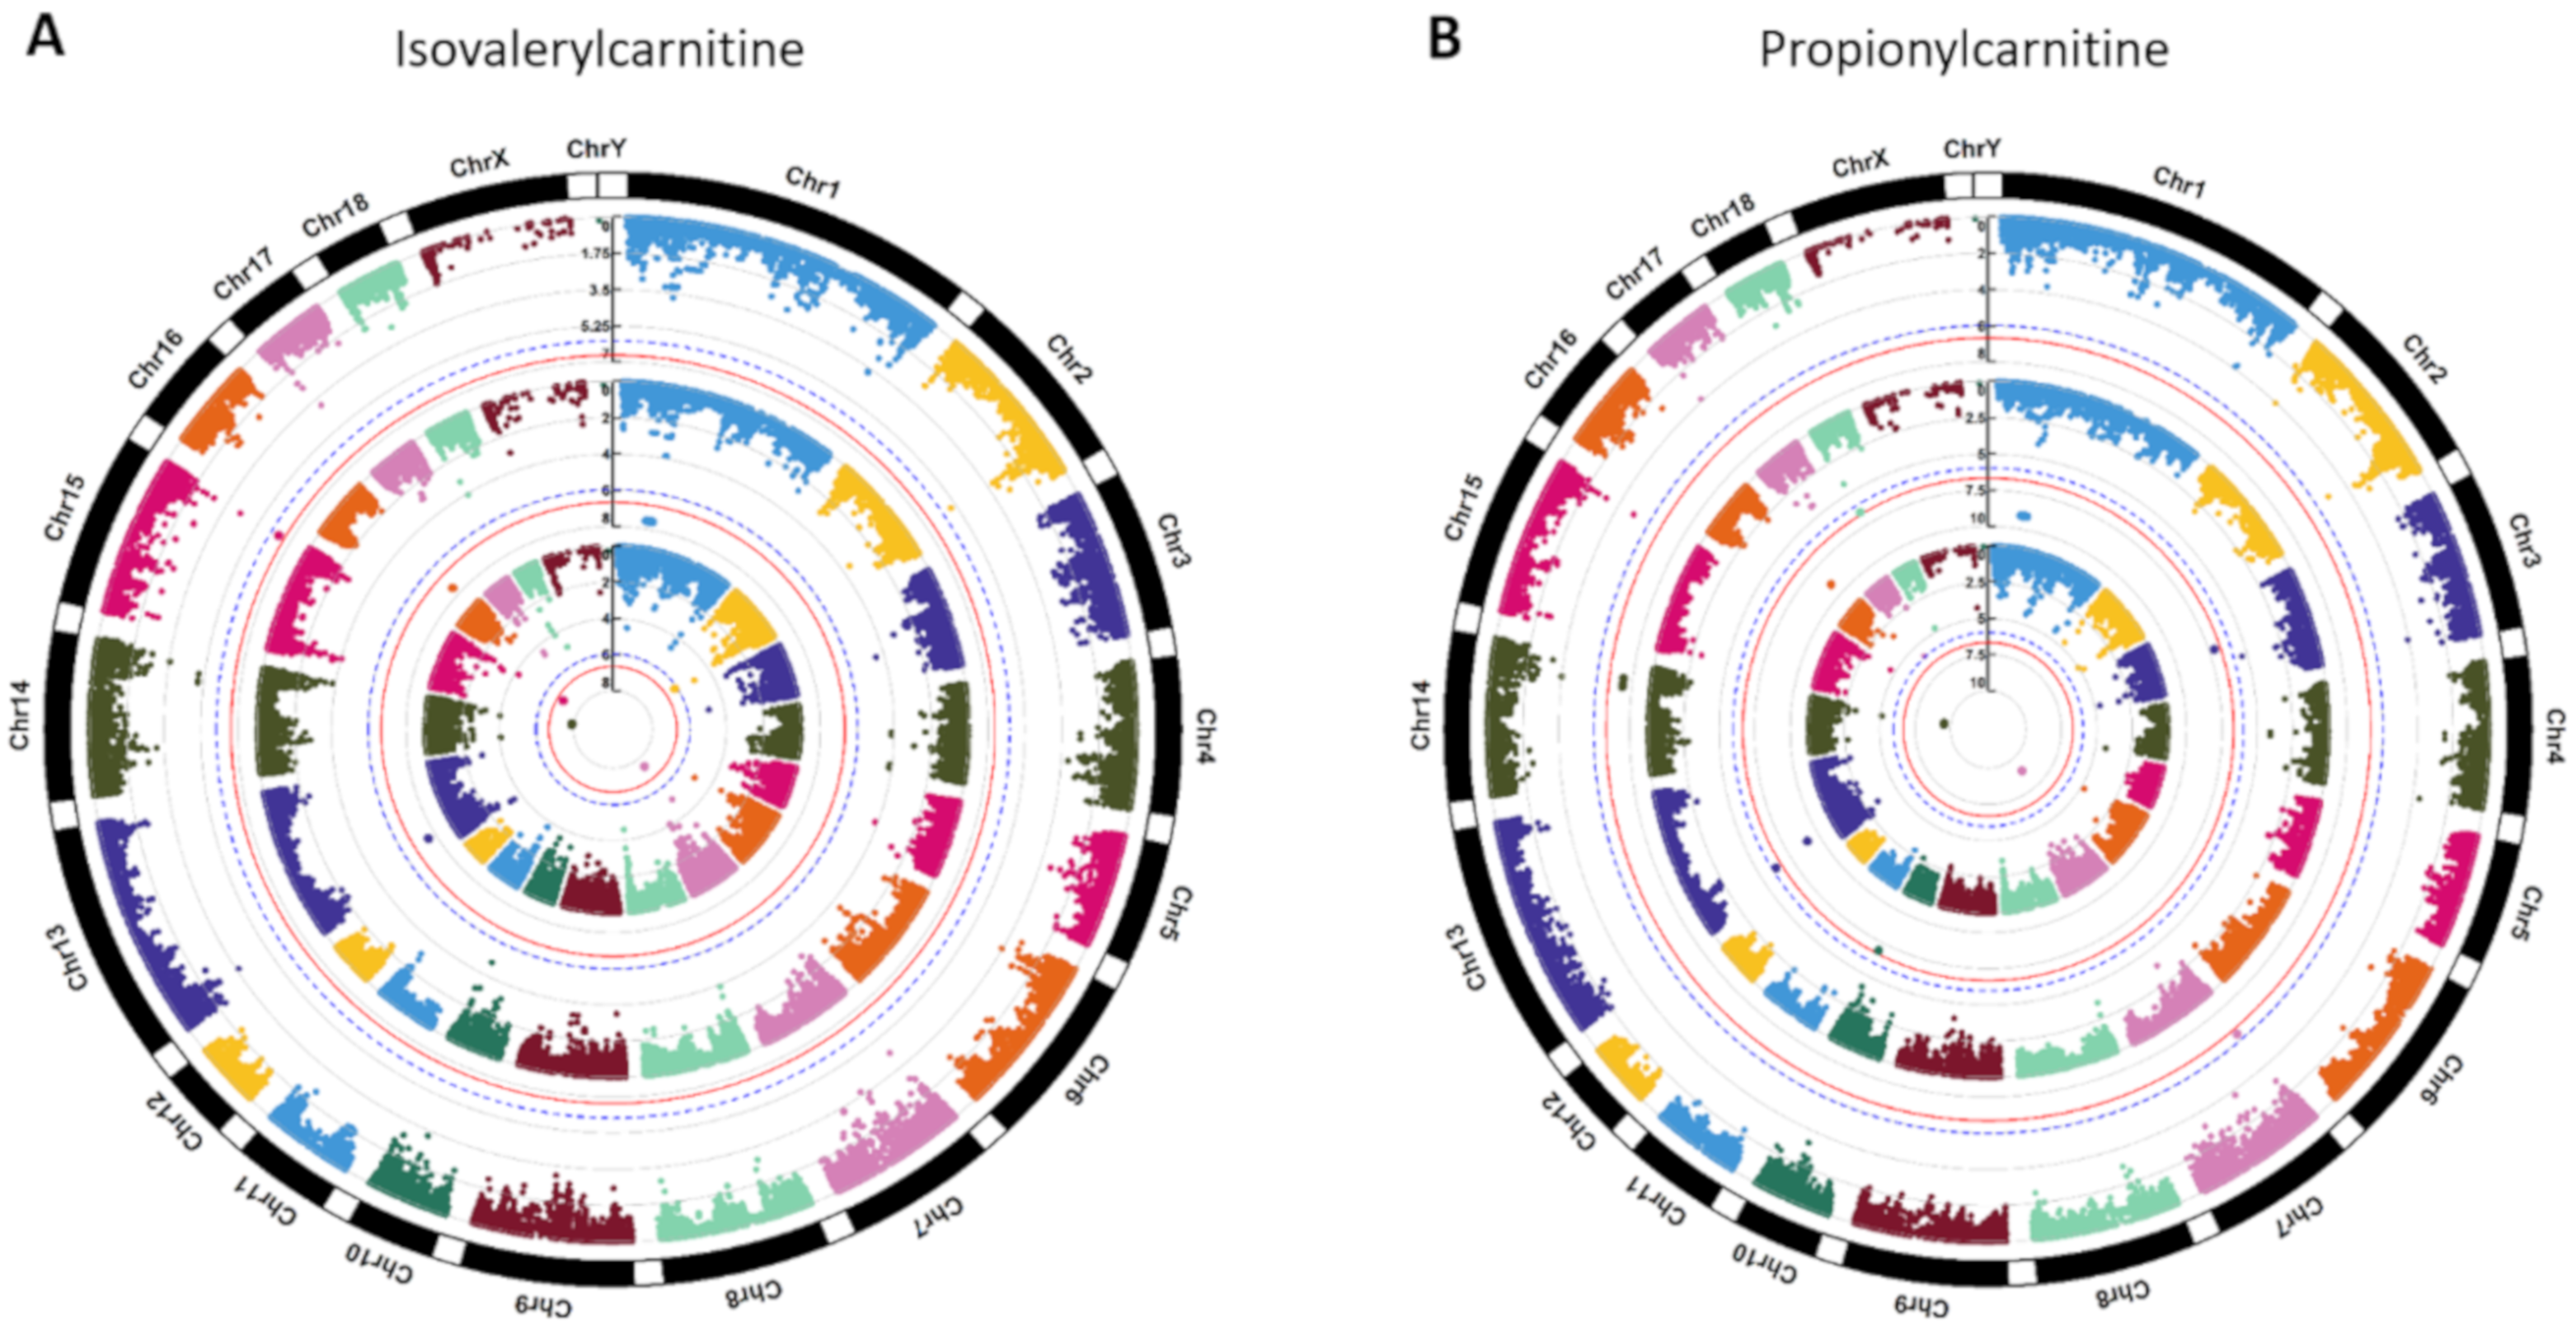
2.2. Genome-Wide Significant SNPs and Gene Annotation

Metabolite based GWAS for first, second, and combined two sampling times revealed 152 genome-wide significant SNPs (Supplementary Table S1) in association with 17 metabolites (Supplementary Table S2). Unfortunately, no significant SNP was detected in association with first component scores (p-values ≥ 2.78 × 10⁻⁶) and metabolites enriched in the significant metabolic pathways (p-values ≥ 1.74 × 10⁻⁴); thus, GWAS results of these two scenarios were not listed. Manhattan plots of genome-wide association for isovalerylcarnitine and propionylcarnitine are shown in Figure 2, and Manhattan plots for the other 43 metabolites are shown in the Supplementary Figure S1. Along the whole genome, significant SNPs associated with isovalerylcarnitine and propionylcarnitine from the second sampling time were mainly located on the chromosome one (Figure 2). The overlapped significant SNPs associated with more than two different metabolites were shown in Table 2, where 57 significant SNPs on genome level were associated with isovalerylcarnitine and propionylcarnitine from the second sampling time. In addition, another 3 metabolites (1-hexadecyl-sn-glycero-3-phosphocholine, 1-myristoyl-sn-glycero-3-phosphocholine, lysoPC (16:0)) were also significantly associated with 10 SNPs (Table 2).
After annotation of significant SNPs to the neighboring genes and gene components (Sscrofa10.2/susScr3), we found that 90 significant SNPs were within a 500-kb window of 52 neighboring genes (Supplementary Table S1) and that 6 significant SNPs were directly located in the gene components of 5 genes (Table 3). For example, if we only consider the SNPs on chromosome one, we found 29 significant SNPs were near 9 genes (Supplementary Table S1), whereas ALGA0004000, ALGA0004041, and ALGA0004042 were located in the introns of FBXL4 and CCNC (Table 3). These results show that these genes may be involved in regulating abundance of the metabolites that are significantly different between high and low RFI pigs. Between using porcine RefSeq database of Sscrofa10.2/susScr3 and Sscrofa11.1/susScr11, the results of significant SNPs annotated to the genes overlapped greatly, but SNPs had different distances to the annotated genes between two versions (Supplementary Table S1). In Table 3, we found that the annotations of ALGA0004042 and ALGA0061605 to CCNC and MTRF1 were changed from 9th intron and 5th intron to 8th intron and 9th intron, respectively, when we used the Sscrofa11.1/susScr11 database.
The linkage disequilibrium (LD) pattern for all significant SNPs is shown in the Supplementary Figure S2. From the LD results for 58 significant SNPs on chromosome one, we found that 51 significant SNPs associated with isovalerylcarnitine (p-value = 2.79 × 10⁻⁸) and propionylcarnitine (p-value = 8.32 × 10⁻¹⁰) from second sampling time were in strong LD (Figure 3). Among the 58 significant SNPs, five of them were not in LD with the other 53 significant SNPs (Supplementary Figure S2), so they were excluded in the haplotype visualization in the Figure 3. In detail, SNPs annotated to LOC780435 (NM_001078684), FHL5 (NM_001243314), FBXL4 (NM_001171752), CCNC (NM_001190160)/MCHR2 (NM_001044609), and SIM1 (NM_001172585) were in block 2, block 4, block 6, block 8, and block 9/10, respectively. Furthermore, ALGA0004000 in the 6th intron of FBXL4 was in LD of block 6, together with another five SNPs (INRA0002726, MARC0075306, ALGA0003995, ALGA0004002, and ALGA0004005) that were located in the intergenic regions of FBXL4. Especially, three SNPs in strong LD consisted of block 8 with two SNPs (ALGA0004041 and ALGA0004042) located in the second and ninth intron of CCNC (Figure 3, Table 3, and Supplementary Table S1). The number of significant SNPs in strong LDs of the other chromosomes was less than the significant SNP number on chromosome one (Supplementary Figure S2). Notably, MARC0110390 in the 7th intron region of SFXN1 (NM_001098602) on chromosome two and ALGA0061605 in the 5th intron region of MTRF1 (NM_001243580) on chromosome eleven were not in the LD with other SNPs. However, ASGA0093565 in the 8th intron region of DNAJC6 (NM_001145378) was in strong LD with WU_10.2_6_135312468 that was annotated to LEPROT (NM_001145388) (Supplementary Table S1 and Supplementary Figure S2).

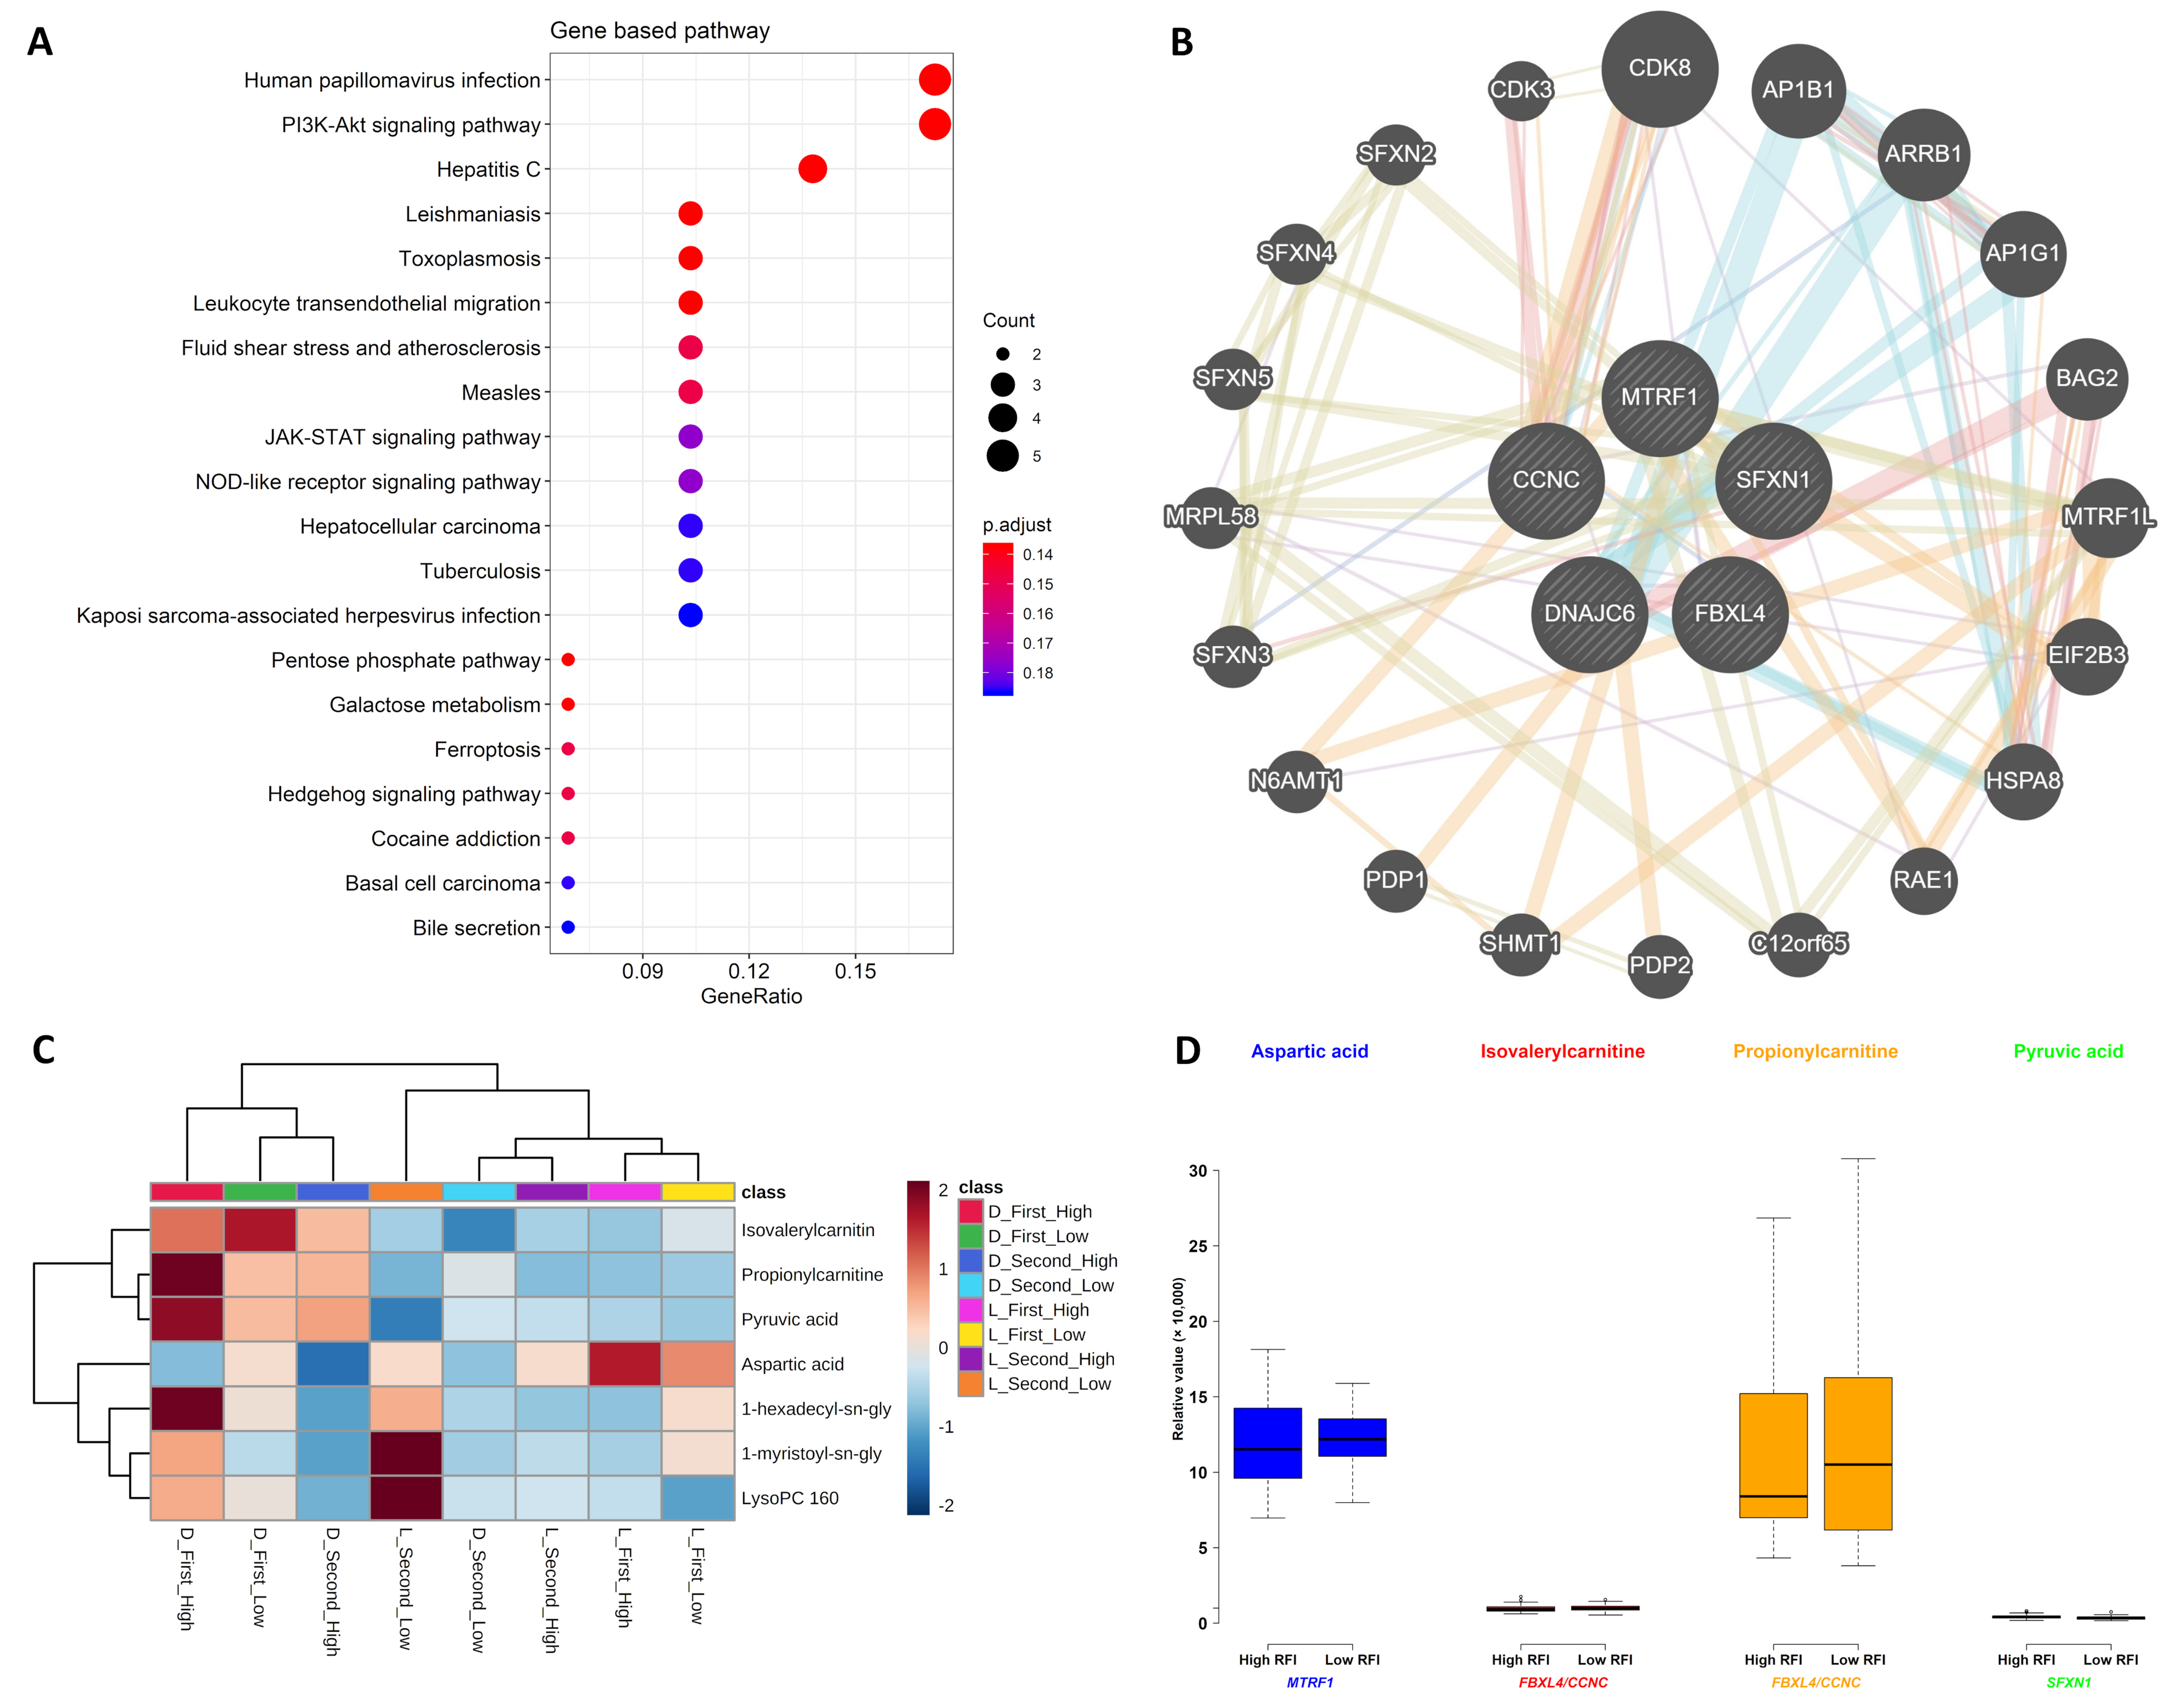
2.3. Gene and Metabolite Interaction Network

The most significantly enriched gene-based pathways were the human papillomavirus infection (ssc05165) with five genes (i.e., CCND2, CTNNB1, JAK1, LAMC1, and NFKB1), followed by the PI3K-Akt signaling pathway (ssc04151) with five genes (i.e., CCND2, F2R, JAK1, LAMC1, and NFKB1) and the hepatitis C (ssc05160) with four genes (i.e., CLDN8, CTNNB1, JAK1, and NFKB1) (Figure 4A). Based on the gene–gene interaction network analysis, CCNC was in good connection with CDK8, CDK3, and N6AMT1 whereas N6AMT1 was linked to FBXL4 (Figure 4B). Unfortunately, no gene–metabolite interaction network was found in this study. After the clustering of the SNP-related gene component-associated metabolites (Table 3), we found that aspartic acid, 1-hexadecyl-sn-glycero-3-phosphocholine, 1-myristoyl-sn-glycero-3-phosphocholine, and lysoPC(16:0) were clustered in the lower cluster while the upper cluster included the metabolites of isovalerylcarnitine, propionylcarnitine, and pyruvic acid (Figure 4C). Results show that metabolites from Duroc pigs have higher values in the upper cluster than those from lower cluster, but the metabolite values of Landrace pigs are higher in the lower cluster (Figure 4C). Afterwards, we investigated the metabolite values of aspartic acid, isovalerylcarnitine, propionylcarnitine, and pyruvic acid for which the associated significant SNPs were in the introns of MTRF1, FBXL4/CCNC, SFXN1 (Table 3). Generally, propionylcarnitine from the low RFI group had higher values while other three metabolite values in the high RFI group seemed higher, but they are not significantly different between low and high RFI groups (p-value > 0.05) (Figure 4D).

3. Discussion

3.1. Metabolites in the PLS-DA and Metabolic Pathways of Pigs

The previous study reported that different breed types performed differently in RFI variation [8], so RFI-related metabolomics could be breed specific. Therefore, different breeds tend to exhibit different metabolite abundance values, for example, in studies involving the colostrum of pigs [12,13], the milk and plasma of cattle [8,14], the yolk and albumen of chickens [15,16], the plasma of dogs [17], and the fruit metabolite content of tomatoes [18]. In pigs, the heritability and genetic correlation of production traits of Duroc, Landrace, and Yorkshire pigs vary. Duroc pigs showed lower heritability of feed efficiency but greater performance of growth traits [19,20]. The metabolomics of this study showed that metabolite values vary between two pig breeds and between the sampling times (Figure 1A and Figure 4C), as the metabolite profiles would change according to the breeds and time points [6]. Metabolites of Duroc from first sampling time and Landrace from second sampling time were apparently stratified, probably because metabolite values of these two groups and their metabolite profiles were different. However, metabolites of Duroc from second sampling time and Landrace from first sampling time were very close, probably because metabolite values of these two groups and their metabolite profiles were very similar (Figure 1A). Hence, the breed differences between Duroc and Landrace pigs were driven both by genetic and metabolic factors.
The arginine biosynthesis pathway (ssc00220), where arginine, aspartic acid, citrulline, glutamic acid, and ornithine were significantly enriched in our study (Table 1), plays a crucial role in amino acid metabolism, particularly in the synthesis of citrulline and proline in pigs [21]. By linking arginine, glutamate, and proline in a bidirectional way, the arginine and proline metabolism pathway (ssc00330) biosynthesizes arginine and proline by glutamate. It is observed that proline metabolism is associated with metastasis formation of breast cancer [22]. In dairy cattle, the alanine, aspartate, and glutamate metabolism (ssc00250) identified in the gene-based pathways of our study (Table 1) is the potential metabolic biomarker between the low and high feed efficient conditions [8].

3.2. Genome-Wide Significant SNP-Related Genes Associated with Metabolites

The previous GWAS for Duroc pigs identified two pleiotropic QTLs on chromosome one and seven for feed efficiency [20]. Do et al. (2014) [10] revealed 19 significant SNPs located on several chromosomes (e.g., one, three, seven, eight, nine, ten, fourteen, and fifteen) that were highly associated with feed efficiency in Yorkshire pigs. In addition, other studies also found significant SNPs associated with RFI on other chromosomes, for example, SNPs on chromosome five in the growing Piétrain–Large White pigs [23], on chromosome two in a crossed populations [24], on chromosome six in Large White pigs [25], etc. [26,27].
In this study, significant SNPs were mainly located on chromosome one (58/152), but the associated metabolites only mapped to 1-hexadecyl-sn-glycero-3-phosphocholine (1.7%), 1-myristoyl-sn-glycero-3-phosphocholine (1.7%), isovalerylcarnitine (47.0%), isoleucyl proline (0.9%), propionylcarnitine (47.0%), and lysoPC(16:0) (1.7%). Obviously, isovalerylcarnitine and propionylcarnitine primarily derived from amino acid catabolism were the major metabolites that associated with nine significant SNP-related genes (i.e., CCNC, FBXL4, FHL5, LOC780435, MAT2B, MCHR2, PNISR, RRAGD, and SIM1) on chromosome one (Supplementary Table S1). A previous study indicated that the amount of isovalerylcarnitine could decrease in the plasma and liver tissues but greatly increased in the muscle tissue, as a byproduct of leucine catabolism [28]. The isovalerylcarnitine compound was reported to be found in high amounts in the colostrum and milk of sows [29]. As a key role in the mitochondrial fatty acid transport and high-energy phosphate exchange, propionylcarnitine could improve cardiac dysfunction by reducing myocardial ischaemia [30].

3.3. Gene and Metabolite Interaction Network

Based on the gene interaction node N6AMT1, one gene–gene interaction was found to connect CCNC with FBXL4 (Figure 4B), in which significant SNPs were annotated to gene components and associated with isovalerylcarnitine and propionylcarnitine (Table 3). As the members of CDK8 mediator complex that can regulate β-catenin-driven transcription, CCNC encodes the cell cycle regulatory protein cyclin C and results in the protein dysfunction due to the mutations of CCNC [31,32]. CCNC is also believed to increase the quiescent cells to maintain CD34 expression after knocking down CCNC expression in human cord blood [33], while the amplification of CCNC was in a relationship with the unfavorable prognosis [34]. FBXL4 is considered to participate in oxidative phosphorylation, mitochondrial dynamics, cell migration, prostate cancer metastasis, circadian GABAergic cyclic alteration, etc. [35,36,37,38,39]. The association results in pigs found that blood and immune traits were associated with the SNPs of FBXL4 [40]. The node N6AMT1 is responsible for DNA 6mA methylation modification as the first glutamine-specific protein methyltransferase characterized in mammals; thus, glutamine could be regulated by the genes that promote porcine growth performance [41,42].

3.4. Associations Linking SNP Genotypes, Metabolites, and RFI

To investigate the direct association between SNP genotypes and RFIs, we also conducted GWAS for RFI (i.e., where the GWAS model included RFI as phenotype and SNPs as fixed effect/explanatory variable) in the mixed linear model. Unfortunately but as expected due to small sample size, the results showed that no genome-wide significant associations were found between SNPs and RFI values (p-values ≥ 2.09 × 10⁻⁴). However, the top SNP was DRGA0008061 (p-values = 2.09 × 10⁻⁴), and we found five genes (ANGPTL2, AUTS2, GRIFIN, PTRH1, and SIRT5) in which the top ten SNPs were annotated (Supplementary Table S3). In our previous studies, Banerjee et al. (2020) [11] also revealed that DRGA0008061 was one of the top significant SNPs associated with RFI after genome-wide epistatic interaction network analysis for feed efficiency using the same genotypes and pig populations as used in our current study. Meanwhile, Carmelo et al. (2020) [6] used Kolmogorov–Smirnov test to identify the significant metabolites associated with feed efficiency traits at two time points in Duroc and Landrace pigs. They found that 1-hexadecyl-sn-glycero-3-phosphocholine, 1-myristoyl-sn-glycero-3-phosphocholine, isovalerylcarnitine, lysoPC(16:0), and phosphocholine were significantly (p-value < 0.05) associated with RFI and other feed efficiency traits [6]. By matching the results from Carmelo et al. (2020) [6] with our results, we found that these five metabolites were also our main significant SNP-associated findings in GWAS (Table 3). Therefore, the triangular association of genotypes (SNP), metabolomics (metabolite), and feed efficiency (RFI) is established via our mGWAS (SNPs affecting metabolites) and GWAS (SNPs affecting RFI) and is linked with the previous studies [6,11].

4. Materials and Methods

4.1. Animals, Metabolites, and Genotypes

A total of 108 pigs were involved in this study including 59 Duroc and 49 Landrace pigs that were part of our own previous published studies [6,11]. The detailed description of the animal experiment and phenotype, metabolite, and genotypes data collection are available from our previously published studies, and all data used in this study were derived from our datasets that were already made public. Metabolite data [6] were accessed using MetaboLights accession ID MTBLS1384 with a link: https://www.ebi.ac.uk/metabolights/MTBLS1384. Genotype data [11] were accessed from National Center for Biotechnology Information (NCBI) GEO accession number: GSE144064 with the following link: https://www.ncbi.nlm.nih.gov/geo/query/acc.cgi?acc=GSE144064. The genotype data was sequenced using GeneSeek-Neogen PorcineSNP80 BeadChip containing 68,528 loci based on the version Sscrofa10.2/susScr3 [11].
As in Carmelo et al. (2020) [6], all the pigs were purebred uncastrated males derived from sixteen-sire families in four generations and fed on the same diets. They had RFI values calculated for each pig as the difference between the observed daily feed intake (DFI) and the predicted daily feed intake (pDFI) [6] following the method of Nguyen et al. (2001) [43]. Nguyen et al. (2001) [43] firstly corrected the DFI for batch and sex and their interaction effects (i.e., fixed effects) and then estimated the pDFI from different regression models including growth rate and back fat after adjustments for above fixed effects; hence, Carmelo et al. (2020) [6] could compute RFIs in the same way by correcting fixed effects in their study. Finally, our study directly used RFIs together with other phenotypes by accessing the public dataset with a link: https://www.ebi.ac.uk/metabolights/MTBLS1384. The range of actual RFI values of Duroc were from −10 to 14, while Landrace’s RFI value range was from −14 to 17 (Figure 5). The previous study conducted the metabolite–trait association analysis for RFI, so it was suggested that fatness or other factors should be adjusted in the calculation of RFI to achieve more accurate association results in their study [6]. As similar means of RFI for Duroc and Landrace pigs were observed in Figure 5 of our study, we assumed that fatness was adjusted in the calculation of RFI, but we cannot determine it. In this study, we selectively chose the extreme left and extreme right tails of distribution of feed efficiency (i.e., actual RFI values) distribution of all the pigs (n = 108) with one standard deviation (SD) from the mean [11,44] of actual RFI values. Then, they were defined as high RFI pigs (RFI ≤ −5.23, n = 11) and low RFI pigs (RFI ≥ 5.23, n = 16), respectively (Figure 5). The overview of the analysis workflow is shown in Figure 6 and included five scenarios of phenotypes in the GWAS analysis based on different transformations of metabolites. The five types of phenotypes were (1) the metabolites from first sampling time, (2) the metabolites from second sampling time, (3) the metabolites from combined two sampling times (i.e., metabolite values from first and second sampling times were combined as an integrated dataset, where each pig had two metabolic values for one metabolite, but genotypes were same for the metabolite values between first and the second sampling times from the same pig), (4) the first component score (component 1) from partial least squares-discriminant analysis (PLS-DA), and (5) the metabolites enriched in the significant metabolic pathways (Figure 6).
Metabolite data was downloaded by accessing MetaboLights accession ID MTBLS1384 with a link, https://www.ebi.ac.uk/metabolights/MTBLS1384, and were collected in two sampling times (i.e., the first sampling time was at the age when pig weighted approximately 28 kg, and the second sampling time was 45 days after the first sampling time) for each pig by the previous study [6]. Finally, 45 metabolites were used in this study (Figure 7) including 16 annotated metabolites (i.e., 1-hexadecyl-sn-glycero-3-phosphocholine, 1-myristoyl-sn-glycero-3-phosphocholine, (3-Carboxypropyl)trimethylammonium, 5-methyl-5,6-dihydrouracils, acetaminophen, acetylcarnitine, benzoic acid, cotinine, creatinine, indoleacrylic acid, isoleucyl proline, isovalerylcarnitine, leucyl methionine, lysoPC(16:0), manNAc, and propionylcarnitine) and 29 identified metabolites (i.e., 4-aminobenzoic acid, alanine, arginine, aspartic acid, carnitine, citrulline, cytidine, disaccharide, glutamic acid, guanine, guanosine, hypoxanthine, inosine, isoleucine, lactic acid, methionine, monosaccharide, nicotine amide, ornithine, phenylalanine, proline, pyruvic acid, riboflavine, sorbitol, thiamine, threonine, thymidine, uridine, and xanthine).
The genotype data was downloaded from NCBI GEO database with accession number: GSE144064 with a link, https://www.ncbi.nlm.nih.gov/geo/query/acc.cgi?acc=GSE144064, that was issued by the previous study [11]. After removing the markers with duplicated SNP positions (i.e., coordinates) (n = 274), unannotated SNP positions (n = 2618), and no genotypes (n = 3903) from GeneSeek-Neogen PorcineSNP80 BeadChip (68,516 SNP markers here), 61,721 SNP markers remained. Afterwards, we performed the imputation for missing markers using pedigree (i.e., all the pigs were derived from sixteen-sire families in four generations) by FImpute software (version 3) [45], as the closer relatives usually share longer haplotypes; therefore, pedigree information could contribute towards the FImpute software, achieving more accurate imputation [45,46]. Quality control (QC) for the imputed genotypes was conducted based on the criteria of Hardy–Weinberg equilibrium (HWE > 10−7) and minor allele frequency (MAF ≥ 0.001) by PLINK software (version 1.9) [47].
In this study, we also combined the metabolite values from the first sampling time and the second sampling time as an integrated dataset, so each pig had two values in one metabolite. However, the genotypes for two metabolite values were the same if one metabolite value was from the first sampling time of one pig while the other metabolite value was from the second sampling time of the same pig. In other words, each pig had two different metabolite values but the same genotypes; thus, QC results of the integrated dataset (n = 206) were different from the unintegrated dataset (n = 108), especially for HWE but not for MAF. Finally, the genotypes for the first sampling time and the second sampling time retained 47,109 SNP markers after removing unqualified 9337 (HWE ≤ 10−7) and 5275 (MAF < 0.001) markers, while the genotypes for the combined two sampling times retained 42,393 SNP markers after removing unqualified 14,053 (HWE ≤ 10−7) and 5275 (MAF < 0.001) markers.

4.2. Partial Least Squares-Discriminant Analysis and Metabolic Pathway Enrichment for 45 Metabolites

The partial least squares-discriminant analysis (PLS-DA) and metabolic pathway analysis for the 45 metabolites were performed by MetaboAnalyst software (version 4.0) [48] using Homo sapiens as the library. Fishers’ exact test and relative betweenness centrality were used for the overrepresented analysis and the pathway impact value calculation (i.e., sum of importance measures of the matched metabolites divided by the sum of the importance measures of all the metabolites), respectively [49]. The first component scores (component 1) and metabolites enriched in the significant metabolic pathways after false discovery rate (FDR) correction of multiple hypothesis testing (FDR < 0.1) were selected as phenotypes of the transformed metabolites for GWAS. The mean calculated for the metabolites enriched in each significant metabolic pathway was considered as transformed metabolite values; thus, each pathway had one transformed metabolite value (i.e., the mean).

4.3. Mixed Linear Model Based Association Analysis

In this study, we considered other environmental factors (e.g., age) the same among all the pigs, so we only used breed and RFI as the fixed effects to directly link metabolites with genotypes. GWAS for 45 single metabolites and transformed metabolites (i.e., component 1 and enriched metabolites) was conducted by mixed linear model based association analysis in GCTA software (version 1.93.0) [50]. The mixed linear model is as follows:
y   = X b + g + e ,
where y is the vector of phenotypes (i.e., metabolites from the first, second, and combined two sampling times and the transformed metabolites); b is the vector of fixed effects including intercept, breed effects (i.e., Duroc and Landrace pigs), RFI effects (i.e., actual RFI values included as covariates), and SNP effects (i.e., candidate SNPs included as covariates) to be tested; X is the design matrix for fixed effects that includes SNP genotype indicators (i.e., 0, 1, or 2); g is the vector of polygenic effects as random effects that are the accumulated effects of all SNPs; and e is the vector of residual effects. The polygenic and residual variances are V a r g = G σ g 2 and V a r e = I σ e 2 , where G and I are the genetic relationship matrix (GRM) calculated using all SNPs and identity matrix, respectively.

4.4. Significant SNPs and Their Annotated Genes

The significant SNPs for GWAS were defined when the p-values were less than the threshold after Bonferroni correction for multiple hypothesis testing on genome level. The threshold for metabolites from the first and second sampling times was 1.06 × 10⁻⁶ (i.e., 0.05/47109), while the threshold for combined two sampling times was 1.18 × 10⁻⁶ (i.e., 0.05/42393). Then, the significant SNPs were annotated to the genes and gene components (i.e., promoters, exons, and introns) of porcine RefSeq database (Sscrofa10.2/susScr3) downloaded from University of California Santa Cruz (UCSC) genome browser (https://genome.ucsc.edu/cgi-bin/hgTables), where a window of 500 kb was used for the annotation of intergenic regions to neighboring genes. In addition, we used the reference SNP (rsfSNP) ID (i.e., specific rs number) of significant SNPs to annotate them to the genes and gene components of latest porcine RefSeq database (Sscrofa11.1/susScr11).
Linkage disequilibrium (LD) analysis to display the potential haplotypes for the significant SNPs was performed using Haploview software (version 4.2) [51]. SNPs with a distance larger than 500 kb were ignored in the pairwise comparisons for LD analysis.

4.5. Gene-Based Pathway Enrichment Analysis and Gene–Metabolite Interaction Network

We used R package KEGG.db (version 3.2.3) of Sus scrofa species to annotate SNP-related genes in the gene-based pathway enrichments. Based on the adjusted p-values (p.adjust) < 0.2 under FDR control, the gene-based pathways were finally realized by R package clusterprofiler (version 3.12.0) [52]. The gene–gene interaction networks were created by GeneMANIA server [53,54] with default settings using Homo sapiens as the library. Then, the gene–metabolite networks for interactions between SNP-related genes and phenotype-related metabolites were created by MetaboAnalyst tool [55] with default settings using the same library of Homo sapiens. Significant SNP-associated metabolites based on the low-high RFI pigs were hierarchically clustered by Ward’s method in Euclidean distance [56]. Then, a heat map for averaged metabolite clustering was visualized by MetaboAnalyst tool [48].

5. Conclusions

We utilized metabolic and genomic datasets from a total of 108 pigs that were made available for this study from our own previously published studies [6,11] in publicly available data repositories. These studies involved 59 Duroc and 49 Landrace pigs and consisted of data on feed efficiency (RFI), genotype (PorcineSNP80 BeadChip) data, and metabolomic data (45 final metabolite datasets derived from LC-MS system). Utilizing these datasets, our main aim was to identify genetic variants (SNPs) that affect 45 different metabolite concentrations in plasma collected at the start and end of the performance testing of pigs categorized as high or low in their feed efficiency, as measured by RFI values. Genome-wide significant genetic variants could be then used as potential genetic or biomarkers in breeding programs for feed efficiency. In order to achieve this main objective, we performed GWAS in the mixed linear model-based association analysis and found 152 genome-wide significant snps (p-value < 1.06 × 10⁻⁶) in association with 17 metabolites that included 90 significant SNPs annotated to 52 genes. On chromosome one alone, we found SNPs in strong LD that could be annotated to FBXL4 and CCNC; it consisted of two haplotype blocks, where three SNPs (ALGA0004000, ALGA0004041, and ALGA0004042) were in the intron regions of FBXL4 and CCNC. The interaction network analyses revealed that CCNC and FBXL4 were linked to each other by N6AMT1 gene and were associated with compounds isovalerylcarnitine and propionylcarnitine. The identified genetic variants and genes affecting important metabolites in high versus low feed efficient pigs could be considered as potential genetic or biomarkers, but we recommend that these results are validated in much higher sample size.

Supplementary Materials

The following are available online at https://www.mdpi.com/2218-1989/10/5/201/s1, Supplementary Table S1. All the significant SNPs of genome-wide association with chromosome, position, and p-value information for metabolites from first, second, and combined two sampling times. Supplementary Table S2. All the metabolites in association with significant SNPs from first, second, and combined two sampling times. Supplementary Table S3. Top ten SNPs associated with residual feed intake (RFI). Supplementary Figure S1. Manhattan plots of genome-wide association for 43 metabolites. Supplementary Figure S2. Linkage disequilibrium (LD) pattern for all significant SNPs.

Author Contributions

H.N.K. was a grant holder and lead PI for the FeedOMICS project who conceived and designed the experiments and made the related datasets available in public repositories. X.W. analyzed the data under the supervision of H.N.K., X.W. and H.N.K. wrote the first draft of this paper, which was improved by H.N.K. All authors have read and agree to the published version of the manuscript.

Funding

Xiao Wang was funded by the FeedOMICS research project, headed by Haja Kadarmideen at DTU Denmark. FeedOMICS project was funded by the Independent Research Fund Denmark (DFF)—Technology and Production (FTP) grant (grant number: 4184-00268B).

Acknowledgments

Authors thank open access platforms MetaboLights and NCBI-GEO from which we downloaded the datasets for research reported in this study and cited under the section “availability of data and materials”. The authors thank Claus Thorn Ekstrøm from Faculty of Health and Medical Sciences, University of Copenhagen for his advice on statistical modelling.

Conflicts of Interest

The authors declare that there are no conflict of interest.

Availability of Data and Materials

All datasets used in this paper are from public repositories. Metabolite data were accessed using MetaboLights accession ID MTBLS1384 with a link: https://www.ebi.ac.uk/metabolights/MTBLS1384. Genotype data were accessed from NCBI GEO accession number GSE144064 with the following link: https://www.ncbi.nlm.nih.gov/geo/query/acc.cgi?acc=GSE144064). The details of these datasets can be found in Carmelo et al. (2020) [6] and Banerjee et al. (2020) [11].

Abbreviations

Component 1First component score
DFIDaily feed intake
FCFold change
FDRFalse discovery rate
LC-MSLiquid chromatography-mass spectrometry
GRMGenetic relationship matrix
GWASGenome-wide association study
HWEHardy–Weinberg equilibrium
LDLinkage disequilibrium
LODLimit of detection
LLORLogarithm of likelihood odd ratio
MAFMinor allele frequency
mGWASMetabolite GWAS
NCBINational Center for Biotechnology Information
pDFIPredicted daily feed intake
PLS-DAPartial least squares-discriminant analysis
QCQuality control
QTLQuantitative trait locus
RFIResidual feed intake
SNPSingle nucleotide polymorphism
UCSCUniversity of California Santa Cruz

References

  1. Wellcome Trust Case Control Consortium. Genome-wide association study of 14,000 cases of seven common diseases and 3,000 shared controls. Nature 2007, 447, 661–678. [Google Scholar] [CrossRef] [PubMed] [Green Version]
  2. Suravajhala, P.; Kogelman, L.J.; Kadarmideen, H.N. Multi-omic data integration and analysis using systems genomics approaches: Methods and applications in animal production, health and welfare. Genet. Sel. Evol. 2016, 48, 38. [Google Scholar] [CrossRef] [PubMed] [Green Version]
  3. Beebe, K.; Kennedy, A.D. Sharpening Precision Medicine by a Thorough Interrogation of Metabolic Individuality. Comput. Struct. Biotechnol. J. 2016, 14, 97–105. [Google Scholar] [CrossRef] [PubMed] [Green Version]
  4. Fiehn, O. Metabolomics—The link between genotypes and phenotypes. Plant Mol. Boil. 2002, 48, 155–171. [Google Scholar] [CrossRef]
  5. Liu, H.; Chen, Y.; Ming, D.; Wang, J.; Li, Z.; Ma, X.; Wang, J.; Van Milgen, J.; Wang, F. Integrative analysis of indirect calorimetry and metabolomics profiling reveals alterations in energy metabolism between fed and fasted pigs. J. Anim. Sci. Biotechnol. 2018, 9, 41. [Google Scholar] [CrossRef]
  6. Carmelo, V.A.O.; Banerjee, P.; Diniz, W.J.D.S.; Kadarmideen, H.N. Metabolomic networks and pathways associated with feed efficiency and related-traits in Duroc and Landrace pigs. Sci. Rep. 2020, 10, 1–14. [Google Scholar] [CrossRef] [Green Version]
  7. Kenéz, Á.; Dänicke, S.; Rolle-Kampczyk, U.; Von Bergen, M.; Huber, K. A metabolomics approach to characterize phenotypes of metabolic transition from late pregnancy to early lactation in dairy cows. Metabolomics 2016, 12. [Google Scholar] [CrossRef]
  8. Wang, X.; Kadarmideen, H.N. Metabolomics Analyses in High-Low Feed Efficient Dairy Cows Reveal Novel Biochemical Mechanisms and Predictive Biomarkers. Metabolites 2019, 9, 151. [Google Scholar] [CrossRef] [Green Version]
  9. Gieger, C.; Geistlinger, L.; Altmaier, E.; De Angelis, M.H.; Kronenberg, F.; Meitinger, T.; Mewes, H.-W.; Wichmann, H.-E.; Weinberger, K.M.; Adamski, J.; et al. Genetics Meets Metabolomics: A Genome-Wide Association Study of Metabolite Profiles in Human Serum. PLoS Genet. 2008, 4, e1000282. [Google Scholar] [CrossRef] [Green Version]
  10. Do, D.N.; Strathe, A.B.; Ostersen, T.; Pant, S.; Kadarmideen, H.N. Genome-wide association and pathway analysis of feed efficiency in pigs reveal candidate genes and pathways for residual feed intake. Front. Genet. 2014, 5. [Google Scholar] [CrossRef] [Green Version]
  11. Banerjee, P.; Adriano, V.; Carmelo, O.; Kadarmideen, H.N. Genome-Wide Epistatic Interaction Networks Affecting Feed Efficiency in Duroc and Landrace Pigs. Front Genet. 2020, 11, 121. [Google Scholar] [CrossRef] [PubMed]
  12. Helke, K.L.; Nelson, K.N.; Sargeant, A.M.; Jacob, B.; McKeag, S.; Haruna, J.; Vemireddi, V.; Greeley, M.; Brocksmith, D.; Navratil, N.; et al. Pigs in Toxicology: Breed Differences in Metabolism and Background Findings. Toxicol. Pathol. 2016, 44, 575–590. [Google Scholar] [CrossRef] [PubMed] [Green Version]
  13. Picone, G.; Zappaterra, M.; Luise, D.; Trimigno, A.; Capozzi, F.; Motta, V.; Davoli, R.; Costa, L.N.; Bosi, P.; Trevisi, P. Metabolomics characterization of colostrum in three sow breeds and its influences on piglets’ survival and litter growth rates. J. Anim. Sci. Biotechnol. 2018, 9, 23. [Google Scholar] [CrossRef] [PubMed] [Green Version]
  14. Sundekilde, U.; Frederiksen, P.D.; Clausen, M.R.; Larsen, L.B.; Bertram, H. Relationship between the Metabolite Profile and Technological Properties of Bovine Milk from Two Dairy Breeds Elucidated by NMR-Based Metabolomics. J. Agric. Food Chem. 2011, 59, 7360–7367. [Google Scholar] [CrossRef]
  15. Goto, T.; Mori, H.; Shiota, S.; Tomonaga, S. Metabolomics Approach Reveals the Effects of Breed and Feed on the Composition of Chicken Eggs. Metabolites 2019, 9, 224. [Google Scholar] [CrossRef] [Green Version]
  16. Yin, J.D.; Shang, X.G.; Li, D.F.; Wang, F.L.; Guan, Y.F.; Wang, Z.Y. Effects of Dietary Conjugated Linoleic Acid on the Fatty Acid Profile and Cholesterol Content of Egg Yolks from Different Breeds of Layers. Poult. Sci. 2008, 87, 284–290. [Google Scholar] [CrossRef]
  17. Middleton, R.P.; Lacroix, S.; Scott-Boyer, M.-P.; Dordevic, N.; Kennedy, A.D.; Slusky, A.; Carayol, J.; Petzinger-Germain, C.; Beloshapka, A.; Kaput, J. Metabolic Differences between Dogs of Different Body Sizes. J. Nutr. Metab. 2017, 2017, 1–11. [Google Scholar] [CrossRef] [Green Version]
  18. Zhu, G.; Wang, S.; Huang, Z.; Zhang, S.; Liao, Q.; Zhang, C.-Z.; Lin, T.; Qin, M.; Peng, M.; Yang, C.; et al. Rewiring of the Fruit Metabolome in Tomato Breeding. Cell 2018, 172, 249–261.e12. [Google Scholar] [CrossRef] [Green Version]
  19. Do, D.N.; Strathe, A.B.; Jensen, J.; Mark, T.; Kadarmideen, H.N. Genetic parameters for different measures of feed efficiency and related traits in boars of three pig breeds. J. Anim. Sci. 2013, 91, 4069–4079. [Google Scholar] [CrossRef]
  20. Ding, R.; Yang, M.; Wang, X.; Quan, J.; Zhuang, Z.; Zhou, S.; Li, S.; Xu, Z.; Zheng, E.; Cai, G.; et al. Genetic Architecture of Feeding Behavior and Feed Efficiency in a Duroc Pig Population. Front. Genet. 2018, 9, 220. [Google Scholar] [CrossRef]
  21. Dekaney, C.M.; Wu, G.; Jaeger, L.A. Gene expression and activity of enzymes in the arginine biosynthetic pathway in porcine fetal small intestine. Pediatr. Res. 2003, 53, 274–280. [Google Scholar] [CrossRef] [PubMed]
  22. Elia, I.; Broekaert, D.; Christen, S.; Boon, R.; Radaelli, E.; Orth, M.F.; Verfaillie, C.M.; Grunewald, T.G.P.; Fendt, S.-M. Proline metabolism supports metastasis formation and could be inhibited to selectively target metastasizing cancer cells. Nat. Commun. 2017, 8, 15267. [Google Scholar] [CrossRef] [PubMed]
  23. Gilbert, H.; Riquet, J.; Gruand, J.; Billon, Y.; Fève, K.; Sellier, P.; Noblet, J.; Bidanel, J.-P. Detecting QTL for feed intake traits and other performance traits in growing pigs in a Piétrain–Large White backcross. Animal 2010, 4, 1308–1318. [Google Scholar] [CrossRef] [Green Version]
  24. Shirali, M.; Duthie, C.-A.; Doeschl-Wilson, A.; Knap, P.W.; Kanis, E.; Van Arendonk, J.; Roehe, R. Novel insight into the genomic architecture of feed and nitrogen efficiency measured by residual energy intake and nitrogen excretion in growing pigs. BMC Genet. 2013, 14, 121. [Google Scholar] [CrossRef] [PubMed] [Green Version]
  25. Sanchez, M.P.; Tribout, T.; Iannuccelli, N.; Bouffaud, M.; Servin, B.; Tenghe, A.; Déhais, P.; Muller, N.; Del Schneider, M.P.; Mercat, M.-J.; et al. A genome-wide association study of production traits in a commercial population of Large White pigs: Evidence of haplotypes affecting meat quality. Genet. Sel. Evol. 2014, 46, 12. [Google Scholar] [CrossRef] [Green Version]
  26. Onteru, S.K.; Gorbach, D.M.; Young, J.M.; Garrick, D.J.; Dekkers, J.C.M.; Rothschild, M.F. Whole Genome Association Studies of Residual Feed Intake and Related Traits in the Pig. PLoS ONE 2013, 8, e61756. [Google Scholar] [CrossRef] [Green Version]
  27. Do, D.N.; Ostersen, T.; Strathe, A.B.; Mark, T.; Jensen, J.; Kadarmideen, H.N. Genome-wide association and systems genetic analyses of residual feed intake, daily feed consumption, backfat and weight gain in pigs. BMC Genet. 2014, 15, 27. [Google Scholar] [CrossRef] [Green Version]
  28. Makowski, L.; Noland, R.C.; Koves, T.R.; Xing, W.; Ilkayeva, O.R.; Muehlbauer, M.J.; Stevens, R.D.; Muoio, D.M. Metabolic profiling of PPARα-/- mice reveals defects in carnitine and amino acid homeostasis that are partially reversed by oral carnitine supplementation. FASEB J. 2009, 23, 586–604. [Google Scholar] [CrossRef] [Green Version]
  29. Kerner, J.; Froseth, J.A.; Miller, E.R.; Bieber, L.L. A study of the acylcarnitine content of sows’ colostrum, milk and newborn piglet tissues: Demonstration of high amounts of isovaleryl-carnitine in colostrum and milk. J. Nutr. 1984, 114, 854–861. [Google Scholar] [CrossRef]
  30. Bartels, G.L.; Holwerda, K.J.; Kruijssen, D.A.C.M.; Remme, W.J. Anti-ischaemic efficacy of L-propionylcarnitine—A promising novel metabolic approach to ischaemia? Eur. Heart J. 1996, 17, 414–420. [Google Scholar] [CrossRef]
  31. Lew, D.J.; Dulić, V.; Reed, S.I. Isolation of three novel human cyclins by rescue of G1 cyclin (cln) function in yeast. Cell 1991, 66, 1197–1206. [Google Scholar] [CrossRef]
  32. Arai, E.; Sakamoto, H.; Ichikawa, H.; Totsuka, H.; Chiku, S.; Gotoh, M.; Mori, T.; Nakatani, T.; Ohnami, S.; Nakagawa, T.; et al. Multilayer-omics analysis of renal cell carcinoma, including the whole exome, methylome and transcriptome. Int. J. Cancer 2014, 135, 1330–1342. [Google Scholar] [CrossRef] [Green Version]
  33. Miyata, Y.; Liu, Y.; Jankovic, V.; Sashida, G.; Lee, J.M.; Shieh, J.H.; Naoe, T.; Moore, M.; Nimer, S.D. Cyclin C regulates human hematopoietic stem/progenitor sell quiescence. Stem Cells 2010, 28, 308–317. [Google Scholar] [CrossRef] [Green Version]
  34. Bondi, J.; Husdal, A.; Bukholm, G.; Nesland, J.M.; Bakka, A.; Bukholm, I.R.K. Expression and gene amplification of primary (A, B1, D1, D3, and E) and secondary (C and H) cyclins in colon adenocarcinomas and correlation with patient outcome. J. Clin. Pathol. 2005, 58, 509–514. [Google Scholar] [CrossRef] [Green Version]
  35. El-Hattab, A.W.; Dai, H.; Almannai, M.; Wang, J.; Faqeih, E.A.; Al Asmari, A.; Saleh, M.A.M.; Elamin, M.A.O.; Alfadhel, M.; Alkuraya, F.S.; et al. Molecular and clinical spectra of FBXL4 deficiency. Hum. Mutat. 2017, 38, 1649–1659. [Google Scholar] [CrossRef] [PubMed]
  36. Ballout, R.A.; Al Alam, C.; Bonnen, P.E.; Huemer, M.; El-Hattab, A.W.; Shbarou, R. FBXL4-Related Mitochondrial DNA Depletion Syndrome 13 (MTDPS13): A Case Report With a Comprehensive Mutation Review. Front. Genet. 2019, 10, 39. [Google Scholar] [CrossRef] [Green Version]
  37. Bonnen, P.E.; Yarham, J.W.; Besse, A.; Wu, P.; Faqeih, E.A.; Al-Asmari, A.M.; Saleh, M.A.M.; Eyaid, W.; Hadeel, A.; He, L.; et al. Mutations in FBXL4 cause mitochondrial encephalopathy and a disorder of mitochondrial DNA maintenance. Am. J. Hum. Genet. 2013, 93, 471–481. [Google Scholar] [CrossRef] [PubMed] [Green Version]
  38. Stankiewicz, E.; Mao, X.; Mangham, D.C.; Xu, L.; Yeste-Velasco, M.; Fisher, G.; North, B.; Chaplin, T.; Young, B.; Wang, Y.; et al. Identification of FBXL4 as a Metastasis Associated Gene in Prostate Cancer. Sci. Rep. 2017, 7, 5124. [Google Scholar] [CrossRef] [PubMed] [Green Version]
  39. Li, Q.; Li, Y.; Wang, X.; Qi, J.; Jin, X.; Tong, H.; Zhou, Z.; Zhang, Z.C.; Han, J. Fbxl4 Serves as a Clock Output Molecule that Regulates Sleep through Promotion of Rhythmic Degradation of the GABAA Receptor. Curr. Biol. 2017, 27, 3616–3625.e5. [Google Scholar] [CrossRef] [Green Version]
  40. Li, Y.; Yang, S.L.; Tang, Z.L.; Cui, W.T.; Mu, Y.L.; Chu, M.X.; Zhao, S.H.; Wu, Z.F.; Li, K.; Peng, K.M. Expression and SNP association analysis of porcine FBXL4 gene. Mol. Biol. Rep. 2009, 37, 579–585. [Google Scholar] [CrossRef]
  41. A Cabrera, R.; Usry, J.L.; Arellano, C.; Nogueira, E.T.; Kutschenko, M.; Moeser, A.; Odle, J. Effects of creep feeding and supplemental glutamine or glutamine plus glutamate (Aminogut) on pre- and post-weaning growth performance and intestinal health of piglets. J. Anim. Sci. Biotechnol. 2013, 4, 29. [Google Scholar] [CrossRef] [PubMed] [Green Version]
  42. Hsu, C.B.; Lee, J.W.; Huang, H.J.; Wang, C.H.; Lee, T.T.; Yen, H.T.; Yu, B. Effects of Supplemental Glutamine on Growth Performance, Plasma Parameters and LPS-induced Immune Response of Weaned Barrows after Castration. Asian Australas. J. Anim. Sci. 2012, 25, 674–681. [Google Scholar] [CrossRef] [PubMed] [Green Version]
  43. Nguyen, N.H.; McPhee, C.P.; Daniels, L.J.; Wade, C.M. Selection for growth rate in pigs on restricted feeding: Genetic parameters and correlated responses in residual feed intake. Proc. Assoc. Advmt. Anim. Breed. Genet. 2001, 14, 219–222. [Google Scholar]
  44. Wang, X.; Ma, P.; Liu, J.-F.; Zhang, Q.; Zhang, Y.; Ding, X.; Jiang, L.; Wang, Y.; Zhang, Y.; Sun, D.; et al. Genome-wide association study in Chinese Holstein cows reveal two candidate genes for somatic cell score as an indicator for mastitis susceptibility. BMC Genet. 2015, 16, 111. [Google Scholar] [CrossRef]
  45. Sargolzaei, M.; Chesnais, J.; Schenkel, F. A new approach for efficient genotype imputation using information from relatives. BMC Genom. 2014, 15, 478. [Google Scholar] [CrossRef] [Green Version]
  46. Wang, X.; Su, G.; Hao, D.; Lund, M.S.; Kadarmideen, H.N. Comparisons of improved genomic predictions generated by different imputation methods for genotyping by sequencing data in livestock populations. J. Anim. Sci. Biotechnol. 2020, 11, 3–12. [Google Scholar] [CrossRef]
  47. Purcell, S.M.; Neale, B.; Todd-Brown, K.; Thomas, L.; Ferreira, M.A.; Bender, D.; Maller, J.; Sklar, P.; De Bakker, P.I.W.; Daly, M.J.; et al. PLINK: A Tool Set for Whole-Genome Association and Population-Based Linkage Analyses. Am. J. Hum. Genet. 2007, 81, 559–575. [Google Scholar] [CrossRef] [Green Version]
  48. Xia, J.; Wishart, D.S. MetPA: A web-based metabolomics tool for pathway analysis and visualization. Bioinformatics 2010, 26, 2342–2344. [Google Scholar] [CrossRef] [Green Version]
  49. Xia, J.; Wishart, D.S. Web-based inference of biological patterns, functions and pathways from metabolomic data using MetaboAnalyst. Nat. Protoc. 2011, 6, 743–760. [Google Scholar] [CrossRef]
  50. Yang, J.; Lee, S.H.; Goddard, M.E.; Visscher, P.M. GCTA: A Tool for Genome-wide Complex Trait Analysis. Expanding the Spectrum of BAF-Related Disorders: De Novo Variants in SMARCC2 Cause a Syndrome with Intellectual Disability and Developmental Delay. Am. J. Hum. Genet. 2011, 88, 76–82. [Google Scholar] [CrossRef] [Green Version]
  51. Barrett, J.C.; Fry, B.; Maller, J.; Daly, M.J. Haploview: Analysis and visualization of LD and haplotype maps. Bioinformatics 2005, 21, 263–265. [Google Scholar] [CrossRef] [PubMed] [Green Version]
  52. Yu, G.; Wang, L.-G.; Han, Y.; He, Q.-Y. clusterProfiler: An R Package for Comparing Biological Themes Among Gene Clusters. OMICS A J. Integr. Boil. 2012, 16, 284–287. [Google Scholar] [CrossRef] [PubMed]
  53. Mostafavi, S.; Ray, D.; Warde-Farley, D.; Grouios, C.; Morris, Q. GeneMANIA: A real-time multiple association network integration algorithm for predicting gene function. Genome Biol. 2008, 9, S4. [Google Scholar] [CrossRef] [PubMed] [Green Version]
  54. Warde-Farley, D.; Donaldson, S.L.; Comes, O.; Zuberi, K.; Badrawi, R.; Chao, P.; Franz, M.; Grouios, C.; Kazi, F.; Lopes, C.T.; et al. The GeneMANIA prediction server: Biological network integration for gene prioritization and predicting gene function. Nucleic Acids Res. 2010, 38, W214–W220. [Google Scholar] [CrossRef]
  55. Chong, J.; Soufan, O.; Li, C.; Caraus, I.; Li, S.; Bourque, G.; Wishart, D.S.; Xia, J. MetaboAnalyst 4.0: Towards more transparent and integrative metabolomics analysis. Nucleic Acids Res. 2018, 46, W486–W494. [Google Scholar] [CrossRef] [Green Version]
  56. Ward, J.H., Jr. Hierarchical Grouping to Optimize an Objective Function. J. Am. Stat. Assoc. 1963, 58, 236–244. [Google Scholar] [CrossRef]
Figure 1. (A) Partial least squares-discriminant analysis (PLS-DA) of 45 metabolites. Note: D/L with first/second indicates the sampling time of Duroc/Landrace pigs. (B) Metabolic pathways for 45 metabolites using Homo sapiens as the library. Note: The size and color of the circles for each pathway indicate the matched metabolite ratio and the −log (p-value), respectively.
Metabolites 10 00201 g001
Figure 2. Manhattan plots of genome-wide association for (A) isovalerylcarnitine and (B) propionylcarnitine. Note: Y-axis indicates the log10 (p-value). Blue dotted and red solid lines indicate the genome-wide threshold of 0.05 and 0.01 after Bonferroni multiple testing, respectively. The three tracks indicate the metabolites from first sampling time, second sampling time, and combined two sampling times from outside to inside.
Metabolites 10 00201 g002
Figure 3. Linkage disequilibrium (LD) pattern for 53 significant SNPs on chromosome one. Note: the solid line triangle indicates LD. One square indicates LD level (r2) between two SNPs, and the squares are colored by the D’ & LLOR standard scheme. D’ & LLOR standard scheme is that red indicates LLOR > 2, D’ = 1; pink indicates LLOR > 2, D < 1; blue indicates LLOR < 2, D’ = 1; and white indicates LLOR < 2, D’ < 1. LLOR is the logarithm of likelihood odds ratio and the reliable index to measure D’.
Metabolites 10 00201 g003
Figure 4. Gene pathway, metabolite cluster, and the interaction network: (A) Pathway for significant SNP-related genes. (B) Network for the genes in which significant SNPs were annotated to gene components. (C) Heatmap cluster for the metabolites that were associated with significant SNPs annotated to gene components. (D) Metabolites (i.e., aspartic acid, isovalerylcarnitine, propionylcarnitine, and pyruvic acid) values in high and low residual feed intake (RFI) pigs associated with the genes in which significant SNPs annotate to gene components. Note: The high RFI pigs and low RFI pigs were from left and right parts of all the pigs (n = 108) with one SD of actual RFI values.
Metabolites 10 00201 g004
Figure 5. Distribution of actual RFI values of Duroc (n = 59) and Landrace (n = 49) pigs.
Metabolites 10 00201 g005
Figure 6. Overall analysis workflow.
Metabolites 10 00201 g006
Figure 7. Statistical description of 45 metabolites from combined two sampling times. Note: The red solid circle indicates the limit of detection (LOD) relative value of each metabolite. LOD refers to the lowest value of a metabolite that the LC-MS method can detect. M1 to M45 indicate the metabolites of 1-hexadecyl-sn-glycero-3-phosphocholine, 1-myristoyl-sn-glycero-3-phosphocholine, (3-Carboxypropyl)trimethylammonium, 4-aminobenzoic acid, 5-methyl-5,6-dihydrouracils, acetaminophen, acetylcarnitine, alanine, arginine, aspartic acid, benzoic acid, carnitine, citrulline, cotinine, creatinine, cytidine, disaccharide, glutamic acid, guanine, guanosine, hypoxanthine, indoleacrylic acid, inosine, isoleucine, isoleucyl proline, isovalerylcarnitine, lactic acid, leucyl methionine, lysoPC(16:0), manNAc, methionine, monosaccharide, nicotine amide, ornithine, phenylalanine, proline, propionylcarnitine, pyruvic acid, riboflavine, sorbitol, thiamine, threonine, thymidine, uridine, and xanthine, respectively.
Metabolites 10 00201 g007
Table 1. Significant metabolic pathways (False Discovery Rate (FDR) < 0.1) using Homo sapiens as the library.
Metabolic PathwayMatch StatusInvolved Metabolitesp-Value−Log (p-Value)False Discovery Rate (FDR)Pathway Impact Value
Aminoacyl-tRNA biosynthesis (ssc00970)9/48Alanine, Arginine, Aspartic acid, Glutamic acid, Isoleucine, Methionine, Phenylalanine, Proline, Threonine3.55 × 10−714.852.98 × 10−50
Arginine biosynthesis (ssc00220)5/14Arginine, Aspartic acid, Citrulline, Glutamic acid, Ornithine6.53 × 10−611.942.74 × 10−40.48
Arginine and proline metabolism (ssc00330)5/38Arginine, Glutamic acid, Ornithine, Proline, Pyruvic acid1.12 × 10−36.790.0310.33
Alanine, aspartate and glutamate metabolism (ssc00250)4/28Alanine, Aspartic acid, Glutamic acid, Pyruvic acid2.72 × 10−35.910.0570.42
Table 2. Common significant single-nucleotide polymorphisms (SNPs) of genome-wide association for more than two different metabolites from first, second, and combined two sampling times.
Significant SNP NameAssociated Metabolite NumberMetabolite from First Sampling TimeMetabolite from Second Sampling TimeMetabolite from Combined Two Sampling Times
ALGA0003891, ALGA0003900, ALGA0003935, ALGA0003952, ALGA0003953, ALGA0003995, ALGA0004000, ALGA0004002, ALGA0004005, ALGA0004006, ALGA0004024, ALGA0004041, ALGA0004042, ALGA0004046, ALGA0004048, ALGA0004073, ALGA0004090, ALGA0004093, ALGA0004143, ALGA0004148, ALGA0004169, ALGA0004173, ALGA0004177, ASGA0003182, ASGA0003194, ASGA0003235, ASGA0003288, ASGA0003312, ASGA0003314, ASGA0003315, ASGA0003317, ASGA0003333, ASGA0003335, ASGA0057312, ASGA0083304, DRGA0000994, DRGA0001072, DRGA0001073, H3GA0001865, H3GA0001937, H3GA0001949, H3GA0001956, H3GA0001966, H3GA0046845, INRA0002726, INRA0002819, INRA0002820, INRA0002823, MARC0021047, MARC0027518, MARC0034307, MARC0050325, MARC0059407, MARC0063106, MARC0068954, MARC0075306, SIRI00006552NAIsovalerylcarnitine, PropionylcarnitineNA
MARC00801162Pyruvic acidNACitrulline
ALGA0038416, ALGA0081238, DRGA0014486, WU_10.2_14_1322461913Isovalerylcarnitine, PropionylcarnitineNAPropionylcarnitine
ASGA0093565, H3GA0053559, WU_10.2_6_136216429, WU_10.2_6_136863547, WU_10.2_6_136876717, WU_10.2_6_13697284631-hexadecyl-sn-glycero-3-phosphocholine, 1-myristoyl-sn-glycero-3-phosphocholine, LysoPC(16:0)NANA
M1GA0016778, WU_10.2_X_1146492033Pyruvic acidNACitrulline, Pyruvic acid
ALGA0099866, WU_10.2_X_10555945041-hexadecyl-sn-glycero-3-phosphocholine, 1-myristoyl-sn-glycero-3-phosphocholine, LysoPC(16:0), Pyruvic acidNANA
ASGA00183244Citrulline, Pyruvic acidNACitrulline, Pyruvic acid
ASGA0081223, INRA0003881, MARC0046138, WU_10.2_X_103597980, WU_10.2_X_103653646, WU_10.2_X_104796075, WU_10.2_X_104910069, WU_10.2_X_104956283, WU_10.2_X_104980830, WU_10.2_X_10558373841-hexadecyl-sn-glycero-3-phosphocholine, 1-myristoyl-sn-glycero-3-phosphocholine, LysoPC(16:0)NA1-hexadecyl-sn-glycero-3-phosphocholine
Note: NA indicates not applicable.
Table 3. Gene component annotation for genome-wide significant SNPs.
ChromosomePositionSignificant SNP NameGene ComponentGeneGene DescriptionMetabolite from First Sampling Time (p-Value)Metabolite from Second Sampling Time (p-Value)Metabolite from Combined Two Sampling Times (p-Value)
174467285ALGA00040006th intronFBXL4 (NM_001171752)F-box and leucine rich repeat protein 4NAIsovalerylcarnitine (2.79 × 10⁻⁸), Propionylcarnitine (8.32 × 10⁻¹⁰)NA
175151870ALGA00040411st intronCCNC (NM_001190160)Cyclin CNAIsovalerylcarnitine (2.79 × 10⁻⁸), Propionylcarnitine (8.32 × 10⁻¹⁰)NA
175167426ALGA00040429th intron/8th intron #CCNC (NM_001190160)Cyclin CNAIsovalerylcarnitine (2.79 × 10⁻⁸), Propionylcarnitine (8.32 × 10⁻¹⁰)NA
283663964MARC01103907th intronSFXN1 (NM_001098602)Sideroflexin 1Pyruvic acid (1.25 × 10⁻⁷)NANA
6135424176ASGA00935658th intronDNAJC6 (NM_001145378)DnaJ heat shock protein family (Hsp40) member C61-hexadecyl-sn-glycero-3-phosphocholine (2.78 × 10⁻⁹), 1-myristoyl-sn-glycero-3-phosphocholine (1.35 × 10⁻⁸), LysoPC (16:0) (1.22 × 10⁻⁷)NANA
1126591544ALGA00616055th intron/9th intron #MTRF1 (NM_001243580)Mitochondrial translation release factor 1NAAspartic acid (2.29 × 10⁻⁷)NA
Note: NA indicates not applicable. # The annotation of the latest porcine RefSeq database (Sscrofa11.1/susScr11).

