Compound Characterization and Metabolic Profile Elucidation after In Vitro Gastrointestinal and Hepatic Biotransformation of an Herniaria hirsuta Extract Using Unbiased Dynamic Metabolomic Data Analysis

 , , , and
Abstract
: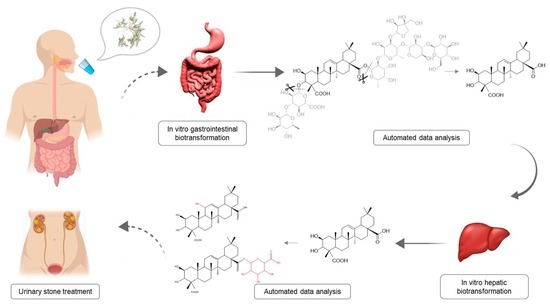
1. Introduction
2. Results and Discussion
2.1. Identification of Compounds
2.2. Gastrointestinal Biotransformation
2.3. Liver Biotransformation
3. Materials and Methods
3.1. Chemicals
3.2. Preparation of Standard Solutions
3.3. Sample Preparation
3.4. Gastrointestinal Biotransformation
3.5. Liver Biotransformation
3.6. Instrumental Analysis
3.7. Data Analysis
4. Conclusions
Author Contributions
Funding
Acknowledgments
Conflicts of Interest
References
- Eisner, B.H.; Goldfarb, D.S. Pharmacologic Treatment of Kidney Stone Disease. Urol. Clin. N. Am. 2013, 40, 21–30. [Google Scholar] [CrossRef] [PubMed]
- Pachaly, M.A.; Baena, C.P. Therapy of Nephrolithiasis: Where Is the Evidence from Clinical Trials? J. Bras. Nefrol. 2016, 38, 99–106. [Google Scholar] [CrossRef] [PubMed]
- Rule, A.D.; Lieske, J.C. The Roks Nomogram for Predicting a Second Symptomatic Stone Episode. J. Am. Soc. Nephrol. 2014, 25, 2878–2886. [Google Scholar] [CrossRef] [PubMed] [Green Version]
- Trinchieri, A. Epidemiology of Urolithiasis: An Update. Clin. Cases Miner. Bone Metab. 2008, 5, 101–106. [Google Scholar]
- Gurocak, S.; Kupeli, B. Consumption of Historical and Current Phytotherapeutic Agents for Urolithiasis: A Critical Review. J. Urol. 2006, 176, 450–455. [Google Scholar] [CrossRef]
- Moe, O.W. Kidney Stones: Pathophysiology and Medical Management. Lancet 2006, 367, 333–344. [Google Scholar] [CrossRef]
- Kirkali, Z.; Rasooly, R. Urinary Stone Disease: Progress, Status, and Needs. Urology 2015, 86, 651–653. [Google Scholar] [CrossRef] [Green Version]
- Erickson, S.B.; Vrtiska, T.J. Effect of Cystone(R) on Urinary Composition and Stone Formation over a One Year Period. Phytomedicine 2011, 18, 863–867. [Google Scholar] [CrossRef] [Green Version]
- Atmani, F.; Slimani, Y. Effect of Aqueous Extract from Herniaria hirsuta L. On Experimentally Nephrolithiasic Rats. J. Ethnopharmacol. 2004, 95, 87–93. [Google Scholar] [CrossRef]
- Atmani, F.; Slimani, Y. Prophylaxis of Calcium Oxalate Stones by Herniaria hirsuta on Experimentally Induced Nephrolithiasis in Rats. BJU Int. 2003, 92, 137–140. [Google Scholar] [CrossRef] [Green Version]
- Aggarwal, A. Urolithiasis: Phytotherapy as an Adjunct Therapy. Indian J. Exp. Biol. 2014, 53, 103–111. [Google Scholar]
- Fouada, A.; Yamina, S. In Vitro and in Vivo Antilithiasic Effect of Saponin Rich Fraction Isolated from Herniaria hirsuta. J. Bras. Nefrol. 2006, 28, 199–203. [Google Scholar]
- Atmani, F. Medical Management of Urolithiasis, What Opportunity for Phytotherapy. Front. Biosci. 2003, 8, 507–514. [Google Scholar] [CrossRef] [PubMed] [Green Version]
- Atmani, F.; Farell, G. Extract from Herniaria hirsuta Coats Calcium Oxalate Monohydrate Crystals and Blocks Their Adhesion to Renal Epithelial Cells. J. Urol. 2004, 172, 1510–1514. [Google Scholar] [CrossRef]
- Charrouf, Z.; Nait-Mbark, A. Herniaria Saponin B, a Novel Triterpenoid Saponin from Herniaria Fontanesii. Adv. Exp. Med. Biol. 1996, 405, 241–245. [Google Scholar]
- Mbark, A.N.; Charrouf, Z. Herniaria Saponin a, a Novel Saponin Fromherniaria Fontanesii. Nat. Prod. Lett. 2006, 6, 233–240. [Google Scholar] [CrossRef]
- van Dooren, I.; Foubert, K. Saponins and Flavonoids from an Infusion of Herniaria hirsuta. Planta Med. 2016, 82, 1576–1583. [Google Scholar] [CrossRef] [Green Version]
- MBark, A.N.; Guillaume, D. Triterpenoid Saponins from Herniaria Fontanesii. Phytochemistry 1996, 43, 1075–1077. [Google Scholar] [CrossRef]
- Mbark, A.N.; Charouf, Z. Monodesmosidic Saponins from Herniaria hirsuta. Pharmazie 2000, 55, 690–692. [Google Scholar]
- Wagner, H.; Bladt, S. Drogenanalyse: Dünnschichtchromatographische Analyse Von Arzneidrogen; Springer: Berlin/Heidelberg, Germany, 1983; pp. 225–230. [Google Scholar]
- Schröder, H.; Manfred, S.-Z. A triterpene saponin from Herniaria glabra. Phytochemistry 1993, 34, 1609–1613. [Google Scholar] [CrossRef]
- Rautio, J.; Kumpulainen, H. Prodrugs: Design and Clinical Applications. Nat. Rev. Drug Discov. 2008, 7, 255–270. [Google Scholar] [CrossRef] [PubMed]
- Peeters, L.; Beirnaert, C. Revelation of the Metabolic Pathway of Hederacoside C Using an Innovative Data Analysis Strategy for Dynamic Multiclass Biotransformation Experiments. J. Chromatogr. A 2019, 1595, 240–247. [Google Scholar] [CrossRef] [PubMed]
- Osbourn, A.E. Preformed Antimicrobial Compounds and Plant Defense against Fungal Attack. Plant Cell 1996, 8, 1821–1831. [Google Scholar] [CrossRef] [PubMed]
- Cuyckens, F.; Claeys, M. Mass Spectrometry in the Structural Analysis of Flavonoids. J. Mass Spectrom. 2004, 39, 1–15. [Google Scholar] [CrossRef]
- Mikolajczyk-Bator, K.; Blaszczyk, A. Identification of Saponins from Sugar Beet (Beta Vulgaris) by Low and High-Resolution Hplc-Ms/Ms. J. Chromatogr. B 2016, 1029, 36–47. [Google Scholar] [CrossRef]
- Beirnaert, C.; Peeters, L. Using Expert Driven Machine Learning to Enhance Dynamic Metabolomics Data Analysis. Metabolites 2019, 9, 54. [Google Scholar] [CrossRef] [Green Version]
- Aura, A.-M.; O’leary, K. Quercetin Derivatives Are Deconjugated and Converted to Hydroxyphenylacetic Acids but Not Methylated by Human Fecal Flora in Vitro. J. Agric. Food Chem. 2002, 50, 1725–1730. [Google Scholar] [CrossRef]
- Justesen, U.; Arrigoni, E. Electrospray Ionisation Mass Spectrometric Study of Degradation Products of Quercetin, Quercetin-3-Glucoside and Quercetin-3-Rhamnoglucoside, Produced by in Vitro Fermentation with Human Faecal Flora. Rapid Commun. Mass Spectrom. 2001, 15, 477–483. [Google Scholar] [CrossRef]
- Osborne, R.; Thompson, P. The Analgesic Activity of Morphine-6-Glucuronide. Br. J. Clin. Pharmacol. 1992, 34, 130–138. [Google Scholar] [CrossRef]
- Ritter, J.K. Roles of Glucuronidation and Udp-Glucuronosyltransferases in Xenobiotic Bioactivation Reactions. Chem. Biol. Interact. 2000, 129, 171–193. [Google Scholar] [CrossRef]
- ijttebier, S.; Van der Auwera, A. Bridging the Gap between Comprehensive Extraction Protocols in Plant Metabolomics Studies and Method Validation. Anal. Chim. Acta 2016, 935, 136–150. [Google Scholar] [CrossRef] [PubMed]
- Theodoridis, G.; Gika, H. Lc-Ms Based Global Metabolite Profiling of Grapes: Solvent Extraction Protocol Optimisation. Metabolomics 2012, 8, 175–185. [Google Scholar] [CrossRef]
- Breynaert, A.; Bosscher, D. Development and Validation of an in Vitro Experimental Gastrointestinal Dialysis Model with Colon Phase to Study the Availability and Colonic Metabolisation of Polyphenolic Compounds. Planta Med. 2015, 81, 1075–1083. [Google Scholar] [CrossRef] [PubMed]
- Mortelé, O.; Iturrospe, E. Optimization of an in Vitro Gut Microbiome Biotransformation Platform with Chlorogenic Acid as Model Compound: From Fecal Sample to Biotransformation Product Identification. J. Pharm. Biomed. Anal. 2019, 112768. [Google Scholar] [CrossRef]
- Van den Eede, N.; Maho, W. First Insights in the Metabolism of Phosphate Flame Retardants and Plasticizers Using Human Liver Fractions. Toxicol. Lett. 2013, 223, 9–15. [Google Scholar] [CrossRef]
- Wang, M.; Carver, J.J. Sharing and Community Curation of Mass Spectrometry Data with Global Natural Products Social Molecular Networking. Nat. Biotechnol. 2016, 34, 828–837. [Google Scholar] [CrossRef] [Green Version]
- Stanstrup, J.; Gerlich, M. Metabolite Profiling and Beyond: Approaches for the Rapid Processing and Annotation of Human Blood Serum Mass Spectrometry Data. Anal. Bioanal. Chem. 2013, 405, 5037–5048. [Google Scholar] [CrossRef]
- Storey, J.D.; Xiao, W. Significance Analysis of Time Course Microarray Experiments. Proc. Natl. Acad. Sci. USA 2005, 102, 12837–12842. [Google Scholar] [CrossRef] [Green Version]
- Leek, J.T.; Monsen, E. Edge: Extraction and Analysis of Differential Gene Expression. Bioinformatics 2006, 22, 507–508. [Google Scholar] [CrossRef] [Green Version]
- Vervliet, P.; Mortele, O. Suspect and Non-Target Screening Workflows to Investigate the in Vitro and in Vivo Metabolism of the Synthetic Cannabinoid 5cl-Thj-018. Drug Test. Anal. 2019, 11, 479–491. [Google Scholar] [CrossRef]
- Djoumbou-Feunang, Y.; Fiamoncini, J. Biotransformer: A Comprehensive Computational Tool for Small Molecule Metabolism Prediction and Metabolite Identification. J. Cheminform. 2019, 11, 1–25. [Google Scholar] [CrossRef] [PubMed] [Green Version]
- Vervliet, P. Invitro-in Vitro Hlm Assay Feature Prioritization (Version V1.0.1). Zenodo 2018. [Google Scholar] [CrossRef]


| Com-Pound Number | Compound a | Molecular Formula | RT (min) | HESI Full MS b | HESI ddMS2 | Neutral Losses | Max Abs. (nm) | Literature | |
|---|---|---|---|---|---|---|---|---|---|
| 1 | quinic acid c | C7H12O6 | 1.54 | neg | 191.05611 | - | |||
| pos | - | - | |||||||
| 2 | gallic acid c | C7H6O5 | 4.06 | neg | 169.01412 | - | |||
| pos | - | - | |||||||
| 3 | protocatechuic acid [3,4-dihydroxybenzoic acid] c | C7H6O4 | 6.46 | neg | 153.01933 | 109.02950 | 109.02950: C6H6O2 | 259; 294 | |
| pos | - | - | |||||||
| 4 | caffeyl hexose | C15H18O9 | 7.68 | neg | 341.08817 | 179.03439; 135.04439 | 179.03439: C9H8O4; 135.04439: C9H8O4 - CO2 | ||
| pos | 365.08380 [M+Na]+; 360.12839 [M+NH4]+ | 181.04962; 163.03906; 145.02861; 135.04443 | 181.04962: C9H8O4; 163.03906: C9H8O4 - H2O; 145.02861: C9H6O4 - 2H2O; 135.04443: C8H6O2 | ||||||
| 5 | asperulosidic acid | C18H24O12 | 8.01 | neg | 431.11975; 499.10757 [M-H+NaFA]−; 863.24756 [2M-H]− | 329.09064; 161.04463 | 329.09064: C14H18O9; 161.04463: C6H10O5 | ||
| pos | 433.13428 | 271.08188; 187.06091; 145.04990; 127.03919 | 271.08188: C18H24O12 - C6H10O5; 187.06091: C8H10O5; 145.04990: C6H8O4; 127.03919: C6H6O3 | ||||||
| 6 | dihydrocaffeic acid c | C9H10O4 | 8.07 | neg | 181.05041 | - | |||
| pos | - | - | |||||||
| 7 | 1-O-feruloylquinic acid d | C17H20O9 | 8.76 | neg | 367.10349; 435.09108 [M-H+NaFA]− | - | |||
| pos | 369.11795 | - | |||||||
| 8 | chlorogenic acid [3.4-dihydroxycinnamoylquinic acid; 5-Caffeoylquinic acid] c | C16H18O9 | 8.94 | neg | 353.08685; 707.18355 [2M-H]− | 191.05545 | 191.05611: C7H12O6 | 326 | |
| pos | 355.10160; 377.08360 [M+Na]+; 731.17920 [2M+Na]+ | 163.03897 | 163.03897: C9H6O3 | ||||||
| 9 | isorhamnetin-3-O-rutinoside-7-O-glucoside d | C34H42O21 | 9.27 | neg | 785.21631; 853.20349 [M-H+NaFA]− | 623.16479; 476.09396; 315.05124; 300.02750; 271.02466 | 623.16479: C34H42O21 - C6H10O5; 315.05124: C16H12O7; 300.02750: C15H9O7; 271.02466: C14H7O6 | ||
| pos | 787.22931 | 641.17114; 479.11838 | 641.17114: C34H42O21 - C6H10O4; 479.11838: C34H42O21 - C6H10O4 - C6H10O5 | ||||||
| 10 | chlorogenic acid c | C16H18O9 | 9.36 | neg | 353.08781 | 191.05611 | 191.05611: C7H12O6 | ||
| pos | 355.10236 | 163.03897 | |||||||
| 11 | Catechin c | C15H14O6 | 11.21 | neg | 289.07176 | - | 279 | Mbark et al. | |
| pos | - | - | |||||||
| 12 | epicatechin c | C15H14O6 | 11.25 | neg | 289.07176 | - | 280 | ||
| pos | - | - | |||||||
| 13 | procyanidin B2 c | C30H26O12 | 9.68 | neg | 577.13515 | - | |||
| pos | 579.14970 | - | |||||||
| 14 | caffeic acid c | C9H8O4 | 9.7 | neg | 179.03498 | 135.04515 | 135.04515: C9H8O4 - CO2 | ||
| pos | 181.04954 | 163.03915; 145.02861; 135.04443 | 163.03897: C9H8O4 - H2O | ||||||
| 15 | 1-O-feruloylquinic acid d | C17H20O9 | 10.51 | neg | 367.10358; 435.09106 [M-H+NaFA]− | 193.05003; 173.04489; 134.03622 | 193.05003: C10H10O4; 173.04485: C7H10O5 | ||
| pos | 391.10001 [M+Na]+ | 145.02855; 149.05952; 117.03381; 177.05475; 194.05750 | 145.02855: C9H4O2; 149.05952: C9H8O2; 117.03381: C8H4O; 177.05475: C10H10O4 - H2O | ||||||
| 16 | quercetin 3-rhamnosyl-(1->2)-rhamnosyl-(1->6)-glucoside or quercetin 3-rhamninoside | C33H40O20 | 11.05 | neg | 755.20471; 823.19204 [M-H+NaFA]−; 1511.41418 [2M-H]− | 300.02771; 271.02499; 255.02994 | 300.02771: C15H9O7; 271.02499: C14H8O6; 255.02994: C14H8O5 | ||
| pos | 757.21765; 611.16085 | 465.1033; 303.05008 | 465.1033: C33H40O20 - 2C6H10O4; 303.05008: C33H40O20 - 2C6H10O4 - C6H10O5 | ||||||
| 17 | matairesinoside | C26H32O11 | 11.3 | neg | 565.19336 [M-H+FA]− | 339.12378; 329.13812; 327.12405; 324.09967; 312.09885; 309.07953; 297.07669 | 339.12378: C20H20O5; 329.13812: C19H22O5; 327.12405: C19H20O5; 324.09967: C19H17O5; 312.09885: C18H17O5; 309.07953: C18H14O5; 297.07669: C17H14O5 | 355 | |
| pos | 543.18420 [M+Na]+; 538.22786 [M+NH4]+ | 503.19199; 341.13672; 323.12738; 311.12756; 175.07526; 137.05983 | 503.19199: C26H30O10; 341.13672: C20H20O5; 323.12738: C20H18O4; 311.12756: C19H18O4; 175.07526: C11H10O2; 137.05983: C8H8O2 | ||||||
| 18 | isorhamnetin-O-glycoside (one hexosyl and two deoxyhexosyl units) | C34H42O20 | 11.74 | neg | 769.22040 [M-H]; 1539.44527 [2M-H]−; 632.32239 | 357.06104; 314.04349; 271.02512; 299.01981; 285.04065 | 632.32239: C34H42O20 - C6H10O4; 357.06104: C18H14O8; 314.04349: C16H11O7; 299.01981: C15H8O7; 285.04065: C15H10O6; 271.02512: C14H8O6 | 355 | |
| pos | 771.23315; 625.17635; 479.11849 | 625.17743; 479.11874; 317.06540 | 625.17743: C34H42O20 - C6H10O4; 479.11874: C34H42O20 - 2C6H10O4; 317.06540: C34H42O20 - 2C6H10O4 - C6H10O5 | ||||||
| 19 | quercetin 3-O-β-(2″-O-α-L-rhamnopyranosyl)-glucopyranoside | C27H28O17 | 11.96 | neg | 623.12537; 1247.25657 [2M-H]− | 301.03543 | 301.03543: C27H28O17 - C6H10O4 - C6H8O6 | 255; 355 | van Dooren et al. (2016) |
| pos | 625.13943; 479.08180 | 479.08240; 303.04999 | 479.08180: C27H28O17 - C6H10O4; 303.04999: C27H28O17 - C6H10O4 - C6H8O6 | ||||||
| 20 | rutin c | C27H30O16 | 12.08 | neg | 609.14667; 677.13349 [M-H+NaFA]− | 300.02762; 271.02481; 255.02990; 243.02990 | 300.02755: C15H9O7; 271.02481: C14H8O6; 255.02990: C14H8O5; 243.02990: C13H8O5 | 256; 355 | van Dooren et al. (2016) |
| pos | 611.15973 | 465.10267; 303.04999 | 465.10275: C21H22O12; 303.04993: C15H12O7 | ||||||
| 21 | cynaroside c | C21H20O11 | 12.2 | neg | 447.09364 | - | Wagner et al. (2013) | ||
| pos | - | - | |||||||
| 22 | hesperidin c | C28H34O15 | 12.24 | neg | 609.18153 | - | |||
| pos | 611.19705 | - | |||||||
| 23 | ferulic acid c | C10H10O4 | 12.34 | neg | 193.05063 | 178.02643 | 178.02643: C9H7O4 | ||
| pos | 195.06519 | 177.0547; 145.02855; 135.04424; 117.03378 | 177.0547: C10H10O4 - H2O; 149.05984: C9H12O2; 145.02855: C9H4O2; 135.04424: C8H6O2; 117.03378: C8H4O | ||||||
| 24 | herniariasaponin 1 | C54H56O32 | 12.59 | neg | 1215.2698 | - | |||
| pos | 1239.26343 [M+Na]+ | - | |||||||
| 25 | isoquercetin c | C21H20O12 | 12.61 | neg | 463.0882 | 300.02725; 271.02539; 255.02905; 243.02859; 151.00230 | 300.02725: C15H9O7; 271.02539: C14H8O6; 255.02905: C14H8O5; 243.02859: C13H8O5; 151.00230: C7H4O4 | ||
| pos | 465.10275 | 303.05008; 287.05533; 257.04483 | 303.05008: C15H10O7; 287.05533: C15H10O6; 257.04483: C14H8O5 | ||||||
| 26 | p-coumaric acid c | C9H8O3 | 12.62 | neg | 163.04007 | 119.05024 | 119.05024: C8H8O | ||
| pos | 165.05462 | 147.04414 | 147.04414: C9H6O2 | ||||||
| 27 | 2-(3.4-Dihydroxyphenyl)-5.7-dihydroxy-4-oxo-4H-chromen-3-yl-6-O-(2-O-acetyl-α-L-arabinopyranosyl)-β-D-glucopyranoside | C28H30O17 | 12.67 | neg | 637.14125; 1275.28809 [2M-H]− | 463.09000; 300.02728 | 463.09000: C21H20O12; 300.02728: C15H9O7 | ||
| pos | 639.15543; 493.09749 | 465.10071; 303.04972 | 493.09749: C28H30O17 – C6H10O4; 465.10071: C21H20O12; 303.04972: C15H10O7 | ||||||
| 28 | miquelianin [quercetin-3-O-glucuronide]c | C21H18O13 | 12.89 | neg | 477.06746 | 301.03538; 271.02481 255.02990; 178.99860; 151.00368 | 301.03538: C15H10O7; 271.02481: C14H8O6; 255.02990: C14H8O5; 178.99860: C8H4O5; 151.00368: C7H4O4 | ||
| pos | 479.08202 | 303.04993; 257.04445 | 303.04993: C15H10O7; 257.04445: C14H8O5 | ||||||
| 29 | narcissin [isorhametin-3-O-rutinoside] | C28H32O16 | 12.89 | neg | 623.16211; 477.06749; 1247.33026 [2M-H]− | 315.05072 | 477.06749: C28H32O16 - C6H10O4; 315.05072: C28H32O16 - C6H10O4 - C6H10O5 | 254; 355 | van Dooren et al. (2016) Wagner et al. (2013) |
| pos | 625.14606 | 479.11804; 317.06586 | 479.11804: C28H32O16 - C6H10O4; 317.06586: C28H32O16 - C6H10O4 - C6H10O5 | ||||||
| 30 | avicularin [quercetin-3-O-arabinoside] c | C20H18O11 | 13.16 | neg | 433.0782 | 301.03586 | 256; 355 | ||
| pos | 435.09219 | - | |||||||
| 31 | apigetrin c | C21H24O9 | 13.27 | neg | 431.09837 | 268.03827 | 268.03827: C15H9O5 | ||
| pos | 433.11292 | - | |||||||
| 32 | astragalin [kaempferol 3-O-glucoside] c | C21H20O11 | 13.34 | neg | 447.09381 | 284.03314; 255.03024; 227.03455 | 284.03314: C15H9O6; 255.03024: C14H8O5; 227.03455: C13H8O4 | 265; 348 | |
| pos | 449.10814 | - | |||||||
| 33 | quercitrin c | C21H20O11 | 13.35 | neg | 447.09328 | - | 265; 346 | ||
| pos | 449.10784 | - | |||||||
| 34 | salicylic acid c | C7H6O3 | 14.07 | neg | 137.02442 | 93.03459 | 93.03459: C6H6O | 236; 302 | |
| pos | - | - | |||||||
| 35 | herniariasaponin F | C59H94O28 | 14.17 | neg | 1249.58482; 647.29342 | 501.32303; 439.32358 | 647.29342: C30H46O6 + C6H10O4; 501.32303: C30H46O6; 439.32358: C30H46O6 - H2O - CO2 | Mbark et al. (2000) | |
| pos | 1273.58240 [M+Na]+; 1268.62600 [M+NH4]+; 1122.56885; 645.27747; 457.33133 | 771.25336 | 457.33133: C29H44O4; 771.25336: 2C6H10O5 + 2C6H10O4 + C5H8O4 + Na | ||||||
| 36 | acetylated medicagenic acid + two hexosyl + two deoxyhexosyl + one pentosyl moieties e | C61H96O29 | 14.53 | neg | 1291.59644 | 1249.59241; 1231.57312; 821.43506; 543.33441; 501.32294; 483.31107; 439.32251 | 821.43506: C61H96O29 - 2C6H10O5 - C6H10O4; 543.33441: C32H48O7; 501.32294: C30H46O6; 483.31107: C30H46O6 - H2O; 439.32251: C30H46O6 - H2O - CO2 | ||
| pos | 1310.63818 [M+NH4]+ | - | |||||||
| 37 | acetylated medicagenic acid + three hexosyl + one deoxyhexosyl moieties e | C56H88O26 | 14.61 | neg | 1175.549 | 705.38928; 543.33337; 501.32281; 439.32205 | 705.38928: C32H48O7 + C6H10O5; 543.33337: C32H48O7; 501.32281: C30H46O6; 439.32205: C30H46O6 - H2O - CO2 | Schröder et al. (1993) | |
| pos | 1194.59088 [M+NH4]+ | - | |||||||
| 38 | medicagenic acid + two hexosyl + two deoxyhexosyl + two pentosyl + 1 glucuronic acid moiety e | C70H110O38 | 14.89 | neg | 1557.6595; 1411.60317 | 1235.56738; 983.57922; 796.23248; 439.32043 | 1411.60317: C70H110O38 - C6H10O4; 1235.56738: C70H110O38 - C6H10O4 - C6H8O6; 439.32043: C29H44O3 | Mbark et al. (2000) | |
| pos | 1581.65795 [M+Na]+ | 1259.56189; 741.24219; 595.18250; 445.13116 | |||||||
| 39 | zanhic acid + one hexose + four deoxyhexoses + two pentoses + one glucuronic acid moiety e | C76H120O42 | 14.92 | neg | 1703.71708; 851.35632 [M-2H]2− | 1381.62830; 823.41089; 517.31879; 455.31766; 839.40845 | 1381.62830: C76H120O42 - C6H10O4 - C6H8O6; 517.31879: C30H46O7; 455.31766: C30H46O7 - H2O - CO2; 839.40845: C30H47O7 + C6H10O4 + C6H8O6 | ||
| pos | 1727.71399 [M+Na]+; 1722.75891 [M+NH4]+ | - | |||||||
| 40 | herniariasaponin E | C55H86O25 | 15.03 | neg | 1145.5387; 1213.52771 [M-H+NaFA]−; 572.26715; 595.26941 [M-2H-FA]2− | 543.33105; 483.31180; 439.32227; 601.19806; 439.32208 | 543.33105: C32H48O7; 483.31180: C30H46O6 - H2O; 439.32227: C30H46O6 - H2O - CO2; 601.19806: C5H8O4 + C6H10O4 + 2C6H10O5; 439.32208: C5H8O4 + C6H10O4 + C6H10O5 | Mbark et al. (2000) | |
| pos | 1169.53381 [M+Na]+; 1164.57869 [M+NH4]+ | 545.34430 | 545.34430: C32H48O7 | ||||||
| 41 | acetylated medicagenic acid + three hexosyl moieties e | C50H78O22 | 15.06 | neg | 1029.49191; 1075.49754 [M-H+FA]− | 543.33105; 483.31180; 439.32227; 791.07910; 585.34424 | 543.33105: C32H48O7; 483.31180: C30H44O5; 439.32227; 791.07910: C29H28O26 | ||
| pos | 1048.53173 [M+NH4]+; 1053.48612 [M+Na]+ | - | |||||||
| pos | 1398.65376 [M+NH4]+ | - | |||||||
| 42 | medicagenic acid + three deoxyhexosyl + one pentosyl + one glucuronic acid moiety e | C59H92O28 | 15.12 | neg | 1247.569 | 925.48315; 501.31976 | |||
| pos | 1271.56687 [M+Na]+ | 1127.49792; 949.47644; 701.34851; 525.32062; 447.14737 | |||||||
| 43 | zanhic acid + three deoxyhexosyl + one pentosyl + one glucuronic acid moiety e | C59H92O29 | 15.24 | neg | 1263.5657 | 1163.15430; 1081.94128 | |||
| pos | 1282.60583 [M+NH4]+ | - | |||||||
| 44 | medicagenic acid + two hexosyl + three deoxyhexosyl + two pentosyl + one glucuronic acid moiety e | C76H120O42 | 15.33 | neg | 1703.7174 | 1381.62830; 1219.22852; 879.30701; 843.52264; 823.41089; 501.32275; 439.31934 | |||
| pos | 1727.71399 [M+Na]+; 1722.75891 [M+NH4]*+ | - | |||||||
| 45 | medicagenic acid + one hexosyl + four deoxyhexosyl + two pentoses + one glucuronic acid moiety e | C76H120O41 | 15.52 | neg | 1687.7229 | 1365.63477; 998.50537; 823.42078 | |||
| pos | 1711.71936 [M+Na]+ | - | |||||||
| 46 | medicagenic acid + three deoxyhexosyl + two pentosyl + one glucuronic acid moiety d,e | C64H100O32 | 15.12; 15.62 | neg | 1379.6127 | 1057.52454; 925.48077; 823.41821; 501.32251; 439.32050 | 1057.52454: C64H100O32 - C6H8O6 - C6H10O4; 925.48077: C64H100O32 - C6H8O6 - C6H10O4 – C5H8O4; 823.41821: C35H68O21; 501.32251: C30H46O6; 439.32050: C30H46O6 - H2O - CO2 | ||
| pos | 1403.60791 [M+Na]+ | 1259.54272; 1081.51782; 847.40808; 579.18964 | |||||||
| 47 | medicagenic acid + one hexosyl + two deoxyhexosyl + two pentosyl + one glucuronic acid moiety e | C64H100O33 | 15.67 | neg | 1395.6069 | 439.32248; 1219.58301 | 439.32248: C30H46O6 - H2O - CO2; 1219.58301: C64H100O33 - C6H8O6 | Charrouf et al. (1995) | |
| pos | 1419.60059 [M+Na]+ | - | |||||||
| 48 | herniariasaponin B | C65H102O33 | 15.83 | neg | 1409.6244 | 1087.53479; 823.41272; 501.32300; 439.32343 | 1087.53479: C65H102O33 - C6H10O4 - C6H8O6; 823.41272; 501.32300: C30H46O6; 439.32343: C30H46O6 - H2O - CO2 | Charrouf et al. (1995) | |
| pos | 1433.61982 [M+Na]+; 1428.66283 [M+NH4]+; 1411.63638 | - | |||||||
| 49 | acetylated medicagenic acid + one deoxyhexosyl + two pentosyl moieties e | C47H74O19 | 16 | neg | 941.47546 | 501.32312; 439.32037; 821.43097; 543.33167 | 821.43097: C47H74O19 - C5H8O4; 543.33167: C32H48O7; 501.32312: C30H46O6; 439.32037: C30H46O6 - H2O - CO2 | ||
| pos | 960.51593 [M+NH4]+; 965.47021 [M+Na]+ | 463.14227: C17H27O13Na | |||||||
| 50 | quercetin c | C15H10O7 | 16.4 | neg | 301.03538 | 271.02539; 178.99774; 151.00273; 121.02832 | 271.02539: C14H8O6; 178.99774: C8H4O5; 151.00273: C7H4O4; 121.02832: C7H6O2 | 255; 372 | |
| pos | 303.04993 | 285.03964; 257.04440; 229.04947; 201.05476; 165.01811; 153.01846; 137.02357 | 285.03964: C15H8O6; 257.04440: C14H8O5; 229.04947: C13H8O4; 201.05476: C12H8O3; 165.01811: C8H4O4; 153.01846: C7H4O4; 137.02357: C7H4O3 | ||||||
| 51 | acetylated medicagenic acid + one hexosyl + two deoxyhexosyl + one pentosyl + one glucuronic acid moietye | C61H94O30 | 16.76 | neg | 652.28625 [M-2H]2−; 1305.57764 | 439.32321; 585.20691 | 439.32321: C29H43O3; 585.20691: C5H8O4 + 2C6H10O4 + C6H10O5 | ||
| pos | 1329.57288 [M+Na]+; 1324.61719 [M+NH4]+ | - | |||||||
| 52 | naringenin c | C15H12O5 | 16.8 | neg | 271.06120 | 253.05069 | 253.05069: C15H10O4 | ||
| pos | 273.07575 | - | |||||||
| 53 | apigenin c | C15H10O5 | 17.73 | neg | 269.04555 | 225.05510; 151.00255; 117.03339 | 225.05510: C14H10O3; 151.00255: C7H4O4 | ||
| pos | 271.06010 | 153.01845 | 153.01845: C7H4O4 | ||||||
| 54 | isorhamnetin c | C16H12O7 | 17.87 | neg | 315.05103 | 300.02762; 271.02399; 243.02707; 216.04128; 164.01071; 151.00258 | 300.02762: C15H9O7 | ||
| pos | 317.06555 | 302.04205; 285.03882; 153.01846 | 153.01846: C7H4O4 | ||||||
| 55 | luteolin c | C15H10O6 | 18.09 | neg | 285.04046 | 199.03967; 151.00212; 133.02821 | 199.03967: C12H8O3; 151.00212: C7H4O4; 133.02821: C8H6O2 | ||
| pos | 287.05501 | 153.01787; 135.04414 | 153.01787: C7H4O4; 135.04414: C8H6O2 | ||||||
| 56 | kaempferol c | C15H10O6 | 18.09 | neg | 285.04046 | - | 265; 364 | ||
| pos | 287.05501 | 258.05115; 231.06519; 165.01807; 153.01816; 121.02866 | 258.05115: C14H9O5; 231.06519: C13H10O4; 165.01807: C8H4O4; 153.01816: C7H4O4; 121.02866: C7H4O2 | ||||||
| 57 | miquelianin [quercetin 3-O-glucuronide] c | C21H18O13 | 12.89–13.49 | neg | 477.0675 | 301.03552; 271.02505; 255.03020;178.99788; 151.00258 | 257; 357 | ||
| pos | 479.0824 | 303.04993; 257.04370 | |||||||
| 58 | herniariasaponin G | C53H84O24 | 14.61 | neg | 1103.52829; 574.26304 [M-2H+FA]− | 821.43842; 501.32306; 439.32156 | 821.43842: C36H70O20; 501.32306: C30H46O6; 439.32156: C30H46O6 -H2O - CO2 | van Dooren et al. (2016) | |
| pos | 1127.52344 [M+Na]+; 1122.56841 [M+NH4]+; 811.44629; 503.33636; 457.33087 | 973.50128; 811.45264; 649.39624; 503.33704; 457.33188 | 811.44629: C53H84O24 - C5H8O4 - C6H10O5; 503.33636: C30H46O6; 973.50128: C53H84O24 - C5H8O4; 649.39624: C53H84O24 - C5H8O4 - 2C6H10O5 | ||||||
| 59 | medicagenic acid + two hexosyl + two deoxyhexosyl + two pentosyl + one glucuronic acid moiety e | C70H110O38 | 14.89–15.38 | neg | 1557.6595; 1411.60317 | 1235.56738; 983.57922; 796.23248; 439.32043 | 1411.60317: C70H110O38 - C6H10O4 | ||
| pos | 1581.65795 [M+Na]+ | 1259.56189; 741.24219; 595.18250; 445.13116 | |||||||
| 60 | medicagenic acid + one hexosyl + two deoxyhexosyl + two pentosyl + one glucuronic acid moiety e | C64H100O33 | 14.92–15.67 | neg | 1395.6069 | 1219.583 | |||
| pos | - | - | |||||||
| 61 | herniariasaponin H d | C70H110O37 | 15.12; 15.66; 15.72 | neg | 1541.6657 | 1446.38293; 1219.58069; 823.41711; 501.32587 | 1219.58069: C70H110O37 - C5H8O4 - C6H8O6; 823.41711: C70H110O37 - C6H10O5 - 2C5H8O4 - 2C6H10O4; 501.32587: C30H46O6 | van Dooren et al. (2016) | |
| pos | 1565.66118 [M+Na]+; 1560.70778 [M+NH4]+ | 1243.57349; 905.31189; 741.24255 | |||||||
| 62 | chlorogenic acid d | C16H18O9 | 7.31; 8.88 | neg | 353.08685 | 191.05544; 179.03427; 173.04494 | 191.05544: C7H12O6; 179.03427: C9H8O4; 173.04494: C7H12O6 - H2O | ||
| pos | 355.1016; 377.08360 [M+Na]+ | 163.03915; 145.02861; 135.04443 | 163.03915: C9H8O4 - H2O; 145.02861: C9H8O4 - 2H2O; 135.04443: C8H8O2 | ||||||
| 63 | 1-O-feruloylquinic acid d | C17H20O9 | 9.20–10.62 | neg | 367.10349; 435.09108 [M-H+NaFA]− | 193.05003; 173.04485; 134.03622 | Jaiswal et al. (2011) | ||
| pos | 369.11748; 391.09949 [M+Na]+ | 145.02855; 149.05952; 117.03381; 177.05475; 194.05750 |
| m/z [M-H]− | Sum Formula | ∆ ppm |
|---|---|---|
| 1703.71838 | C76H120O42 | 0.141 |
| 1381.62830 | C64H102O32 | 0.113 |
| 879.30701 | C34H56O26 | 9.445 |
| 823.41089 | C42H64O16 | −1.541 |
| 501.32275 | C30H45O6 | 1.172 |
| 439.31934 | C29H44O3 | −5.528 |
© 2020 by the authors. Licensee MDPI, Basel, Switzerland. This article is an open access article distributed under the terms and conditions of the Creative Commons Attribution (CC BY) license (http://creativecommons.org/licenses/by/4.0/).
Share and Cite
Peeters, L.; Van der Auwera, A.; Beirnaert, C.; Bijttebier, S.; Laukens, K.; Pieters, L.; Hermans, N.; Foubert, K. Compound Characterization and Metabolic Profile Elucidation after In Vitro Gastrointestinal and Hepatic Biotransformation of an Herniaria hirsuta Extract Using Unbiased Dynamic Metabolomic Data Analysis. Metabolites 2020, 10, 111. https://doi.org/10.3390/metabo10030111
Peeters L, Van der Auwera A, Beirnaert C, Bijttebier S, Laukens K, Pieters L, Hermans N, Foubert K. Compound Characterization and Metabolic Profile Elucidation after In Vitro Gastrointestinal and Hepatic Biotransformation of an Herniaria hirsuta Extract Using Unbiased Dynamic Metabolomic Data Analysis. Metabolites. 2020; 10(3):111. https://doi.org/10.3390/metabo10030111
Chicago/Turabian StylePeeters, Laura, Anastasia Van der Auwera, Charlie Beirnaert, Sebastiaan Bijttebier, Kris Laukens, Luc Pieters, Nina Hermans, and Kenn Foubert. 2020. "Compound Characterization and Metabolic Profile Elucidation after In Vitro Gastrointestinal and Hepatic Biotransformation of an Herniaria hirsuta Extract Using Unbiased Dynamic Metabolomic Data Analysis" Metabolites 10, no. 3: 111. https://doi.org/10.3390/metabo10030111