Integrative Metabolomic and Transcriptomic Analyses Reveal Metabolic Changes and Its Molecular Basis in Rice Mutants of the Strigolactone Pathway

 and
and 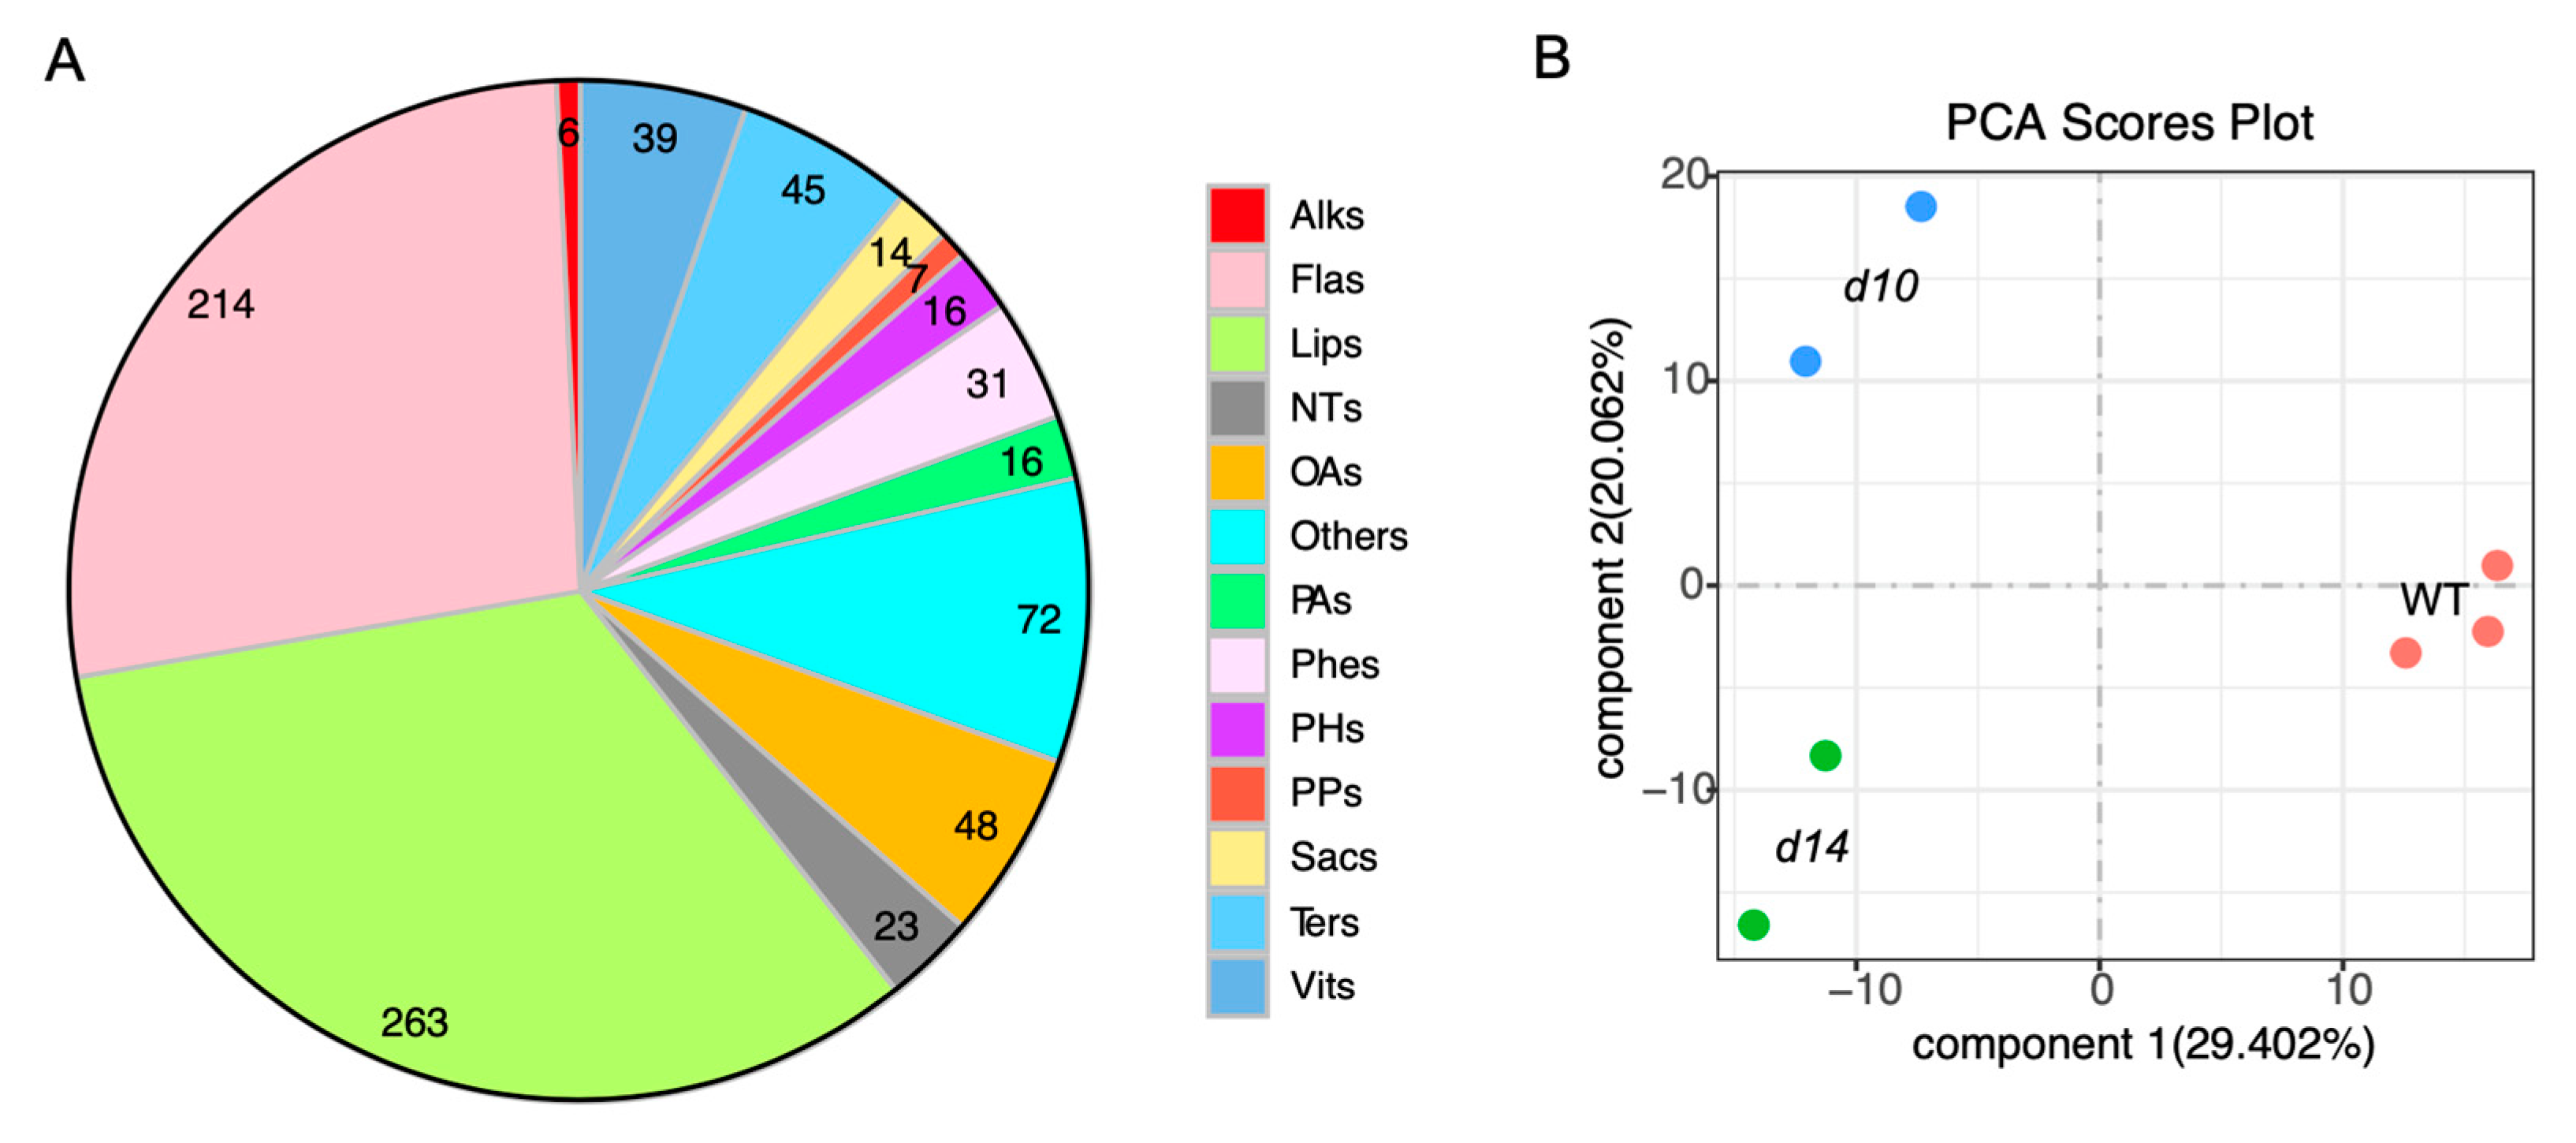
Abstract
:1. Introduction
2. Results
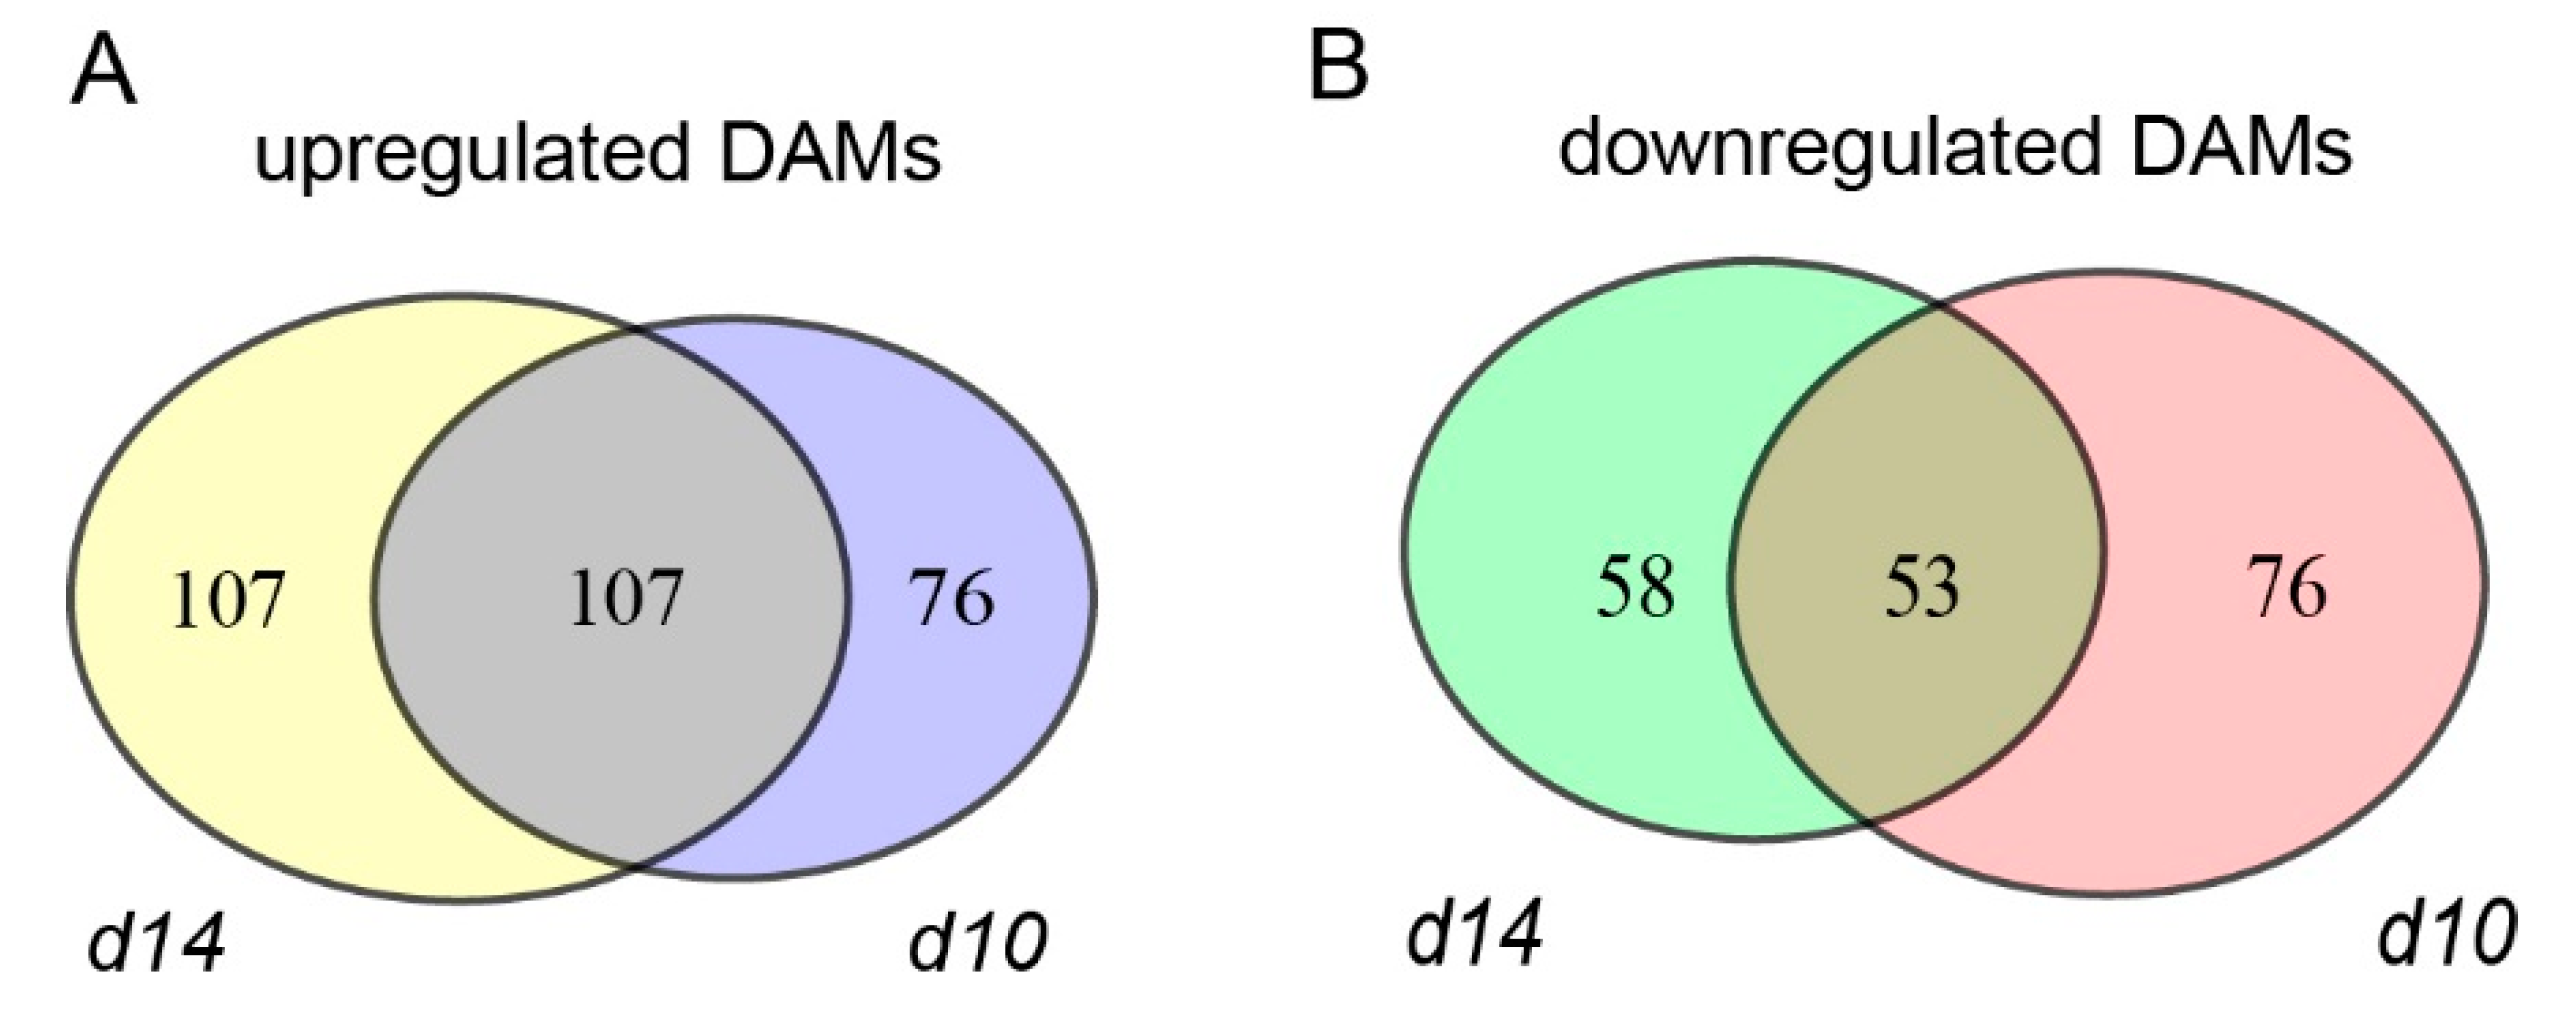
2.1. Metabolomic Analysis of SL Mutants and WT Plants
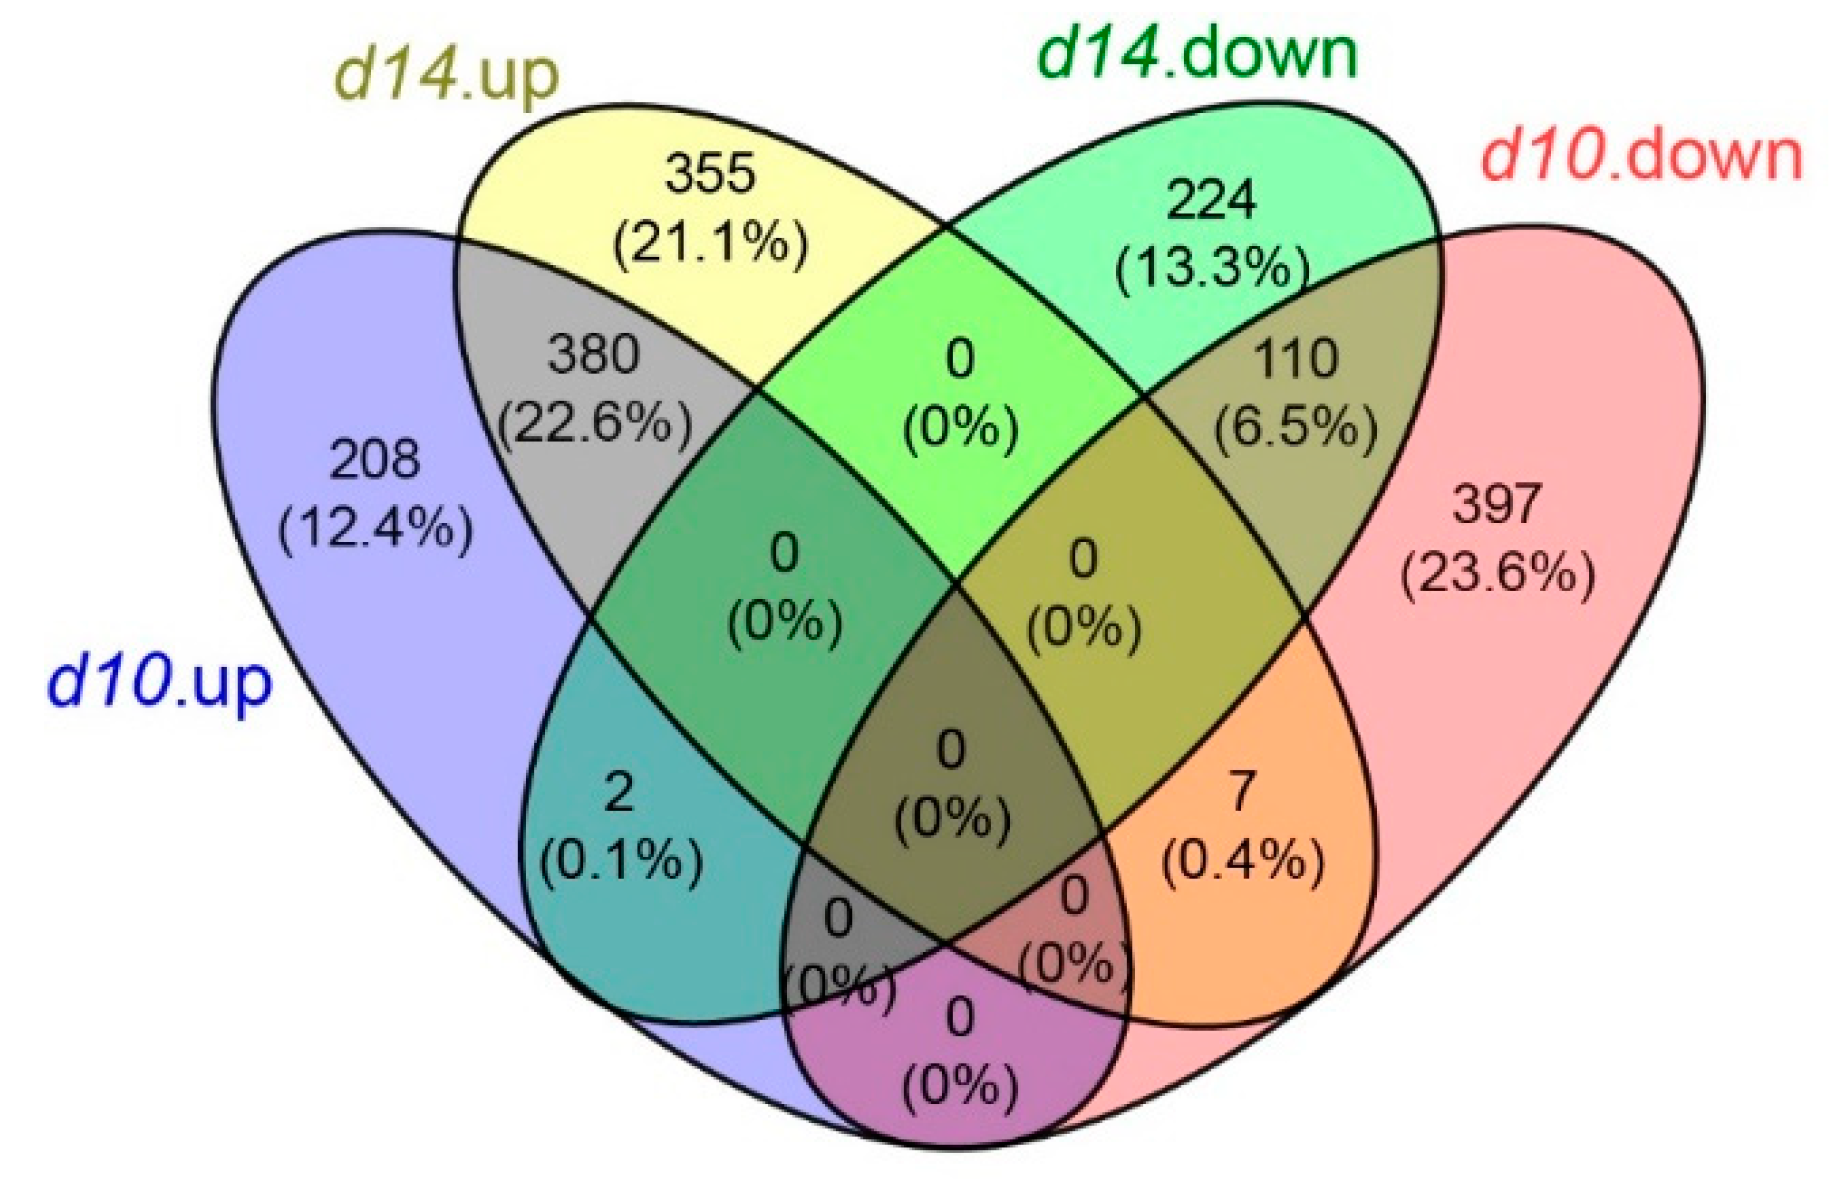
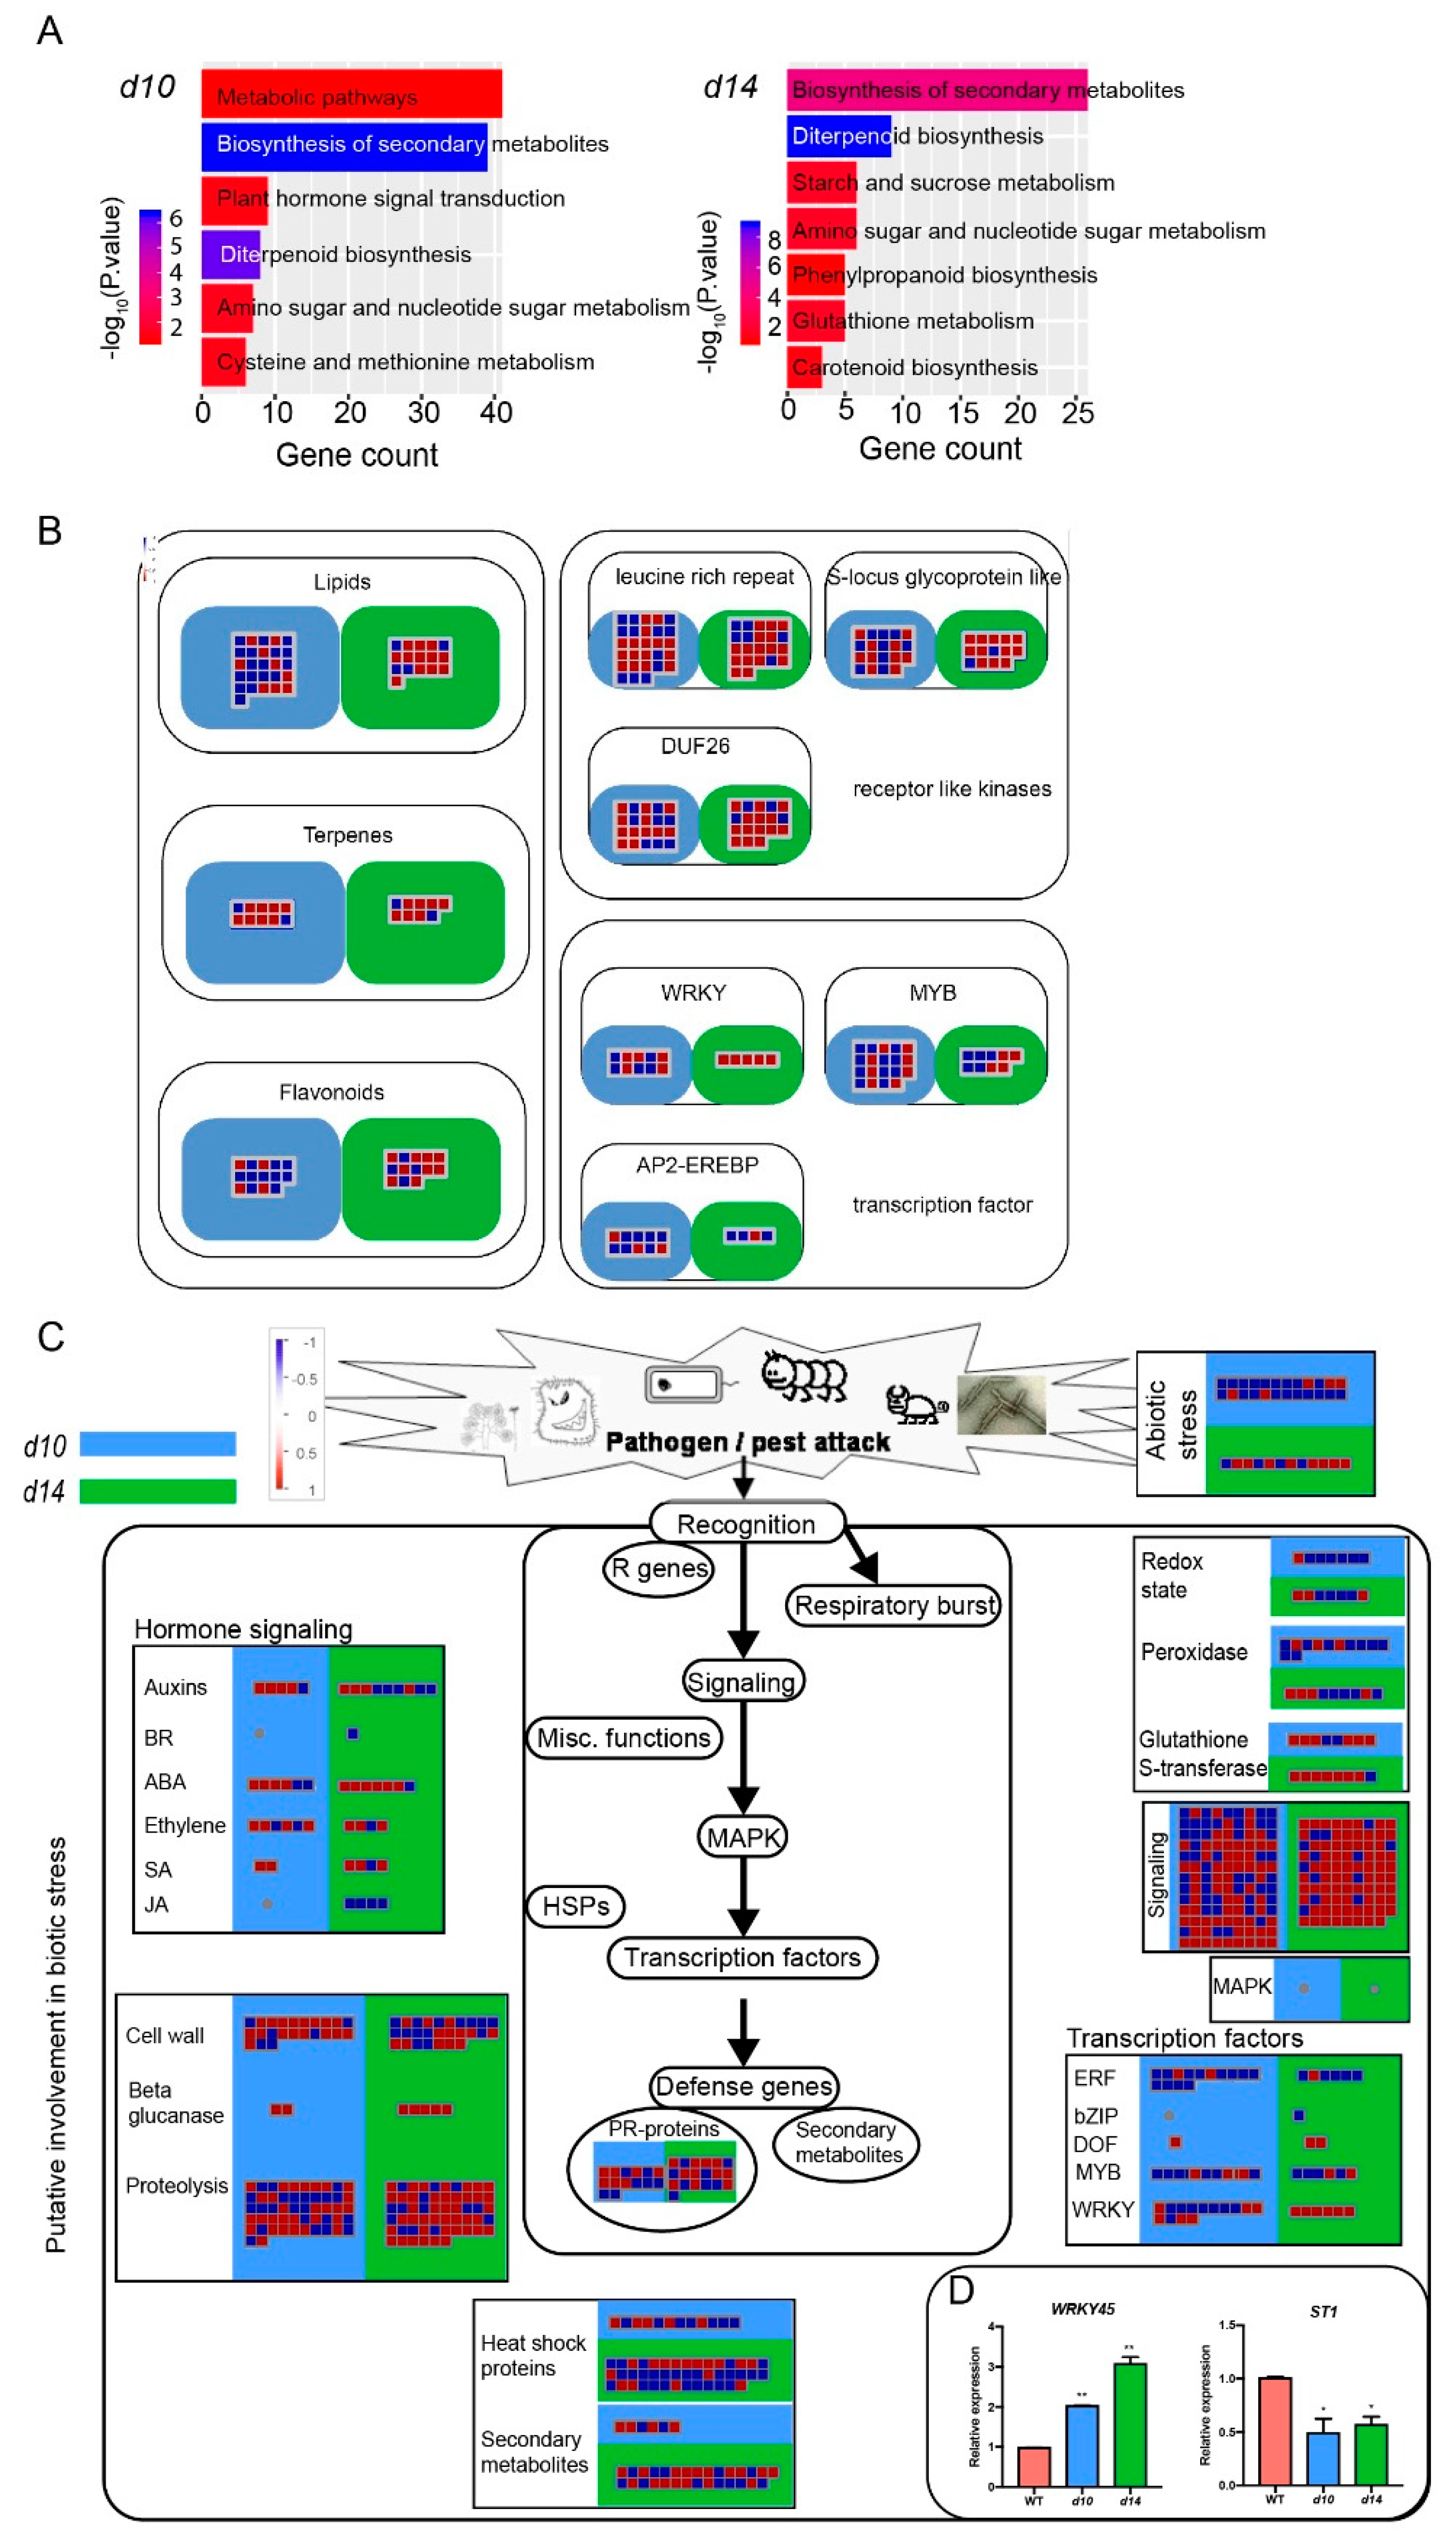
2.2. Transcriptome Profiling of the Leaves from WT and SL Mutants
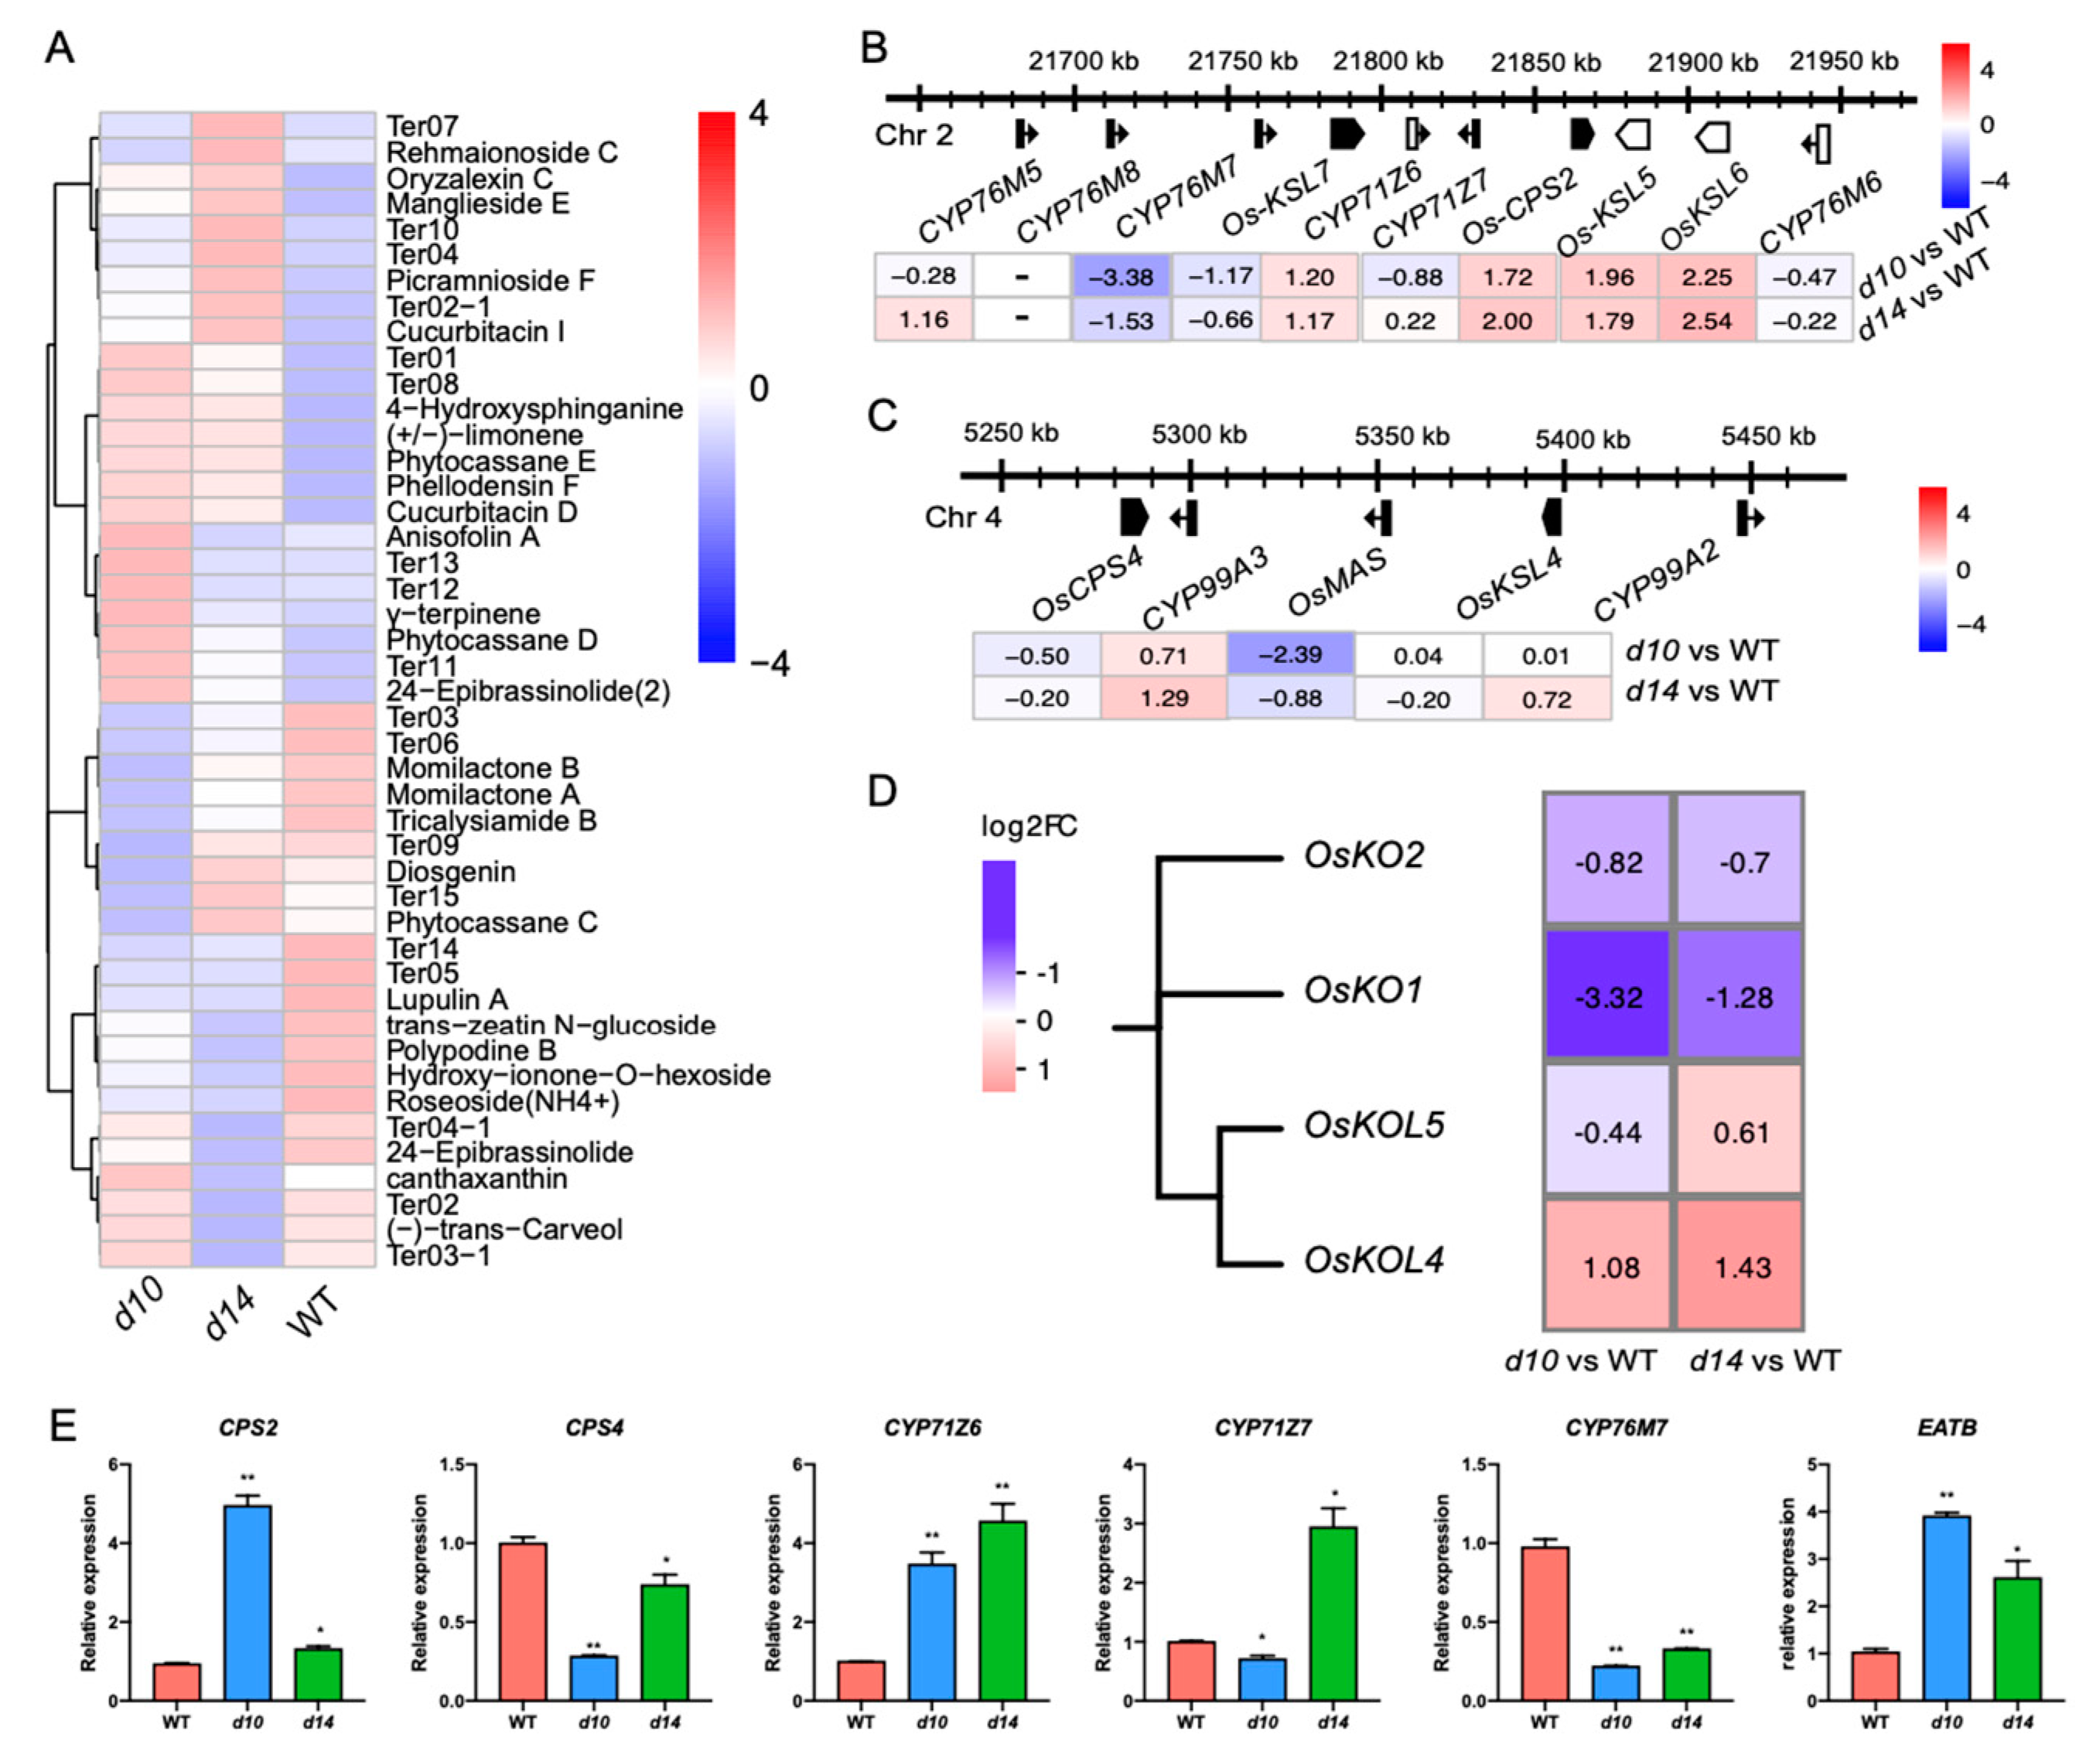
2.3. SLs Regulate Diterpenoid Phytoalexins via WRKY45-Modulated Clustered Genes
2.4. SLs Modulate a Series of Clustered or Tandemly Duplicated Genes
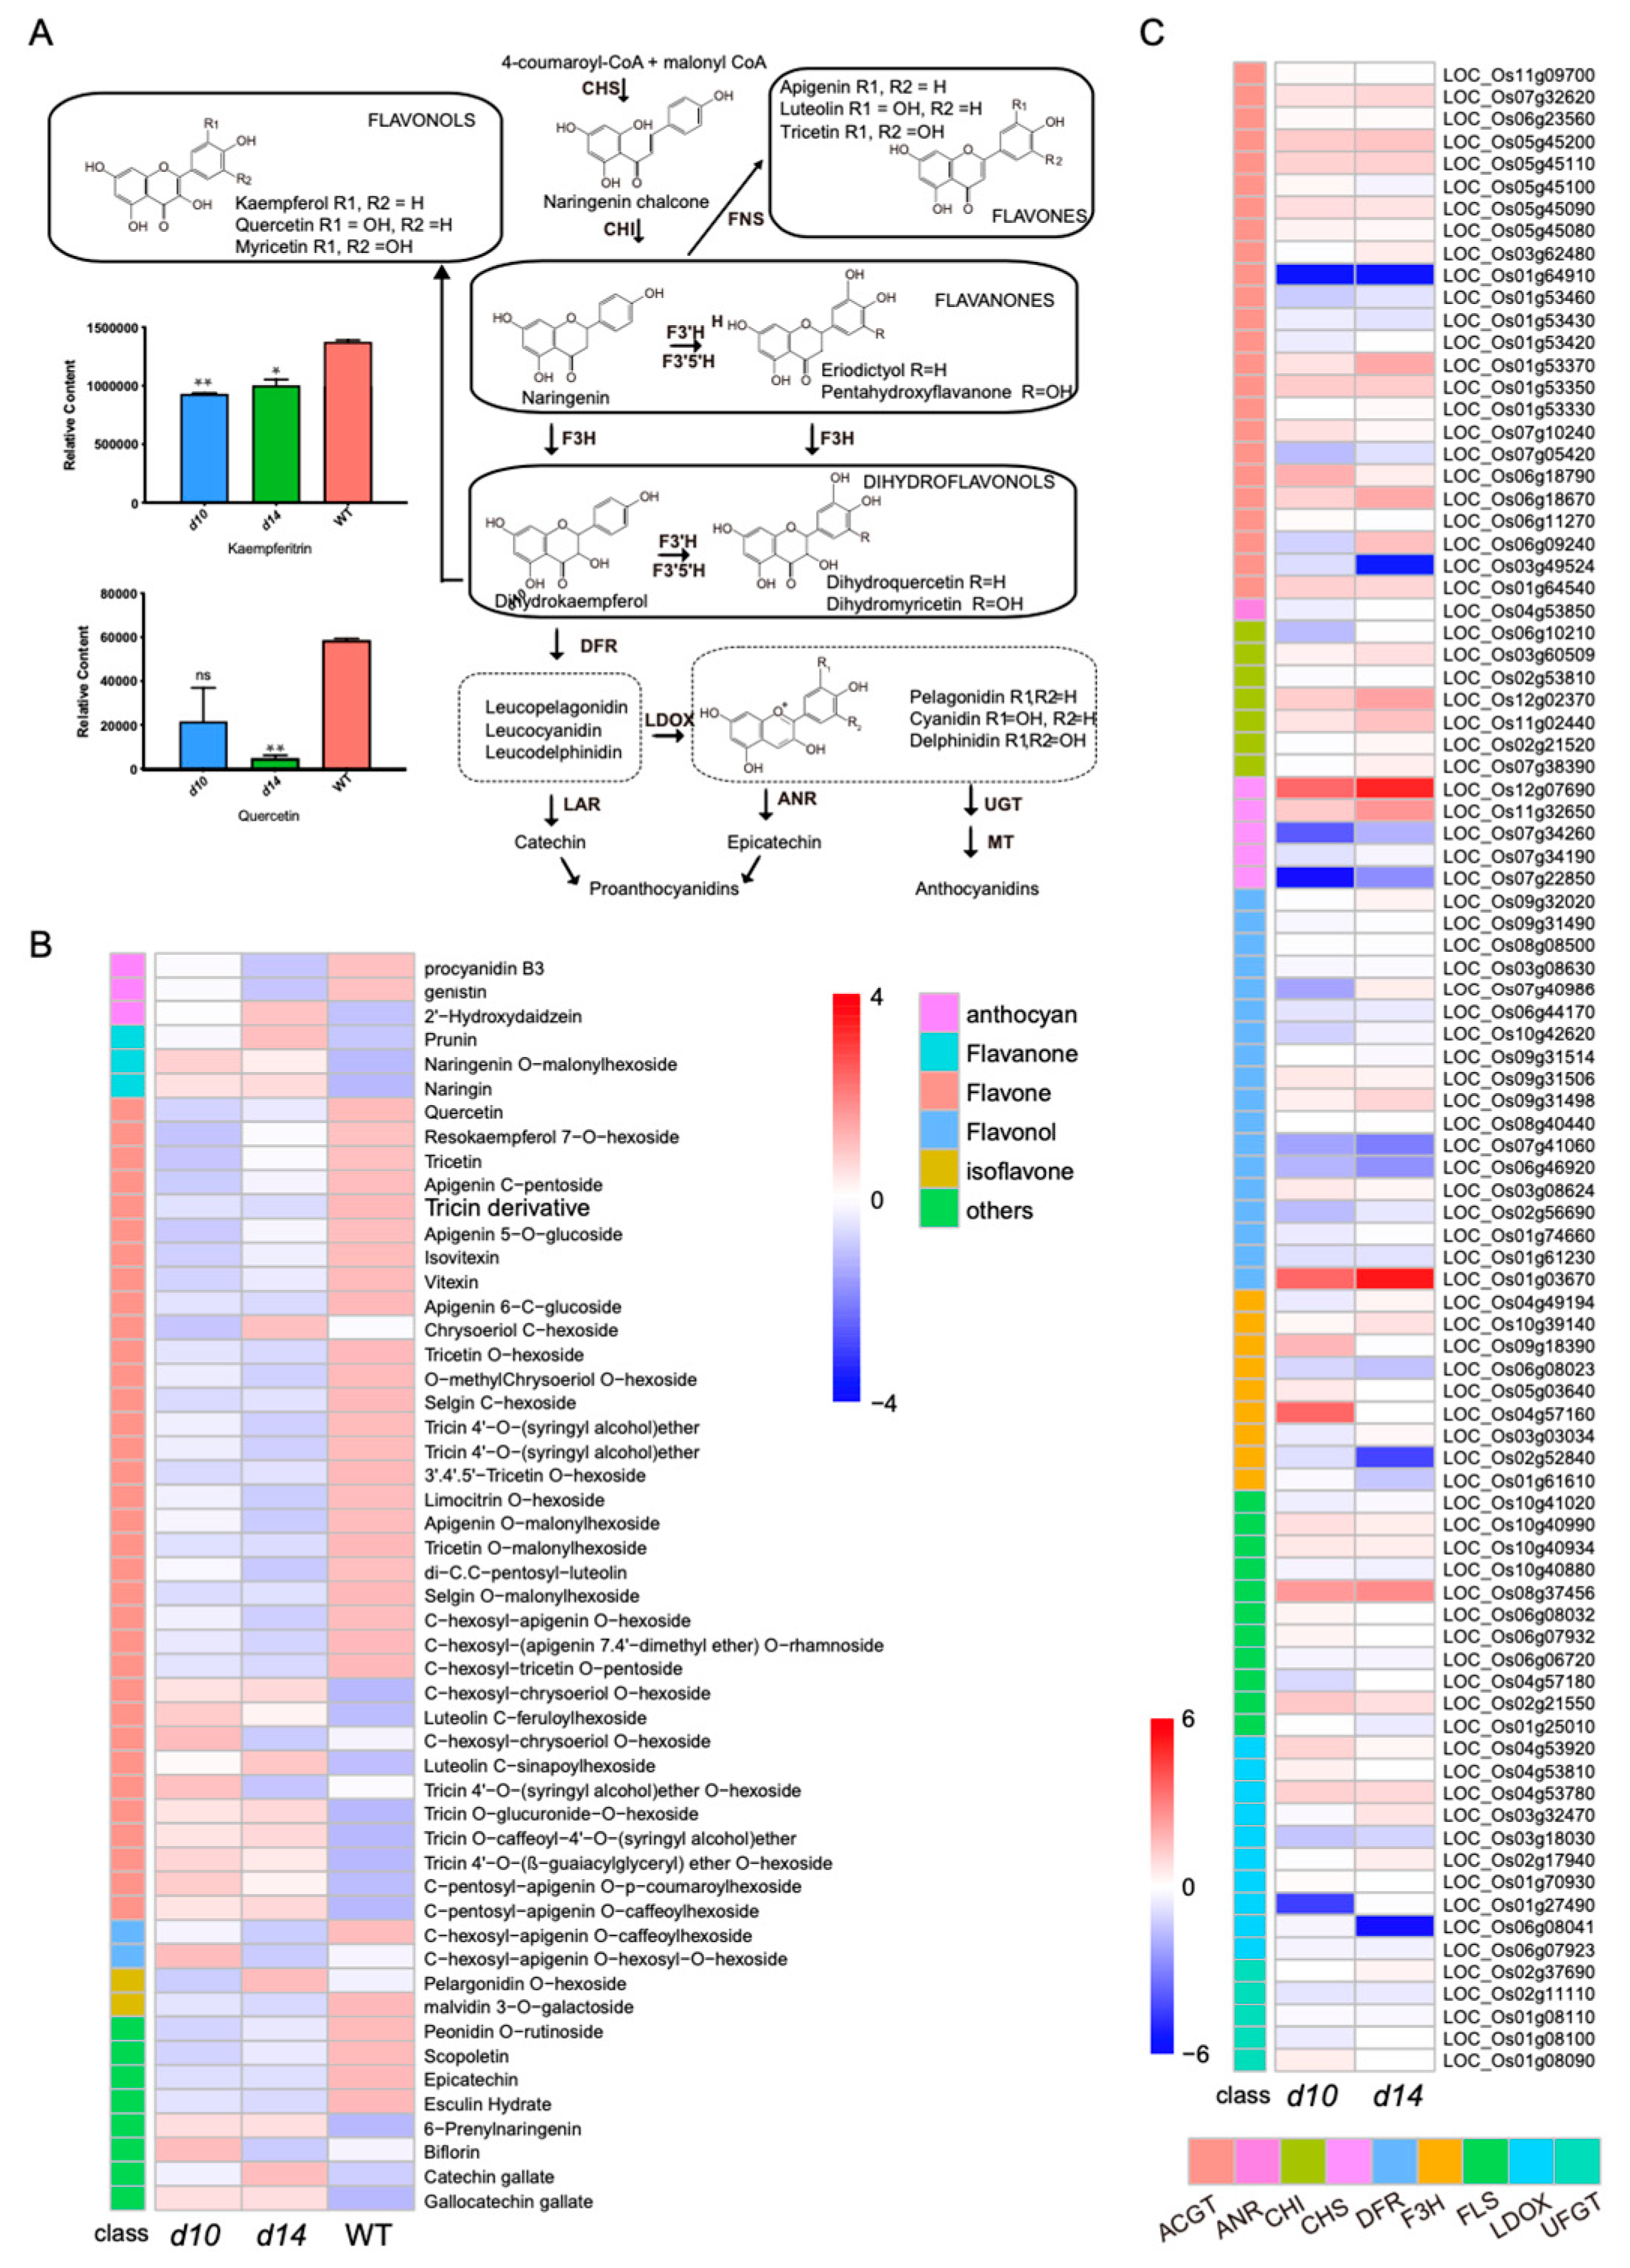
2.5. Affected Flavonoid Pathway in SL Mutants
2.6. Effects of SLs on Lipid Metabolism
3. Discussion
4. Materials and Methods
4.1. Plant Materials and Growth Conditions
4.2. Sample Preparation
4.3. Metabolite Profiling
4.4. RNA-Sequencing
4.5. RNA-Sequencing Data Analyses
4.6. Validation of RNA-Seq Data
4.7. Phylogenetic Tree Construction
4.8. Data Availability
Supplementary Materials
Author Contributions
Funding
Conflicts of Interest
Abbreviations
References
- Dixon, R.A.; Strack, D. Phytochemistry meets genome analysis, and beyond. Phytochemistry 2003, 62, 815–816. [Google Scholar] [CrossRef] [Green Version]
- Rai, A.; Saito, K.; Yamazaki, M. Integrated omics analysis of specialized metabolism in medicinal plants. Plant J. 2017, 90, 764–787. [Google Scholar] [CrossRef]
- Jeandet, P.; Clement, C.; Courot, E.; Cordelier, S. Modulation of phytoalexin biosynthesis in engineered plants for disease resistance. Int. J. Mol. Sci. 2013, 14, 14136–14170. [Google Scholar] [CrossRef] [PubMed] [Green Version]
- Wang, S.; Alseekh, S.; Fernie, A.R.; Luo, J. The structure and function of major plant metabolite modifications. Mol. Plant 2019, 12, 899–919. [Google Scholar] [CrossRef] [PubMed]
- Fang, C.; Luo, J. Metabolic GWAS-based dissection of genetic bases underlying the diversity of plant metabolism. Plant J. 2019, 97, 91–100. [Google Scholar] [CrossRef] [PubMed] [Green Version]
- Petrussa, E.; Braidot, E.; Zancani, M.; Peresson, C.; Bertolini, A.; Patui, S.; Vianello, A. Plant flavonoids—Biosynthesis, transport and involvement in stress responses. Int. J. Mol. Sci. 2013, 14, 14950–14973. [Google Scholar] [CrossRef]
- Weston, L.A.; Mathesius, U. Flavonoids: Their structure, biosynthesis and role in the rhizosphere, including allelopathy. J. Chem. Ecol. 2013, 39, 283–297. [Google Scholar] [CrossRef] [PubMed]
- Singh, B.; Kumar, A.; Malik, A.K. Flavonoids biosynthesis in plants and its further analysis by capillary electrophoresis. Electrophoresis 2017, 38, 820–832. [Google Scholar] [CrossRef] [PubMed]
- Sudheeran, P.K.; Ovadia, R.; Galsarker, O.; Maoz, I.; Sela, N.; Maurer, D.; Feygenberg, O.; Oren Shamir, M.; Alkan, N. Glycosylated flavonoids: Fruit’s concealed antifungal arsenal. New Phytol. 2020, 225, 1788–1798. [Google Scholar] [CrossRef] [PubMed]
- Tohge, T.; Fernie, A.R. Leveraging natural variance towards enhanced understanding of phytochemical sunscreens. Trends Plant Sci. 2017, 22, 308–315. [Google Scholar] [CrossRef] [PubMed]
- Peng, M.; Shahzad, R.; Gul, A.; Subthain, H.; Shen, S.; Lei, L.; Zheng, Z.; Zhou, J.; Lu, D.; Wang, S.; et al. Differentially evolved glucosyltransferases determine natural variation of rice flavone accumulation and UV-tolerance. Nat. Commun. 2017, 8, 1975. [Google Scholar] [CrossRef] [PubMed]
- Fang, C.; Zhang, H.; Wan, J.; Wu, Y.; Li, K.; Jin, C.; Chen, W.; Wang, S.; Wang, W.; Zhang, H.; et al. Control of leaf senescence by an MeOH-jasmonates cascade that is epigenetically regulated by OsSRT1 in rice. Mol. Plant 2016, 9, 1366–1378. [Google Scholar] [CrossRef] [PubMed] [Green Version]
- Zhang, F.; Guo, H.; Huang, J.; Yang, C.; Li, Y.; Wang, X.; Qu, L.; Liu, X.; Luo, J. A UV-B-responsive glycosyltransferase, OsUGT706C2, modulates flavonoid metabolism in rice. Sci. China Life Sci. 2020, 63, 1037–1052. [Google Scholar] [CrossRef] [PubMed]
- Li, K.; Wang, D.; Gong, L.; Lyu, Y.; Guo, H.; Chen, W.; Jin, C.; Liu, X.; Fang, C.; Luo, J. Comparative analysis of metabolome of rice seeds at three developmental stages using a recombinant inbred line population. Plant J. 2019, 100, 908–922. [Google Scholar] [CrossRef] [PubMed] [Green Version]
- Wen, W.; Li, D.; Li, X.; Gao, Y.; Li, W.; Li, H.; Liu, J.; Liu, H.; Chen, W.; Luo, J.; et al. Metabolome-based genome-wide association study of maize kernel leads to novel biochemical insights. Nat. Commun. 2014, 5, 3438. [Google Scholar] [CrossRef] [PubMed] [Green Version]
- Zhu, G.; Wang, S.; Huang, Z.; Zhang, S.; Liao, Q.; Zhang, C.; Lin, T.; Qin, M.; Peng, M.; Yang, C.; et al. Rewiring of the fruit metabolome in tomato breeding. Cell 2018, 172, 249–261.e12. [Google Scholar] [CrossRef] [Green Version]
- Shi, T.; Zhu, A.; Jia, J.; Hu, X.; Chen, J.; Liu, W.; Ren, X.; Sun, D.; Fernie, A.R.; Cui, F.; et al. Metabolomics analysis and metabolite-agronomic trait associations using kernels of wheat (Triticum aestivum) recombinant inbred lines. Plant J. 2020, 103, 279–292. [Google Scholar] [CrossRef] [Green Version]
- Nutzmann, H.-W.; Scazzocchio, C.; Osbourn, A. Metabolic gene clusters in eukaryotes. Ann. Rev. Genet. 2018, 52, 159–183. [Google Scholar] [CrossRef]
- Fernie, A.R.; Tohge, T. Location, location, location--no more! The unravelling of chromatin remodeling regulatory aspects of plant metabolic gene clusters. New Phytol. 2015, 205, 458–460. [Google Scholar] [CrossRef]
- Mugford, S.T.; Louveau, T.; Melton, R.; Qi, X.; Bakht, S.; Hill, L.; Tsurushima, T.; Honkanen, S.; Rosser, S.J.; Lomonossoff, G.P.; et al. Modularity of plant metabolic gene clusters: A trio of linked genes that are collectively required for acylation of triterpenes in oat. Plant Cell 2013, 25, 1078–1092. [Google Scholar] [CrossRef] [Green Version]
- Osbourn, A. Secondary metabolic gene clusters: Evolutionary toolkits for chemical innovation. Trends Genet. 2010, 26, 449–457. [Google Scholar] [CrossRef]
- Boycheva, S.; Daviet, L.; Wolfender, J.L.; Fitzpatrick, T.B. The rise of operon-like gene clusters in plants. Trends Plant Sci. 2014, 19, 447–459. [Google Scholar] [CrossRef]
- Schlapfer, P.; Zhang, P.; Wang, C.; Kim, T.; Banf, M.; Chae, L.; Dreher, K.; Chavali, A.K.; Nilo-Poyanco, R.; Bernard, T.; et al. Genome-wide prediction of metabolic enzymes, pathways, and gene clusters in plants. Plant Physiol. 2017, 173, 2041–2059. [Google Scholar] [CrossRef] [PubMed] [Green Version]
- King, A.J.; Brown, G.D.; Gilday, A.D.; Larson, T.R.; Grahama, I.A. Production of bioactive diterpenoids in the euphorbiaceae depends on evolutionarily conserved gene clusters. Plant Cell 2014, 26, 3286–3298. [Google Scholar] [CrossRef] [PubMed] [Green Version]
- Wu, Y.; Wang, Q.; Hillwig, M.L.; Peters, R.J. Picking sides: Distinct roles for CYP76M6 and CYP76M8 in rice oryzalexin biosynthesis. Biochem. J. 2013, 454, 209–216. [Google Scholar] [CrossRef] [Green Version]
- Swaminathan, S.; Morrone, D.; Wang, Q.; Fulton, D.B.; Peters, R.J. CYP76M7 is an ent-cassadiene C11alpha-hydroxylase defining a second multifunctional diterpenoid biosynthetic gene cluster in rice. Plant Cell 2009, 21, 3315–3325. [Google Scholar] [CrossRef] [PubMed] [Green Version]
- Akagi, A.; Fukushima, S.; Okada, K.; Jiang, C.J.; Yoshida, R.; Nakayama, A.; Shimono, M.; Sugano, S.; Yamane, H.; Takatsuji, H. WRKY45-dependent priming of diterpenoid phytoalexin biosynthesis in rice and the role of cytokinin in triggering the reaction. Plant Mol. Biol. 2014, 86, 171–183. [Google Scholar] [CrossRef] [Green Version]
- Yamamura, C.; Mizutani, E.; Okada, K.; Nakagawa, H.; Fukushima, S.; Tanaka, A.; Maeda, S.; Kamakura, T.; Yamane, H.; Takatsuji, H.; et al. Diterpenoid phytoalexin factor, a bHLH transcription factor, plays a central role in the biosynthesis of diterpenoid phytoalexins in rice. Plant J. 2015, 84, 1100–1113. [Google Scholar] [CrossRef]
- Okada, A.; Okada, K.; Miyamoto, K.; Koga, J.; Shibuya, N.; Nojiri, H.; Yamane, H. OsTGAP1, a bZIP transcription factor, coordinately regulates the inductive production of diterpenoid phytoalexins in rice. J. Biol. Chem. 2009, 284, 26510–26518. [Google Scholar] [CrossRef] [Green Version]
- Cheng, H.; Liu, H.; Deng, Y.; Xiao, J.; Li, X.; Wang, S. The WRKY45-2 WRKY13 WRKY42 transcriptional regulatory cascade is required for rice resistance to fungal pathogen. Plant Physiol. 2015, 167, 1087–1099. [Google Scholar] [CrossRef] [Green Version]
- Matsushita, A.; Inoue, H.; Goto, S.; Nakayama, A.; Sugano, S.; Hayashi, N.; Takatsuji, H. Nuclear ubiquitin proteasome degradation affects WRKY45 function in the rice defense program. Plant J. 2013, 73, 302–313. [Google Scholar] [CrossRef] [PubMed]
- Tao, Z.; Kou, Y.; Liu, H.; Li, X.; Xiao, J.; Wang, S. OsWRKY45 alleles play different roles in abscisic acid signalling and salt stress tolerance but similar roles in drought and cold tolerance in rice. J. Exp. Bot. 2011, 62, 4863–4874. [Google Scholar] [CrossRef] [PubMed]
- Xu, G.; Cao, J.; Wang, X.; Chen, Q.; Jin, W.; Li, Z.; Tian, F. Evolutionary metabolomics identifies substantial metabolic divergence between maize and its wild ancestor, teosinte. Plant Cell 2019, 31, 1990–2009. [Google Scholar] [CrossRef] [PubMed] [Green Version]
- Zhou, Y.; Ma, Y.; Zeng, J.; Duan, L.; Xue, X.; Wang, H.; Lin, T.; Liu, Z.; Zeng, K.; Zhong, Y.; et al. Convergence and divergence of bitterness biosynthesis and regulation in Cucurbitaceae. Nat. Plants 2016, 2, 16183. [Google Scholar] [CrossRef] [PubMed] [Green Version]
- Peng, M.; Gao, Y.; Chen, W.; Wang, W.; Shen, S.; Shi, J.; Wang, C.; Zhang, Y.; Zou, L.; Wang, S.; et al. Evolutionarily distinct BAHD N-acyltransferases are responsible for natural variation of aromatic amine conjugates in rice. Plant Cell 2016, 28, 1533–1550. [Google Scholar] [CrossRef] [PubMed] [Green Version]
- Schilmiller, A.L.; Moghe, G.D.; Fan, P.X.; Ghosh, B.; Ning, J.; Jones, A.D.; Last, R.L. Functionally divergent alleles and duplicated loci encoding an acyltransferase contribute to acylsugar metabolite diversity in solanum trichomes. Plant Cell 2015, 27, 1002–1017. [Google Scholar] [CrossRef] [Green Version]
- Cardoso, C.; Zhang, Y.X.; Jamil, M.; Hepworth, J.; Charnikhova, T.; Dimkpa, S.O.N.; Meharg, C.; Wright, M.H.; Liu, J.W.; Meng, X.B.; et al. Natural variation of rice strigolactone biosynthesis is associated with the deletion of two MAX1 orthologs. Proc. Natl. Acad. Sci. USA 2014, 111, 2379–2384. [Google Scholar] [CrossRef] [Green Version]
- Al-Babili, S.; Bouwmeester, H.J. Strigolactones, a novel carotenoid-derived plant hormone. Ann. Rev. Plant Biol. 2015, 66, 161–186. [Google Scholar] [CrossRef]
- Alder, A.; Jamil, M.; Marzorati, M.; Bruno, M.; Vermathen, M.; Bigler, P.; Ghisla, S.; Bouwmeester, H.; Beyer, P.; Al-Babili, S. The path from beta-carotene to carlactone, a strigolactone-like plant hormone. Science 2012, 335, 1348–1351. [Google Scholar] [CrossRef] [Green Version]
- Zhang, Y.; van Dijk, A.D.J.; Scaffidi, A.; Flematti, G.R.; Hofmann, M.; Charnikhova, T.; Verstappen, F.; Hepworth, J.; van der Krol, S.; Leyser, O.; et al. Rice cytochrome P450 MAX1 homologs catalyze distinct steps in strigolactone biosynthesis. Nat. Chem. Biol. 2014, 10, 1028–1033. [Google Scholar] [CrossRef]
- Challis, R.; Hepworth, J.; Mouchel, C.; Waites, R.; Leyser, O. A role for MORE AXILLARY GROWTH1 (MAX1) in evolutionary diversity in strigolactone signaling upstream of MAX2. Plant Physiol. 2013. [Google Scholar] [CrossRef] [PubMed] [Green Version]
- Yoneyama, K.; Mori, N.; Sato, T.; Yoda, A.; Xie, X.; Okamoto, M.; Iwanaga, M.; Ohnishi, T.; Nishiwaki, H.; Asami, T.; et al. Conversion of carlactone to carlactonoic acid is a conserved function of MAX1 homologs in strigolactone biosynthesis. New Phytol. 2018, 218, 1522–1533. [Google Scholar] [CrossRef] [PubMed] [Green Version]
- Song, X.; Lu, Z.; Yu, H.; Shao, G.; Xiong, J.; Meng, X.; Jing, Y.; Liu, G.; Xiong, G.; Duan, J.; et al. IPA1 functions as a downstream transcription factor repressed by D53 in strigolactone signaling in rice. Cell Res. 2017, 27, 1128–1141. [Google Scholar] [CrossRef] [PubMed]
- Wang, J.; Zhou, L.; Shi, H.; Chern, M.; Yu, H.; Yi, H.; He, M.; Yin, J.J.; Zhu, X.B.; Li, Y.; et al. A single transcription factor promotes both yield and immunity in rice. Science 2018, 361, 1026–1028. [Google Scholar] [CrossRef] [Green Version]
- Miura, K.; Ikeda, M.; Matsubara, A.; Song, X.J.; Ito, M.; Asano, K.; Matsuoka, M.; Kitano, H.; Ashikari, M. OsSPL14 promotes panicle branching and higher grain productivity in rice. Nat. Genet. 2010, 42, 545–549. [Google Scholar] [CrossRef]
- Jiao, Y.; Wang, Y.; Xue, D.; Wang, J.; Yan, M.; Liu, G.; Dong, G.; Zeng, D.; Lu, Z.; Zhu, X.; et al. Regulation of OsSPL14 by OsmiR156 defines ideal plant architecture in rice. Nat. Genet. 2010, 42, 541–544. [Google Scholar] [CrossRef]
- Bertheloot, J.; Barbier, F.; Boudon, F.; Perez-Garcia, M.D.; Peron, T.; Citerne, S.; Dun, E.; Beveridge, C.; Godin, C.; Sakr, S. Sugar availability suppresses the auxin-induced strigolactone pathway to promote bud outgrowth. New Phytol. 2020, 225, 866–879. [Google Scholar] [CrossRef] [Green Version]
- Chen, W.; Gong, L.; Guo, Z.; Wang, W.; Zhang, H.; Liu, X.; Yu, S.; Xiong, L.; Luo, J. A novel integrated method for large-scale detection, identification, and quantification of widely targeted metabolites: Application in the study of rice metabolomics. Mol. Plant 2013, 6, 1769–1780. [Google Scholar] [CrossRef] [Green Version]
- Liu, X.; Zhou, X.; Li, K.; Wang, D.; Ding, Y.; Liu, X.; Luo, J.; Fang, C. A simple and efficient cloning system for CRISPR/Cas9-mediated genome editing in rice. Peerj 2020, 8, e8491. [Google Scholar] [CrossRef] [Green Version]
- Mashiguchi, K.; Sasaki, E.; Shimada, Y.; Nagae, M.; Ueno, K.; Nakano, T.; Yoneyama, K.; Suzuki, Y.; Asami, T. Feedback-regulation of strigolactone biosynthetic genes and strigolactone-regulated genes in Arabidopsis. Biosci. Biotechnol. Biochem. 2009, 73, 2460–2465. [Google Scholar] [CrossRef] [Green Version]
- Sun, H.; Tao, J.; Liu, S.; Huang, S.; Chen, S.; Xie, X.; Yoneyama, K.; Zhang, Y.; Xu, G. Strigolactones are involved in phosphate- and nitrate-deficiency-induced root development and auxin transport in rice. J. Exp. Bot. 2014. [Google Scholar] [CrossRef] [PubMed]
- Tao, Z.; Liu, H.; Qiu, D.; Zhou, Y.; Li, X.; Xu, C.; Wang, S. A pair of allelic WRKY genes play opposite roles in rice-bacteria interactions. Plant Physiol. 2009, 151, 936–948. [Google Scholar] [CrossRef] [Green Version]
- Okada, A.; Shimizu, T.; Okada, K.; Kuzuyama, T.; Koga, J.; Shibuya, N.; Nojiri, H.; Yamane, H. Elicitor induced activation of the methylerythritol phosphate pathway toward phytoalexins biosynthesis in rice. Plant Mol. Biol. 2007, 65, 177–187. [Google Scholar] [CrossRef] [PubMed]
- Qi, W.; Sun, F.; Wang, Q.; Chen, M.; Huang, Y.; Feng, Y.-Q.; Luo, X.; Yang, J. Rice ethylene-response AP2/ERF factor OsEATB restricts internode elongation by down-regulating a gibberellin biosynthetic gene. Plant Physiol. 2011, 157, 216–228. [Google Scholar] [CrossRef] [PubMed] [Green Version]
- Han, X. Lipidomics for studying metabolism. Nat. Rev. Endocrinol. 2016, 12, 668–679. [Google Scholar] [CrossRef]
- Janda, M.; Planchais, S.; Djafi, N.; Martinec, J.; Burketova, L.; Valentova, O.; Zachowski, A.; Ruelland, E. Phosphoglycerolipids are master players in plant hormone signal transduction. Plant Cell Rep. 2013, 32, 839–851. [Google Scholar] [CrossRef]
- Bobenchik, A.M.; Augagneur, Y.; Hao, B.; Hoch, J.C.; Ben Mamoun, C. Phosphoethanolamine methyltransferases in phosphocholine biosynthesis: Functions and potential for antiparasite therapy. FEMS Microbiol. Rev. 2011, 35, 609–619. [Google Scholar] [CrossRef] [Green Version]
- Yu, J.; Li, Y.; Tang, W.; Liu, J.; Lu, B.-R.; Liu, Y. The accumulation of glycine betaine is dependent on choline monooxygenase (OsCMO), not on phosphoethanolamine N-methyltransferase (OsPEAMT1), in rice (Oryza sativa L. ssp. japonica). Plant Mol. Biol. Rep. 2014, 32, 916–922. [Google Scholar] [CrossRef]
- Mehra, P.; Pandey, B.K.; Giri, J. Comparative morphophysiological analyses and molecular profiling reveal Pi-efficient strategies of a traditional rice genotype. Front. Plant Sci. 2015, 6, 1184. [Google Scholar] [CrossRef] [Green Version]
- Cheng, L.; Bucciarelli, B.; Liu, J.; Zinn, K.; Miller, S.; Patton-Vogt, J.; Allan, D.; Shen, J.; Vance, C.P. White lupin cluster root acclimation to phosphorus deficiency and root hair development involve unique glycerophosphodiester phosphodiesterases. Plant Physiol. 2011, 156, 1131–1148. [Google Scholar] [CrossRef] [Green Version]
- Dissanayaka, D.M.S.B.; Plaxton, W.C.; Lambers, H.; Siebers, M.; Marambe, B.; Wasaki, J. Molecular mechanisms underpinning phosphorus-use efficiency in rice. Plant Cell Environ. 2018, 41, 1483–1496. [Google Scholar] [CrossRef] [PubMed]
- Wang, L.; Wang, B.; Yu, H.; Guo, H.; Lin, T.; Kou, L.; Wang, A.; Shao, N.; Ma, H.; Xiong, G.; et al. Transcriptional regulation of strigolactone signalling in Arabidopsis. Nature 2020, 583, 277–281. [Google Scholar] [CrossRef] [PubMed]
- Fang, C.; Fernie, A.R.; Luo, J. Exploring the diversity of plant metabolism. Trends Plant Sci. 2019, 24, 83–98. [Google Scholar] [CrossRef] [PubMed]
- Conn, C.E.; Bythell-Douglas, R.; Neumann, D.; Yoshida, S.; Whittington, B.; Westwood, J.H.; Shirasu, K.; Bond, C.S.; Dyer, K.A.; Nelson, D.C. Convergent evolution of strigolactone perception enabled host detection in parasitic plants. Science 2015, 349, 540–543. [Google Scholar] [CrossRef] [Green Version]
- Wakabayashi, T.; Hamana, M.; Mori, A.; Akiyama, R.; Ueno, K.; Osakabe, K.; Osakabe, Y.; Suzuki, H.; Takikawa, H.; Mizutani, M.; et al. Direct conversion of carlactonoic acid to orobanchol by cytochrome P450 CYP722C in strigolactone biosynthesis. Sci. Adv. 2019, 5, eaax9067. [Google Scholar] [CrossRef] [Green Version]
- Nutzmann, H.W.; Huang, A.; Osbourn, A. Plant metabolic clusters—From genetics to genomics. New Phytol. 2016, 211, 771–789. [Google Scholar] [CrossRef] [Green Version]
- Wu, K.; Wang, S.; Song, W.; Zhang, J.; Wang, Y.; Liu, Q.; Yu, J.; Ye, Y.; Li, S.; Chen, J.; et al. Enhanced sustainable green revolution yield via nitrogen-responsive chromatin modulation in rice. Science 2020, 367. [Google Scholar] [CrossRef]
- Lantzouni, O.; Klermund, C.; Schwechheimer, C. Largely additive effects of gibberellin and strigolactone on gene expression in Arabidopsis thaliana seedlings. Plant J. 2017, 92, 924–938. [Google Scholar] [CrossRef] [Green Version]
- Ito, S.; Yamagami, D.; Umehara, M.; Hanada, A.; Yoshida, S.; Sasaki, Y.; Yajima, S.; Kyozuka, J.; Ueguchi-Tanaka, M.; Matsuoka, M.; et al. Regulation of strigolactone biosynthesis by gibberellin signaling. Plant Physiol. 2017, 174, 1250–1259. [Google Scholar] [CrossRef]
- Fang, C.; Li, K.; Wu, Y.; Wang, D.; Zhou, J.; Liu, X.; Li, Y.; Jin, C.; Liu, X.; Mur, L.A.J.; et al. OsTSD2-mediated cell wall modification affects ion homeostasis and salt tolerance. Plant Cell Environ. 2019, 42, 1503–1512. [Google Scholar] [CrossRef]
- Dresen, S.; Ferreiros, N.; Gnann, H.; Zimmermann, R.; Weinmann, W. Detection and identification of 700 drugs by multi-target screening with a 3200 Q TRAP LC-MS/MS system and library searching. Anal. Bioanal. Chem. 2010, 396, 2425–2434. [Google Scholar] [CrossRef] [PubMed]
- Matsuda, F.; Okazaki, Y.; Oikawa, A.; Kusano, M.; Nakabayashi, R.; Kikuchi, J.; Yonemaru, J.; Ebana, K.; Yano, M.; Saito, K. Dissection of genotype-phenotype associations in rice grains using metabolome quantitative trait loci analysis. Plant J. 2012, 70, 624–636. [Google Scholar] [CrossRef]
- Rychlik, W. Oligo 7 primer analysis software. Methods Mol. Biol. 2007, 402, 35–60. [Google Scholar] [CrossRef]
- Wang, Q.; Hillwig, M.L.; Okada, K.; Yamazaki, K.; Wu, Y.; Swaminathan, S.; Yamane, H.; Peters, R.J. Characterization of CYP76M5-8 indicates metabolic plasticity within a plant biosynthetic gene cluster. J. Biol. Chem. 2012, 287, 6159–6168. [Google Scholar] [CrossRef] [Green Version]
- Ye, Z.; Yamazaki, K.; Minoda, H.; Miyamoto, K.; Miyazaki, S.; Kawaide, H.; Yajima, A.; Nojiri, H.; Yamane, H.; Okada, K. In planta functions of cytochrome P450 monooxygenase genes in the phytocassane biosynthetic gene cluster on rice chromosome 2. Biosci. Biotechnol. Biochem. 2018, 82, 1021–1030. [Google Scholar] [CrossRef] [Green Version]


Publisher’s Note: MDPI stays neutral with regard to jurisdictional claims in published maps and institutional affiliations. |
© 2020 by the authors. Licensee MDPI, Basel, Switzerland. This article is an open access article distributed under the terms and conditions of the Creative Commons Attribution (CC BY) license (http://creativecommons.org/licenses/by/4.0/).
Share and Cite
Zhou, X.; Liu, L.; Li, Y.; Li, K.; Liu, X.; Zhou, J.; Yang, C.; Liu, X.; Fang, C.; Luo, J. Integrative Metabolomic and Transcriptomic Analyses Reveal Metabolic Changes and Its Molecular Basis in Rice Mutants of the Strigolactone Pathway. Metabolites 2020, 10, 425. https://doi.org/10.3390/metabo10110425
Zhou X, Liu L, Li Y, Li K, Liu X, Zhou J, Yang C, Liu X, Fang C, Luo J. Integrative Metabolomic and Transcriptomic Analyses Reveal Metabolic Changes and Its Molecular Basis in Rice Mutants of the Strigolactone Pathway. Metabolites. 2020; 10(11):425. https://doi.org/10.3390/metabo10110425
Chicago/Turabian StyleZhou, Xiujuan, Ling Liu, Yufei Li, Kang Li, Xiaoli Liu, Junjie Zhou, Chenkun Yang, Xianqing Liu, Chuanying Fang, and Jie Luo. 2020. "Integrative Metabolomic and Transcriptomic Analyses Reveal Metabolic Changes and Its Molecular Basis in Rice Mutants of the Strigolactone Pathway" Metabolites 10, no. 11: 425. https://doi.org/10.3390/metabo10110425