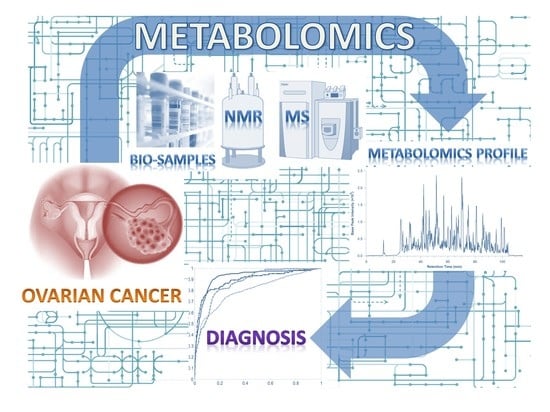
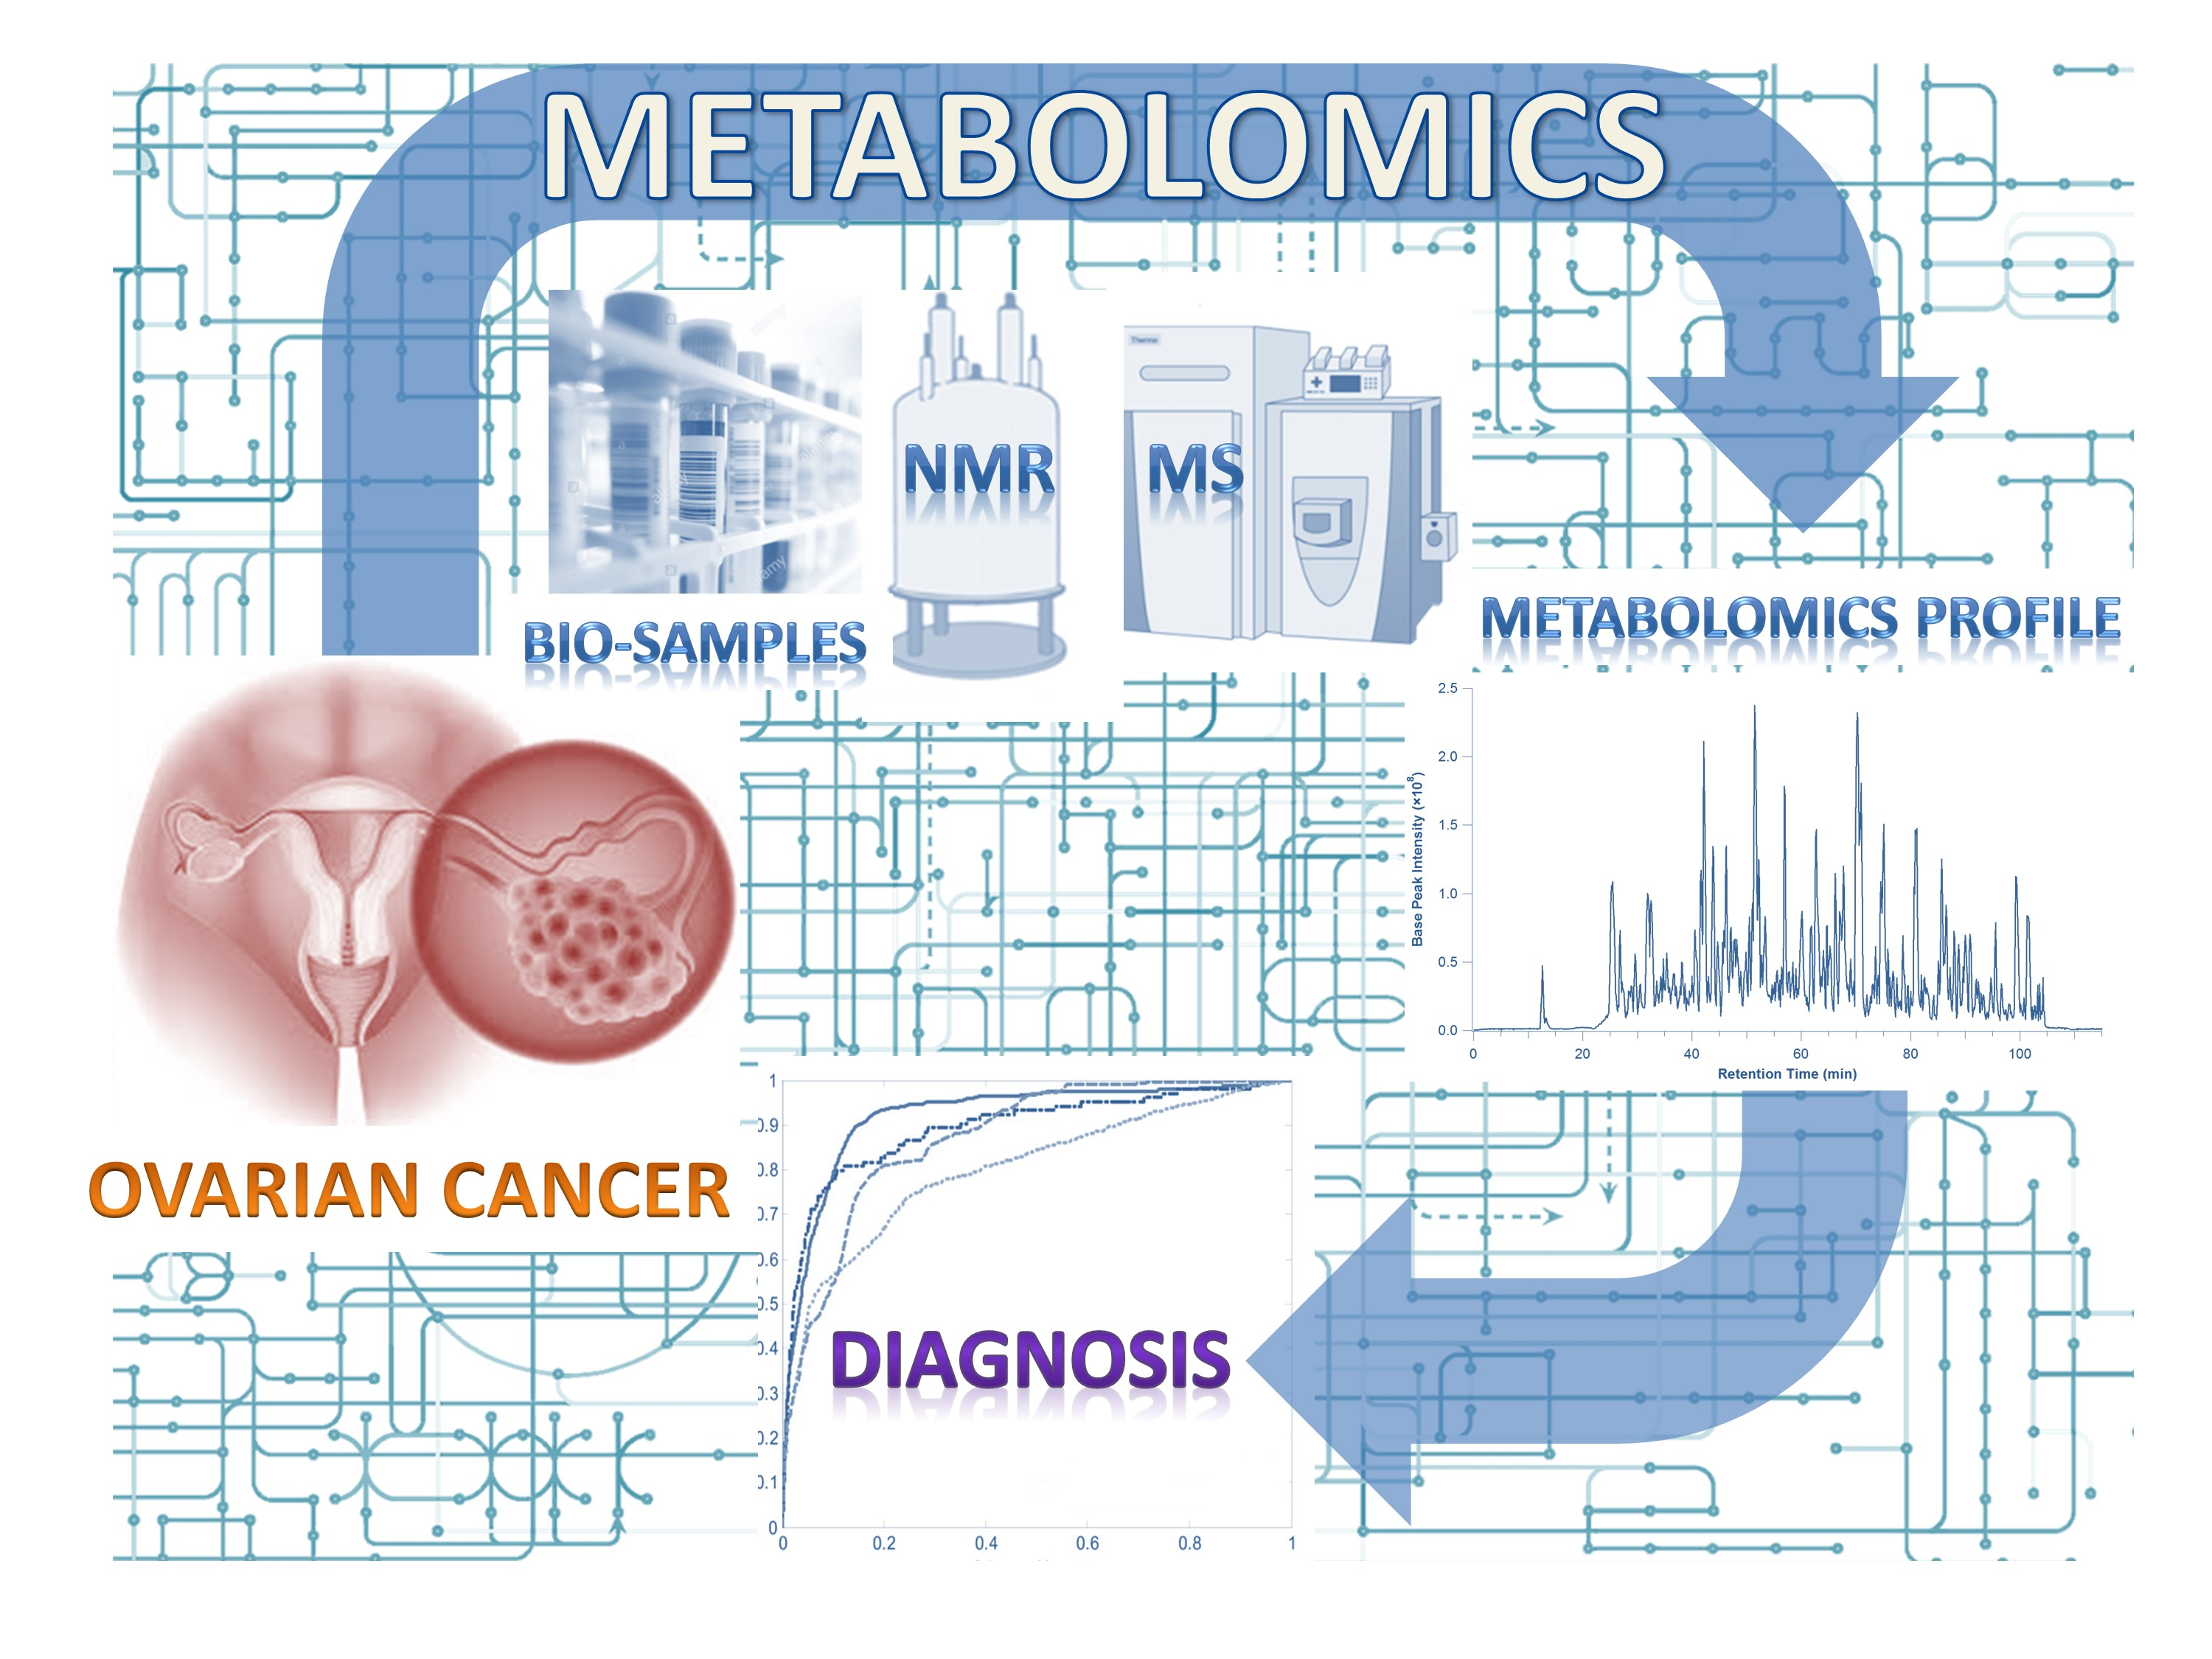
Emerging Role of Metabolomics in Ovarian Cancer Diagnosis

 and
and
Abstract
:
1. Introduction
2. Metabolomics Workflow
3. Metabolomics Diagnostic Biomarkers of OC
3.1. OC Specific Metabolomics Signatures for OC
3.1.1. Lipids
3.1.2. Amino Acids and Derivatives
3.1.3. Central Carbon Metabolites
3.1.4. Other Metabolites
4. Conclusions
Supplementary Materials
Author Contributions
Funding
Conflicts of Interest
References
- Key Statistics for Ovarian Cancer. Available online: https://www.cancer.org/cancer/ovarian-cancer/about/key-statistics.html (accessed on 10 June 2020).
- Bray, F.; Ferlay, J.; Soerjomataram, I.; Siegel, R.L.; Torre, L.A.; Jemal, A. Global cancer statistics 2018: GLOBOCAN estimates of incidence and mortality worldwide for 36 cancers in 185 countries. CA Cancer J. Clin. 2018, 68, 394–424. [Google Scholar] [CrossRef] [Green Version]
- Kaku, T.; Ogawa, S.; Kawano, Y.; Ohishi, Y.; Kobayashi, H.; Hirakawa, T.; Nakano, H. Histological classification of ovarian cancer. Med. Electron. Microsc. 2003, 36, 9–17. [Google Scholar] [CrossRef]
- Ehdaivand, S. Pathology Outlines–WHO Classification. Available online: https://www.pathologyoutlines.com/topic/ovarytumorwhoclassif.html (accessed on 1 August 2020).
- Ilana Cass, B.Y.K. Ovarian cancer symptoms speak out—but what are they really saying? J. Natl. Cancer Inst. 2010, 28, 211–212. [Google Scholar] [CrossRef] [Green Version]
- Nossov, V.; Amneus, M.; Su, F.; Lang, J.; Janco, J.M.T.; Reddy, S.T.; Farias-Eisner, R. The early detection of ovarian cancer: From traditional methods to proteomics. Can we really do better than serum CA-125? Am. J. Obs. Gynecol. 2008, 199, 215–223. [Google Scholar] [CrossRef]
- Neesham, D. Ovarian cancer screening. Aust. Fam. Physician 2007, 36, 126–128. [Google Scholar]
- Muinao, T.; Deka Boruah, H.P.; Pal, M. Diagnostic and Prognostic Biomarkers in ovarian cancer and the potential roles of cancer stem cells–An updated review. Exp. Cell Res. 2018, 362, 1–10. [Google Scholar] [CrossRef]
- Benson, M. Clinical implications of omics and systems medicine: Focus on predictive and individualized treatment. J. Intern. Med. 2016, 279, 229–240. [Google Scholar] [CrossRef] [PubMed] [Green Version]
- Beebe, K.; Kennedy, A.D. Sharpening Precision Medicine by a Thorough Interrogation of Metabolic Individuality. Comput. Struct. Biotechnol. J. 2016, 14, 97–105. [Google Scholar] [CrossRef] [PubMed] [Green Version]
- Wishart, D.S.; Tzur, D.; Knox, C.; Eisner, R.; Guo, A.C.; Young, N.; Cheng, D.; Jewell, K.; Arndt, D.; Sawhney, S.; et al. HMDB: The Human Metabolome Database. Nucleic Acids Res. 2007, 35, D521–D526. [Google Scholar] [CrossRef] [PubMed]
- German, J.B.; Hammock, B.D.; Watkins, S.M. Metabolomics: Building on a century of biochemistry to guide human health. Metabolomics 2005, 1, 3–9. [Google Scholar] [CrossRef]
- Clish, C.B. Metabolomics: An emerging but powerful tool for precision medicine. Mol. Case Stud. 2015, 1, a000588. [Google Scholar] [CrossRef] [PubMed] [Green Version]
- Wang, L.; Liu, X.; Yang, Q. Application of Metabolomics in Cancer Research: As a Powerful Tool to Screen Biomarker for Diagnosis, Monitoring and Prognosis of Cancer. Biomark. J. 2018, 1, 2472–1646. [Google Scholar] [CrossRef]
- Bachmayr-Heyda, A.; Aust, S.; Auer, K.; Meier, S.M.; Schmetterer, K.G.; Dekan, S.; Gerner, C.; Pils, D. Integrative systemic and local metabolomics with impact on survival in high-grade serous ovarian cancer. Clin. Cancer Res. 2017, 23, 2081–2092. [Google Scholar] [CrossRef] [PubMed] [Green Version]
- Turkoglu, O.; Zeb, A.; Graham, S.; Szyperski, T.; Szender, J.B.; Odunsi, K.; Bahado-Singh, R. Metabolomics of biomarker discovery in ovarian cancer: A systematic review of the current literature. Metabolomics 2016, 12, 60. [Google Scholar] [CrossRef] [PubMed] [Green Version]
- Parker, L.A.; GómezSaez, N.; Lumbreras, B.; Porta, M.; Hernández-Aguado, I. Methodological Deficits in Diagnostic Research Using ‘-Omics’ Technologies: Evaluation of the QUADOMICS Tool and Quality of Recently Published Studies. PLoS ONE 2010, 5, e11419. [Google Scholar] [CrossRef] [PubMed] [Green Version]
- Pinto, R.C. Chemometrics Methods and Strategies in Metabolomics. In Metabolomics: From Fundamentals to Clinical Applications; Sussolini, A., Ed.; Springer: Berlin/Heidelberg, Germany, 2017; pp. 163–190. [Google Scholar]
- Theodoridis, G.A.; Gika, H.G.; Want, E.J.; Wilson, I.D. Liquid chromatography–mass spectrometry based global metabolite profiling: A review. Anal. Chim. Acta 2012, 711, 7–16. [Google Scholar] [CrossRef]
- van den Berg, R.A.; Hoefsloot, H.C.J.; A Westerhuis, J.; Smilde, A.K.; Van Der Werf, M.J. Centering, scaling, and transformations: Improving the biological information content of metabolomics data. BMC Genom. 2006, 7, 142. [Google Scholar] [CrossRef] [Green Version]
- Chong, J.; Wishart, D.S.; Xia, J. Using MetaboAnalyst 4.0 for Comprehensive and Integrative Metabolomics Data Analysis. Curr. Protoc. Bioinform. 2019, 68, e86. [Google Scholar] [CrossRef]
- Craig, A.; Cloarec, O.; Holmes, E.; Nicholson, J.K.; Lindon, J.C. Scaling and normalization effects in NMR spectroscopic metabonomic data sets. Anal. Chem. 2006, 78, 2262–2267. [Google Scholar] [CrossRef]
- Woo, H.M.; Kim, K.M.; Choi, M.H.; Jung, B.H.; Lee, J.; Kong, G.; Nam, S.J.; Kim, S.; Bai, S.W.; Chung, B.C. Mass spectrometry based metabolomic approaches in urinary biomarker study of women’s cancers. Clin. Chim. Acta 2009, 400, 63–69. [Google Scholar] [CrossRef]
- Wulff, J.E.; Mitchell, M.W. A Comparison of Various Normalization Methods for LC/MS Metabolomics Data. Adv. Biosci. Biotechnol. 2018, 9, 339–351. [Google Scholar] [CrossRef] [Green Version]
- Dakkak, W.T.A. Multivariate Analysis in Metabolomics. Curr. Metab. 2017, 176, 139–148. [Google Scholar]
- Ma, S.; Huang, J. Penalized feature selection and classification in bioinformatics. Brief. Bioinform. 2008, 9, 392–403. [Google Scholar] [CrossRef] [PubMed] [Green Version]
- Li, Z.; Zhou, X.; Dai, Z.; Zou, X. Classification of G-protein coupled receptors based on support vector machine with maximum relevance minimum redundancy and genetic algorithm. BMC Bioinform. 2010, 11, 325. [Google Scholar] [CrossRef] [PubMed] [Green Version]
- Chen, J.; Zhang, Y.; Zhang, X.; Cao, R.; Chen, S.; Huang, Q.; Lu, X.; Wan, X.; Wu, X.; Xu, C.; et al. Application of L-EDA in metabonomics data handling: Global metabolite profiling and potential biomarker discovery of epithelial ovarian cancer prognosis. Metabolomics 2011, 7, 614–622. [Google Scholar] [CrossRef] [Green Version]
- Benjamini, Y.; Hochberg, Y. Controlling The False Discovery Rate–A Practical And Powerful Approach To Multiple Testing. J. R. Stat. Soc. Ser. B 1995, 57, 289–300. [Google Scholar] [CrossRef]
- Xia, J.; Wishart, D.S. Web-based inference of biological patterns, functions and pathways from metabolomic data using MetaboAnalyst. Nat. Protoc. 2011, 6, 743–760. [Google Scholar] [CrossRef] [PubMed]
- Broadhurst, D.I.; Kell, D.B. Statistical strategies for avoiding false discoveries in metabolomics and related experiments. Metabolomics 2006, 2, 171–196. [Google Scholar] [CrossRef] [Green Version]
- El Bairi, K.; Kandhro, A.H.; Gouri, A.; Mahfoud, W.; Louanjli, N.; Saadani, B.; Afqir, S.; Amrani, M. Emerging diagnostic, prognostic and therapeutic biomarkers for ovarian cancer. Cell. Oncol. 2017, 40, 105–118. [Google Scholar] [CrossRef]
- Klassen, A.; Faccio, A.T.; Canuto, G.A.B.; Da Cruz, P.L.R.; Ribeiro, H.C.; Tavares, M.F.M.; Sussulini, A. Metabolomics: Definitions and Significance in Systems Biology. In Advances in Experimental Medicine and Biology; Springer Science and Business Media LLC: Cham, Switzerland, 2017; Volume 965, pp. 3–17. [Google Scholar]
- Buas, M.F.; Gu, H.; Djukovic, D.; Zhu, J.; Drescher, C.W.; Urban, N.; Raftery, D.; Li, C.I. Identification of novel candidate plasma metabolite biomarkers for distinguishing serous ovarian carcinoma and benign serous ovarian tumors. Gynecol. Oncol. 2016, 140, 138–144. [Google Scholar] [CrossRef] [Green Version]
- Chen, J.; Zhang, X.; Cao, R.; Lu, X.; Zhao, S.; Fekete, A.; Huang, Q.; Schmitt-Kopplin, P.; Wang, Y.; Xu, Z.; et al. Serum 27-nor-5β-cholestane-3,7,12,24,25 pentol glucuronide discovered by metabolomics as potential diagnostic biomarker for epithelium ovarian cancer. J. Proteome Res. 2011, 10, 2625–2632. [Google Scholar] [CrossRef] [PubMed]
- Cheng, Y.; Li, L.; Zhu, B.; Liu, F.; Wang, Y.; Gu, X.; Yan, C. Expanded metabolomics approach to profiling endogenous carbohydrates in the serum of ovarian cancer patients. J. Sep. Sci. 2016, 39, 316–323. [Google Scholar] [CrossRef]
- Dessources, K.; Cohen, J.; Sen, K.; Ramadoss, S.; Chaudhuri, G. N-Acetylation and Ovarian Cancer: A study of the Metabolomic Profile of Ovarian Cancer Compared to Benign Counterparts. Gynecol. Oncol. 2017, 147, 223–224. [Google Scholar] [CrossRef]
- Fan, L.; Zhang, W.; Yin, M.; Zhang, T.; Wu, X.; Zhang, H.; Sun, M.; Li, Z.; Hou, Y.; Zhou, X.; et al. Identification of metabolic biomarkers to diagnose epithelial ovarian cancer using a UPLC/QTOF/MS platform. Acta Oncol. 2012, 51, 473–479. [Google Scholar] [CrossRef] [Green Version]
- Fan, L.; Yin, M.; Ke, C.; Ge, T.; Zhang, G.; Zhang, W.; Zhou, X.; Lou, G.; Li, K. Use of Plasma Metabolomics to Identify Diagnostic Biomarkers for Early Stage Epithelial Ovarian Cancer. J. Cancer 2016, 7, 1265–1272. [Google Scholar] [CrossRef] [Green Version]
- Garcia, E.; Andrews, C.; Hua, J.; Kim, H.L.; Sukumaran, D.K.; Szyperski, T.; Odunsi, K. Diagnosis of Early Stage Ovarian Cancer by 1 H NMR Metabonomics of Serum Explored by Use of a Microflow NMR Probe. J. Proteome Res. 2011, 10, 1765–1771. [Google Scholar] [CrossRef] [PubMed] [Green Version]
- Gaul, D.A.; Mezencev, R.; Long, T.Q.; Jones, C.M.; Benigno, B.B.; Gray, A.; Fernández, F.M.; McDonald, J.F. Highly-accurate metabolomic detection of early-stage ovarian cancer. Sci. Rep. 2015, 5, 16351. [Google Scholar] [CrossRef] [Green Version]
- Guan, W.; Zhou, M.; Hampton, C.Y.; Benigno, B.B.; Walker, L.D.E.; Gray, A.; McDonald, J.F.; Fernández, F.M. Ovarian cancer detection from metabolomic liquid chromatography/mass spectrometry data by support vector machines. BMC Bioinform. 2009, 10, 259. [Google Scholar] [CrossRef] [Green Version]
- Hilvo, M.; De Santiago, I.; Gopalacharyulu, P.; Schmitt, W.D.; Budczies, J.; Kuhberg, M.; Dietel, M.; Aittokallio, T.; Markowetz, F.; Denkert, C.; et al. Accumulated metabolites of hydroxybutyric acid serve as diagnostic and prognostic biomarkers of ovarian high-grade serous carcinomas. Cancer Res. 2016, 76, 796–804. [Google Scholar] [CrossRef] [PubMed] [Green Version]
- Ke, C.; Hou, Y.; Zhang, H.; Fan, L.; Ge, T.; Guo, B.; Zhang, F.; Yang, K.; Wang, J.; Lou, G.; et al. Large-scale profiling of metabolic dysregulation in ovarian cancer. Int. J. Cancer 2015, 136, 516–526. [Google Scholar] [CrossRef]
- Ke, C.; Li, A.; Hou, Y.; Sun, M.; Yang, K.; Cheng, J.; Wang, J.; Ge, T.; Zhang, F.; Li, Q.; et al. Metabolic phenotyping for monitoring ovarian cancer patients. Sci. Rep. 2016, 6, 23334. [Google Scholar] [CrossRef] [Green Version]
- Kozar, N.; Kruusmaa, K.; Bitenc, M.; Argamasilla, R.; Adsuar, A.; Goswami, N.; Arko, D.; Takač, I. Metabolomic profiling suggests long chain ceramides and sphingomyelins as a possible diagnostic biomarker of epithelial ovarian cancer. Clin. Chim. Acta 2018, 481, 108–114. [Google Scholar] [CrossRef] [PubMed]
- Kybert, N.; Prokop-Prigge, K.; Otto, C.M.; Ramirez, L.; Joffe, E.; Tanyi, J.; Piltz-Seymour, J.; Johnson, A.T.C.; Preti, G. Exploring ovarian cancer screening using a combined sensor approach: A pilot study. AIP Adv. 2020, 10, 035213. [Google Scholar] [CrossRef] [Green Version]
- Odunsi, K.; Wollman, R.M.; Ambrosone, C.B.; Hutson, A.; McCann, S.E.; Tammela, J.; Geisler, J.P.; Miller, G.; Sellers, T.; Cliby, W.; et al. Detection of epithelial ovarian cancer using 1H-NMR-based metabonomics. Int. J. Cancer 2005, 113, 782–788. [Google Scholar] [CrossRef] [PubMed]
- Plewa, S.; Horała, A.; Dereziński, P.; Nowak-Markwitz, E.; Matysiak, J.; Kokot, Z.J. Wide spectrum targeted metabolomics identifies potential ovarian cancer biomarkers. Life Sci. 2019, 222, 235–244. [Google Scholar] [CrossRef] [PubMed]
- Silva, E.G.; Lopez, P.R.; Atkinson, E.N.; Fente, C.A. A New Approach for Identifying Patients With Ovarian Epithelial Neoplasms Based on High-Resolution Mass Spectrometry. Am. J. Clin. Pathol. 2010, 134, 903–909. [Google Scholar] [CrossRef] [Green Version]
- Sutphen, R.; Xu, Y.; Wilbanks, G.D.; Fiorica, J.; Grendys, E.C.; LaPolla, J.P.; Arango, H.; Hoffman, M.S.; Martino, M.; Wakeley, K.; et al. Lysophospholipids are potential biomarkers of ovarian cancer. Cancer Epidemiol. Biomark. Prev. 2004, 13, 1185–1191. [Google Scholar]
- Yang, W.; Mu, T.; Jiang, J.; Sun, Q.; Hou, X.; Sun, Y.; Zhong, L.; Wang, C.; Sun, C. Identification of Potential Biomarkers and Metabolic Profiling of Serum in Ovarian Cancer Patients Using UPLC/Q-TOF MS. Cell. Physiol. Biochem. 2018, 51, 1134–1148. [Google Scholar] [CrossRef]
- Yin, R.; Yang, T.; Su, H.; Ying, L.; Liu, L.; Sun, C. Saturated fatty acids as possible important metabolites for epithelial ovarian cancer based on the free and esterified fatty acid profiles determined by GC-MS analysis. Cancer Biomark. 2016, 17, 259–269. [Google Scholar] [CrossRef]
- Zhang, T.; Wu, X.; Yin, M.; Fan, L.; Zhang, H.; Zhao, F.; Zhang, W.; Ke, C.; Zhang, G.; Hou, Y.; et al. Discrimination between malignant and benign ovarian tumors by plasma metabolomic profiling using ultra performance liquid chromatography/mass spectrometry. Clin. Chim. Acta 2012, 413, 861–868. [Google Scholar] [CrossRef]
- Zhou, M.; Guan, W.; Walker, L.D.; Mezencev, R.; Benigno, B.B.; Gray, A.; Fernandez, F.M.; McDonald, J.F. Rapid Mass Spectrometric Metabolic Profiling of Blood Sera Detects Ovarian Cancer with High Accuracy. Cancer Epidemiol. Biomark. Prev. 2010, 19, 2262–2271. [Google Scholar] [CrossRef] [PubMed] [Green Version]
- Plewa, S.; Horała, A.; Dereziński, P.; Klupczynska, A.; Nowak-Markwitz, E.; Matysiak, J.; Kokot, Z. Usefulness of Amino Acid Profiling in Ovarian Cancer Screening with Special Emphasis on Their Role in Cancerogenesis. Int. J. Mol. Sci. 2017, 18, 2727. [Google Scholar] [CrossRef] [PubMed] [Green Version]
- Boss, E.A.; Moolenaar, S.H.; Massuger, L.F.A.G.; Boonstra, H.; Engelke, U.F.H.; de Jong, J.G.N.; Wevers, R.A. High-resolution proton nuclear magnetic resonance spectroscopy of ovarian cyst fluid. Nmr. Biomed. 2000, 13, 297–305. [Google Scholar] [CrossRef]
- Fong, M.Y.; McDunn, J.; Kakar, S.S. Identification of metabolites in the normal ovary and their transformation in primary and metastatic ovarian cancer. PLoS ONE 2011, 6, e19963. [Google Scholar] [CrossRef] [PubMed] [Green Version]
- Garg, G.; Yilmaz, A.; Kumar, P.; Turkoglu, O.; Mutch, D.G.; Powell, M.A.; Rosen, B.; Bahado-Singh, R.O.; Graham, S.F. Targeted metabolomic profiling of low and high grade serous epithelial ovarian cancer tissues: A pilot study. Metabolomics 2018, 14, 154. [Google Scholar] [CrossRef] [PubMed]
- Kolwijck, E.; Wevers, R.A.; Engelke, U.F.; Woudenberg, J.; Bulten, J.; Blom, H.J.; Massuger, L.F.A.G. Ovarian Cyst Fluid of Serous Ovarian Tumors Contains Large Quantities of the Brain Amino Acid N-acetylaspartate. PLoS ONE 2010, 5, e10293. [Google Scholar] [CrossRef] [Green Version]
- Kyriakides, M.; Rama, N.; Sidhu, J.; Gabra, H.; Keun, H.C.; El-Bahrawy, M. Metabonomic analysis of ovarian tumour cyst fluid by proton nuclear magnetic resonance spectroscopy. Oncotarget 2016, 7, 7216–7226. [Google Scholar] [CrossRef]
- Slupsky, C.M.; Steed, H.; Wells, T.H.; Dabbs, K.; Schepansky, A.; Capstick, V.; Faught, W.; Sawyer, M.B. Urine metabolite analysis offers potential early diagnosis of ovarian and breast cancers. Clin. Cancer Res. 2010, 16, 5835–5841. [Google Scholar] [CrossRef] [Green Version]
- Zhang, T.; Wu, X.; Ke, C.; Yin, M.; Li, Z.; Fan, L.; Zhang, W.; Zhang, H.; Zhao, F.; Zhou, X.; et al. Identification of Potential Biomarkers for Ovarian Cancer by Urinary Metabolomic Profiling. J. Proteome Res. 2013, 12, 505–512. [Google Scholar] [CrossRef]
- Chen, J.; Zhou, L.; Zhang, X.; Lu, X.; Cao, R.; Xu, C.; Xu, G. Urinary hydrophilic and hydrophobic metabolic profiling based on liquid chromatography-mass spectrometry methods: Differential metabolite discovery specific to ovarian cancer. Electrophoresis 2012, 33, 3361–3369. [Google Scholar] [CrossRef]
- Amal, H.; Shi, D.Y.; Ionescu, R.; Zhang, W.; Hua, Q.L.; Pan, Y.Y.; Tao, L.; Liu, H.; Haick, H. Assessment of ovarian cancer conditions from exhaled breath. Int. J. Cancer 2015, 136, E614–E622. [Google Scholar] [CrossRef] [PubMed]
- Perrotti, F.; Rosa, C.; Cicalini, I.; Sacchetta, P.; Del Boccio, P.; Genovesi, D.; Pieragostino, D. Advances in Lipidomics for Cancer Biomarkers Discovery. Int. J. Mol. Sci. 2016, 17, 1992. [Google Scholar] [CrossRef] [PubMed] [Green Version]
- Sassa, T.; Suto, S.; Okayasu, Y.; Kihara, A. A shift in sphingolipid composition from C24 to C16 increases susceptibility to apoptosis in HeLa cells. Biochim. Biophys. Acta–Mol. Cell Biol. Lipids 2012, 1821, 1031–1037. [Google Scholar] [CrossRef] [PubMed] [Green Version]
- Pralhada Rao, R.; Vaidyanathan, N.; Rengasamy, M.; Mammen Oommen, A.; Somaiya, N.; Jagannath, M.R. Sphingolipid Metabolic Pathway: An Overview of Major Roles Played in Human Diseases. J. Lipids 2013, 2013, 1–12. [Google Scholar] [CrossRef] [PubMed] [Green Version]
- Kreitzburg, K.M.; van Waardenburg, R.C.A.M.; Yoon, K.J. Sphingolipid metabolism and drug resistance in ovarian cancer. Cancer Drug Resist. 2018, 1, 181–197. [Google Scholar] [CrossRef] [Green Version]
- HMDB Human Metabolome Database: Showing Metabocard for LacCer (d18:1/16:0) (HMDB0006750). Available online: https://hmdb.ca/metabolites/HMDB0006750 (accessed on 18 August 2020).
- Owczarek, T.B.; Suchanski, J.; Pula, B.; Kmiecik, A.M.; Chadalski, M.; Jethon, A.; Dziegiel, P.; Ugorski, M. Galactosylceramide Affects Tumorigenic and Metastatic Properties of Breast Cancer Cells as an Anti-Apoptotic Molecule. PLoS ONE 2013, 8, e84191. [Google Scholar] [CrossRef] [Green Version]
- Reuter, S.E.; Evans, A.M. Carnitine and Acylcarnitines. Clin. Pharm. 2012, 51, 553–572. [Google Scholar] [CrossRef]
- Melone, M.A.B.; Valentino, A.; Margarucci, S.; Galderisi, U.; Giordano, A.; Peluso, G. The carnitine system and cancer metabolic plasticity. Cell Death Dis. 2018, 9, 228. [Google Scholar] [CrossRef] [Green Version]
- Nieman, K.M.; Kenny, H.A.; Penicka, C.V.; Ladanyi, A.; Buell-Gutbrod, R.; Zillhardt, M.R.; Romero, I.L.; Carey, M.S.; Mills, G.B.; Hotamisligil, G.S.; et al. Adipocytes promote ovarian cancer metastasis and provide energy for rapid tumor growth. Nat. Med. 2011, 17, 1498–1503. [Google Scholar] [CrossRef] [Green Version]
- Munir, R.; Lisec, J.; Swinnen, J.V.; Zaidi, N. Lipid metabolism in cancer cells under metabolic stress. Br. J. Cancer 2019, 120, 1090–1098. [Google Scholar] [CrossRef]
- Pizer, E.S.; Wood, F.D.; Heine, H.S.; Romantsev, F.E.; Pasternack, G.R.; Kuhajda, F.P. Inhibition of fatty acid synthesis delays disease progression in a xenograft model of ovarian cancer. Cancer Res. 1996, 56, 1189–1193. [Google Scholar] [PubMed]
- Merritt, M.A.; Cramer, D.W.; Missmer, S.A.; Vitonis, A.F.; Titus, L.J.; Terry, K.L. Dietary fat intake and risk of epithelial ovarian cancer by tumour histology. Br. J. Cancer 2014, 110, 1392–1401. [Google Scholar] [CrossRef] [PubMed] [Green Version]
- Nomura, D.K.; Long, J.Z.; Niessen, S.; Hoover, H.S.; Ng, S.-W.; Cravatt, B.F. Monoacylglycerol Lipase Regulates a Fatty Acid Network that Promotes Cancer Pathogenesis. Cell 2010, 140, 49–61. [Google Scholar] [CrossRef] [PubMed] [Green Version]
- Iorio, E.; Ricci, A.; Bagnoli, M.; Pisanu, M.E.; Castellano, G.; Di Vito, M.; Venturini, E.; Glunde, K.; Bhujwalla, Z.M.; Mezzanzanica, D.; et al. Activation of Phosphatidylcholine Cycle Enzymes in Human Epithelial Ovarian Cancer Cells. Cancer Res. 2010, 70, 2126–2135. [Google Scholar] [CrossRef] [Green Version]
- Denkert, C.; Budczies, J.; Kind, T.; Weichert, W.; Tablack, P.; Sehouli, J.; Niesporek, S.; Konsgen, D.; Dietel, M.; Fiehn, O. Mass Spectrometry-Based Metabolic Profiling Reveals Different Metabolite Patterns in Invasive Ovarian Carcinomas and Ovarian Borderline Tumors. Cancer Res. 2006, 66, 10795–10804. [Google Scholar] [CrossRef] [Green Version]
- Lieu, E.L.; Nguyen, T.; Rhyne, S.; Kim, J. Amino acids in cancer. Exp. Mol. Med. 2020, 52, 15–30. [Google Scholar] [CrossRef]
- Lai, H.-S.; Lee, J.-C.; Lee, P.-H.; Wang, S.-T.; Chen, W.-J. Plasma free amino acid profile in cancer patients. Semin. Cancer Biol. 2005, 15, 267–276. [Google Scholar] [CrossRef]
- Miyagi, Y.; Higashiyama, M.; Gochi, A.; Akaike, M.; Ishikawa, T.; Miura, T.; Saruki, N.; Bando, E.; Kimura, H.; Imamura, F.; et al. Plasma Free Amino Acid Profiling of Five Types of Cancer Patients and Its Application for Early Detection. PLoS ONE 2011, 6, e24143. [Google Scholar] [CrossRef] [Green Version]
- Vettore, L.; Westbrook, R.L.; Tennant, D.A. New aspects of amino acid metabolism in cancer. Br. J. Cancer 2020, 122, 150–156. [Google Scholar] [CrossRef]
- Kaji, M.; Kabir-Salmani, M.; Anzai, N.; Jin, C.J.; Akimoto, Y.; Horita, A.; Sakamoto, A.; Kanai, Y.; Sakurai, H.; Iwashita, M. Properties of L-Type Amino Acid Transporter 1 in Epidermal Ovarian Cancer. Int. J. Gynecol. Cancer 2010, 20, 329–336. [Google Scholar] [CrossRef]
- Corona, G.; Toffoli, G.; Fabris, M.; Viel, A.; Zarrelli, A.; Donada, C.; Boiocchi, M. Homocysteine accumulation in human ovarian carcinoma ascitic/cystic fluids possibly caused by metabolic alteration of the methionine cycle in ovarian carcinoma cells. Eur. J. Cancer 1997, 33, 1284–1290. [Google Scholar] [CrossRef]
- Platten, M.; Wick, W.; Van den Eynde, B.J. Tryptophan Catabolism in Cancer: Beyond IDO and Tryptophan Depletion. Cancer Res. 2012, 72, 5435–5440. [Google Scholar] [CrossRef] [PubMed] [Green Version]
- Godin-Ethier, J.; Hanafi, L.-A.; Piccirillo, C.A.; Lapointe, R. Indoleamine 2,3-Dioxygenase Expression in Human Cancers: Clinical and Immunologic Perspectives. Clin. Cancer Res. 2011, 17, 6985–6991. [Google Scholar] [CrossRef] [PubMed] [Green Version]
- Liu, M.; Wang, X.; Wang, L.; Ma, X.; Gong, Z.; Zhang, S.; Li, Y. Targeting the IDO1 pathway in cancer: From bench to bedside. J. Hematol. Oncol. 2018, 11, 100. [Google Scholar] [CrossRef] [Green Version]
- Ebell, M.H.; Culp, M.B.; Radke, T.J. A Systematic Review of Symptoms for the Diagnosis of Ovarian Cancer. Am. J. Prev. Med. 2016, 50, 384–394. [Google Scholar] [CrossRef]
- Banerjee, A.; Gupta, R.C. Gastrointestinal Toxicity Biomarkers. In Biomarkers in Toxicology; Elsevier: Amsterdam, The Netherlands, 2019; pp. 277–285. ISBN 9780128146552. [Google Scholar]
- Liberti, M.V.; Locasale, J.W. The Warburg Effect: How Does it Benefit Cancer Cells? Trends Biochem. Sci. 2016, 41, 211–218. [Google Scholar] [CrossRef] [Green Version]
- Warburg, O.; Wind, F.; Negelein, E. The metabolism of tumors in the body. J. Gen. Physiol. 1927, 8, 519–530. [Google Scholar] [CrossRef] [Green Version]

| Ref | Sample | Analytical Techniques | Test/Control Groups | Data Pretreatment/Statistical Analysis | Specific OC Metabolites | Diagnostic Power * |
|---|---|---|---|---|---|---|
| [34] | Plasma | LC-QTOF | SOC (n = 25) BC (n = 25) IVS: SOC (n = 25) BC (n = 25) (d) | Bridge Normalization, Log Transformation, Linear Regression Analysis | ↓C52H79NO5S ↓ PS(O-18:0/0:0) 18:3 ↓ Cholesteryl ester ↓TG(16:0/16:1(9Z)/16:1(9Z))[iso3] ↓alanine↓PG(P-20:0/12:0) ↓ TG(16:1(9Z)/16:1(9Z)/16:1(9Z))↓PS(O-18:0/16:1(9Z)) ↓TG(17:2(9Z,12Z)/17:2(9Z,12Z)/20:5(5Z,8Z,11Z,14Z,17Z))[iso3] ↓TG(16:1(9Z)/17:2(9Z,12Z)/17:2(9Z,12Z))[iso3]↓TG(16:1(9Z)/17:1(9Z)/17:2(9Z,12Z))[iso6]↓PE(18:1(9Z)/20:3(8Z,11Z,14Z))↓C57H102N2OS ↓TG(16:0/16:0/16:1(9Z))[iso3] ↓ C29H47N9 O2 ↓ PS(O-20:0/0:0) ↓PE(18:1(9Z)/20:3(8Z,11Z,14Z))↓TG(16:1(9Z)/17:0/17:2(9Z,12Z)) | TPR = 95%, TNR = 35%, AUC = 0.91 (+CA125) |
| [35] | Serum, tissue (a) | LC-QTOF/ QQQ | EOC (n = 29) BOT (n=28) HC (n = 27) IVS: HC (n = 361) BOT(n = 199), EOC(n = 125) | TIC Normalization, Pareto Scaling, Wilcoxon Rank Sum Test, PLS-DA | ↑ CPG | TPR = 67%, TNR = 77%, AUC = 0.75 |
| [28] | Serum | LC-QTOF | EOC (n = 21) EOC recurrent (n = 36) EOC non recurrent (n = 25) HC (n = 24) | TIC Normalization, Wilcoxon Test, PCA, PLS-DA | ↑ Hypoxanthine ↑ Guanidinosuccinic acid ↑ Cortisol ↑ Lyso PE(22:6) ↓ Lyso PC(18:2) | ACC = 88.7% |
| [36] | Serum (b) | LC–QQQ | OC (n = 21) BC (n = 17), HC (n = 20) | t-Test | ↑arabitol, ↑maltose, ↑ maltotriose, ↑raffinose, ↑mannitol, ↓inosine, ↓ ribose, ↑glucose, ↑ (only vs BOT) erythritol | AUC = 0.91 (OC vs HC) AUC = 0.83 (OC vs BC) |
| [37] | Blood, tissue | GC/LC-MS | OC (n = 21) BC (n = 16) | ANOVA, Welch’s two-sample t-test, Matched Pairs t tests. | ↑N-acetyl putrescin ↑ N-acetyl tryptophan ↑acyl carnitines | / |
| [38] | Plasma (a) | LC-QTOF |
EOC (n = 42) HC (n = 58) IVS: EOC (n = 38) HC (n = 35) (f,c) | Logistic Regression, Wilcoxon Ranksum Test, PLS-DA | ↓ Demethylphylloquinone ↑ Ganglioside ↑ Lysophospholipids ↑ Ceramides ↑ Phytosphingosine ↑ N-Formylkynurenine | TPR = 92.1%, TNR = 88.6%, AUC = 0.94 |
| [39] | Plasma (a) | LC-QTOF | EOC (n = 21) HC (n = 31) (f) | TIC Normalization, Two-Sided Cochran And Cox Test, PCA, OPLS-DA | ↓2-Piperidinone↓ 4-(2-Aminophenyl)-2, 4-dioxobutanoic acid↓trans-2-Dodecenoylcarnitine↑ Pipericine↓ MG (18:2)↓ Coniferin ↑ Adrenoyl Ethanolamide (h)↓ LysoPE(16:0)(h)↓ LysoPC(14:0) (h)↑ LysoPC(16:0)↓ Taurochenodesoxycholic acid↓ LysoPC(17:0)↓ LysoPC(18:3) ↓ LysoPE(22:6) | AUC = 0.94 |
| [40] | Serum (a) | NMR | EOC (n = 120) HC (n = 132) IVS: EOC (n = 50) HC (n = 50) | Normalization to unit integral, Pareto Scaling, PCA, Logistic Regression | ↓alanine↓CH3CH2CH2CO of lipid (mainly in VLDL) ↓CH3(CH2)n of lipid (mainly in LDL), ↓valine ↓ creatine/creatinine ↓choline of phospholipids, ↓CH2CH2CH2CO of lipid (mainly in VLDL) ↓ = CHCH2CH2 of unsaturated lipid ↑β-hydroxybutyrate ↑acetone↑acetoacetate | TPR = 63%, TNR = 80%, AUC = 0.79 |
| [41] | Serum (a) | LC-MS | PSC (n = 46) HC (n = 43) | Autoscaling, Mann Whitney U Test, OPLS-DA | ↑cortisone ↑lysophatidylinositol(18:1) ↑aspartyl-glutamic acid ↓16-(6-butoxy-3-hydroxy-4,5-dimethylcyclohex-1-en-1-yl)-6,10-dihydroxy2,6,10,14-tetramethyl hexadecanoic acid ↑ceramide(d18:1/16:0) ↑lysophosphatidylethanolamine(22:6) ↑2-hydroxyl nonanoic acid ↓iso-1,2-octadecanediol ↓3-hydroxyldodecanedioic acid ↓phosphatidylinositol(20:4/18:1)↓7,9,13-trihydroxyoctacosa-16,22-dienoic acid | TPR = 100%, TNR = 100% |
| [42] | Serum/ (a) | LC-QTOF | PSC (n = 37) BC (n = 35) | Linear Intensity Normalization Of The Total Raw Signal | ↑12-Hydroxy-8E10E-heptadecadienoic acid ↑palmitic acid ↑stearic acid ↑ GlnHisAla; DHEA sulfate ↑PC(P-16:0/0:0) ↑PC(10:0/4:0) ↑PE(9:0/10:0) ↑ LPC(18:2) ↑PC(14:0/ 20:1(11Z)) ↑PE- NMe(18:1(19E)/18:1(9E)) ↑PC(14:0/22:4 (7Z,10Z,13Z,16Z)) ↑ PC(14:0/22:1(13Z)) | / |
| [43] | Serum, tissue (a,b) | GC×GC-TOF | HGSOC (n = 158) BC (n = 100) | IS Normalization, Log Transformation, Autoscaling Unpaired t-Test, ANOVA, Correlation Analysis (Pearson And Spearman), PCA | ↑3,4-dihydroxybutyric acid ↑3-hydroxybutyric acid↑ 2-hydroxybutyric acid↑ ↑acetoacetic acid ↑ 2,4-Dihydroxybutyric acid ↑ glycine ↑glutamic acid ↑ glutamine ↑ 4-hydroxyphenyllactic acid ↑ maltose ↑turanose ↑melibiose ↑ mannonic acid ↑ xylitol ↑ arabinose ↑ glucopyranose ↑ mannopyranose ↑xylose ↑ linolenic acid (C18:3) ↑ Palmitelaidic acid (C16:1) ↑ oleic Acid (C18:1) ↑ myristic acid (C14:0) ↑ myristoleic acid (C14:1) ↑ palmitic acid (C16:0) ↑ lauric acid (C12:0) ↑ adipic acid ↑Myo- Inositol ↑ethanolamine ↑glycerol ↑ 3-hydroxyvaleric acid ↑erythritol ↑ maleic acid ↑ 3-hydroxyisovaleric acid ↑ 3-hydroxycaproic acid↓ Tryptophan alanine↓ methionine↓ threonine ↓ proline ↓ serine ↓ phenylalanine; tyrosine ↓valine ↓ 2-oxo-3-methylpentanoic acid ↓indole-3-acetic acid ↓ 2-oxoisovaleric acid ↓2-hydroxy-3-methylvaleric acid ↓ lactic acid ↓ malic acid ↓ glycerol-3-phosphate ↓ 2,3,4-trihydroxybutyric acid ↓ ketoleucine ↓ cholesterol ↓ 2-aminobutyric acid ↓ glyceric acid | AUC = 0.98, AUC = 0.912 (+CA125) |
| [44] | Plasma | LC-QTOF | EOC (n = 80) BOT (n = 80) UF(n = 80) IVS: EOC (n = 60), BOT (n = 78) UF (n = 70) (f) | Kruskal–Wallis Rank Sum Test, PCA, PLS-DA | ↑ 3,5-Tetradecadiencarnitine ↑ cis-5-Tetradecenoylcarnitine ↑Dodecanoylcarnitine ↑ Elaidic carnitine ↑ Tetradecanoylcarnitine ↑ trans-2-Dodecenoylcarnitine ↓ L-Tryptophan ↓ 3-Indolepropionic acid ↑ Kynurenine ↓ 5-Hydroxyindoleacetaldehyde ↓ 3b-Hydroxy-5-cholenoic acid ↓ Glycoursodeoxycholic acid ↓ Deoxycholic acid ↓Androsteroneglucuronide ↓ Prasterone sulphate ↓ 2-piperidinone ↑ PhePhe ↑ L-(-)-3-Phenyllactic ↓ Piperine↓ Hippuric acid ↑ L -Tyrosine ↑ Hydroxyphenyllactic acid ↓ L-histidine ↓ g-CEHC ↓ d-CEHC ↑ Pseudouridine | AUC = 0.91 (EOC vs. BOT) AUC = 0.94 (EOC vs. UF) |
| [45] | Plasma (a) | LC-QTOF | EOC (n = 35) HC (n = 55) (c,f) | Welch’s t-Test, PCA,PLS-DA | ↓LysoPC(8:2) ↓LysoPC(18:3) ↓ LysoPC(14:0) ↓LysoPC(18:1) ↓LysoPC(16:1) ↓ LysoPC(22:5) ↓LysoPC(20:3) ↓ LysoPC(20:4) ↓ LysoPE(18:2/0:0) ↓ LysoPE(0:0/18:1) ↓ L-Tryptophan ↑Kynurenine↓ 3-Indolepropionic acid ↓ Tetracosahexaenoic acid ↓Aldosterone ↓Glycoursodeoxycholic acid ↑Hypoxanthine ↓MG(24:6/0:0/0:0) ↓2-Octenoylcarnitine ↓Piperine ↓2-Piperidinone ↓Retinolc ↓Dodecanedioic acid d ↑L-Thyroxine ↓12,13-DiHODE ↓ 2-Octenoic acid ↓19,20-DiHDPA ↓N-Undecanoylglycine ↓γ-CEHC ↓p-Salicylic acid ↓Nutriacholic acid ↓Deoxycholic acid ↑Hydroxyphenyllactic acid ↑4-Nitrophenol ↓L-Histidine ↓2,6-Dihydroxybenzoic acid ↓β-Hydroxyisovaleric acid | / |
| [46] | Serum (b) | LC-QQQ | EOC (n = 15) BC (n = 21), HC(n = 21) (c) | Batch Normalization, Log Transformation, Pareto Scaling, PLS-DA | ↑Cer 34:1;2 (C16),↑Cer 40:1;2 (C22),↑ Cer 42:1;2 (C24),↑ SM 36:0;2 and SM 36:1;2 (C18 and C18:1) | TPR = 83%, TNR = 87%, AUC = 0.92 |
| [47] | Plasma/breath | Canines, GC-MS ssDNA-CNT sensors | EOC (n = 10) BC (n = 10) HC (n = 10) (c) | / | ↓ 3,4-dimethylbenzaldehyde | TPR = 82.5% |
| [48] | Serum (a) | NMR | EOC (n = 38) BC (n = 12) HC (n = 51) | TIC Normalization, Pareto Scaling, PCA, SIMCA | EOC vs HC (pre and post menopausal) 2.77ppm,2.04ppm regions ↑3-hydroxy-butyrate, EOC vs HC (premenopausal)↑2.25 (unassigned), EOC vs HC (postmenopausal)↑3.7 ppm (sugar hydrogens) | AUC = 1.0 |
| [49] | Serum/ (b) | LC-QQQ | EOC (n = 26) BOT (n = 25) HC (n = 25) (c) | Autoscaling, One Way ANOVA, Kruskal–Wallis Test | ↓histidine ↓citrulline ↓ lysoPC a C16:1, ↓PC aa C32:2, ↓PC aa C34:4 ↓PC aa C36:6 | AUC >0.8 |
| [50] | Serum (a) | LC- Orbitrap | EOC (n = 51) HC (n = 35) IVS: EOC (n = 34) HC (n = 25) | t-Test, OPLS-DA | ↑ 471.73720 m/z | TPR = 98%, TNR = 97% |
| [51] | Plasma (a)(b) | LC -QQQ | EOC (n = 117) HC (n = 27) (f) | t-Tests, Wilcoxon Rank Sum Test, ANOVA, Logistic Regression Analysis | ↑16:0-LPA ↑18:0-LPA↑ 18:1-LPA ↑ 18:2-LPA ↑20:4-LPA ↑22:6-LPA ↑ 18:0-A-LPA ↑16:0-An-LPA ↑18:0-An-LPA ↑18:0-An-LPA ↑Total A-LPA ↑Total LPA ↑16:0-LPA/20:4-LPA ↑16:0-LPI ↑18:0-LPI ↑20:4-LPI↑↑ S1P | TPR = 91.1%, TNR = 96.3% |
| [52] | Serum (a) | LC-QTOF | EOC (n = 30) HC (n = 30) IVS: EOC (n = 17) HC (n = 18) (c,f) | t-Test, PCA, PLS-DA | ↓2-piperidinone, ↑ eicosadienoic acid, ↑ 7-ketodeoxycholic acid, ↑varanic acid, ↑ 1-heptadecanoylglycerophosphoethanolamine, ↓2-hexaprenyl-3-methyl-6-methoxy-1, 4benzoquinone, ↓ lysoPC (15:0), ↓lysoPE (0:0/20:0), ↑DG (14:0/20:0/0:0), ↑PC (14:1/22:2), ↑galabiosylceramide (d18:1/18:1),↑ lactosylceramide(d18:1/22:0). | TPR=96.7%, TNR = 66.7%, AUC = 0.89 |
| [53] | Serum (b) | GC-MS | EOC (n = 40) HC (n = 35) IVS: EOC (n = 30) HC (n = 30) (c,f) | Autoscaling, t-Test, PCA, PLS-DA, Logistic Regression | ↑EFA C16:0; C18:0 ↓FFA C16:0 | TPR = 62.9%, TNR = 62.9%, AUC >0.68 |
| [54] | Plasma (a) | LC-QTOF | EOC (n = 50) BOT (n = 50) IVS: EOC (n = 30) BOT (n = 40) (c) (f) | TIC Normalization, Kruskal–Wallis Rank Sum Test, PLS-DA | ↓L-Tryptophan ↓LysoPC(18:3), ↓LysoPC(14:0) ↓ 2-Piperidinone | AUC = 0.84 |
| [55] | Serum (a) | DART-TOF | SPC (n = 44) BC,HC (n = 50) | Relative intensity normalization, ANOVA, PLS-DA | ↑ histamine, alanine, serine, cysteine, threonine, glycine | TPR = 100%, TNR = 98%, ACC = 99% |
| [56] | Serum/ (b) | LC-QQQ | EOC (n = 38) BOT (n = 62) HC (n = 50) (c,f) | Normalization By Sum, Log Transformation, Auto Scaling, t-Test, Welch’s t-Test, Mann-Whitney U Test, ANOVA, PLS-DA | ↑_α-aminoadipic acid ↓asparagine ↓citrulline ↑cystine, ↓glutamine ↓histidine ↑isoleucine ↓lysine ↓methionine ↓ornithine ↓threonine ↓ tryptophan | TPR>71%, TNR>72%, AUC>0.76 |
| [57] | Cyst fluid (a,b) | NMR | OC (n = 12) BC (n = 28) | Mann–Whitney U test | ↑ isoleucine ↑ valine ↑ threonine ↑lactic acid ↑lysine ↑ methionine ↑ glutamine ↑choline | / |
| [58] | Tissue | LC-MS/MS, GC-MS | EOC (n = 18) HC (n = 12) (c,f) | ANOVA, PCA | ↓ 1-methylimidazole acetate ↓taurine ↓phenol sulfate ↓ 6-phosphogluconate↑betaine ↑carnitine ↑malate ↑ fumarate ↑ N-acetylglycine ↑lactate ↑fucose ↑acetylcarnitine ↑butyrylcarnitine ↑propionylcarnitine ↑2aminobutyrate ↑N-acetylasparate (NAA) ↑Nascetyl- aspartyl-glutamate (NAAG) | / |
| [59] | Tissue (b) | NMR, MS | LGSOC (n = 15) HGSOC (n = 19) BC (n = 17) | Autoscaling, Log Transformation t-Test,Mann–Whitney U Test, ANOVA, PCA, PLS-DA, Logistic Regression | LGEOC: ↓phosphoryl choline ↑methionine / HGEOC: ↑PC ae C38:2 ↑PC aeC32:2 (from predictive model) | TPR > 95%, TNR >94%, AUC >0.92 |
| [60] | Cyst fluid, serum (b) | GC-MS | EOC (n = 25) BOT (n = 36) | Mann U Whitney, Kruskal Wallis Tests, Spearman’s Rank Correlation Testing | ↑ NAA | / |
| [61] | Cyst fluid (a) | NMR | EOC (n = 10) BOT (n = 8) | Probabilistic Quotient Normalization, Centering, Mann-Whitney Tests, PCA | ↓citrate↑ lysine | / |
| [62] | Urine | NMR | EOC (n = 40) HC (n = 62) IVS: EOC (n = 10) HC (n = 10) | Probabilistic Quotient Normalization, Log transformation, Autoscaling, Wilcoxon’s Rank-Sum Test, PCA, PLS-DA, OPLS-DA | ↓ Creatine ↓ Acetate ↓Succinate ↓Levoglucosan ↓ Lactate ↓Pyroglutamate ↓Formate ↓Isoleucine ↓Sucrose ↓ Trigonelline ↓Leucine ↓Asparagine ↓Urea ↓Glucose ↓Ethanolamine ↓Dimethylamine ↓4-Hydroxyphenylacetate ↓Creatinine ↓Alanine ↓Hippurate ↓1-Methylnicotinamide ↓Uracil ↓Valine ↓trans-Aconitate ↓methanol | TNR = 99% |
| [23] | Urine (a,b) | GC- LC-MS | OC (n = 4) HC (n = 8) (e) | Normalization to creatinine / ANOVA, PLS-DA | ↑ 4-androstene-3,17-dione ↑ 1-methyl-adenosine ↑ 3-methyluridine | / |
| [63] | Urine (a) | LC-QTOF | EOC (n = 58) BOT (n = 62) HC (n = 54) | TIC normalization, Kruskal−Wallis Rank Sum Test, PCA, PLS-DA | ↑imidazol-5-yl-pyruvate ↓L-histidine ↓prasterone sulfate ↑N-acetylneuraminate 9-phosphate ↑N4-acetylcytidine ↑urate-3ribonucleoside ↑pseudouridine ↓Nα-acetyl-L-glutamine ↑succinic acid ↑(S)-reticuline ↑N-acetylneuraminic acid ↑3-sialyl-N-acetyllactosamine ↑β-nicotinamide mononucleotide ↑prolylhydroxyproline ↑selenocystathionine ↑ 3-sialyllactose↑N-acetylgalactosamine 4-sulfate ↓glycodeoxycholate ↑3-dehydroquinic acid ↑3-indolelactic acid↑LPA(P-16:0e/0:0) | AUC = 0.728, AUC = 0.87 (+ CA125) |
| [64] | Urine (a) | LC-QTOF | EOC (n = 22) BOT (n = 29) HC (n = 25) | Intensity signal normalization, t-Test, PCA, OPLS-DA | ↑pseudouridine, ↑phytosphingosine, ↓hippuric acid, and↓ homovanillic acid sulfate | / |
| [65] | Breath (b) | GC-MS, nanoarray | EOC (n = 28) BC (n = 60) HC (n = 34) IVS: EOC (n = 12) BC (n = 26) HC (n = 14) (f) | ANOVA, DFA | ↑decanal;↑nonanal; ↑styrene↑2-butanone;↑hexadecane | TRP>73%, TNR>77%, ACC >75% |
Publisher’s Note: MDPI stays neutral with regard to jurisdictional claims in published maps and institutional affiliations. |
© 2020 by the authors. Licensee MDPI, Basel, Switzerland. This article is an open access article distributed under the terms and conditions of the Creative Commons Attribution (CC BY) license (http://creativecommons.org/licenses/by/4.0/).
Share and Cite
Saorin, A.; Di Gregorio, E.; Miolo, G.; Steffan, A.; Corona, G. Emerging Role of Metabolomics in Ovarian Cancer Diagnosis. Metabolites 2020, 10, 419. https://doi.org/10.3390/metabo10100419
Saorin A, Di Gregorio E, Miolo G, Steffan A, Corona G. Emerging Role of Metabolomics in Ovarian Cancer Diagnosis. Metabolites. 2020; 10(10):419. https://doi.org/10.3390/metabo10100419
Chicago/Turabian StyleSaorin, Asia, Emanuela Di Gregorio, Gianmaria Miolo, Agostino Steffan, and Giuseppe Corona. 2020. "Emerging Role of Metabolomics in Ovarian Cancer Diagnosis" Metabolites 10, no. 10: 419. https://doi.org/10.3390/metabo10100419