Article

Semantic Segmentation of Conjunctiva Region for Non-Invasive Anemia Detection Applications

by
Sivachandar Kasiviswanathan
1,
Thulasi Bai Vijayan
1,
Lorenzo Simone
2 and
Giovanni Dimauro
3,*
1
Department of Electronics and Communication Engineering, KCG College of Technology, Chennai 600097, India
2
Department of Computer Science, University of Pisa, 56127 Pisa, Italy
3
Department of Computer Science, University of Bari, 70125 Bari, Italy
*
Author to whom correspondence should be addressed.
Electronics 2020, 9(8), 1309; https://doi.org/10.3390/electronics9081309
Submission received: 29 June 2020 / Revised: 28 July 2020 / Accepted: 10 August 2020 / Published: 14 August 2020

Abstract

:
Technology is changing the future of healthcare, technology-supported non-invasive medical procedures are more preferable in the medical diagnosis. Anemia is one of the widespread diseases affecting the wellbeing of individuals around the world especially childbearing age women and children and addressing this issue with the advanced technology will reduce the prevalence in large numbers. The objective of this work is to perform segmentation of the conjunctiva region for non-invasive anemia detection applications using deep learning. The proposed U-Net Based Conjunctiva Segmentation Model (UNBCSM) uses fine-tuned U-Net architecture for effective semantic segmentation of conjunctiva from the digital eye images captured by consumer-grade cameras in an uncontrolled environment. The ground truth for this supervised learning was given as Pascal masks obtained by manual selection of conjunctiva pixels. Image augmentation and pre-processing was performed to increase the data size and the performance of the model. UNBCSM showed good segmentation results and exhibited a comparable value of Intersection over Union (IoU) score between the ground truth and the segmented mask of 96% and 85.7% for training and validation, respectively.

1. Introduction

Anemia is a high prevalence blood-related disorder developed due to the decrease in the number of red blood cells or hemoglobin level or a lowered oxygen-carrying capacity of the blood [1,2,3]. Severe anemia can cause damage to vital organs until death [4,5,6,7]; it is also responsible for increased morbidity in pre-school children and pregnant women. Iron deficiency anemia is considered to be among the most important contributing factors to the global burden of disease [8,9,10,11,12,13]. In fact, one-third of anemia cases in adults are attributable to iron deficiencies, folate, and vitamin B12. Iron deficiency anemia summarizes approximately 50% of nutrient-scarred anemia cases, of which bleeding caused by gastrointestinal lesions is the first cause.
It is a subtle disease as has a slow evolution, does not show manifest symptoms until it becomes severe, because the human body compensates lack of oxygen. The symptomatology varies but recurrent symptoms include fatigue, dizziness or light-headedness, headache, pallor, chest pain, weakness, irregular heartbeat, shortness of breath, and cold hands and feet. Prevention or early detection of anemia will reduce serious complications and helps to lead a healthy life.
To carry out a preliminary and instantaneous diagnosis, the study of anamnesis and the physical examination are often used in clinical practice [14,15,16,17,18,19,20,21,22]. Health professionals perform a physical examination of anatomical sites such as conjunctiva, tongue, palmar crease, nail beds since they are indicators to raise suspicion of anemia, but it must also be said that there are less optimistic findings, for example, Da Silva et al. [21] evaluated the correlation between the opinions expressed by different doctors and pointed out that the ideal condition for examining skin color is with natural daylight or without direct light on the skin: Therefore the different ambient lighting can influence a correct diagnosis. However, also the result conceived by the examiner may differ from one another depending upon their expertise level.
The gold standard test is blood cell counting that is normally invasive or at least minimally invasive. Often this test is not recommended as an example in the case of infants, the elderly, and pregnant women. Furthermore, frequent sampling is uncomfortable and expensive. Then, the techniques described in this paper are considered to be extremely important, particularly for patients who need frequent blood tests or who have difficulty going frequently to test labs. More generally, this type of analysis is suitable in the increasingly frequent cases of managing patient diseases directly in their homes, through appropriate diagnostic and therapeutic care pathways and services such as medical records [23,24]. For this reason, it is of great interest to study methods and design tools that allow us to monitor the hemoglobin concentration in a non-invasive way, with reduced costs, both in the laboratory and at home.
This is the reason why many authors [25,26] show interest in the pallor of the exposed tissues of the human body to estimate anemia. Pallor is characterized by a lack of color in the skin and mucous membranes due to a low level of circulating hemoglobin. This may be evident on the entire body, but, as we have said above, is easily observed in areas where blood vessels are close to the surface, such as the palm, the nail bed, and mucous membranes such as the tongue or conjunctivae.
The technology-assisted diagnosis is increasing in the last years versus the traditional one, due to its higher reliability and unbiased results. In the last years, speech and image analysis and computer vision also powered by deep learning and its ability to rapidly extract the required information from digital images or videos allowed the development of interesting medical applications and diagnostic tools to support specialists [27,28,29,30,31,32,33,34].
Deep learning models can perform classification, classification with localization, semantic segmentation, instance segmentation, and object detection tasks with a high level of understanding.
Image segmentation, the process of identifying or partitioning the needed information from the digital images, nowadays is applied to microscopic images to satellite images for different applications. Thresholding, Clustering, Histogram-based method, Edge detection, Region-growing, Watershed transformation are a few traditional image processing techniques used for segmentation. Specifically, semantic segmentation is the process of labeling each pixel of an image with a predefined class. In recent years, researchers focusing towards deep learning-based image segmentation due to the availability of online resource materials, easy accessibility of high computational power, availability of computer vision and other supporting libraries, and the potential of Convolution Neural Network architecture in obtaining effective segmentation results [35,36,37,38,39]. In the literature, an interesting application involving neural networks and more broadly computer vision techniques is microscopy image analysis [40,41], the analogy with our domain stands in various environmental factors which can lead to a false interpretation of the results by human professionals.
As reported by earlier works, a pale conjunctiva is considered an accurate sign of anemia [42,43,44]. Hence, it is considered as a Region of Interest (ROI), and typically manual cropping is performed on eye images to extract its color features, while automatic segmentation tried for this application using image processing techniques still needs some improvement. To fully automate the diagnostic support and automatically detect the suspicion of anemia, as an example on a mobile device or web application, an automatic segmentation of the ROI is required to avoid the subjective choice of the ROI by the patients.
In this paper, the transfer learning on U-Net architecture for semantic image segmentation is applied, as well as the process of labeling each pixel of an image with a predefined class. Section 2 describes the materials and methods used for the proposed U-net based segmentation model. Section 3 explains the details about the structure and organization of layer modules of the proposed U-net architecture. Section 4 discusses the performance of the model during training and validation and the segmentation results and Section 5 concludes the work.

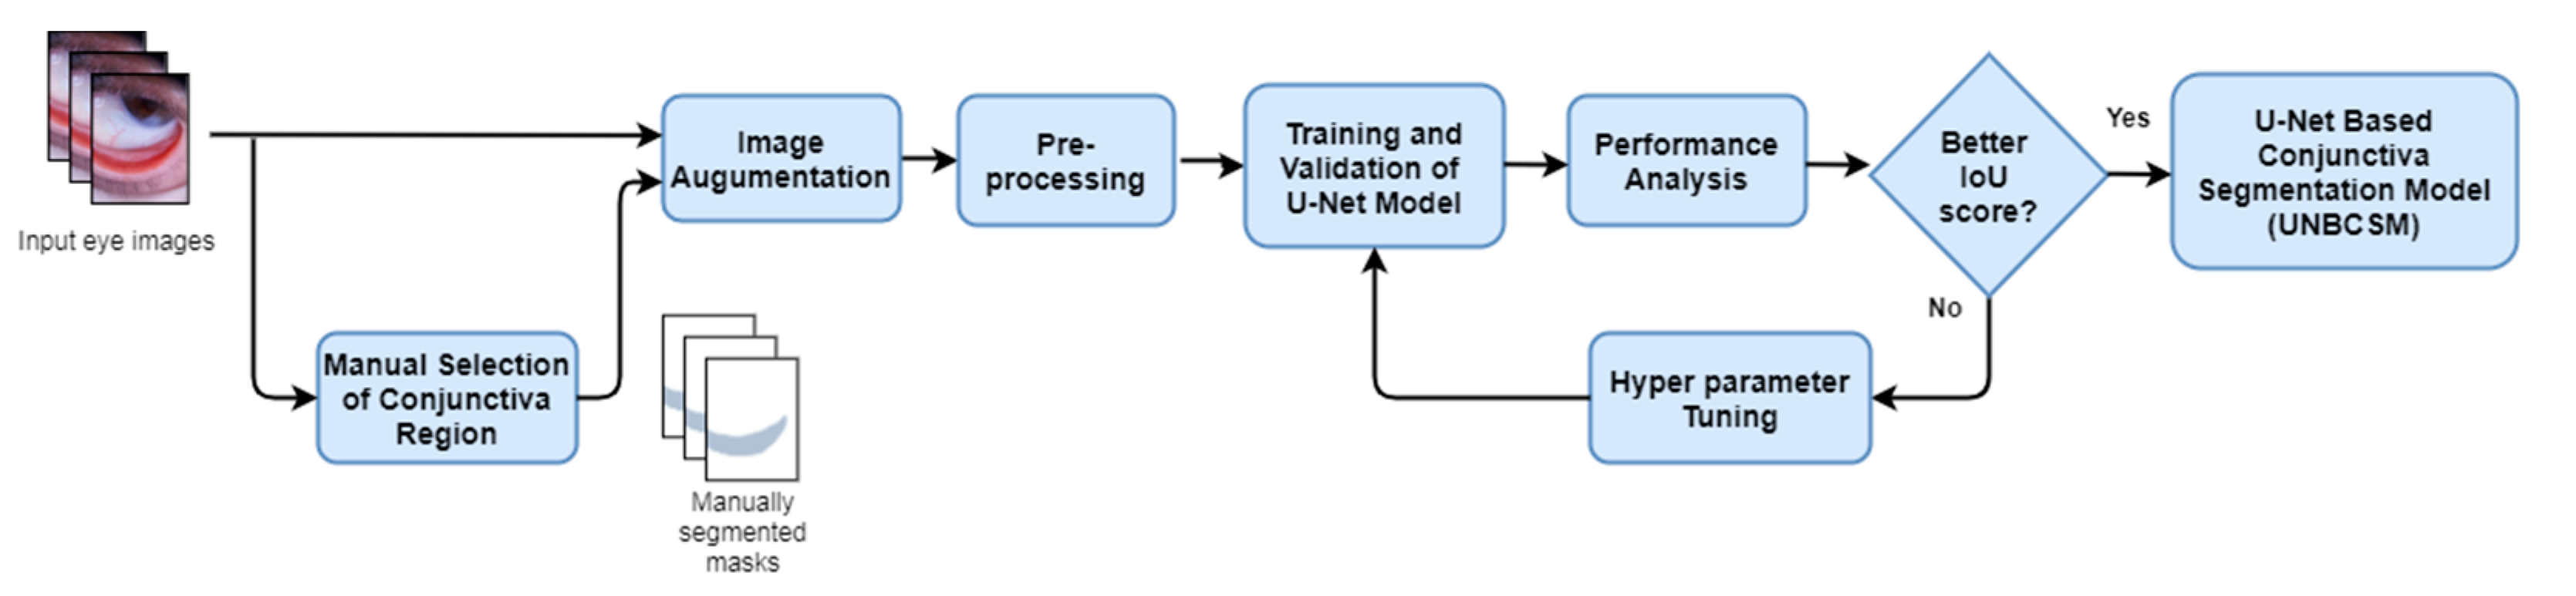
2. U-Net Based Conjunctiva Segmentation Model (UNBCSM)

Researchers from related works used hundreds of samples for conducting and validating their study [45,46,47,48,49,50] and most of the conjunctiva images were not publicly available such as retinal fundus images. The acquisition system consists of a macro-lens assembled into a specially designed, 3D-printed lightened spacer and a smartphone. The lens can take high-resolution images being attached to a smartphone (Aukey PL-M1 25 mm 10 × macro lens). This device allows obtaining high resolution images of the eye, insensitive to the ambient lighting conditions in conformity with diagnostic physical examination procedures. The model uses 135 eye images with a clear visible lower eyelid for training and validation. The semantic segmentation of conjunctiva is challenging due to the presence of fluids, nerves, folds, light reflections, and shadows in the eye region which motivated us to apply deep learning techniques. For this application we have chosen an architecture based on U-Net, a popular convolutional neural network model which showed fast and better segmentation results for modest data and promising results for biomedical image segmentation tasks. In Figure 1, we show the steps involved in developing the proposed U-Net Based Conjunctiva Segmentation Model (UNBCSM), which will be furtherly explained in Section 3.

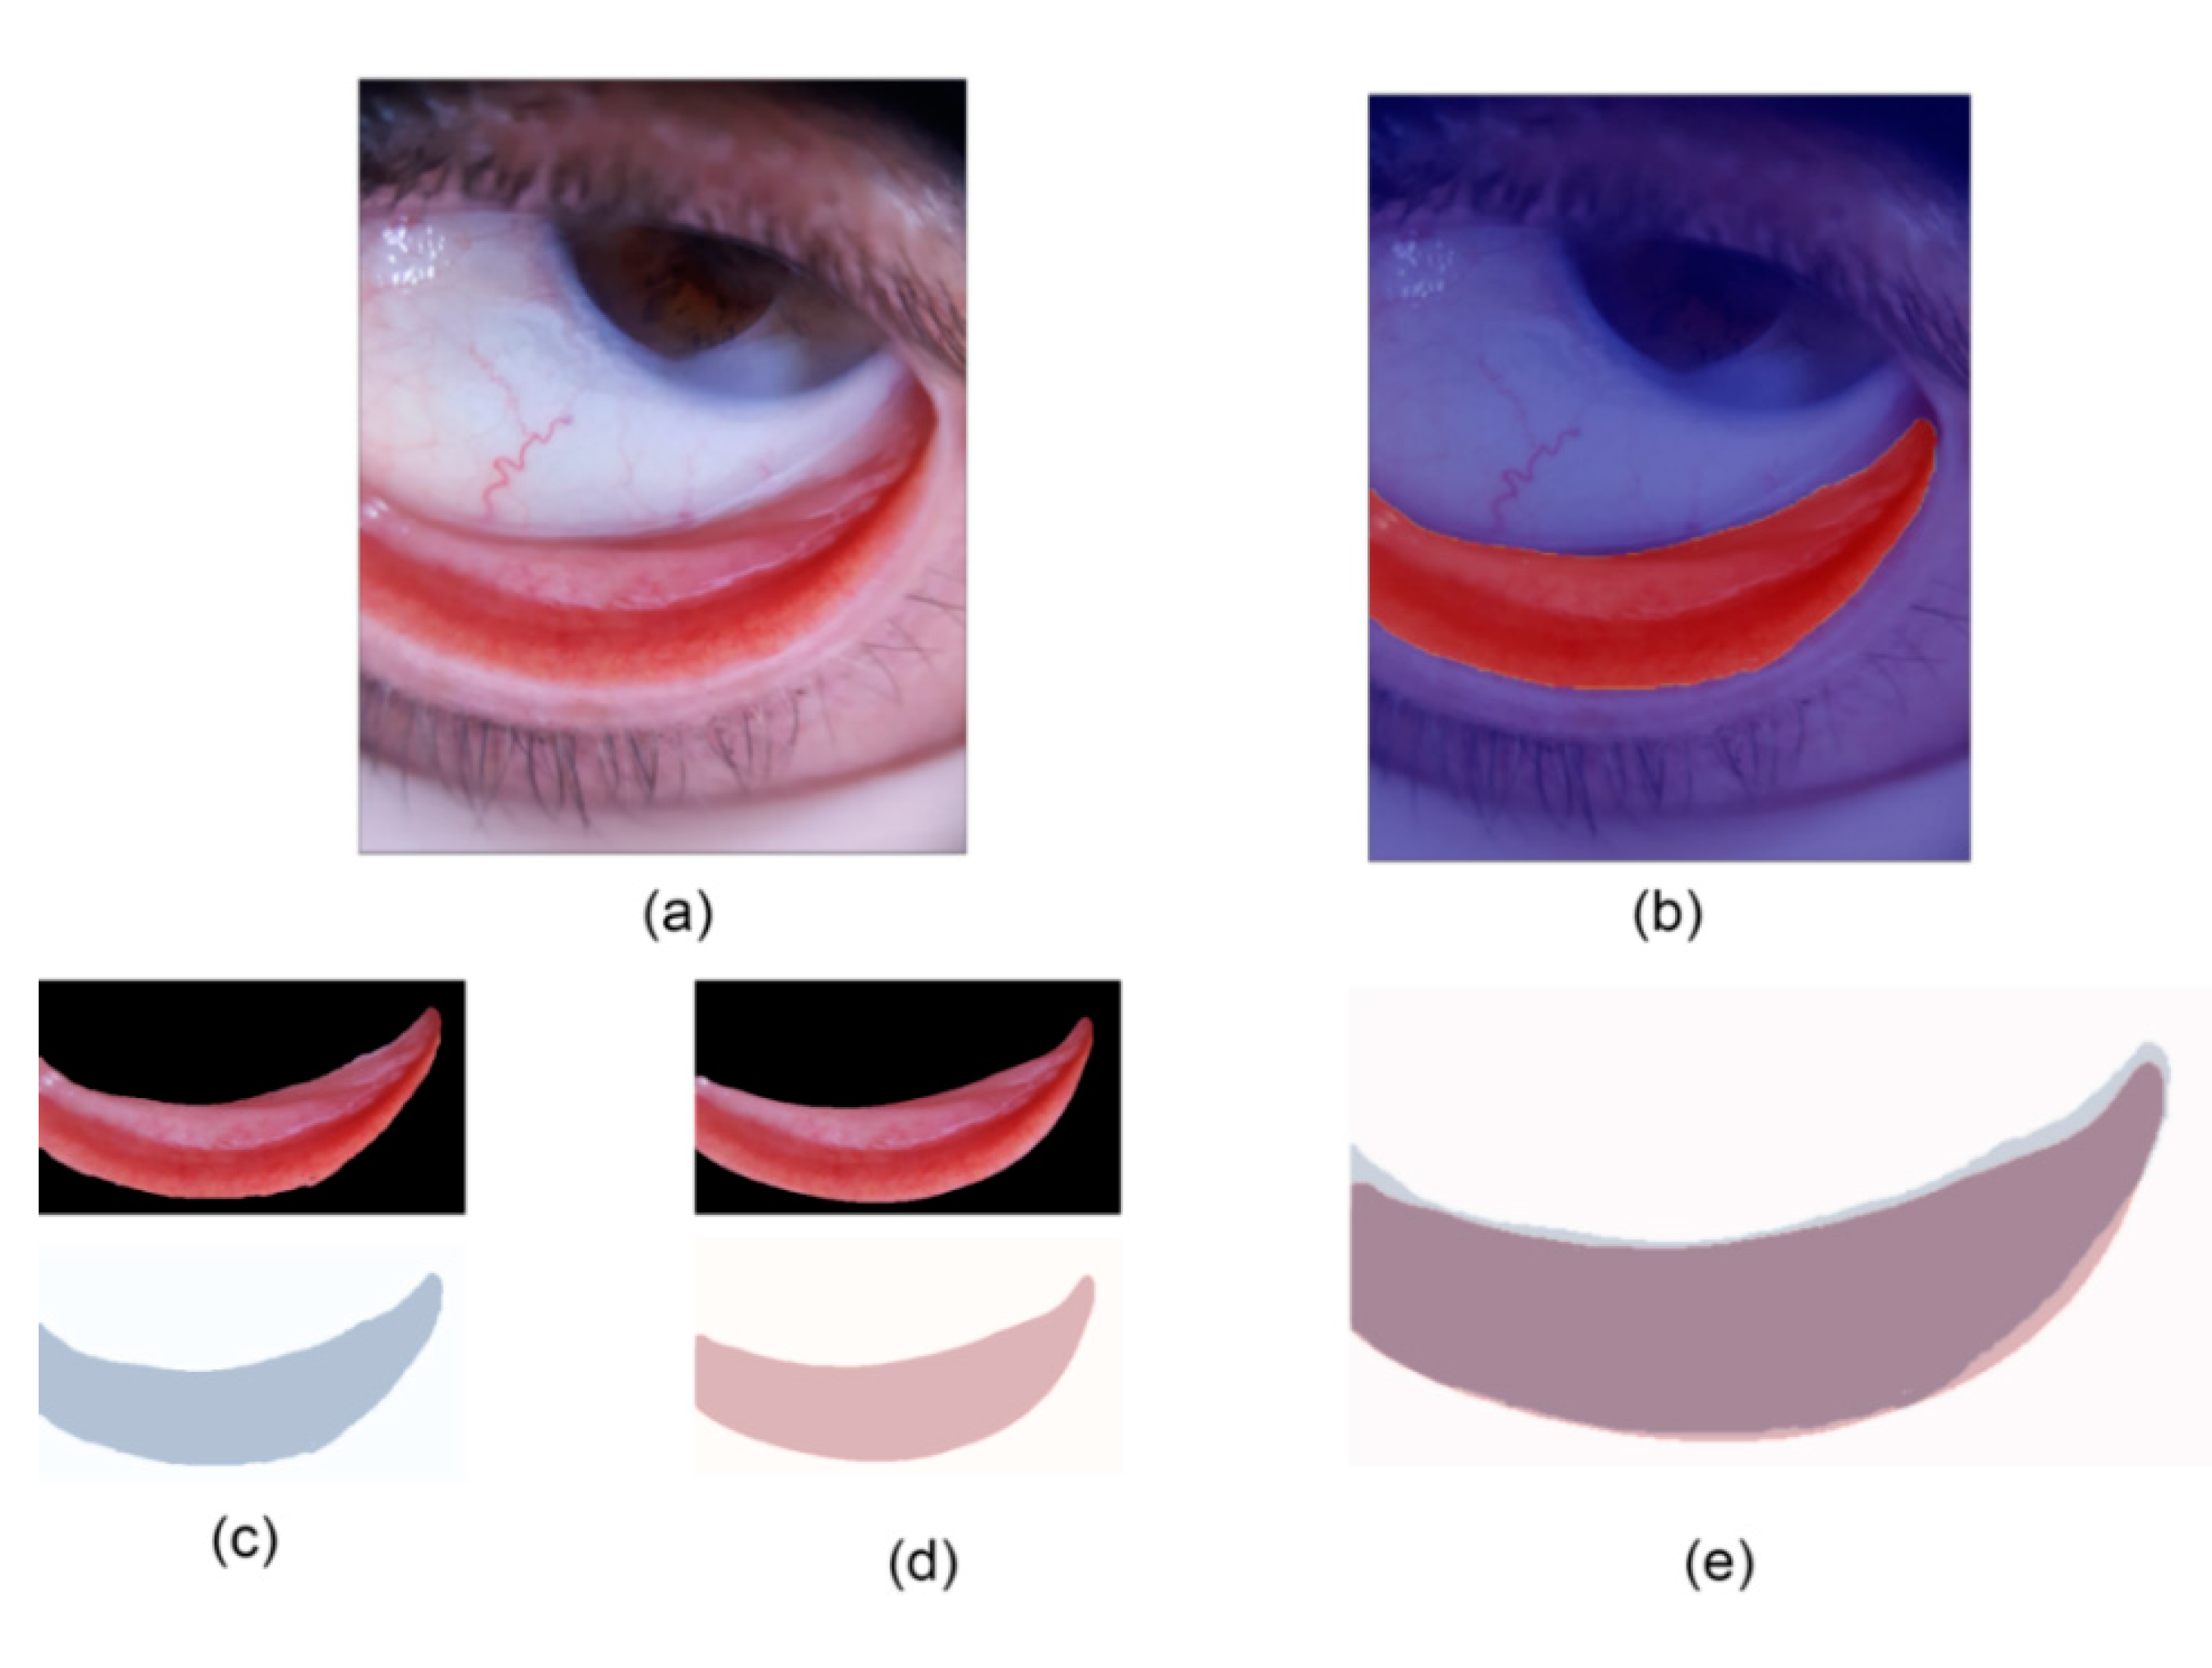
2.1. Segmentation Mask Creation

UNBCSM architecture uses a RGB image in JPEG format provided to ‘input image’ block and a manually segmented mask in a NumPy array format as the ground truth for training. Each digital image underwent a manual segmentation process, isolating and cropping regions of palpebral and forniceal conjunctiva, providing the labels to the supervised deep learning model using Pascal masking. The mask selection has been supported by an interactive tool using the CV2 library, that we have developed. The labeling of pixels is performed by choosing the eyelid region manually through the mouse input. When an image is labeled, the mouse strokes are saved as a binary NumPy array. We call this two-dimensional NumPy array a ‘mask’. The original segmentation masks, which are non-binary RGB triplets, have been converted to PASCAL masks by grey scale conversion and thresholding. We stored the segmented mask as a binary matrix with zeros referring to the background and ones to the conjunctiva or meaningful ROI. Both the right and left corner area of the conjunctiva were not included in the selection if affected by light reflections or shadows in the segmentation mask since these portions are more likely affected by flaws caused by fluids and color changes. In a few images the lower portion of the bulbar conjunctiva is similar in color with the palpebral conjunctiva hence these portions are omitted. All the bright and dark spots are omitted during manual segmentation, giving to the network the capability of focusing on meaningful details. Mask creation for all 135 images was performed manually for augmentation by a specific program and the resulted mask was overlaid with the corresponding augmented image and verified.

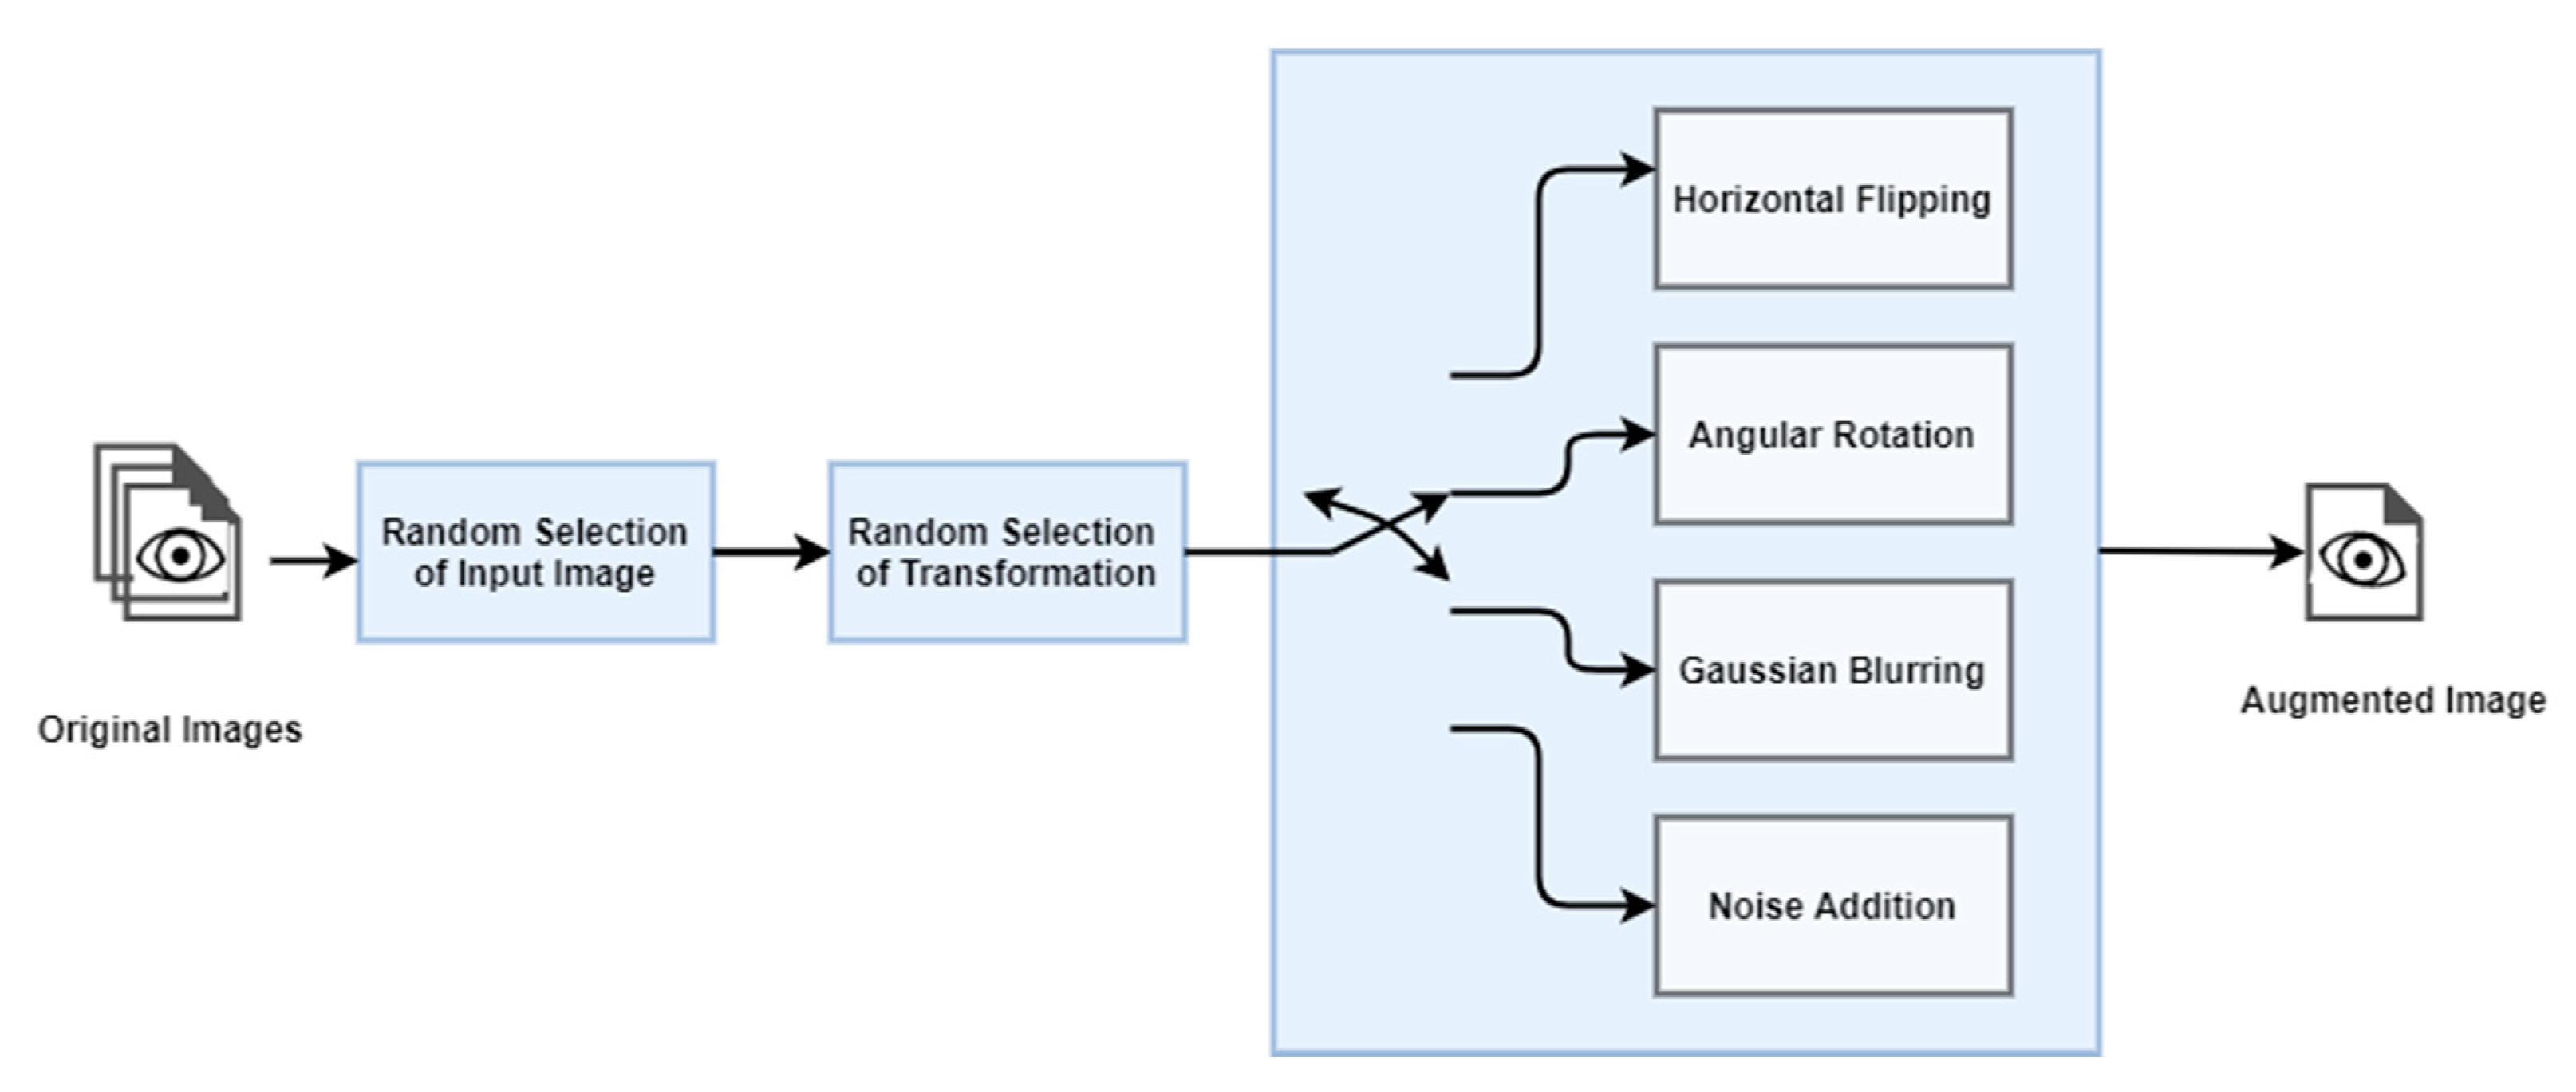
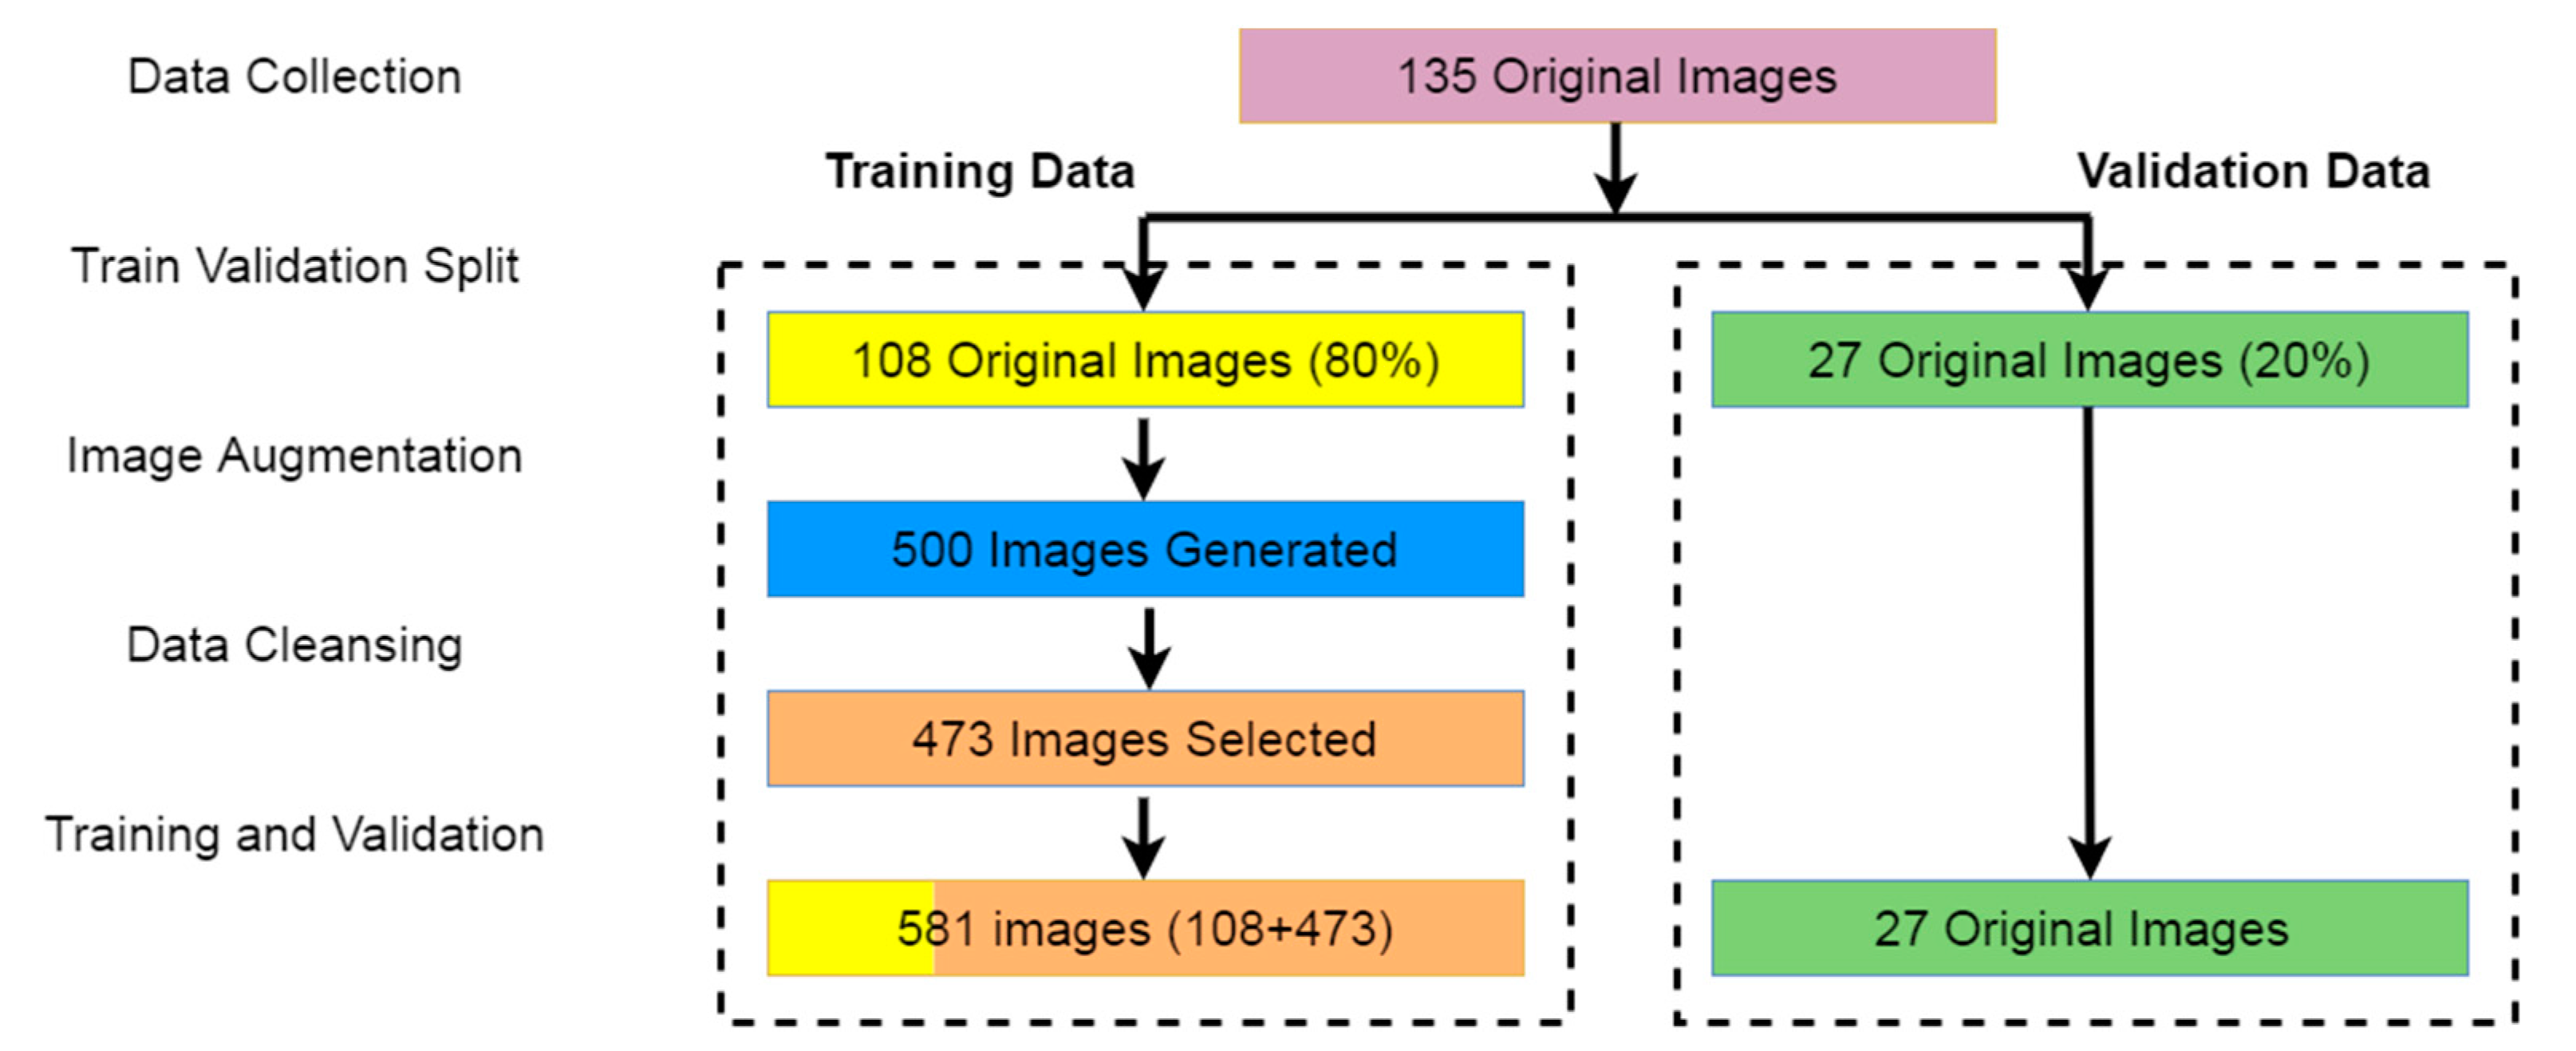
2.2. Image Augmentation and Pre-Processing

To increase the data size for training the segmentation model image augmentation was performed. The augmentation process utilized CV2 and NumPy libraries to create slightly different images of the original ones using the following rotational and non rotational techniques:
  • Angular Rotation (between −45 to 45 degrees) at angle increments of 5 degrees
  • Horizontal flipping
  • Gaussian Blur
  • Noise addition
These techniques are randomly chosen and applied to the randomly selected original images of training data (Figure 2). Each of these augmentation techniques has been applied to both the feature images as well as the label NumPy array pixel-wise correspondingly. The image augmentation technique is applied only for the training set images and its corresponding masks.
To improve the training time and to reduce the memory, the required image resolution was reduced to 512 × 384 by a resizing technique. The segmentation masks are also resized to the same resolution to make it compatible with the resized images. Input data are normalized in order to feed them to the model.
Vertical flipping, contrast enhancement, and warp shifting transformation techniques are also used for image augmentation. Since the images are captured by the specially designed spacer, vertical flipping, warp shifting, and angular rotations with a higher angle increments have not shown significant improvement in results. These transformation techniques can be helpful in segmenting the conjunctiva region from the unmodified smartphone captured eye images.

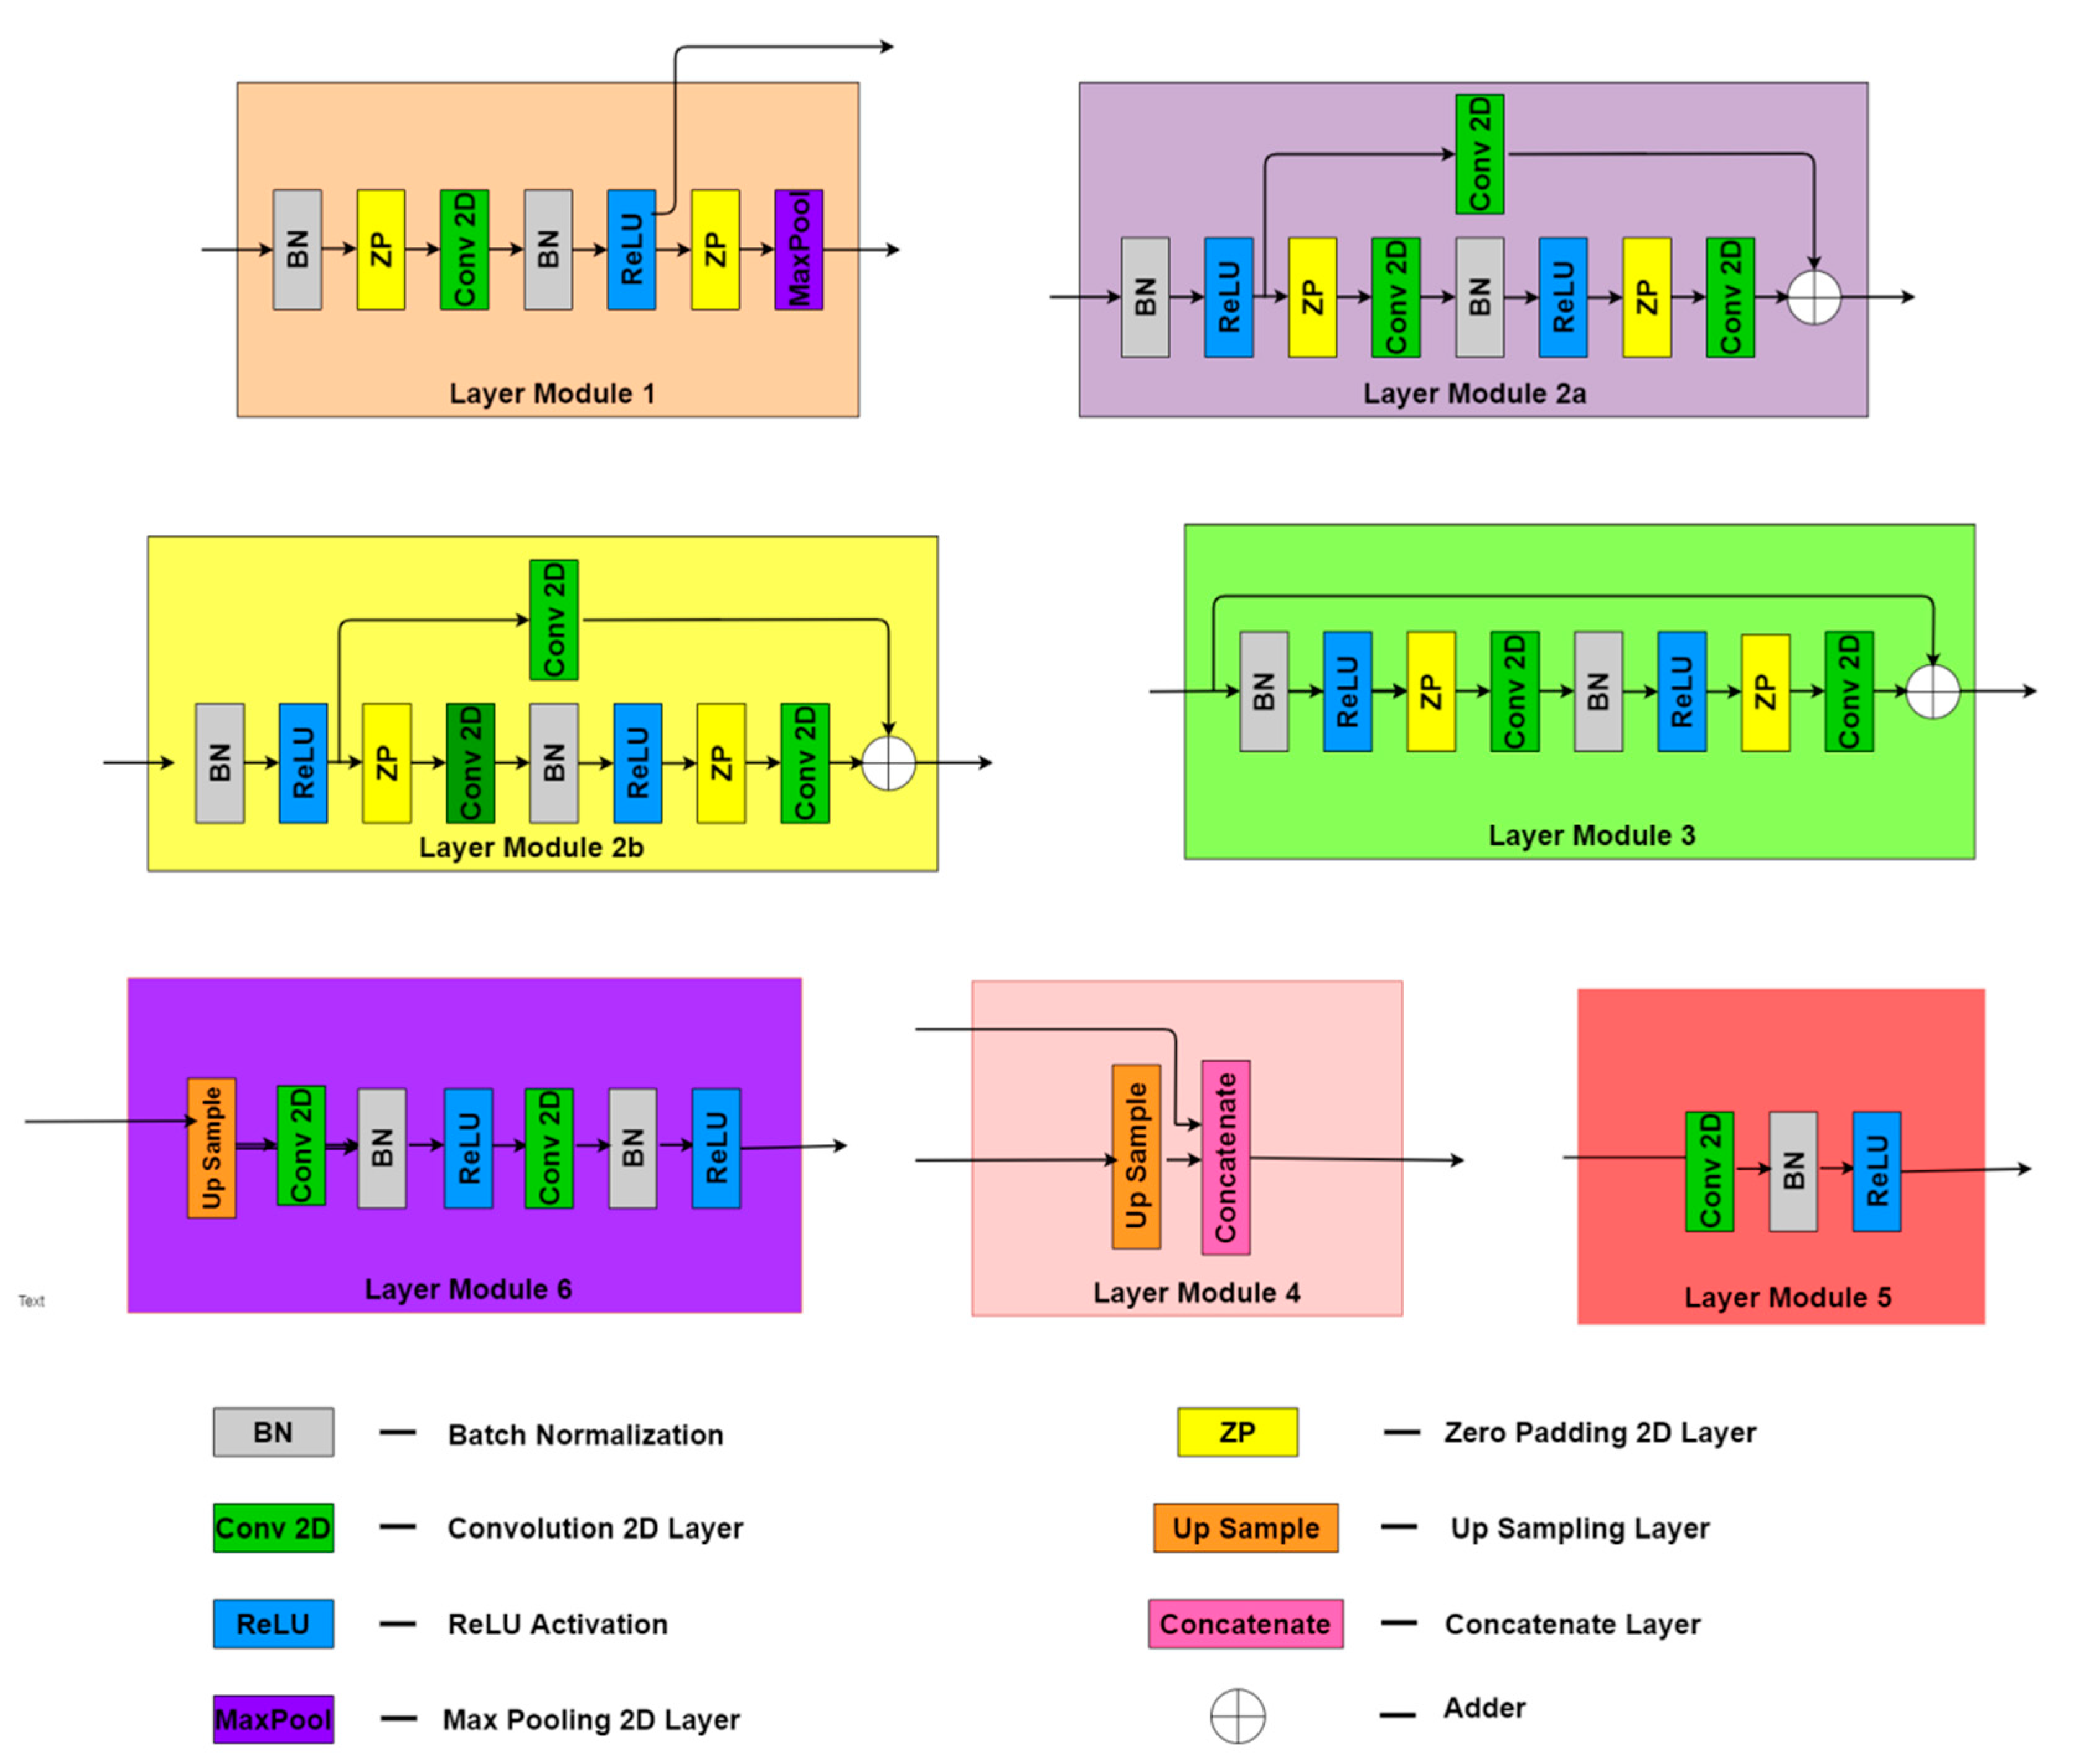
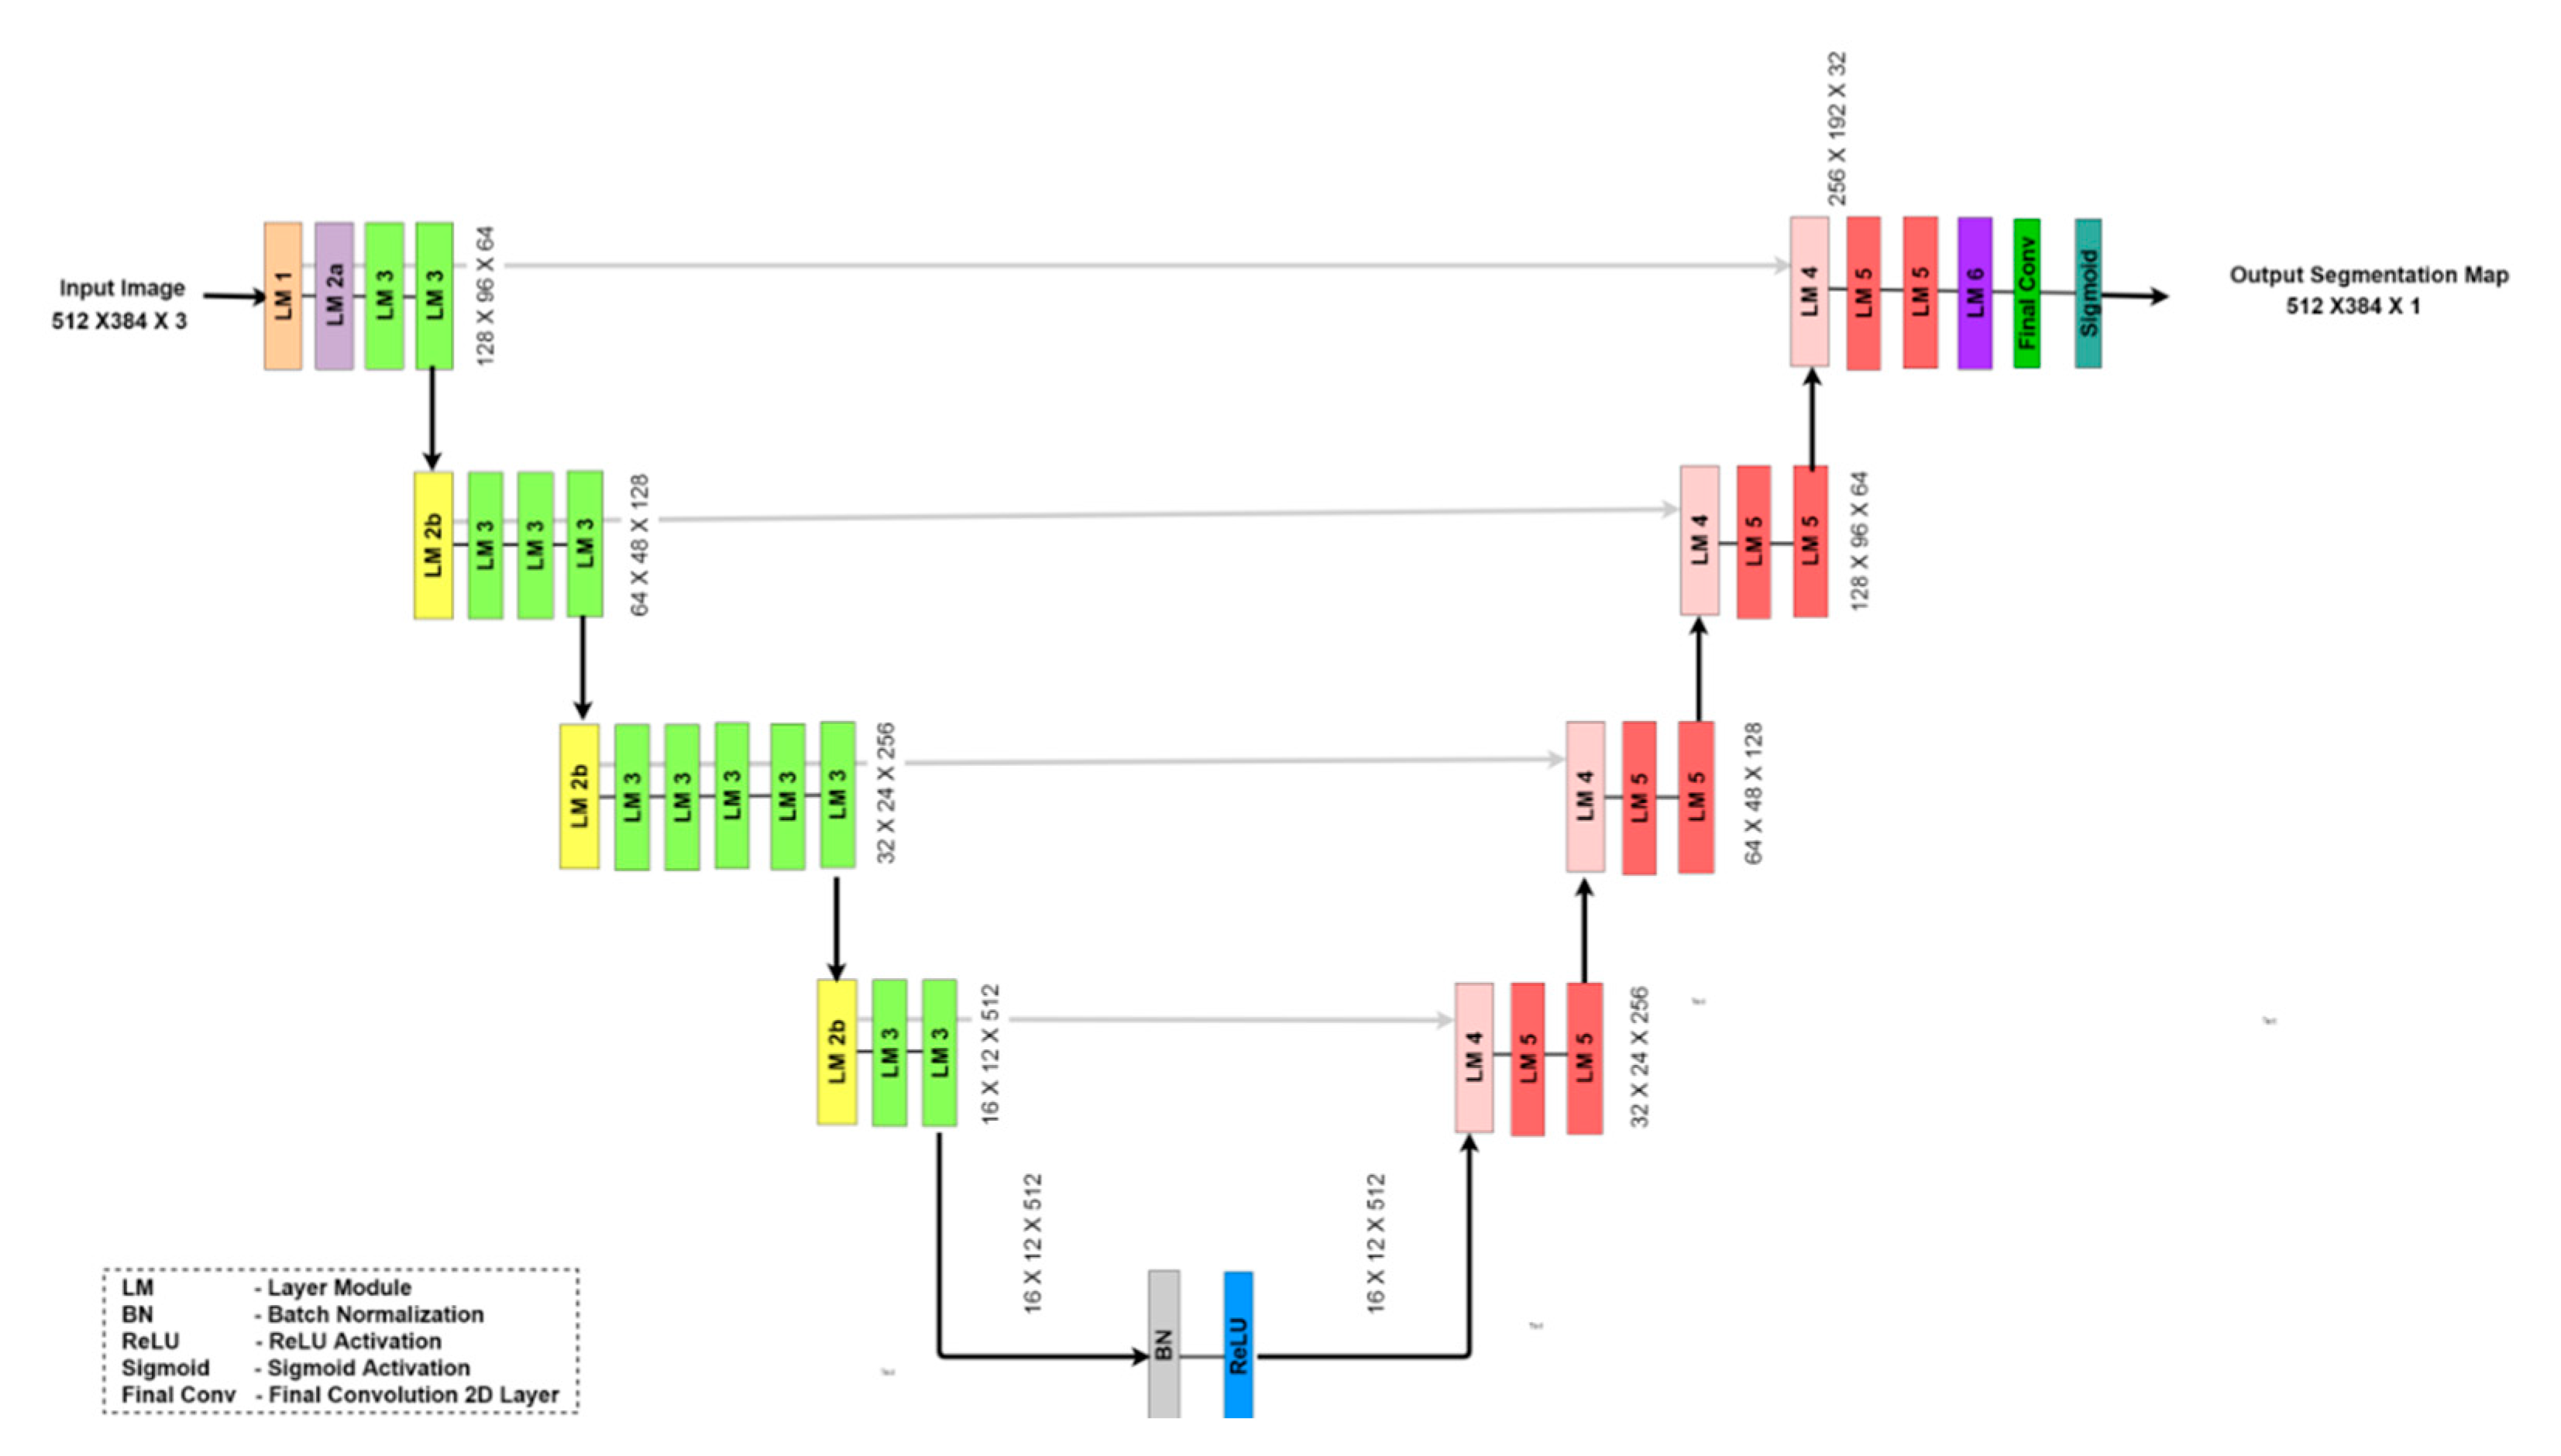
3. U-Net Architecture and Fine-Tuning

Traditional U-Net architectures use a dual path approach for retrieving and localize the overall image context. A contracting path has been used to capture the context and a symmetric expanding layer has been used for enabling precise localization [35]. This paper discusses a model that differs from the traditional U-Net model in the following ways:
  • Usually max-pooling layers appear at each stage whereas in this model, max pooling is attempted only at the first stage in the first layer group. Convolutional layers with stride two are replacing the max pooling layers.
  • With this model we introduce more activation and normalization layers than the traditional model.
  • Dropout layers have been removed in favor of making this model specific to the eye segmentation application.
The basic U-Net architecture consists of a contracting path which performs down sampling and the right side as an expanding path responsible for the transposed convolution. The details about the layers are clearly visible in Figure 3.
The layers of this UNBCSM architecture shown in Figure 4 can be grouped as six Layer Modules (LM), apart from these, there are some individual layers used as coupling between two Layer Modules.
Layer module 1 consists of normalization, padding, convolution, activating, and max-pooling layers, being the only one with a max-pooling layer. This is to reduce the model’s sensitivity to the location while keeping the overall context. As this application tries to detect a single class of object by segmentation (eyelid/lower palpebral conjunctiva), the one max-pooling layer is sufficient. Layer Module 2 has two subtypes where Layer Module 2a differs from Layer Module subtype 2b by the stride value. Layer Module 2a is also known as Identity Block having a Conv 2D layer with stride 1 and Layer Module 2b having the Conv2D layer with stride 2 for dimensionality reduction. We have employed ResNet-34 as a backbone, due to its efficiency obtained in the performance analysis.
As the model progresses downwards on the left side, the down sampling and convolutional layers perform the segmentation task. This information is inherently saved in the model weights and a schema arises which gets remapped back to the original size as the model progresses upwards on the right side. The Layer Modules 4, 5, and 6 are fairly simpler compared to their left side counterparts and they comprise of up-sampling, normalization, and activation layers. The output layer consists of a final convolutional layer followed by a sigmoid activation function used to detect the labels for the binary classification task.
Google Colab execution runtime with GPU has been used to train, validate, and assess the performance of the segmentation model. UNBCSM was trained with 581 images which includes 108 original images and 473 images obtained by image augmentation techniques. The split validation technique was used instead of the N-fold cross validation technique, since the augmented images of the validation set present in the training set will over-fit the segmentation model. To avoid this issue, 20% of the original images, 27 images were randomly selected and kept exclusive for validation. The details about the number of images used at each stage are shown in Figure 5.
For a fixed batch size, epochs, and learning rate the model was trained and validated with different combinations of backbones such as ResNet-18, ResNet-34, ResNet-50, and ResNet-101 with ‘imagenet’ weights. The model trained with ResNet-34 showed a better performance showing competitive execution time over ResNet-50 and ResNet-101. We performed an extensive model selection phase in order to select the architecture that better minimizes the estimated risk, based on validation results. The model was trained with different batch sizes (4, 8, 16, 32, and 64). As we would expect lower batch sizes tend to increase the training time with no significant improvements in performance and batch size 16 shows a comparable performance with less execution time. Balanced Cross Entropy_Jaccard Loss (bce_jaccard_loss) is considered for training since it eliminates the class unbalanced issue during training.
The model with a ‘ResNet-34′ backbone with pre-initialized weights from ‘imagenet’ was trained with different learning rates. The lower learning rate reduces the difference between the training and validation score but results less in the overall score. The higher learning rate (>0.001) creates spikes in the learning curve. The learning rate for the model is assigned by the Learning Rate (LR) scheduling technique, it trains the model with four different learnings LR = 10 3 for epochs 1 to 10, LR = 10 4 for epochs 11 to 20, LR = 10 5 for epochs 21 to 80, and LR = 10 6 for 81 to 100, and showed better learning curves as shown in Figure 6. The selected parameters are shown in Table 1. The model requires 345 ms to run a single batch step and 14 ms for an epoch.

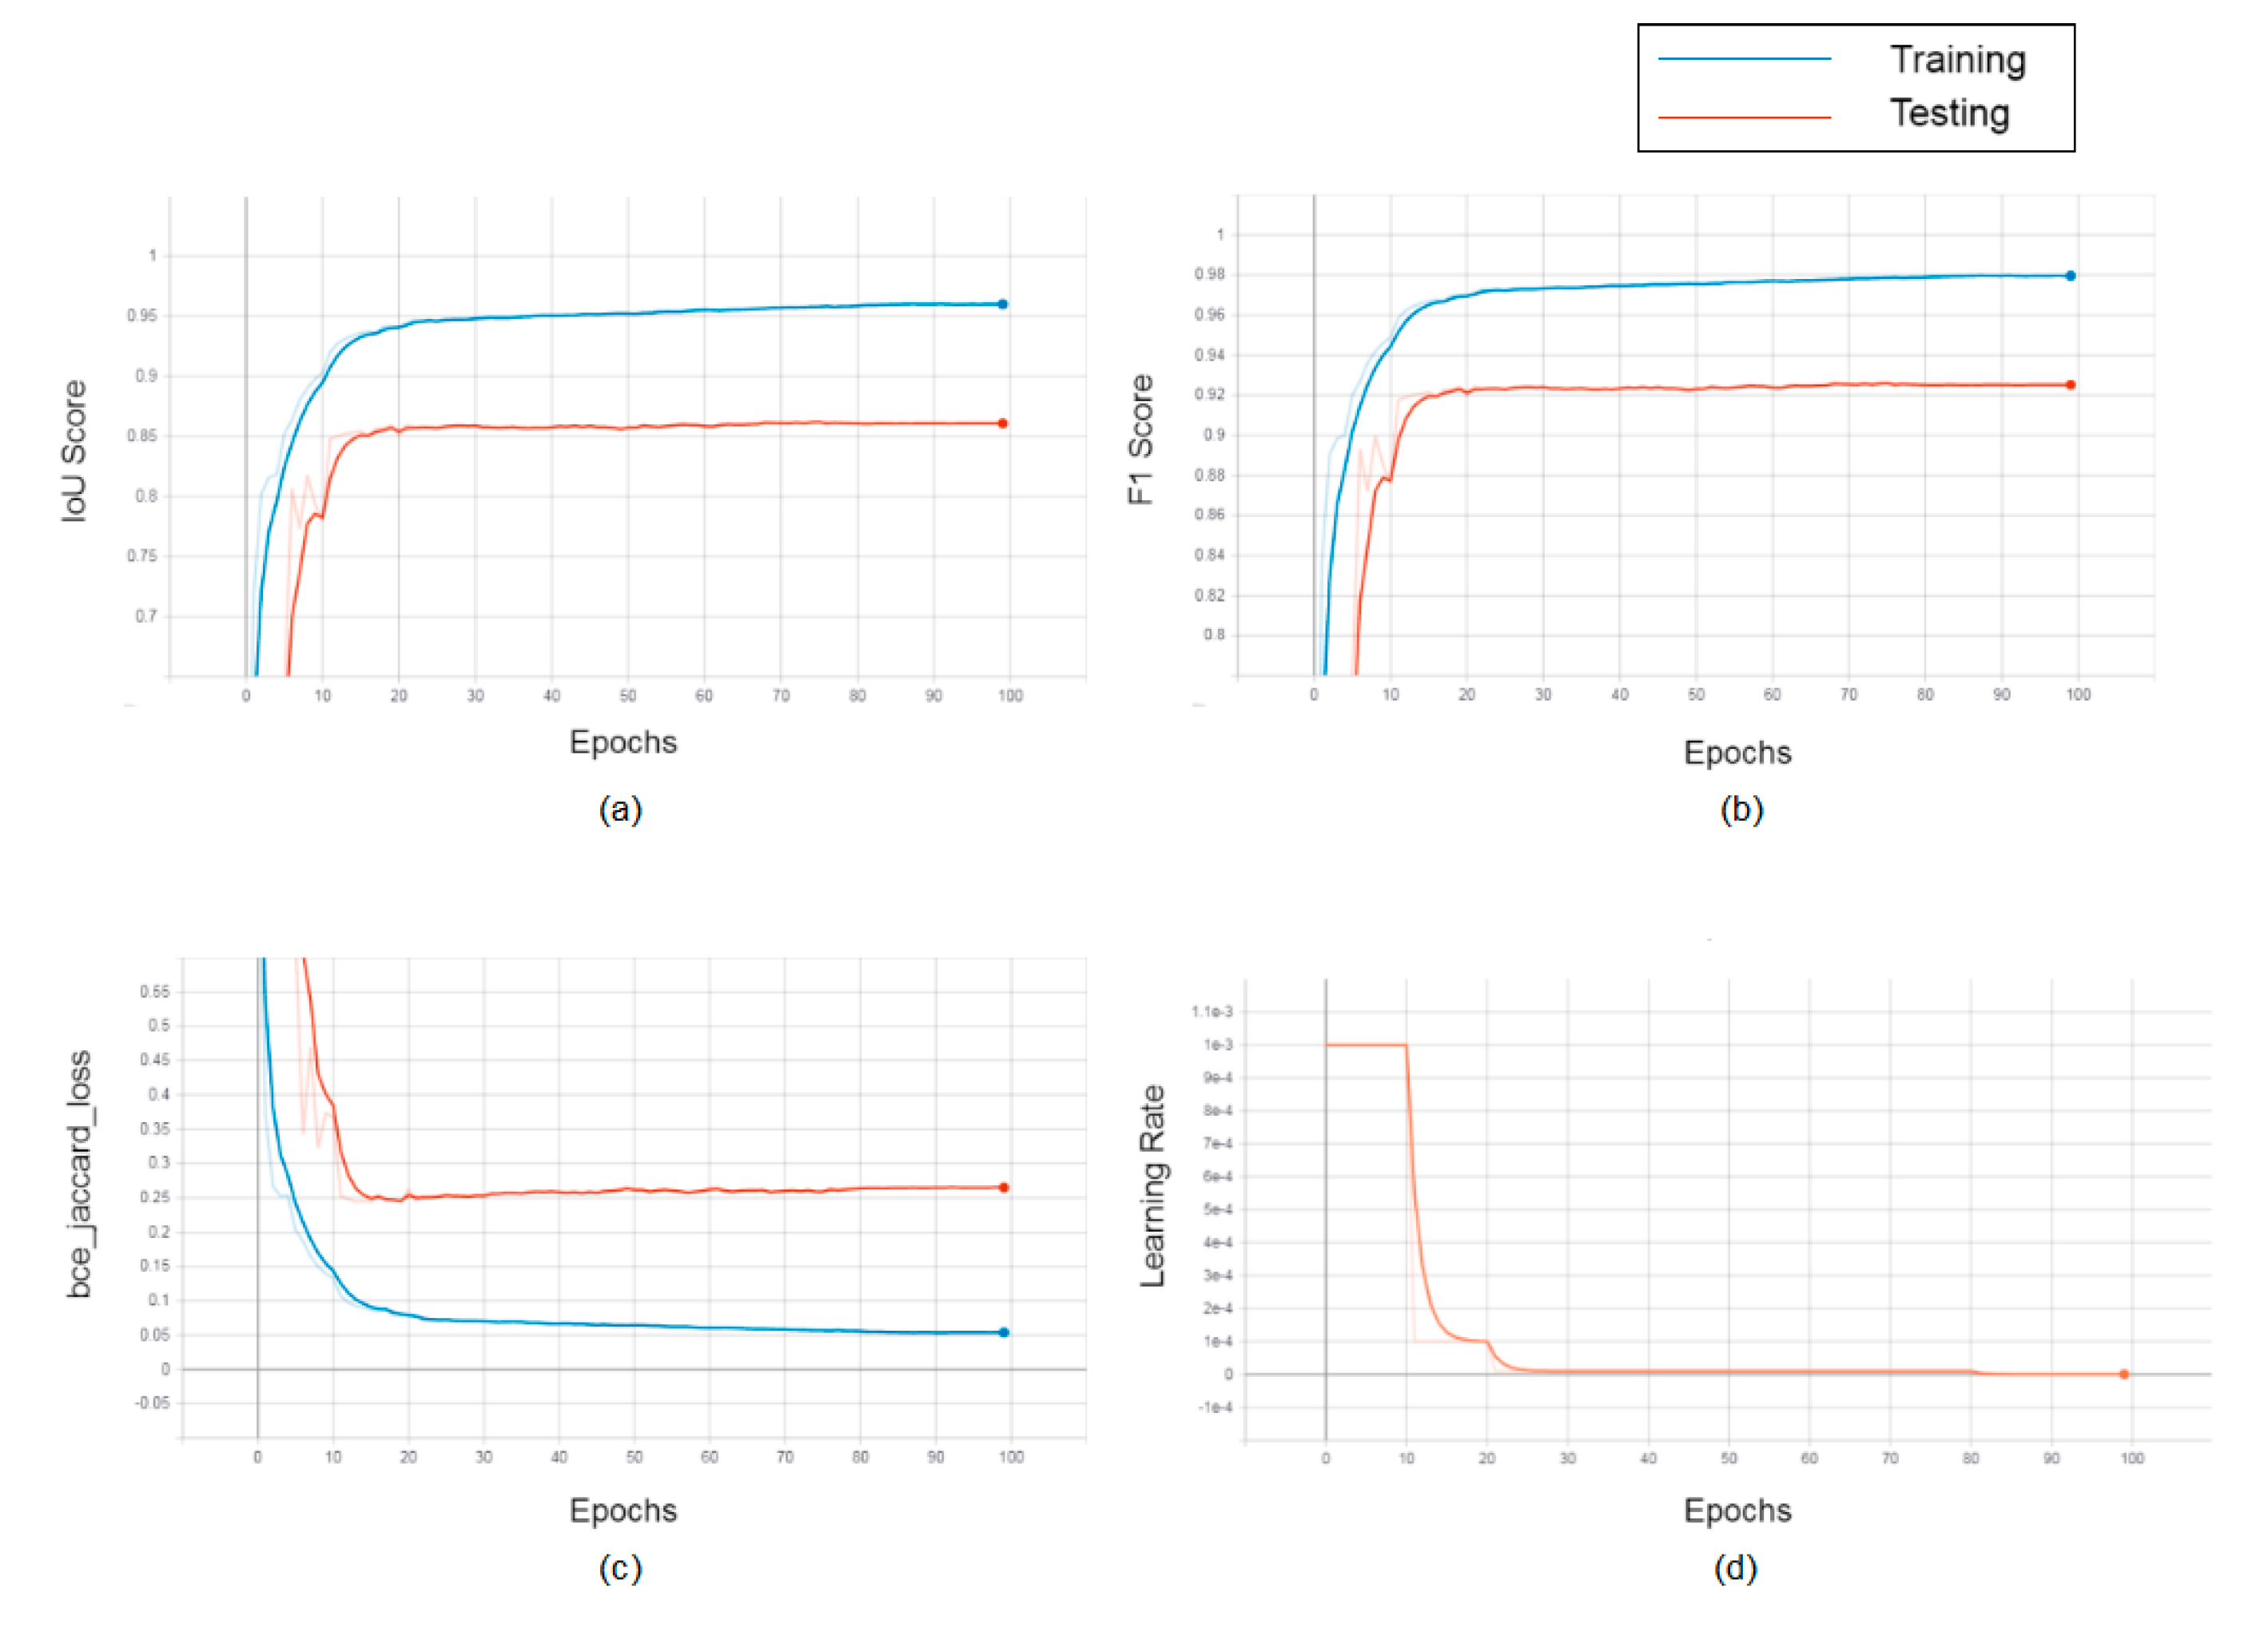
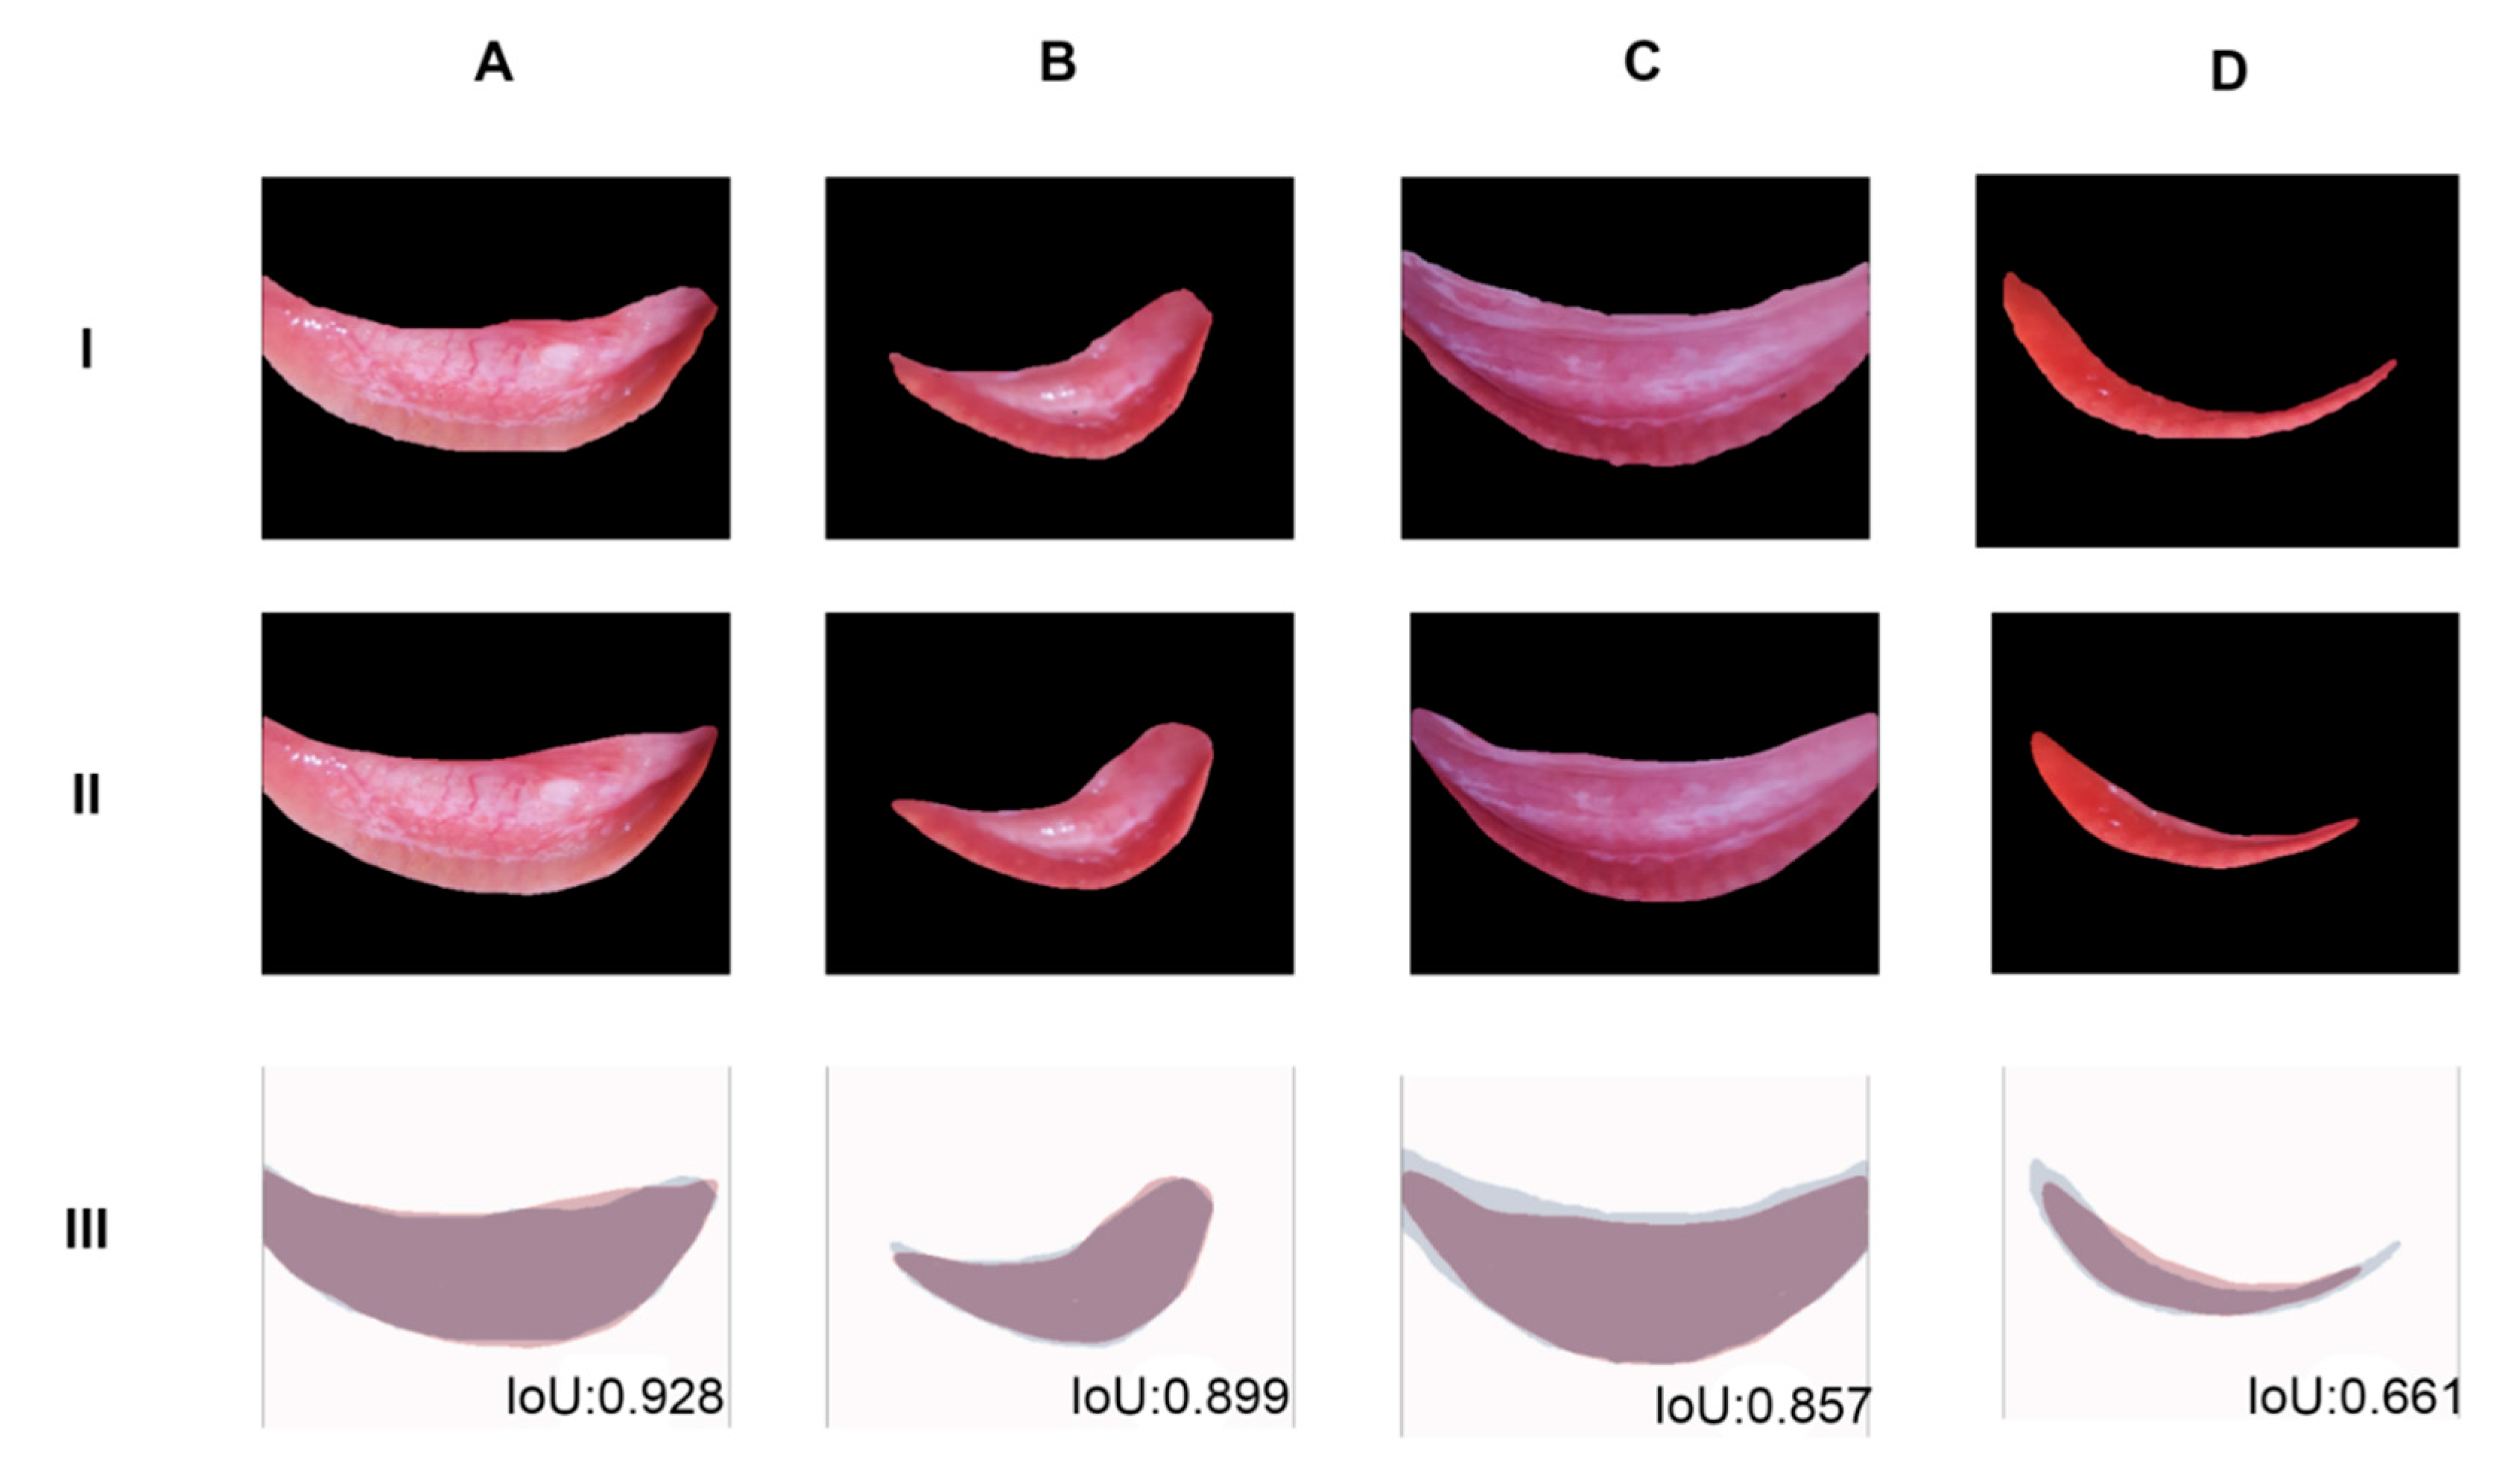
4. Results and Discussion

The performance of the UNBCSM for this segmentation task can be visualized with the help of graphs as shown in Figure 6. The learning curve shows that the model is neither suffering from an under fitting or overfitting problem.
For this critical biomedical application, the Intersection over Union (IoU) score was chosen over pixel accuracy and Dice Index (F1 score) due to the fact that the IoU metric quantitatively penalizes every single instance of bad classification more than the F1 score even though both metrics recognize the bad classification in a given pixel the same way. The IoU score deals with the class imbalance issue better than pixel accuracy.
The Intersection over Union (IoU) score is the ratio of the area of overlap between the predicted segmentation and the ground truth to the area of union between the predicted segmentation and the ground truth. Mathematically, IoU is calculated using the formula mentioned in Equation (1), where G represents the number of pixels present in the groundtruth segmentation mask, P represents the number of pixels in the segmentation mask predicted by the model, IoU being an overlapping measure ranging from 0 to 1, gives us a useful perspective about the quality of the segmentation.
I o U   Score = G P G P
The model proposed in this paper produced an average IoU score of 85.7% with standard deviation of (+/−) 5.3% on unseen samples as shown in Table 2. Except for a single image all other samples are having an IoU score of more than 0.77. Usually, a model producing an average IoU above 50% is considered a good segmentation model. Since it achieved a mean IoU score of 96% and 85.7% for training and validation respectively, this model will be more suitable for anemia detection application over manual cropping.
With the aim of estimating the performance of the trained model, we compared for each sample the proposed segmentation results with the manually selected ROI according to the IoU score. The latter process is resumed in Figure 7 utilizing a sample from the test set. Figure 7a displays the original eye image; Figure 7b shows the overlay of the original sample and the manually selected ROI providing the label or ground truth for training. In Figure 7c, we show the cropped region of the manually segmented region and its corresponding mask. The segmentation output from the trained model as shown in Figure 7d,e is the overlay of Figure 7c,d for a better understanding of segmentation results.
Figure 8 shows the segmentation capability of the model for the validation samples. Row I shows the manually segmented conjunctive region of the images A, B, C, and D, respectively. Similarly, row II shows the manually segmented conjunctive region and Row III images are the overlay of both ground truth and the segmentation results. Column A and B images show a very good performance, Column C and D images show the average and mediocre performance of the model. In Table A1 we have reported the values of the above mentioned metrics in a complete manner for each sample included in the test set.

5. Conclusions

Non-invasive anemia detection applications require a manual segmentation or a manual cropping procedure of the region of interest as a preliminary step. Due to the existence of correlation between pixel parameters of the conjunctiva region and the hemoglobin value, the segmentation capability of this model will help in accurate diagnosis of anemia. The proposed model can also be serialized and compressed to be installed in a mobile application to work in an offline mode, this can be useful in low-end medical facilities in poor areas. Most of the existing conjunctiva-based hemoglobin prediction algorithms are trained using a manually cropped portion of the conjunctiva region. By introducing an automatic conjunctiva segmentation step, we pave the way for this to be used as a pre-processing step for the existing works. A poor selection of ROI will make way for inaccurate predictions affecting the automatic diagnostic tool or the examination carried out by the medical personnel. This paper discussed automatic segmentation as a viable solution for this problem of conjunctiva segmentation to be used in conjunction with other diagnosis methods. The proposed work identified the suitability of a fine-tuned U-Net model (UNBCSM) for conjunctiva image segmentation with a mean IoU score of 84.5% for the validation set. Since this model does not drop any information that may be correlated to the hemoglobin level (for example, the nerve pattern, color of the nerves in the conjunctiva region, etc.) more accurate models can be derived from the existing research work by using this as a pre-processing step. This research work opens a range of opportunities for using a wider spectrum of the image features for hemoglobin level detection rather than just color averages in color spaces (RGB, YCrCb, etc.).

Author Contributions

S.K., T.B.V., L.S. and G.D. have contributed equally. All authors have read and agreed to the published version of the manuscript.

Funding

This research received no external funding.

Conflicts of Interest

The authors declare no conflict of interest. The digital images used in this study were acquired with all the required authorizations. Furthermore, each patient signed a form to provide consent for this study and each acquired image has been treated anonymously.

Appendix A

Table A1. Each sample from the test set underwent a calculation of the segmentation metrics proposed in this research with respect to the ground truth manually segmented images.
Image IdIoUF1 ScoreHausdorff Distance
20200203_0945230.9019230.9484337
20200203_1908380.7735790.8723376.8556546
20200213_1600450.8566090.9227676.164414003
20190611_0805290.8766260.9342585.196152423
20190608_0943560.811420.8958946.8556546
20190608_1004510.8705070.9307716.08276253
20190611_0949510.8919670.9428996.480740698
20190610_0833550.8745970.9331046.8556546
20190608_1104320.8320610.90833310.04987562
20190611_0827010.7988440.8881756.480740698
20190611_0825010.8791610.9356957.211102551
20190611_0754500.8464780.9168578.774964387
20190608_1134060.8591540.9242427.280109889
20190608_0904270.8462920.9167487.937253933
20190608_1132110.9278680.9625856.708203932
20190611_0908210.8275210.9056218.544003745
20190610_0841180.8445460.9157238.306623863
20190610_0844560.8821870.9374067
20190608_0848560.9128110.9544195.477225575
20190610_0759380.8836770.9382477.549834435
20190610_0858350.8523510.9202916.480740698
20190608_1027060.8998870.9473065.291502622
20190611_0912480.8424110.9144666.480740698
20190611_0801140.8990910.9468647.071067812
20190608_0835440.9125820.9542935
20190608_0911570.6613860.7961865.916079783
20190608_0925030.8314860.907997.615773106

References

  1. WHO. Available online: https://www.who.int/topics/anaemia/en/ (accessed on 12 August 2020).
  2. Beutler, E.; Waalen, J. The definition of anemia: What is the lower limit of normal of the blood hemoglobin concentration? Blood 2006, 107, 1747–1750. [Google Scholar] [CrossRef] [PubMed] [Green Version]
  3. Nelson, M. Anaemia in adolescent girls: Effects on cognitive function and activity. Proc. Nutr. Soc. 1996, 55, 359–367. [Google Scholar] [CrossRef] [PubMed] [Green Version]
  4. World Health Organization (WHO). Assessing the Iron Status of Populations; Report of a Joint World Health Organization/Centers for Disease Control and Prevention; WHO: Geneva, Switzerland, 2004; ISBN 978 92 4 1596107. [Google Scholar]
  5. Cook, J.D.; Flowers, C.H.; Skikne, B.S. The quantitative assessment of body iron. Blood 2003, 101, 3359–3363. [Google Scholar] [CrossRef] [PubMed] [Green Version]
  6. Koury, M.J. Red Blood Cell Production and Kinetics. In Rossi’s Principles of Transfusion Medicine; John Wiley & Sons: Hoboken, NJ, USA, 2016; pp. 85–96. [Google Scholar] [CrossRef]
  7. Porwit, A.; McCullough, J.; Erber, W.N. Blood and Bone Marrow Pathology; Churchill Livingstone/Elsevier: Edinburgh, UK, 2011. [Google Scholar]
  8. WHO. Recommended Methods to Control Anaemia. Available online: https://www.who.int/medical_devices/initiatives/anaemia_control/en/ (accessed on 12 August 2020).
  9. De Benoist, B.; McLean, E.; Egli, I.; Cogswell, M. Who Global Database on Anaemia; WHO: Geneva, Switzerland, 2008; pp. 1993–2005. [Google Scholar]
  10. McLean, E.; Cogswell, M.; Egli, I.; Wojdyla, D.; De Benoist, B. Worldwide prevalence of anaemia, WHO Vitamin and Mineral Nutrition Information System, 1993–2005. Public Health Nutr. 2009, 12, 444. [Google Scholar] [CrossRef] [Green Version]
  11. WHO. Available online: http://www.who.int/nutrition/topics/ida/en/ (accessed on 1 May 2018).
  12. World Health Organization. Reducing Risks, Promoting Healthy Life; The World Health Report: Geneva, Switzerland, 2002. [Google Scholar]
  13. Patel, K.V. Epidemiology of anemia in older adults. Semin. Hematol. 2008, 45, 210–217. [Google Scholar] [CrossRef] [Green Version]
  14. Dimauro, G.; Guarini, A.; Caivano, D.; Girardi, F.; Pasciolla, C.; Iacobazzi, A. Detecting Clinical Signs of Anaemia From Digital Images of the Palpebral Conjunctiva. IEEE Access 2019, 7, 113488–113498. [Google Scholar] [CrossRef]
  15. Benseñor, I.M.; Calich, A.L.G.; Brunoni, A.R.; Espírito-Santo, F.F.D.; Mancini, R.L.; Drager, L.F.; Lotufo, P.A. Accuracy of anemia diagnosis by physical examination. Sao Paulo Med. J. 2007, 125, 170–173. [Google Scholar] [CrossRef] [Green Version]
  16. Tsumura, N.; Ojima, N.; Sato, K.; Shiraishi, M.; Shimizu, H.; Nabeshima, H.; Akazaki, S.; Hori, K.; Miyake, Y. Image-Based Skin Color and Texture Analysis/Synthesis by Extracting Hemoglobin and Melanin Information in the Skin; ACM SIGGRAPH 2003 Papers; ACM: San Diego, CA, USA, 2003; pp. 770–779. [Google Scholar] [CrossRef]
  17. Angelopoulou, E. Understanding the color of human skin. In Proceedings of the Photonics West 2001-Electronic Imaging, San Jose, CA, USA, 20–26 January 2001; Volume 4299, pp. 243–251. [Google Scholar] [CrossRef]
  18. Spinelli, M.G.N.; Souza, J.M.P.; De Souza, S.B.; Sesoko, E.H. Confiabilidade e validade da palidez palmar e de conjuntivas como triagem de anemia. Rev. Saúde Pública 2003, 37, 404–408. [Google Scholar] [CrossRef]
  19. Kalter, H.D.; Burnham, G.; Kolstad, P.R.; Hossain, M.; Schillinger, J.A.; Khan, N.Z.; Saha, S.; de Wit, V.; Kenya-Mugisha, N.; Schwartz, B.; et al. Evaluation of clinical signs to diagnose anaemia in Uganda and Bangladesh, in areas with and without malaria. Bull. World Health Organ. 1997, 75, 103–111. [Google Scholar]
  20. Sheth, T.N.; Choudhry, N.K.; Bowes, M.; Detsky, A.S. The Relation of Conjunctival Pallor to the Presence of Anemia. J. Gen. Intern. Med. 1997, 12, 102–106. [Google Scholar] [CrossRef]
  21. Da Silva, R.M.; Machado, C.A. Clinical evaluation of the paleness: Agreement between observers and comparison with hemoglobin levels. Rev. Bras. Hematol. Hemoter. 2010, 32, 444–448. [Google Scholar] [CrossRef]
  22. Dimauro, G.; De Ruvo, S.; Di Terlizzi, F.; Ruggieri, A.; Volpe, V.; Colizzi, L.; Girardi, F. Estimate of Anemia with New Non-Invasive Systems—A Moment of Reflection. Electronics 2020, 9, 780. [Google Scholar] [CrossRef]
  23. Dimauro, G.; Caivano, D.; Girardi, F.; Ciccone, M. The patient centered Electronic Multimedia Health Fascicle-EMHF. In Proceedings of the 2014 IEEE Workshop on Biometric Measurements and Systems for Security and Medical Applications (BIOMS), Rome, Italy, 17 October 2014; pp. 61–66. [Google Scholar] [CrossRef]
  24. Dimauro, G.; Girardi, F.; Caivano, D.; Colizzi, L. Personal Health E-Record—Toward an Enabling Ambient Assisted Living Technology for Communication and Information Sharing Between Patients and Care Providers. In Ambient Assisted Living; Springer: Cham, Switzerland, 2019; pp. 487–499. [Google Scholar] [CrossRef]
  25. Yalçin, S.S.; Unal, S.; Gümrük, F.; Yurdakök, K. The validity of pallor as a clinical sign of anemia in cases with beta-thalassemia. Turk. J. Pediatr. 2008, 49, 408–412. [Google Scholar]
  26. Stoltzfus, R.J.; Edward-Raj, A.; Dreyfuss, M.L.; Albonico, M.; Montresor, A.; Thapa, M.D.; West, K.P.; Chwaya, H.M.; Savioli, L.; Tielsch, J.M. Clinical pallor is useful to detect severe anemia in populations where anemia is prevalent and severe. J. Nutr. 1999, 129, 1675–1681. [Google Scholar] [CrossRef] [Green Version]
  27. Dimauro, G.; Ciprandi, G.; Deperte, F.; Girardi, F.; Ladisa, E.; Latrofa, S.; Gelardi, M. Nasal cytology with deep learning techniques. Int. J. Med. Inform. 2019, 122, 13–19. [Google Scholar] [CrossRef]
  28. Dimauro, G.; Girardi, F.; Gelardi, M.; Bevilacqua, V.; Caivano, D. Rhino-Cyt: A System for Supporting the Rhinologist in the Analysis of Nasal Cytology. Lect. Notes Comput. Sci. 2018, 10955, 619–630. [Google Scholar] [CrossRef]
  29. Dimauro, G.; Caivano, D.; Bevilacqua, V.; Girardi, F.; Napoletano, V. VoxTester, software for digital evaluation of speech changes in Parkinson disease. In Proceedings of the 2016 IEEE International Symposium on Medical Measurements and Applications (MeMeA), Benevento, Italy, 15–18 May 2016; pp. 1–6. [Google Scholar] [CrossRef]
  30. Bevilacqua, V.; Brunetti, A.; Trotta, G.F.; Dimauro, G.; Elez, K.; Alberotanza, V.; Scardapane, A. A novel approach for Hepatocellular Carcinoma detection and classification based on triphasic CT Protocol. In Proceedings of the 2017 IEEE Congress on Evolutionary Computation (CEC), San Sebastian, Spain, 5–8 June 2017; pp. 1856–1863. [Google Scholar] [CrossRef]
  31. Dimauro, G.; Di Nicola, V.; Bevilacqua, V.; Caivano, D.; Girardi, F. Assessment of Speech Intelligibility in Parkinson’s Disease Using a Speech-To-Text System. IEEE Access 2017, 5, 22199–22208. [Google Scholar] [CrossRef]
  32. Dimauro, G.; Bevilacqua, V.; Colizzi, L.; Di Pierro, D. TestGraphia, a Software System for the Early Diagnosis of Dysgraphia. IEEE Access 2020, 8, 19564–19575. [Google Scholar] [CrossRef]
  33. Dimauro, G.; Altomare, N.; Scalera, M. PQMET: A digital image quality metric based on human visual system. In Proceedings of the 2014 4th International Conference on Image Processing Theory, Tools and Applications (IPTA), Paris, France, 14–17 October 2014; pp. 1–6. [Google Scholar] [CrossRef]
  34. Dimauro, G.; Colagrande, P.; Carlucci, R.; Ventura, M.; Bevilacqua, V.; Caivano, D. CRISPRLearner: A deep learning-based system to predict CRISPR/Cas9 sgRNA on-target cleavage efficiency. Electronics 2019, 8, 1478. [Google Scholar] [CrossRef] [Green Version]
  35. Ronneberger, O.; Fischer, P.; Brox, T. U-Net: Convolutional Networks for Biomedical Image Segmentation. In Lecture Notes in Computer Science, Proceedings of the Medical Image Computing and Computer-Assisted Intervention—MICCAI 2015; Navab, N., Hornegger, J., Wells, W., Frangi, A., Eds.; Springer: Cham, Switzerland, 2015; Volume 9351. [Google Scholar] [CrossRef] [Green Version]
  36. Shelhamer, E.; Long, J.; Darrell, T. Fully Convolutional Networks for Semantic Segmentation. IEEE Trans. Pattern Anal. Mach. Intell. 2017, 39, 640–651. [Google Scholar] [CrossRef]
  37. Dimauro, G.; Baldari, L.; Caivano, D.; Colucci, G.; Girardi, F. Automatic segmentation of relevant sections of the conjunctiva for non-invasive anemia detection. In Proceedings of the 2018 3rd International Conference on Smart and Sustainable Technologies (SpliTech), Split, Croatia, 26–29 June 2018. [Google Scholar]
  38. Furqan Qadri, S.; Ai, D.; Hu, G.; Ahmad, M.; Huang, Y.; Wang, Y.; Yang, J. Automatic Deep Feature Learning via Patch-Based Deep Belief Network for Vertebrae Segmentation in CT Images. Appl. Sci. 2019, 9, 69. [Google Scholar] [CrossRef] [Green Version]
  39. Połap, D.; Woźniak, M. Bacteria shape classification by the use of region covariance and Convolutional Neural Network. In Proceedings of the 2019 International Joint Conference on Neural Networks (IJCNN), Budapest, Hungary, 14–19 July 2019; pp. 1–7. [Google Scholar] [CrossRef]
  40. Capizzi, G.; Sciuto, G.L.; Napoli, C.; Połap, D.; Woźniak, M. Small Lung Nodules Detection Based on Fuzzy-Logic and Probabilistic Neural Network With Bioinspired Reinforcement Learning. IEEE Trans. Fuzzy Syst. 2020, 28, 1178–1189. [Google Scholar] [CrossRef]
  41. Woźniak, M.; Połap, D.; Kośmider, L.; Cłapa, T. Automated fluorescence microscopy image analysis of Pseudomonas aeruginosa bacteria in alive and dead stadium. Eng. Appl. Artif. Intell. 2018, 67, 100–110. [Google Scholar] [CrossRef]
  42. Glass, R.; Batres, R.; Selle, C.; Garcia-Ibanez, R. The value of simple conjunctival examination in field screening for anaemia. Nutr. Rep. Int. 1982, 21, 405–412. [Google Scholar]
  43. Suner, S.; Crawford, G.; McMurdy, J.; Jay, G. Non-Invasive Determination of Hemoglobin by Digital Photography of Palpebral Conjunctiva. J. Emerg. Med. 2007, 33, 105–111. [Google Scholar] [CrossRef]
  44. Kim, O.; McMurdy, J.; Jay, G.; Lines, C.; Crawford, G.; Alber, M. Combined reflectance spectroscopy and stochastic modeling approach for noninvasive hemoglobin determination via palpebral conjunctiva. Physiol. Rep. 2014, 2, e00192. [Google Scholar] [CrossRef]
  45. Dimauro, G.; Caivano, D.; Girardi, F. A New Method and a Non-Invasive Device to Estimate Anemia Based on Digital Images of the Conjunctiva. IEEE Access 2018, 6, 46968–46975. [Google Scholar] [CrossRef]
  46. Bevilacqua, V.; Dimauro, G.; Marino, F.; Brunetti, A.; Cassano, F.; Maio, A.D.; Nasca, E.; Trotta, G.F.; Girardi, F.; Ostuni, A.; et al. A novel approach to evaluate blood parameters using computer vision techniques. In Proceedings of the 2016 IEEE International Symposium on Medical Measurements and Applications (MeMeA), Benevento, Italy, 15–18 May 2016. [Google Scholar] [CrossRef]
  47. Chen, Y.M.; Miaou, S.G. A Kalman Filtering and Nonlinear Penalty Regression Approach for Noninvasive Anemia Detection with Palpebral Conjunctiva Images. J. Healthc. Eng. 2017, 2017, 1–11. [Google Scholar] [CrossRef]
  48. Collings, S.; Thompson, O.; Hirst, E.; Goossens, L.; George, A.; Weinkove, R. Non-Invasive Detection of Anaemia Using Digital Photographs of the Conjunctiva. PLoS ONE 2016, 11, e0153286. [Google Scholar] [CrossRef] [Green Version]
  49. Chen, Y.M.; Miaou, S.G.; Bian, H. Examining palpebral conjunctiva for anemia assessment with image processing methods. Comput. Methods Programs Biomed. 2016, 137, 125–135. [Google Scholar] [CrossRef]
  50. Muthalagu, R.; Bai, V.T.; Gracias, D.; John, S. Developmental screening tool: Accuracy and feasibility of non-invasive anaemia estimation. Technol. Health Care 2018, 26, 723–727. [Google Scholar] [CrossRef] [PubMed]
Figure 1. Flow graph of training the segmentation model.
Electronics 09 01309 g001
Figure 2. Augmentation model for the U-Net based conjunctiva segmentation model (UNBCSM).
Electronics 09 01309 g002
Figure 3. Layer details of the layer modules of UNBCSM.
Electronics 09 01309 g003
Figure 4. UNBCSM architecture.
Electronics 09 01309 g004
Figure 5. Training and validation data.
Electronics 09 01309 g005
Figure 6. Training and validation results. (a) Intersection over union (IoU) score vs. Epochs, (b) F1 score vs. Epochs, (c) bce_jaccard_loss vs. Epochs, (d) learning rate vs. Epochs.
Electronics 09 01309 g006
Figure 7. Segmentation results. (a) Original eye image, (b) overlay of original image and ground truth, (c) manually segmented region of interest (ROI) and its mask, (d) segmentation of ROI by the model and its mask, (e) overlay of ‘d’ and ‘e’ (IoU score = 0.8864).
Electronics 09 01309 g007
Figure 8. Four samples (AD) of the segmentation results. Row I: The manually segmented conjunctive region, Row II: Segmented conjunctive region by the model, and Row III: Overlay of both the masks and IoU.
Electronics 09 01309 g008
Table 1. Model parameters.
Model ParametersSelected
Model NameU-Net
BackboneResNet-34
Encoder WeightsImagenet
No. of classes1
Batch NormalizationTrue
Activation FunctionSigmoid
Validation Split20%
Batch Size16
Epochs100
MetricsIoU score
Lossbce_Jaccard loss
No. of Trainable Parameters24,438,804
No. of Non-trainable 17,350
Total No. of Parameters24,456,154
Training time per Epoch13 s
No. of Batches37
Table 2. Performance of the model for validation set (27 images).
Parameters.IoU Score
Mean value0.857
Standard Deviation(+/−) 0.053
Maximum value0.928
Minimum value0.661

