Article

Frequency-Tracking Algorithm Based on SOGI-FLL for Wireless Power Transfer System to Operate ZPA Region

School of Electrical Engineering, Pusan National University, Busandaehak-ro 63 beon-gil 2, Busan 46241, Korea
*
Author to whom correspondence should be addressed.
Electronics 2020, 9(8), 1303; https://doi.org/10.3390/electronics9081303
Submission received: 13 July 2020 / Revised: 4 August 2020 / Accepted: 12 August 2020 / Published: 13 August 2020
(This article belongs to the Section Computer Science & Engineering)

Abstract

:
The wireless power transfer (WPT) system has attracted attention for energy transmission without physical contact. However, a WPT system has low coupling condition because of a big air gap between transmitter and receiver coils. The low coupling condition has a high leakage inductance. To overcome this problem, we design a proposed system for WPT using series-series (S-S) topology of one resonant circuit. To obtain the higher efficiency power conversion of the WPT system, it has to operate the resonant frequency in the zero phase angle (ZPA) point even under mutual coefficient and load variation. Therefore, we propose the resonant frequency tracking algorithm to operate ZPA point based on the second order generalized integrator-frequency locked loop (SOGI-FLL) method. This proposed frequency-tracking algorithm can estimate ZPA point by changing switching frequency. We can reduce the switching loss with this proposed algorithm and improve the low conversion efficiency of the WPT system. The performance of the proposed frequency-tracking algorithm is automatically verified through various coupling coefficients and the load variation.

1. Introduction

Recently, user-friendly products have become very important in the industry. In particular, many research projects have been actively conducted on wireless power transfer (WPT) technology that can bring high improvements to mobile devices. The feature of WPT is that there is no need for a direct connection for charging, which makes the product convenient to use. Due to the advantages of WPT technology, it is widely used for charging mobile phones, electric vehicles, and bio-implantable medical devices. However, a typical WPT system has low coupling condition because of the distance between coils. The low coupling condition causes high leakage inductance. To overcome this problem, a typical WPT system uses a resonant tank such as series-series (SS), series-parallel (SP), parallel-series (PS), or parallel-parallel (PP). The SS topology has low magnetization inductance, and it generates reactive power, but the analysis is simple and easy to control. The SP topology has the advantage of low reactive power, but it has a feature that the operating point varies greatly with load. Therefore, there is a disadvantage of difficult control. In the case of PS and PP topologies, the primary current is not stable and the external inductor is required to attenuate it [1,2].
In order to operate with high efficiency, it must operate in the resonant frequency. The resonant tank may have dynamic variations from the designed resonant parameters because of load changes and mutual coefficient variations. Therefore, this resonant tank significantly reduces the power transfer and efficiency of the WPT system. Therefore, for large power transmission and high efficiency, the resonant frequency tracking algorithm is very important for WPT system research.
A conventional technique of adaptive impedance matching is proposed; the technique is one kind of passive tracking method. This can change the impedance to keep a practical region of maximum power transfer [3,4]. Also, many kinds of WPT research focus on the design of the coils and resonant tank. However, in these kinds of method it is difficult to design the hardware implementation. Furthermore, these methods cannot precisely achieve impedance matching. Also, these methods are difficult to adapt to changeable load and coupling factors [5,6].
In the interim, various frequency-tracking research works have been proposed in the past to operate in the resonant state for the WPT system. The most popular method is the phase-locked loop (PLL) method. To operate resonant frequency, the method of the PLL is widely used with zero-crossing detector. But this method has a problem that is sensitive to alterations and disturbances of the input signal. The second-order generalized integrator-frequency-locked loop (SOGI-FLL) and second-order generalized integrator-phase-locked loop (SOGI-PLL) based on and adaptive filter is widely used in solar power system to synchronize in grid. These methods are less sensitive to alterations and disturbances of the input signal. However, it is difficult to correctly adjust the phase difference between the primary voltage and the WPT system current. Thus, traditional frequency-tracking methods such as SOGI-PLL and SOGI-FLL cannot conduct resonant state operation exactly [7,8].
Therefore, to overcome the traditional frequency-tracking problems, we propose the frequency-tracking algorithm based on the SOGI-FLL with S-S topology which is easy to control and analysis, to operate zero phase angle (ZPA) state in the resonant frequency. This algorithm finds the ZPA point by changing the switching frequency, following the primary current. And it can accurately track the resonant frequency. It can also have the active maximum power point.
The rest of this paper is organized in five sections. After the introduction, the structure of the SS-WPT system and analysis is demonstrated in Section 2. Zero voltage switching (ZVS), zero current switching (ZCS) and ZPA is analyzed in Section 3. The proposed Frequency Tracking Algorithm is described in Section 4. Additionally, the experimental results are shown in Section 5. Finally, we summarize the results in Section 6.

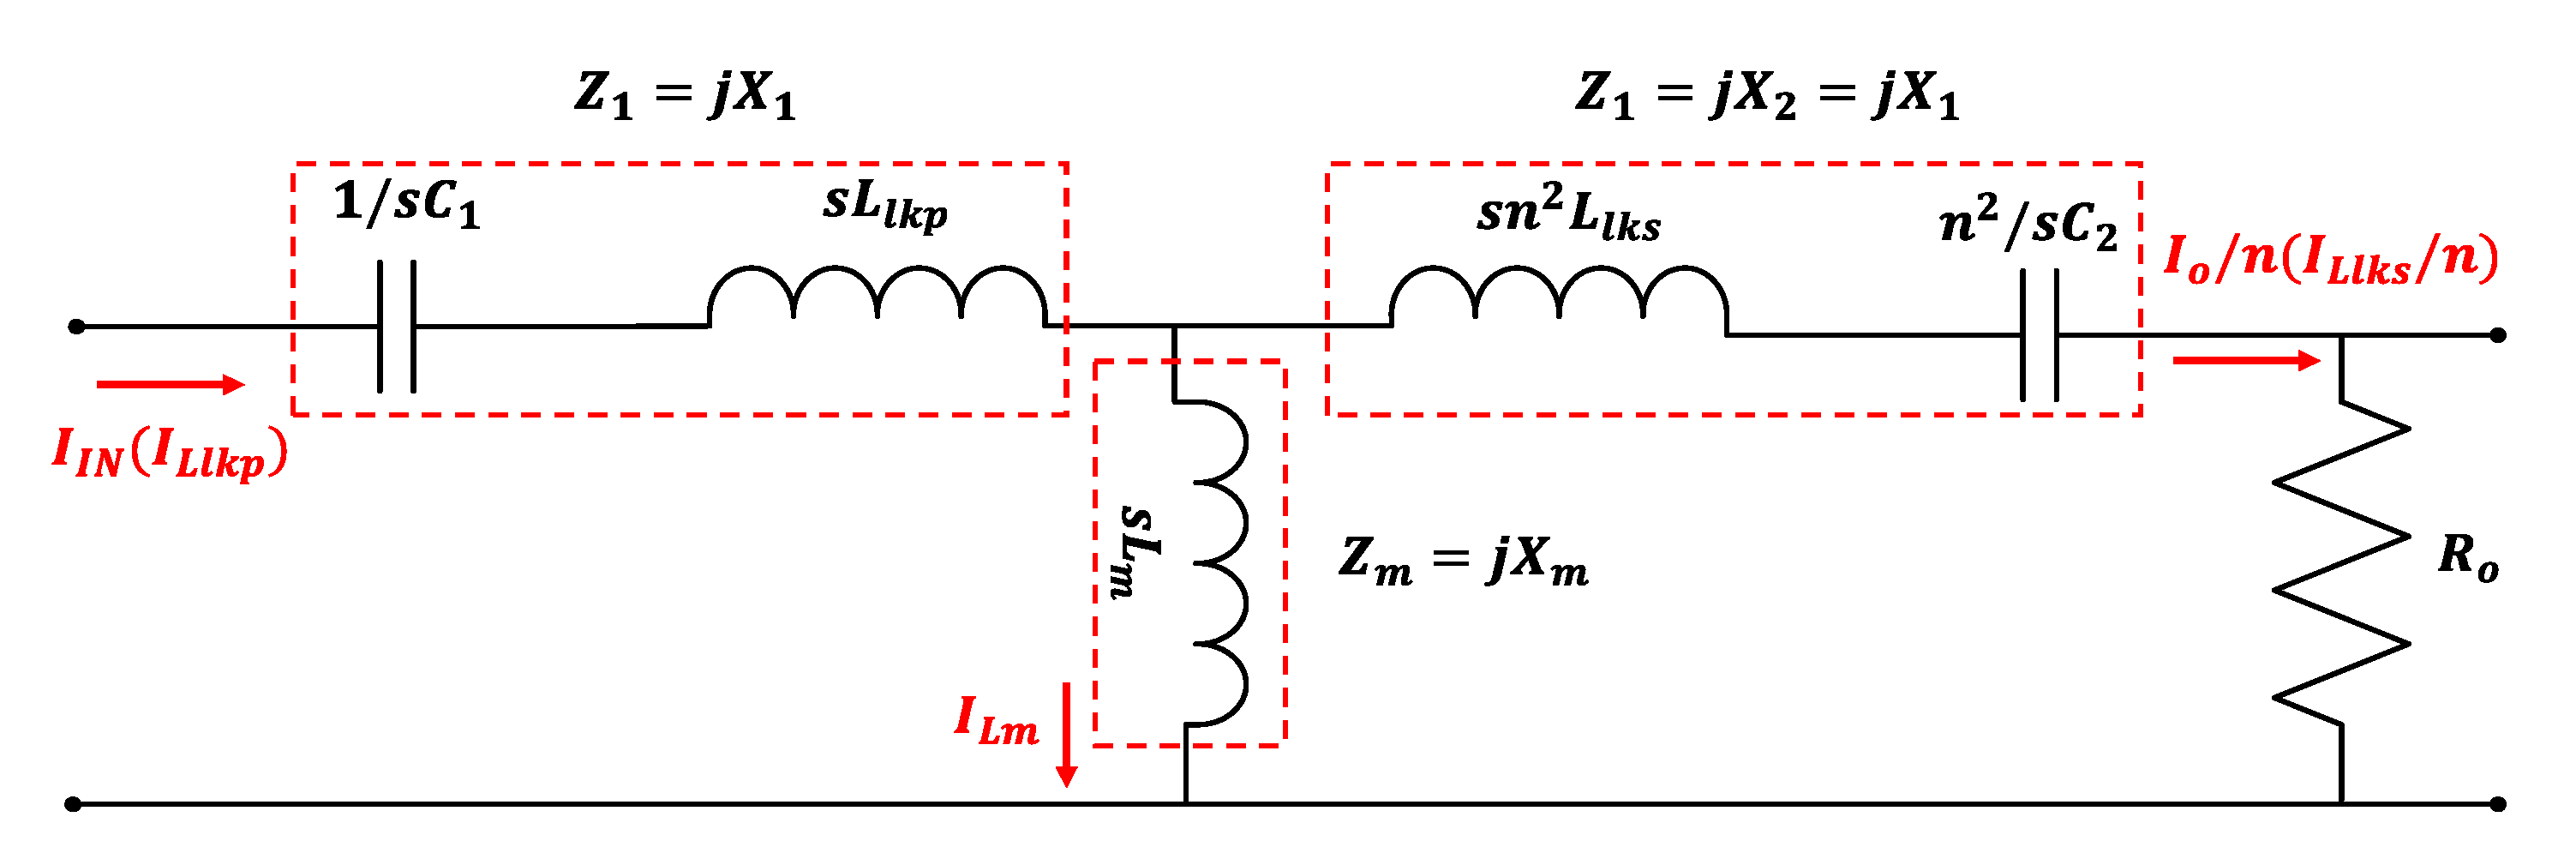
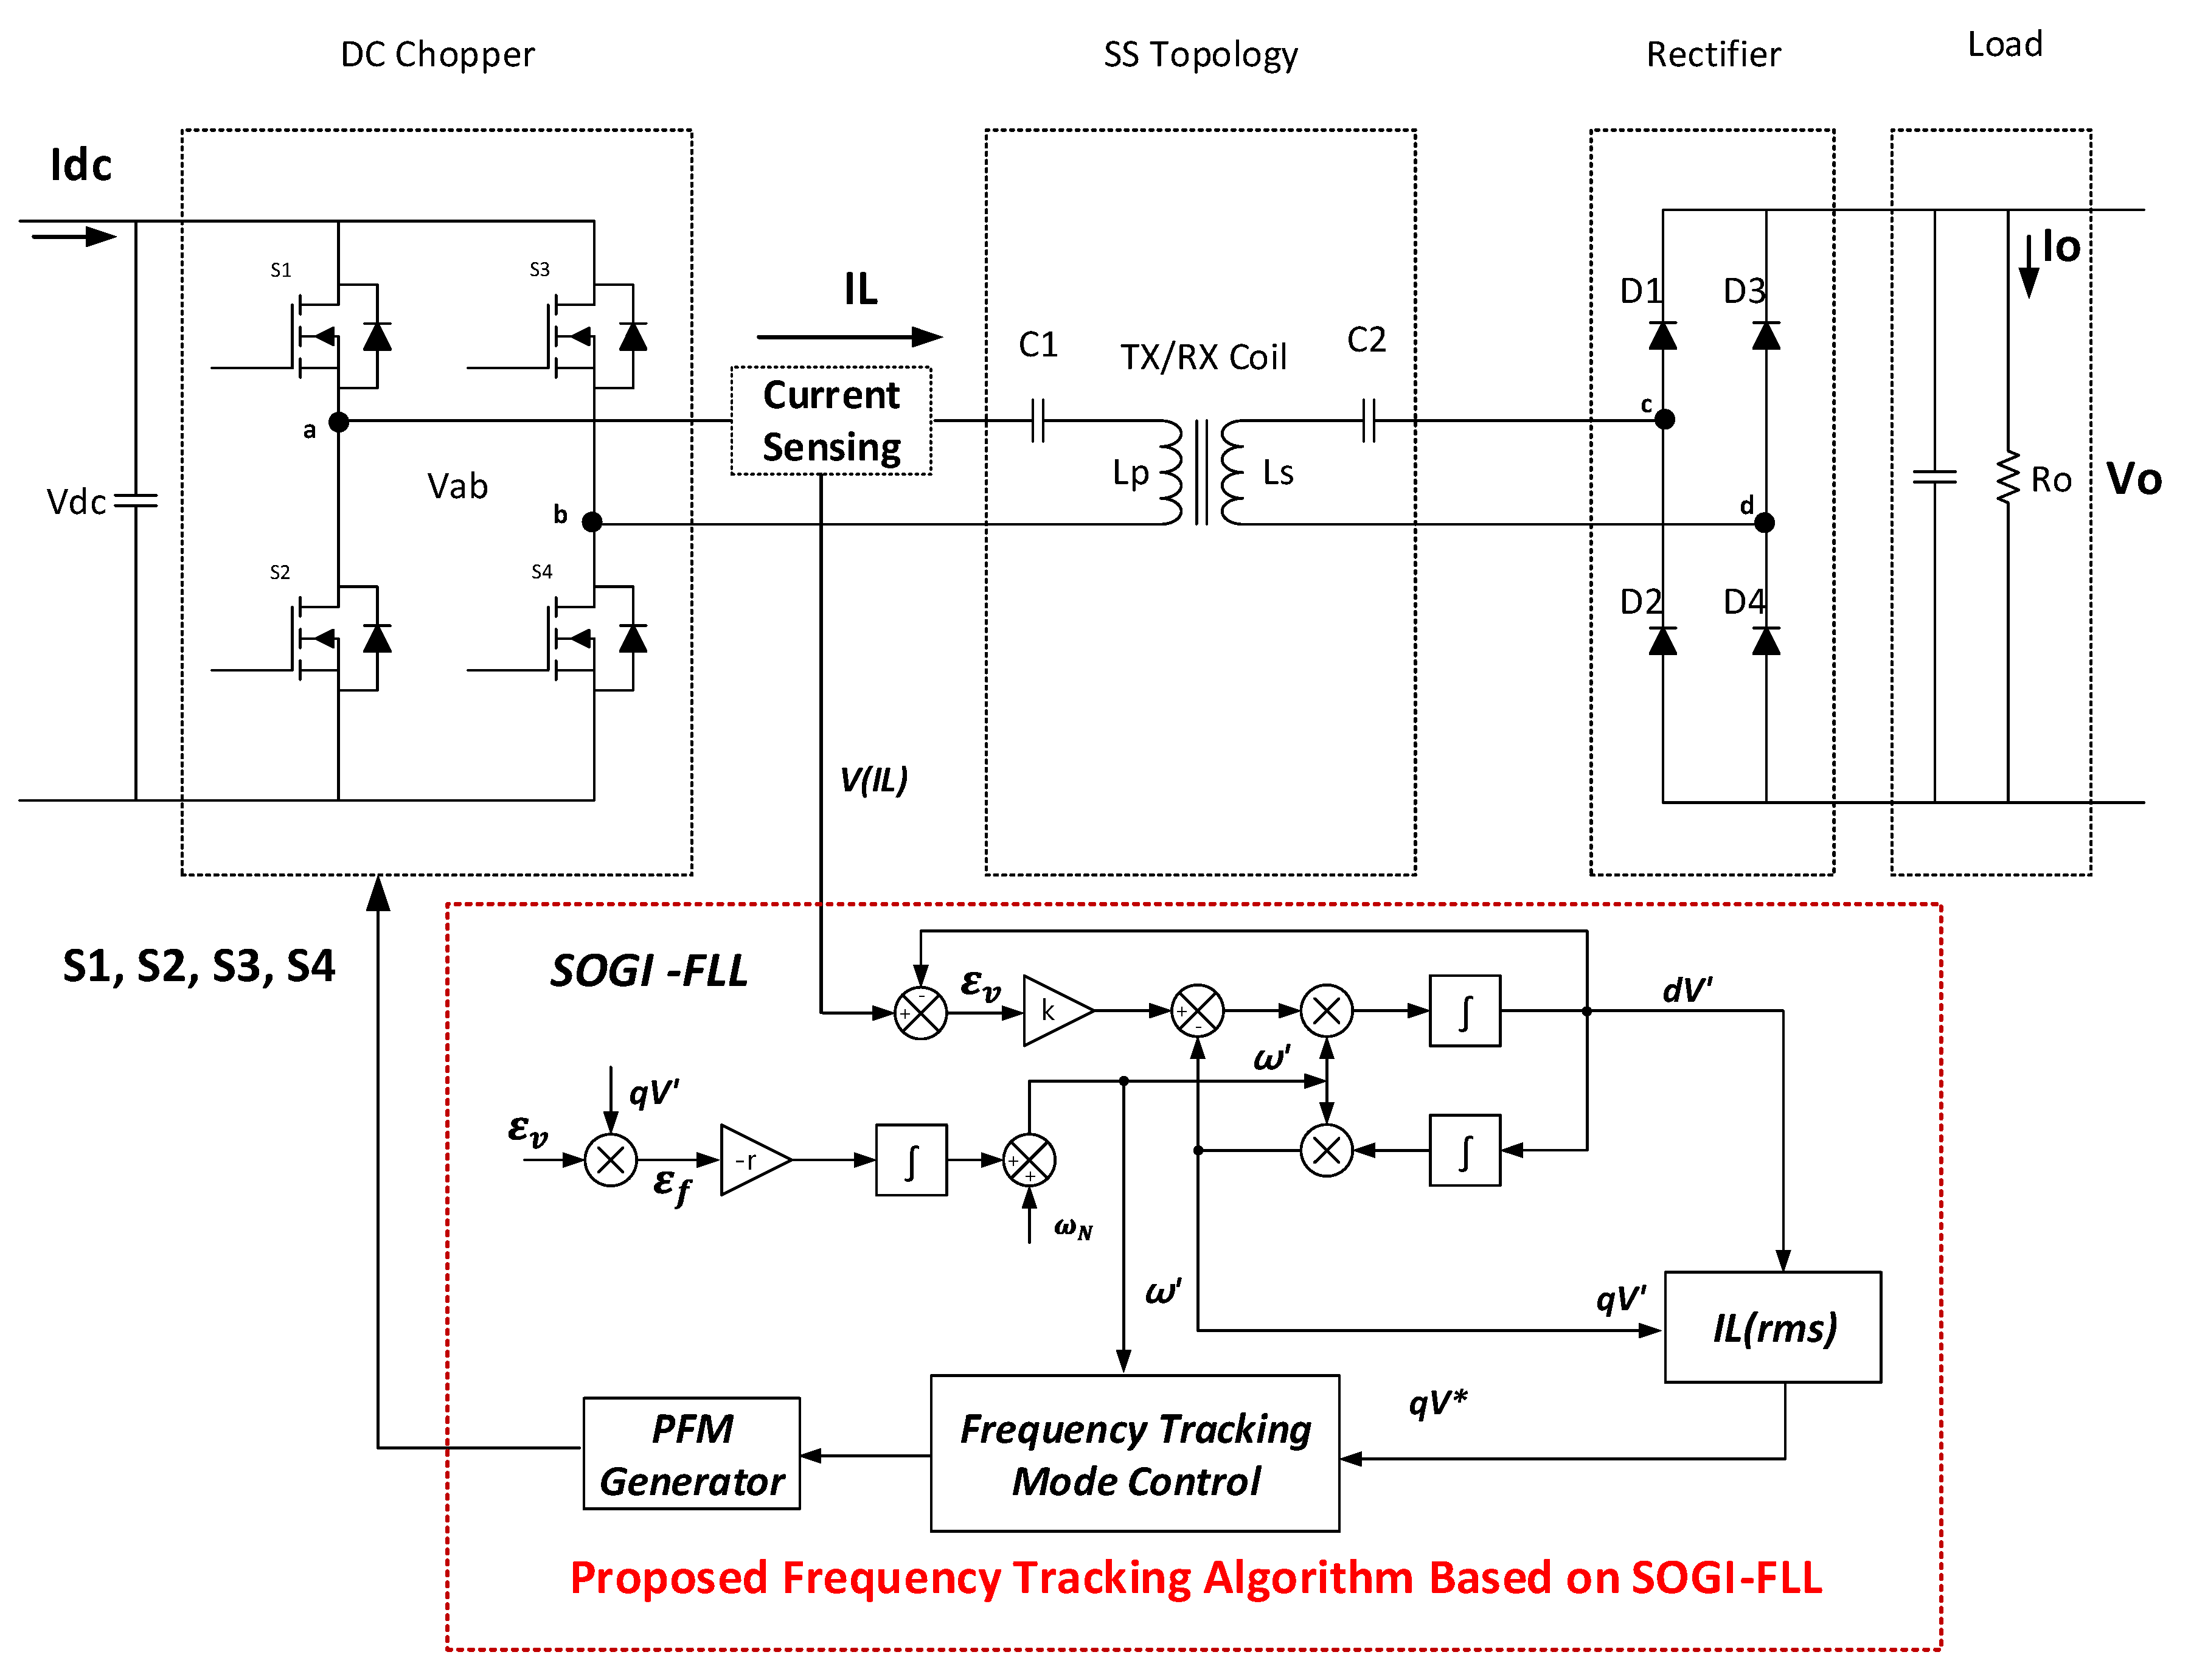
2. Structure of Series-Series Wireless Power Transfer (SS-WPT) System and Analysis

The WPT system with S-S topology consists of a full- bridge inverter, resonant tank, a full-bridge rectifier and load. The primary leakage inductance ( L l k p ) is equal to secondary leakage inductance reflected to the primary side n 2 L l k s . The L l k p can be expressed Equation (1), where, k is coupling coefficient, L p is primary inductance of the coil, L s is secondary inductance of the coil and n is the turn ratio ( N 2 N 1 ) of the coils.
L l k p = ( 1 k ) L p = ( 1 k ) n 2 L s = n 2 L l k s
The primary and secondary sides are the same as the resonant frequency. The primary and secondary resonant capacitance is C 1 = C 2 / n 2 , and the reactance X 1 ( p r i m a r y ) = X 2 ( s e c o n d a r y ) in Figure 1. C 1 and X 1 can be expressed to Equations (2) and (3). Where, C 1 is the primary capacitor and C 2 / n 2 is the secondary capacitor reflecting the turn ratio of coils.
C 1 = C 2 n 2   ( 1 L p C 1 = 1 n 2 L s C 1 = 1 L s C 2 )
X 1 = ω L l k p 1 ω C 1 = ω n 2 L l k s n 2 ω C 2 = X 2
The S-S resonant tank is expressed as the primary reactance. As a result, the equivalent circuit of S-S topology is shown in Figure 1. The primary and secondary side resonant circuit can be defined as in Equations (4) and (5).
L p C 1 = L s C 1
ω o = 1 L p C 1 = 1 L s C 2
Figure 1 shows the input impedance of SS topology, it can be expressed as Equation (6). The input current can be expressed by the input voltage and impedance.
Z i n = j X 1 + j X m ( j X 2 + R o ) = j X 1 + j X m ( j X 1 + R o ) j X m + j X 1 + R o
The resonant frequency ω o , the reactance X 1 and X m can be expressed as Equations (7) and (8).
X 1 = ω L l k p 1 ω C 1 = ω L p ( 1 ω o 2 ω 2 k ) = ω o k L p
X m = ω o k L p
When ω = ω o , The input impedance Z in can be written by Equation (9).
Z i n = j ω o k L p + j ω o k L p ( j ω o k L p + R o ) R o = ω o 2 k 2 L p 2 R o = k 2 Q 2 R o
where, Q is load quality factor, and it can express to Equation (10).
Q = ω o L p / R o
The frequency analysis is carried out based on fundamental harmonic analysis (FHA), it consists of voltage gain, current gain, and power gain (efficiency). The voltage gain can express to Equation (11).
G v = { [ 1 k ( 1 1 ω n 2 ) ] 2 + [ Q ω n ( 1 k ( 1 1 ω n 2 ) k ) ] 2 } 0.5
The normalized frequency ω n can be defined as ω n = ω / ω o . Figure 2 shows the voltage gain G v of the S-S topology of WPT system, according to the load quality factor and ω n . When k = 1 , coupling coefficient is stronger than k = 0.2 . And also, the ω n can express as 2 π F s / 2 π F o (where, F s is switching frequency and F o is resonant frequency). When the voltage gain is changed to the following F s / F o ratio. To obtain the high-voltage gain of the WPT system operating the resonant region ( F s / F o = 1 ) . When k = 0.2 , if the coupling coefficient and the quality factor is low, the voltage gain is high. On the other hand, the quality factor is high, coupling coefficient is low, and the voltage gain is low. In other words, when the low coupling coefficient, the low-quality factor has high voltage gain. But high coupling coefficient is not changed by the changeable quality factor.
G i = { [ 1 k ( 1 1 ω n 2 ) ] 2 + [ 1 k Q ω n ] 2 } 0.5
The current gain can express to Equation (12). Figure 3 shows the current gain according to the load quality factor and ω n . The coupling coefficient is ( k = 0.2 ), current gain is low compared with ( k = 1 ) at the same quality factor. If the Q increases, the current gain also increases. On the other hand, the Q decreases, the current gain also decreases [9,10].
From the voltage gain and the current gain, the power gain can be obtained by Equation (13).
G v G i = { [ 1 k ( 1 1 ω n 2 ) ] 2 + [ 1 k Q ω n ] 2 } 0.5 · { [ 1 k ( 1 1 ω n 2 ) ] 2 + [ Q ω n ( 1 k ( 1 1 ω n 2 ) k ) ] 2 } 0.5
Figure 4 shows the output power and the input power factor according to the load quality factor and ω n . When the coupling coefficient is ( k = 1 ), the range of high efficiency is very large compared with ( k = 0.2 ). In case of WPT system, it has coupling coefficient around ( k = 0.2 ). Although, the WPT system has the coupling coefficient around ( k = 0.2 ) and various load, if the WPT system is controlling in ZPA region ( ω n = 1 ) , it can obtain the high efficiency and power transfer compared with another region. Therefore, the WPT system is automatically working in the ZPA region for maximum output power and high efficiency [11,12].

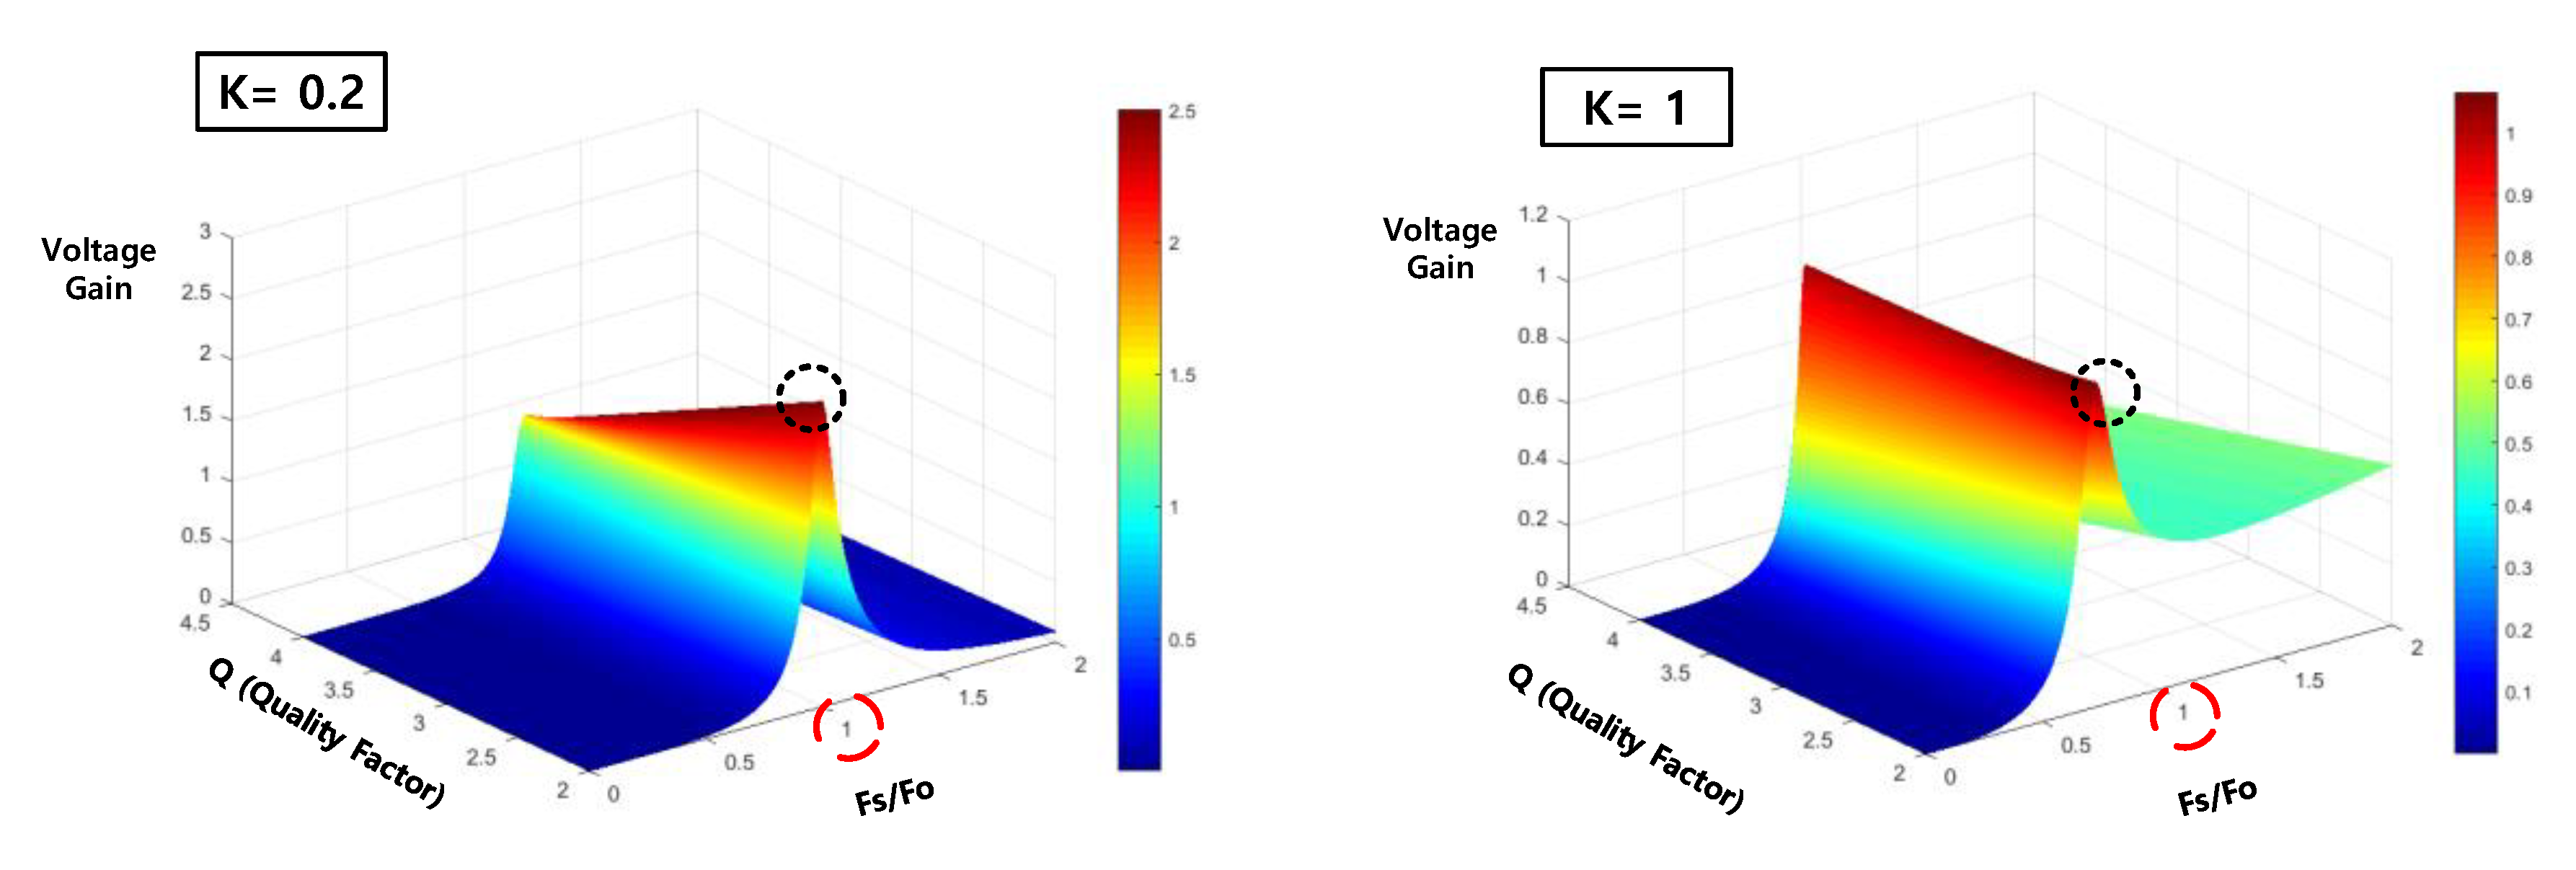
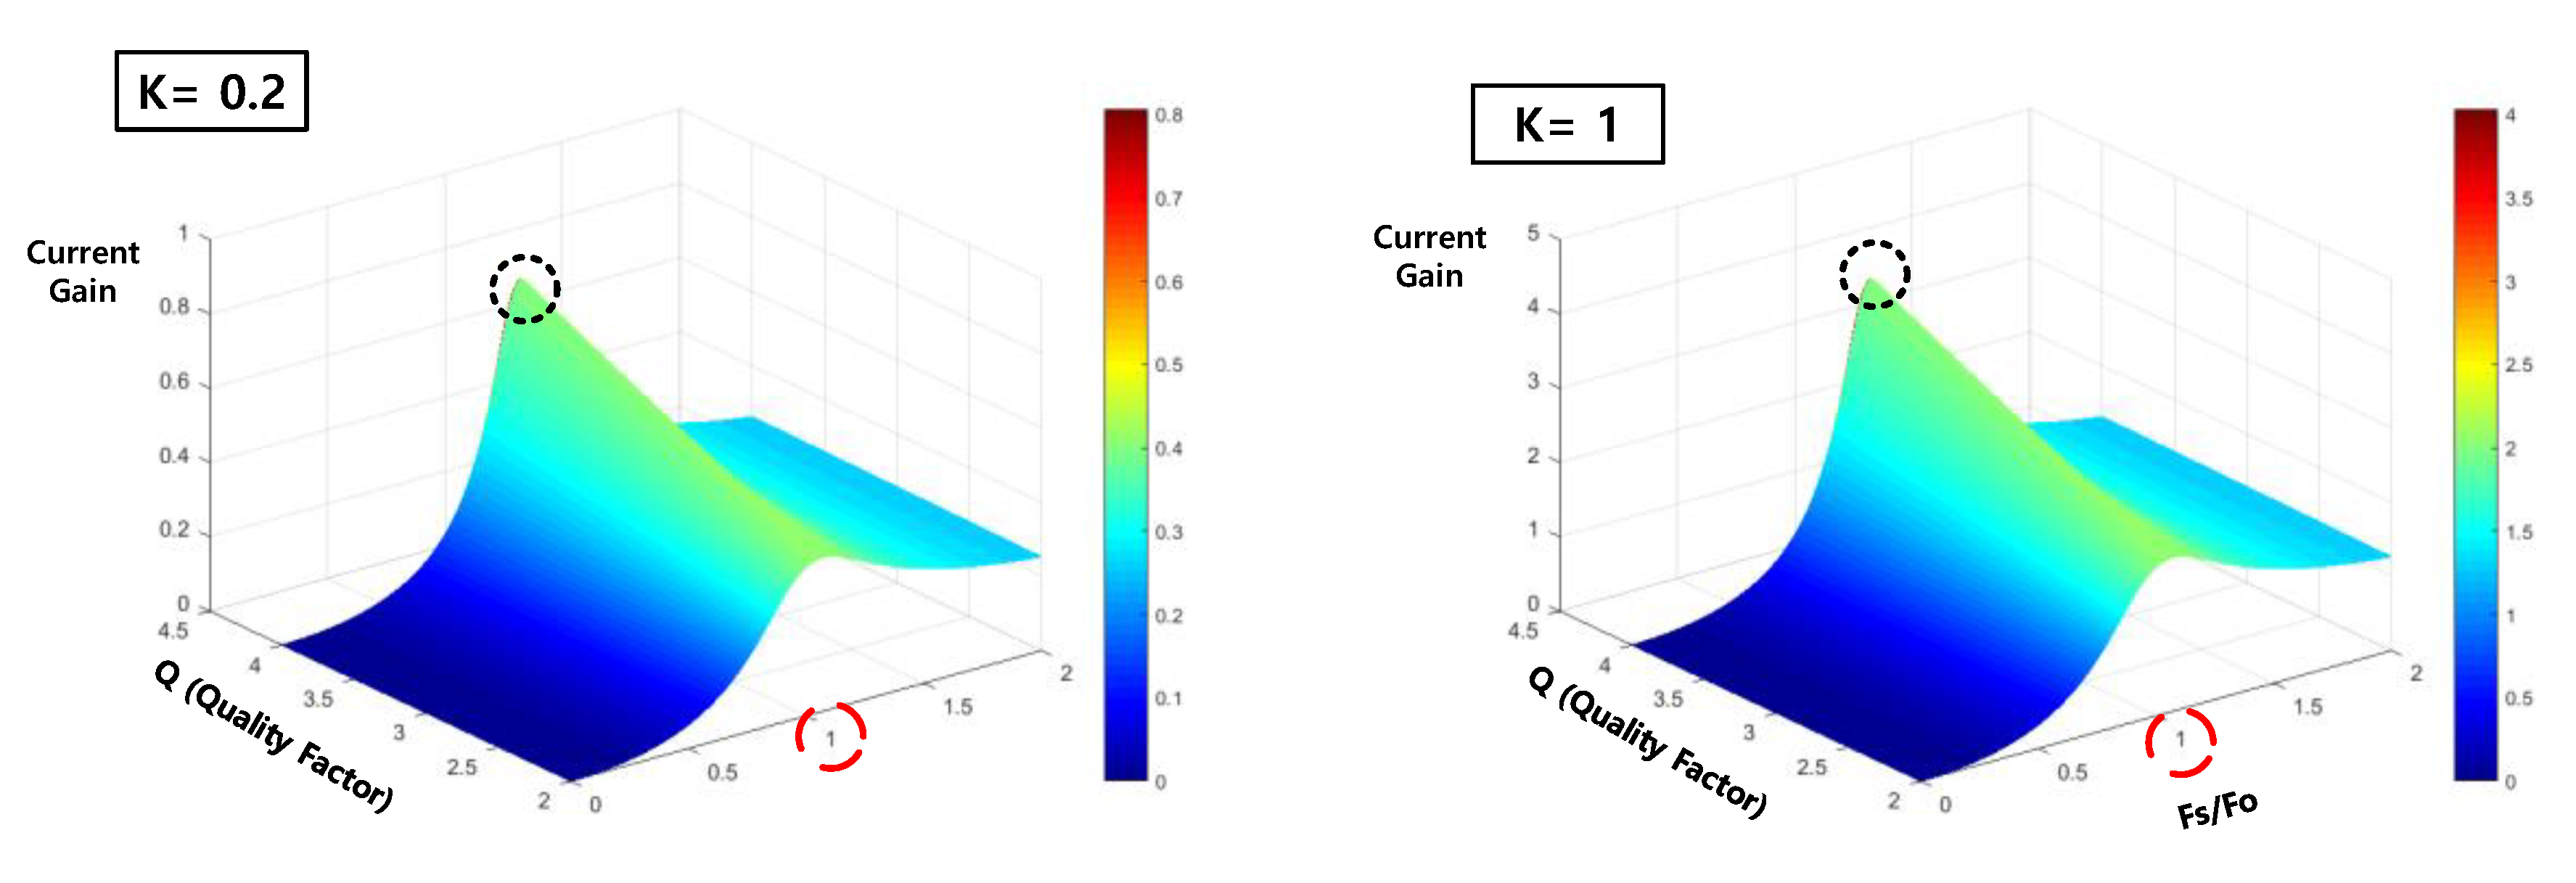
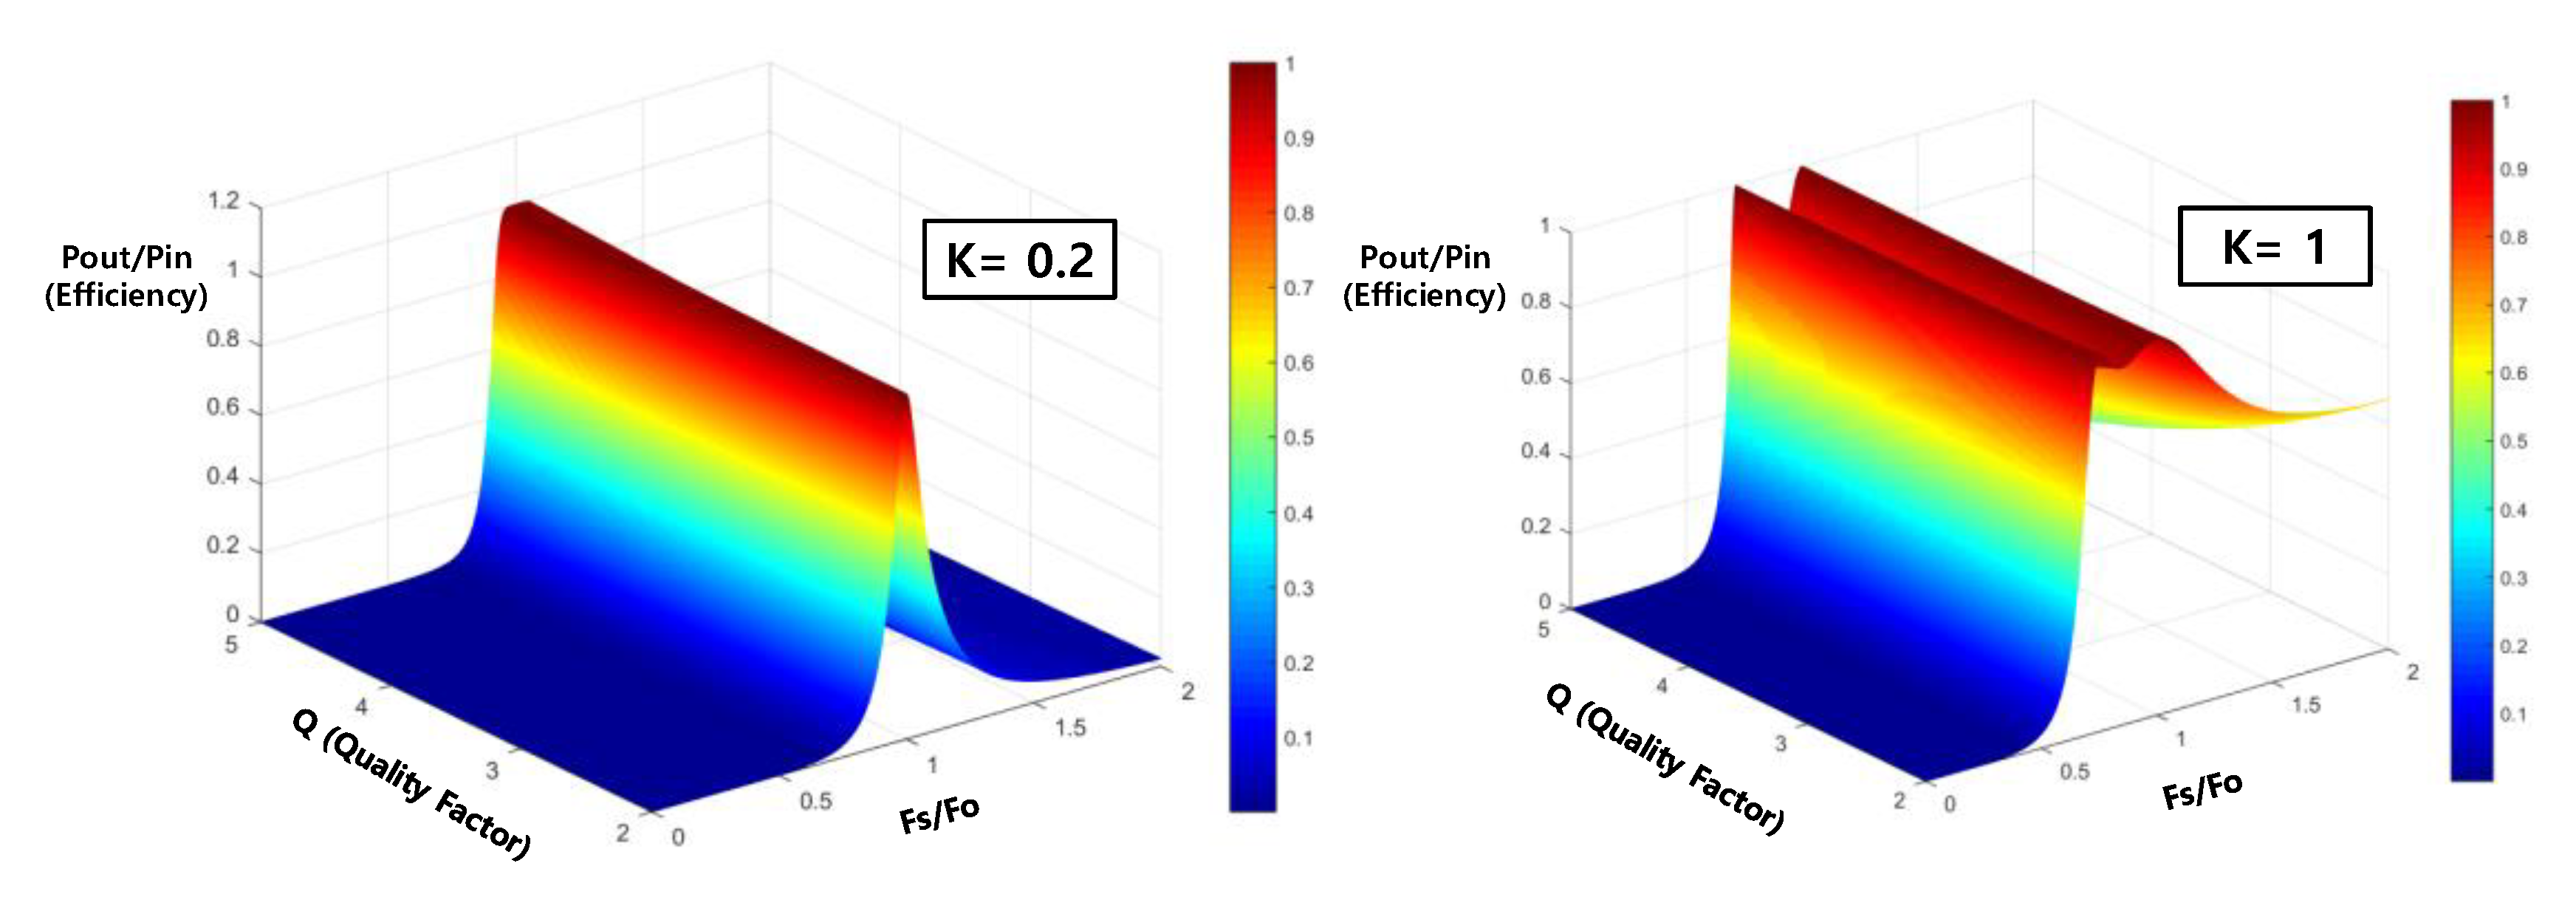
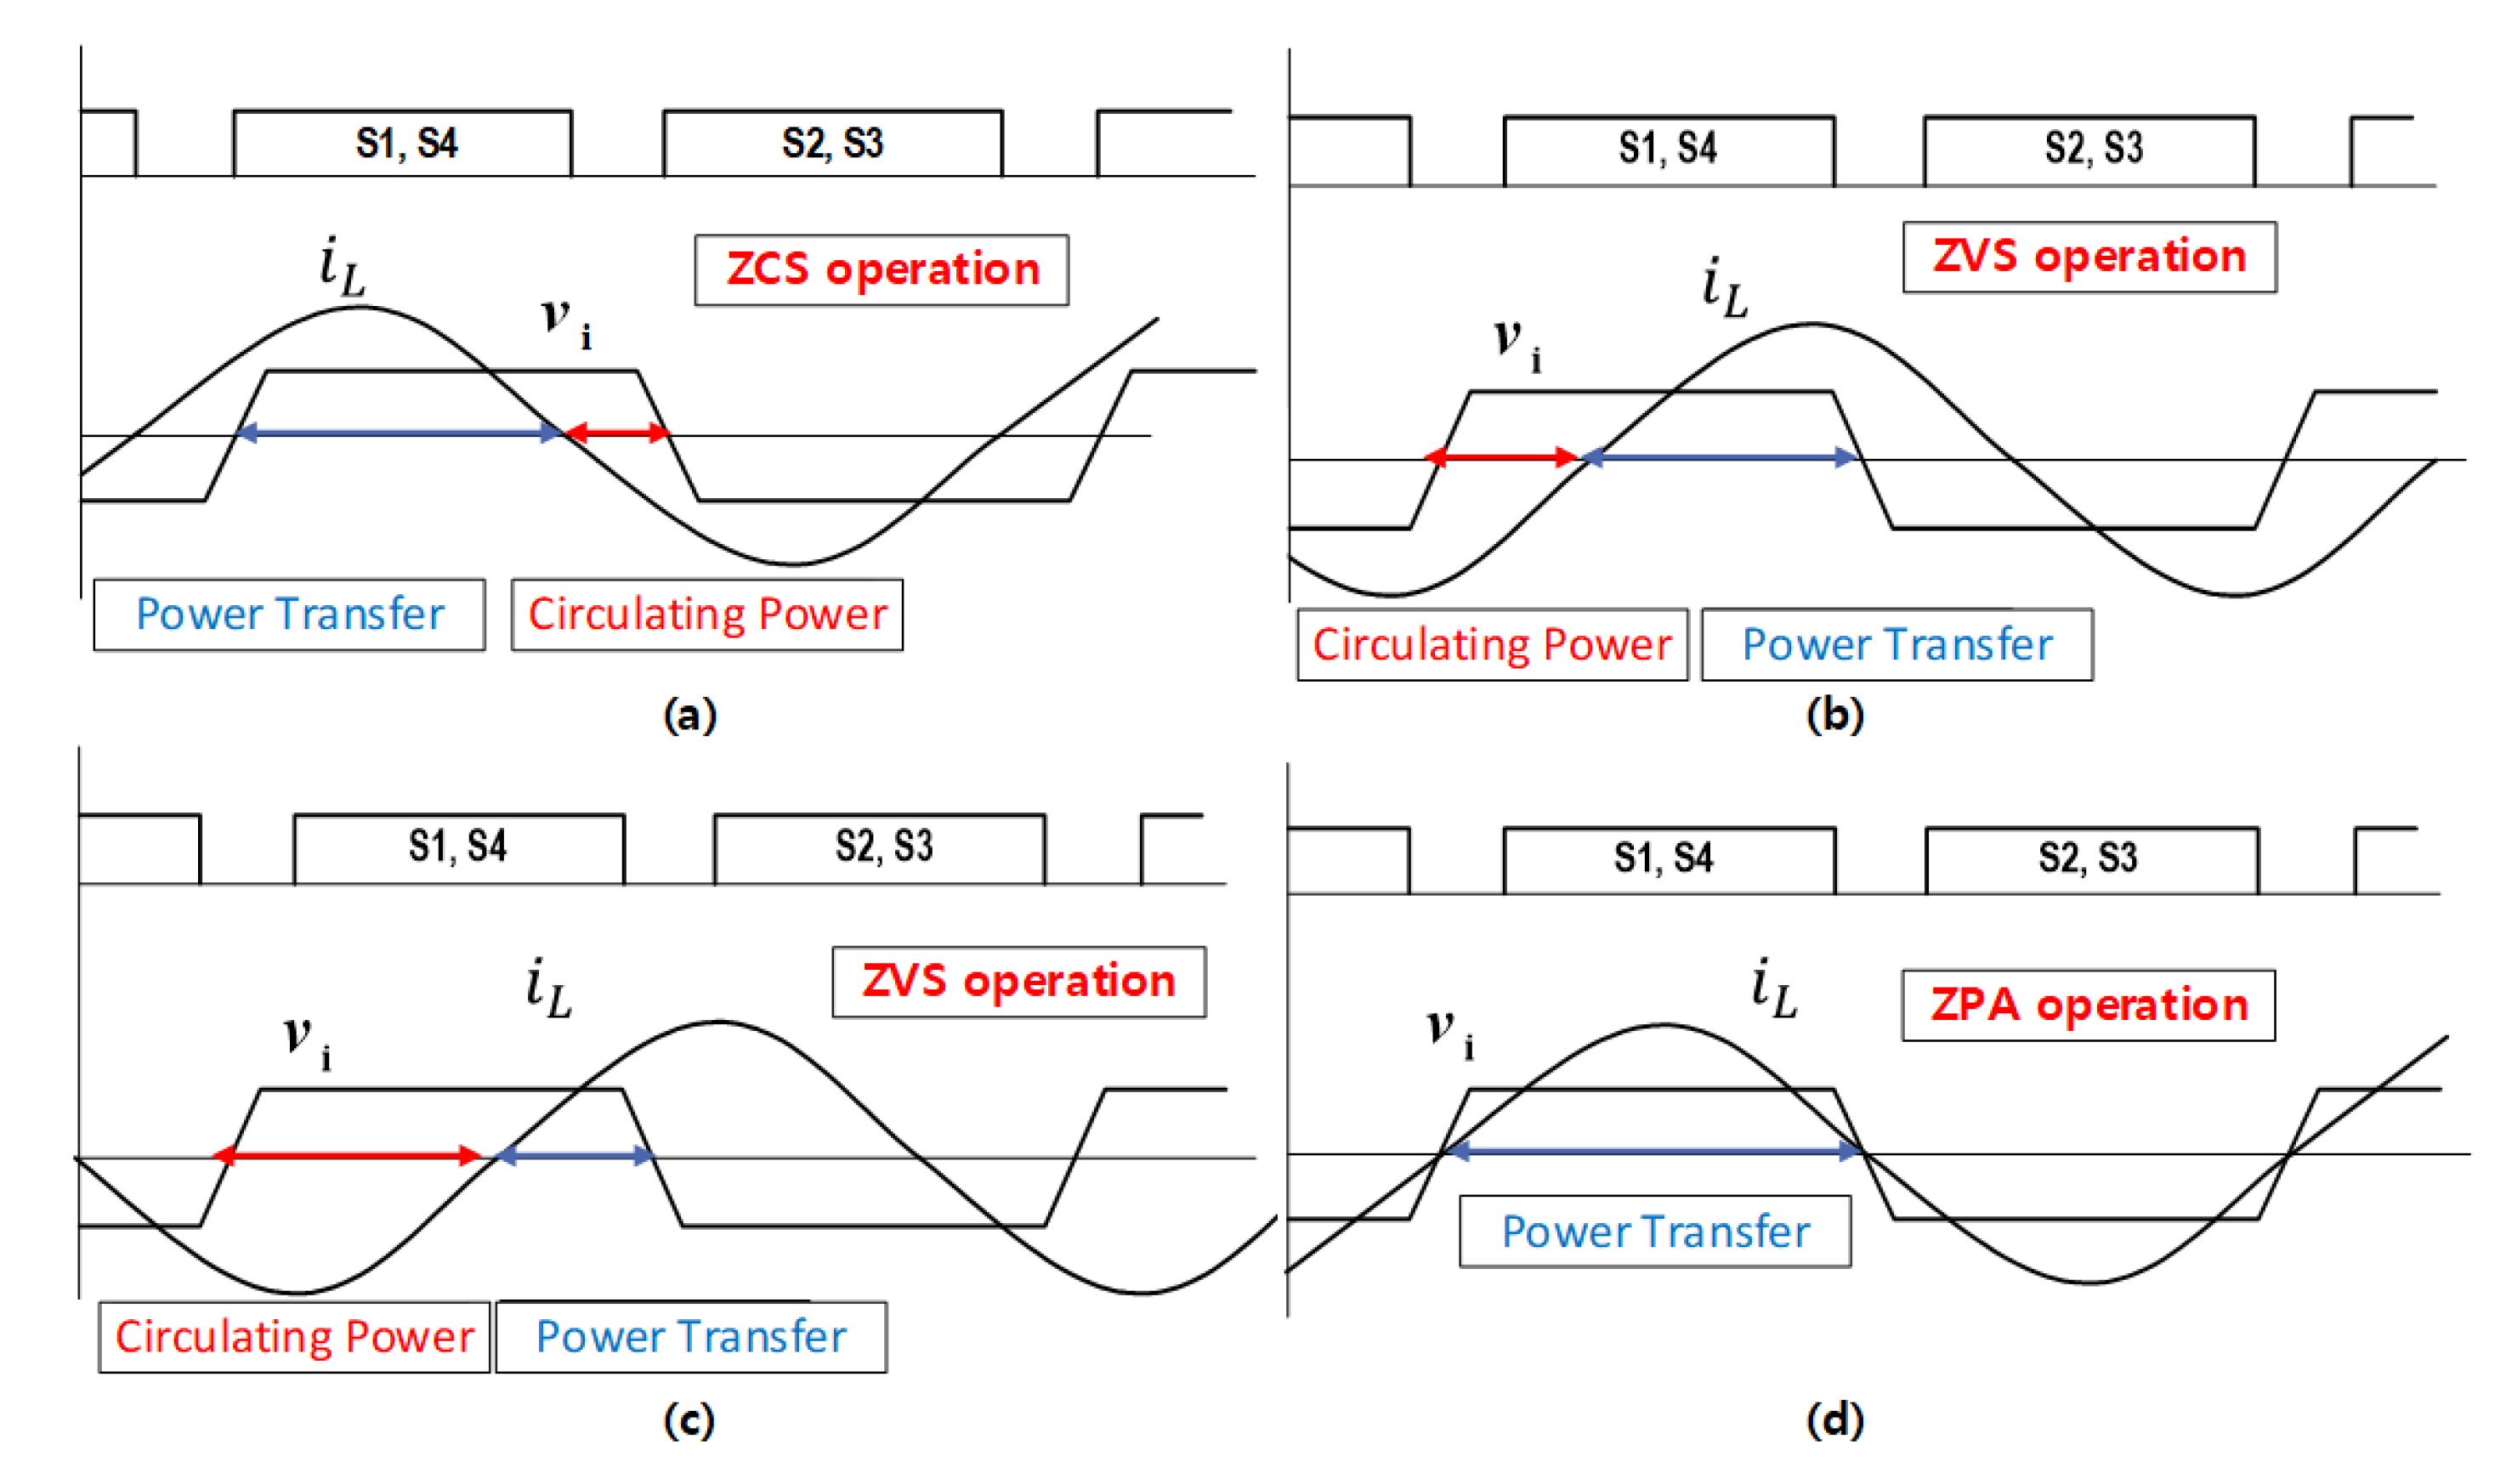
3. WPT System and Zero Phase Angle (ZPA) Operation

Figure 5 shows the proposed WPT system diagram. The WPT system hardware consists of the direct current (DC) chopper, SS topology, rectifier and load. The DC-link voltage of the WPT system is 50 V. The TX/RX (transmitter/receiver) has SS topology with capacitor and coils. And also, the TX/RX coils have inductance ( L p   a n d   L s ). The resonant point is decided by capacitor and inductance.
The proposed WPT system is controlled by DSP (TMS320F28335, Texas Instruments, Dallas, TX, USA) for the frequency-tracking algorithm based on SOGI-FLL. and also, the pulse frequency modulation (PFM) generator is operated by DSP to generate the switching signal. The generated switching signal is performing the switching turn on/off for the DC-chopper (S1~S4).
In order to operate the ZPA region in the WPT system shown in Figure 6d. Between the primary current ( I L ) and voltage, it has resonant switching frequency ( F s = F o ). Figure 6b,c shows the ZVS operation, it is operating at F s > F o state. On the other hand, Figure 6a shows the switching frequency at the F s < F o state, it is operating ZCS region. Both ZVS and ZCS operation have a circulating power. Thus, it causes power loss and low power transmission [13].

4. Proposed Frequency-Tracking Algorithm

SOGI-FLL is proposed to the resonant frequency of the WPT system. To monitor the primary current and voltage phasors, SOGI-FLL is used to obtain high accuracy, low computational cost and phasor adaptation ability. The SOGI method is a frequency-adjustable resonator applied to two cascaded integrators operating in a close-loop system.
To help the ZPA operation, the primary current frequency of the DC chopper in the WPT system has to track the resonant state automatically. If the primary current is low compared with the past current, it is not operating the ZPA state. Therefore, by operating the proposed algorithm, it can estimate the resonant point and ZPA state.
We propose the new WPT system with the frequency tracking algorithm for ZPA operation and the SOGI-FLL. The frequency tracking mode controller is shown in Figure 7. The proposed method has two feedback loops, where the SOGI-FLL provides the primary current and center frequency. The frequency tracking algorithm generate PFM signal based on the frequency and the primary current.

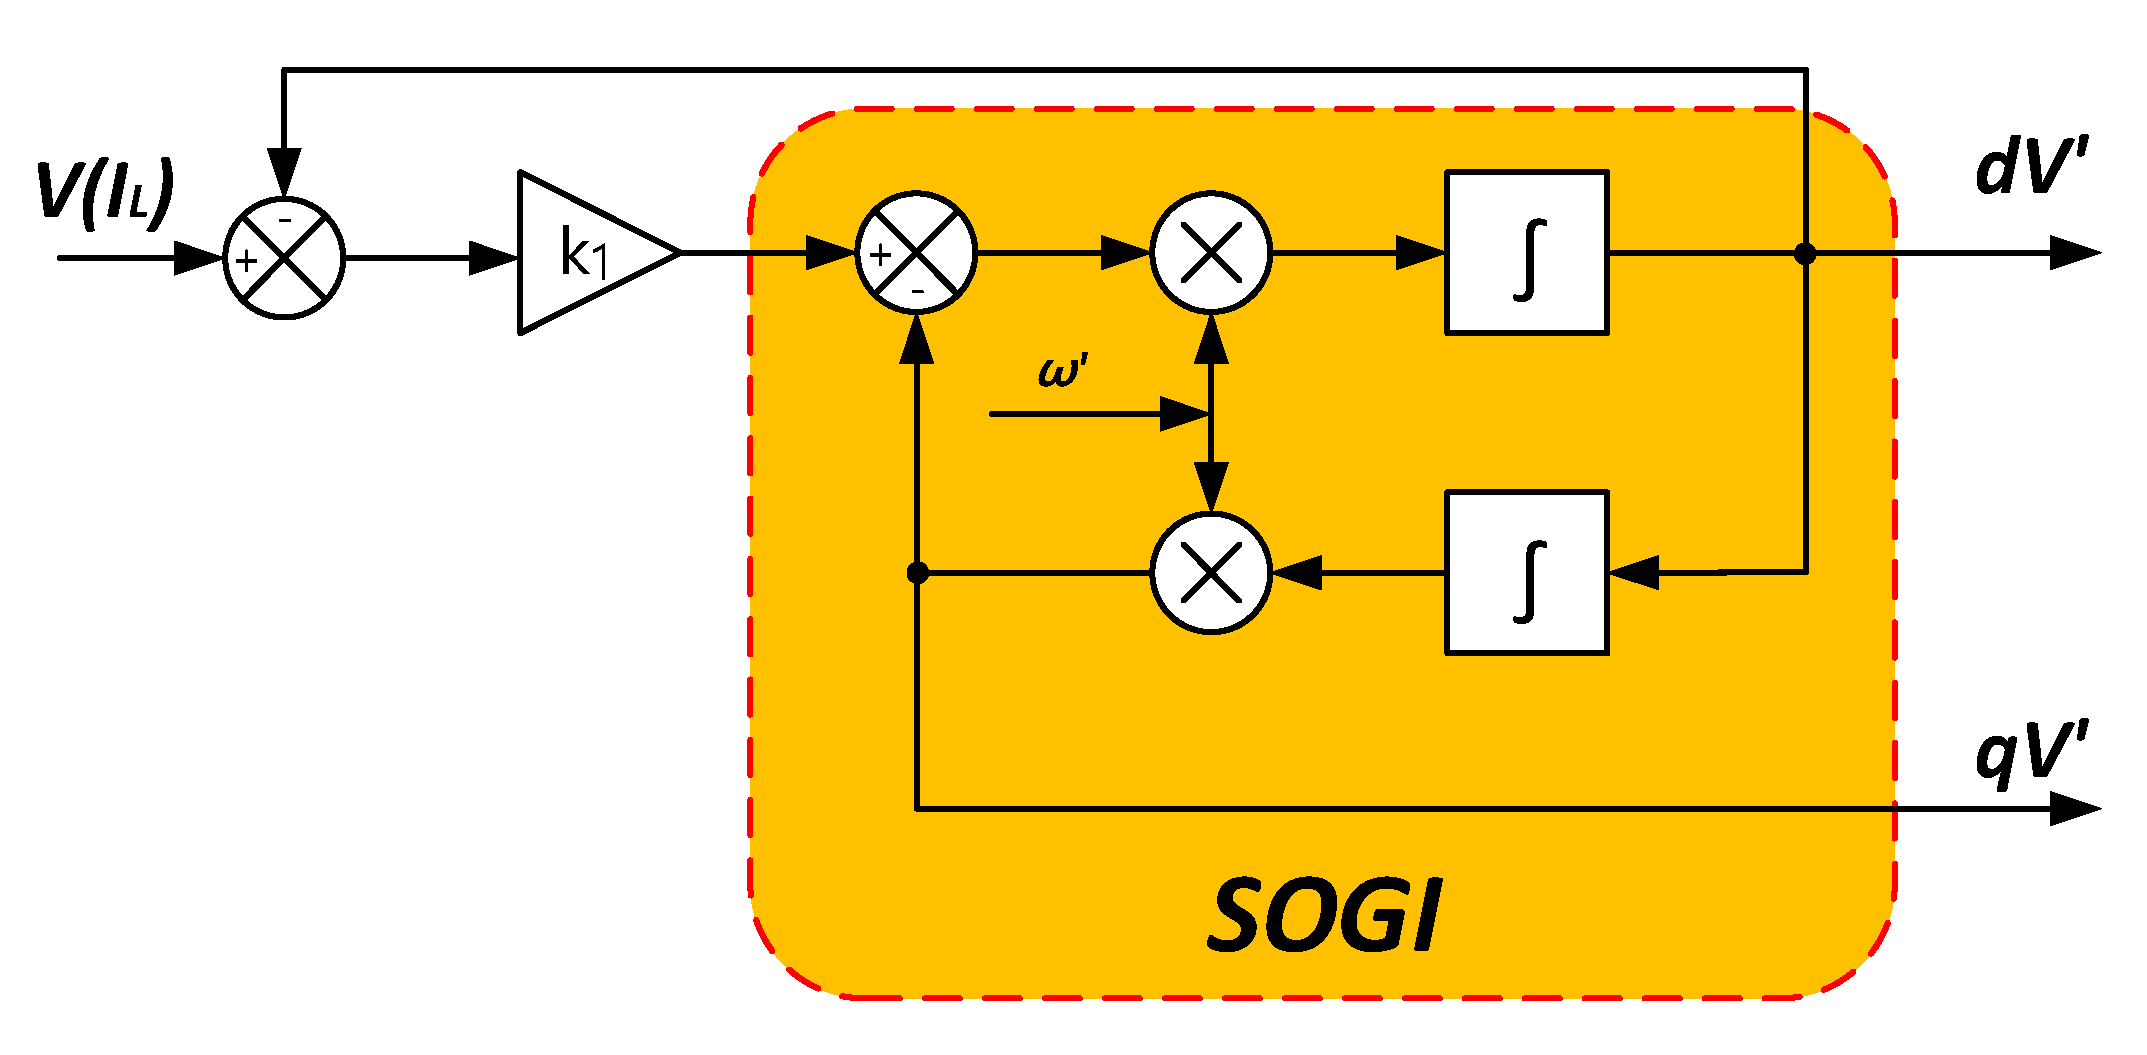
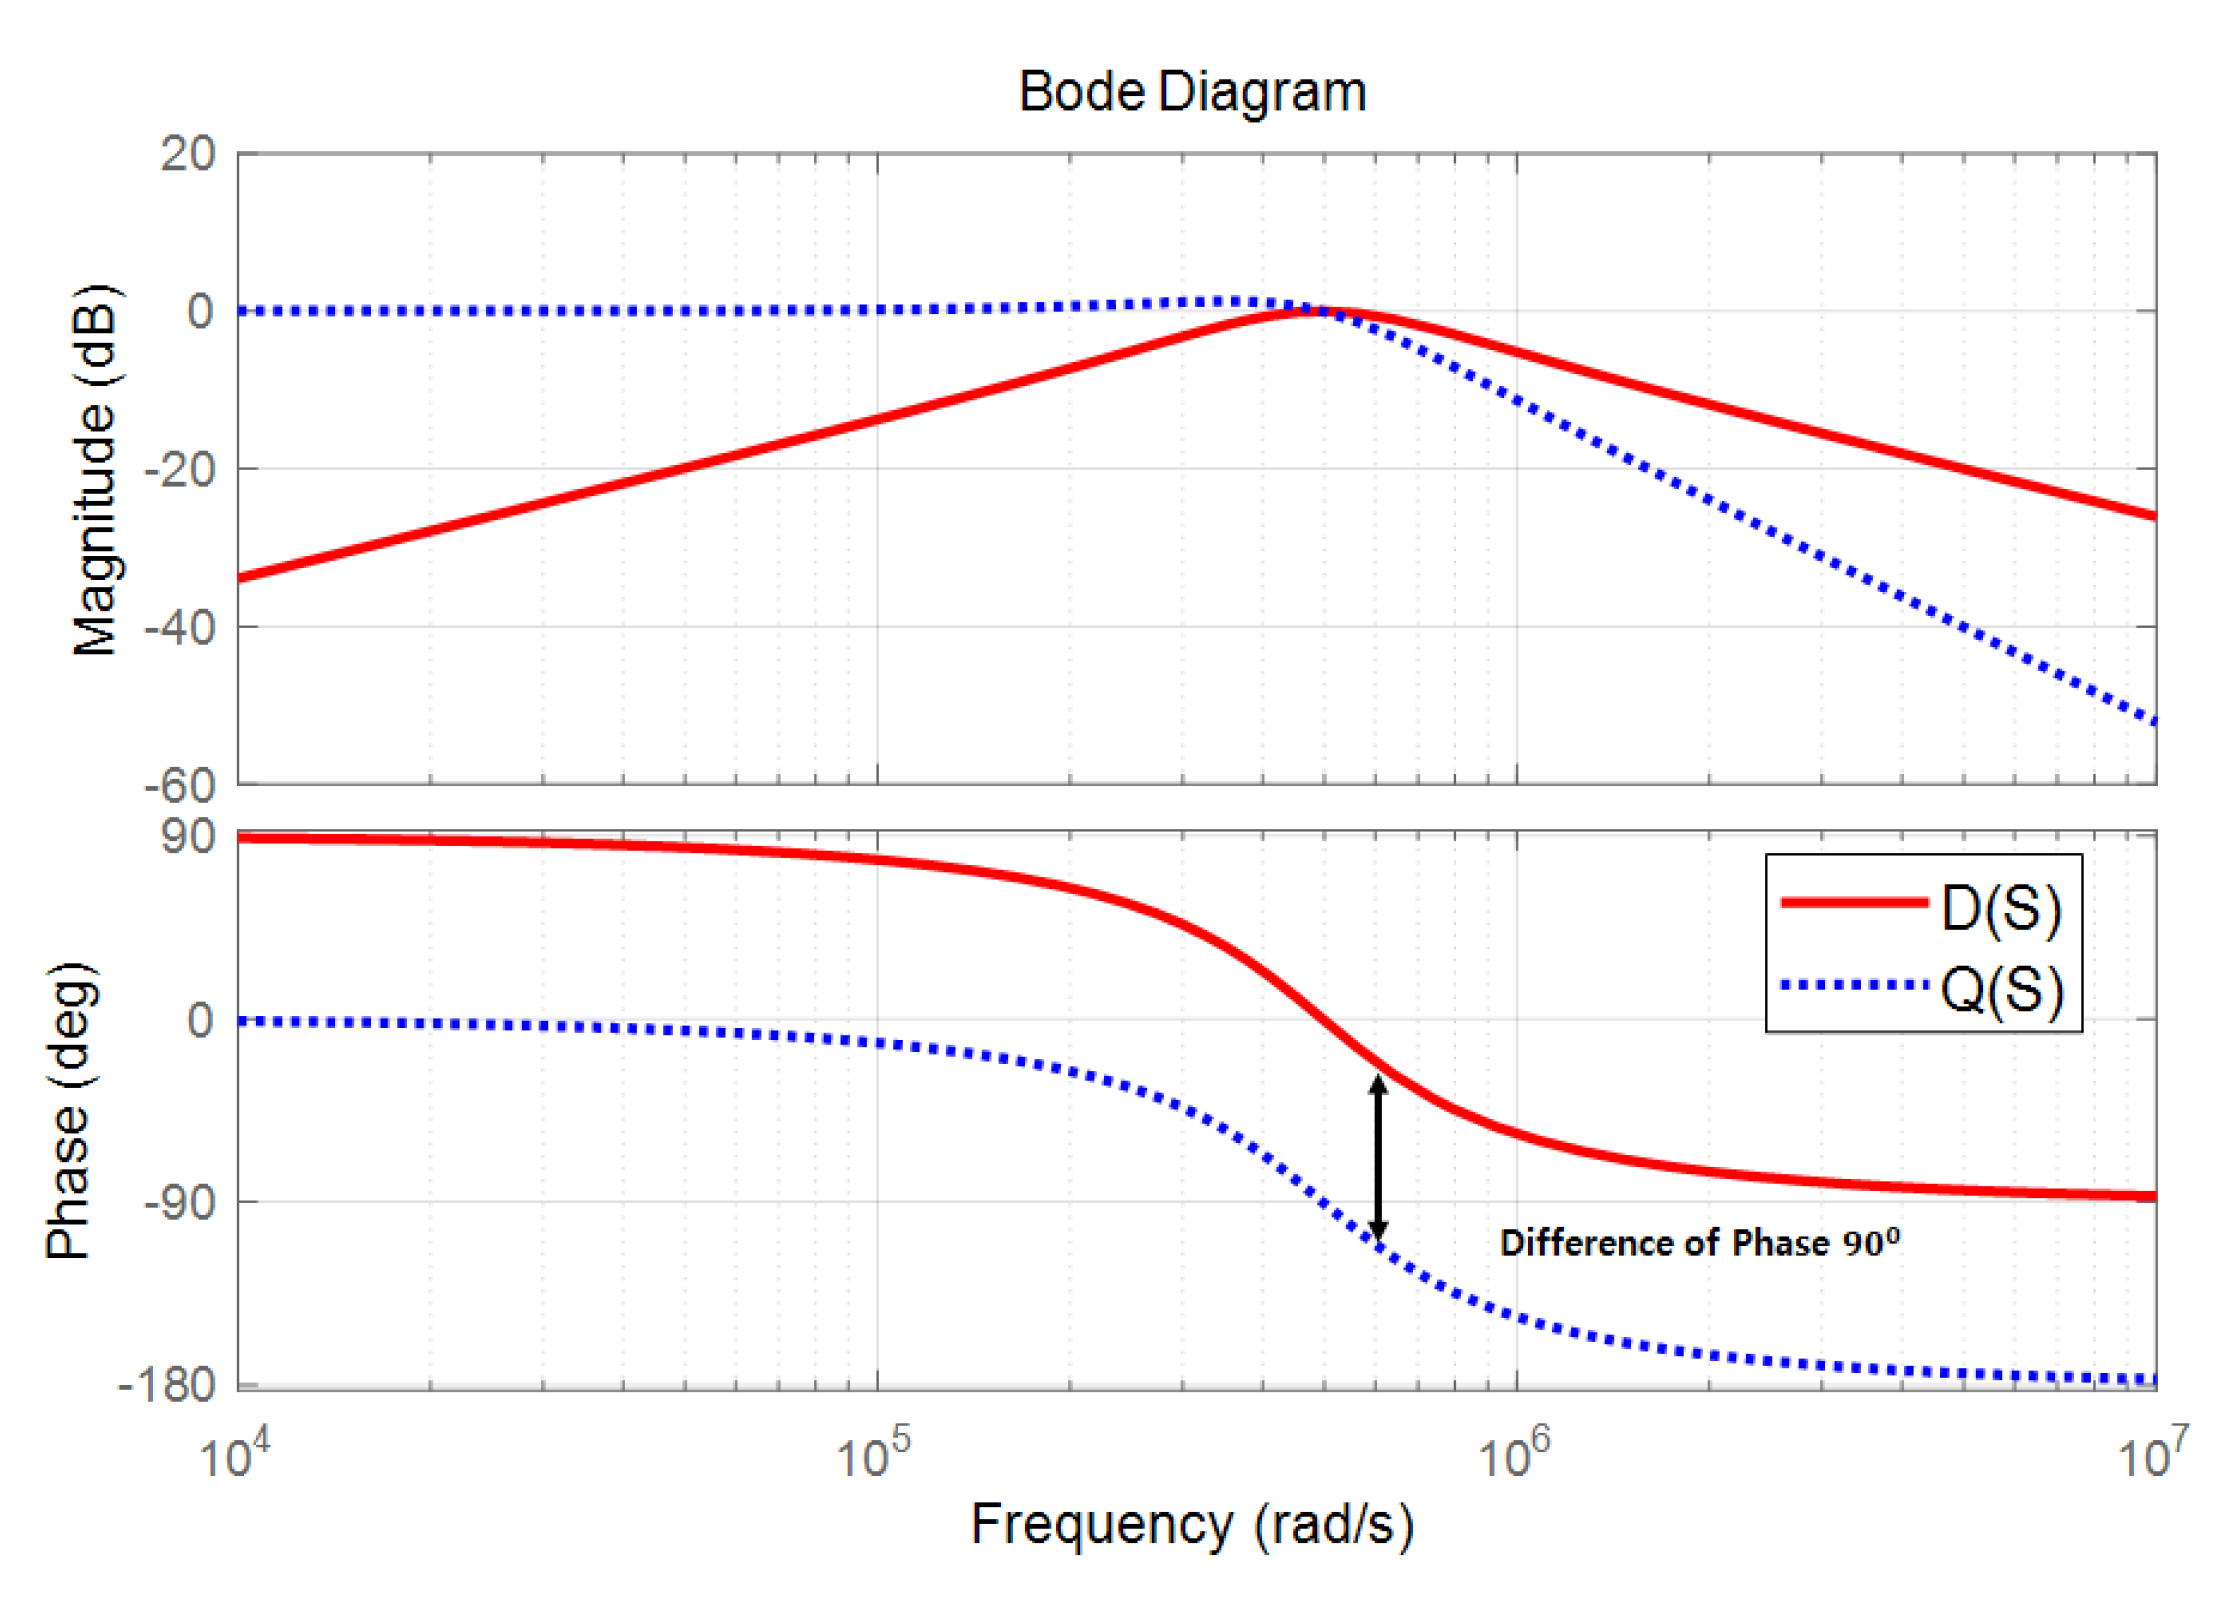
4.1. SOGI-QSG (Second-Order Generalized Integrator-Quadrature Signal Generator)

The second-order generalized integrator-quadrature signal generator (SOGI-QSG) is a frequency-adjustable resonator implemented by two cascaded integrators to work in a closed-loop shown in Figure 8. The SOGI-QSG method uses a sinusoidal input. It has the same phase output on the d v , and a signal has the same size of the input signal. But it is delayed by 90 degrees of the output on the q v . The SOGI-QSG closed-loop functions of the filter can be written as (14) and (15), where ω and gain k 1 set the center frequency damping factor separately [14,15,16,17].
D ( s ) = d v v ( s ) = k 1 ω s s 2 + k 1 ω s + ω 2
Q ( s ) = q v v ( s ) = k 1 ω 2 s 2 + k 1 ω s + ω 2
Following Equations (14) and (15), in Figure 9 is shown the D(s) and Q(s) comparison when ( k 1 = 1 ) .
The I L frequency can be changed, therefore, this SOGI should be able to tune its factor in case of I L frequency change. To accomplish this, trapezoidal approximation is applied to obtain the discrete transfer function. This can express the following Equations (16)–(18).
D ( Z ) = k 1 ω T s 2 z 1 z + 1 ( 2 T s z 1 z + 1 ) 2 + k 1 ω T s 2 z 1 z + 1 + ω 2 = 2 k 1 ω T s ( z 2 1 ) 4 ( z 1 ) 2 + ( 2 k 1 ω T s ) ( z 2 1 ) + ( ω T s ) 2 ( z + 1 ) 2
By using x = 2 k 1 ω T s and y = ( ω T s ) 2 . It can be expressed Equations (17) and (18).
D ( Z ) = ( x x + y + 4 ) + ( x x + y + 4 ) z 2 1 ( 2 ( 4 y ) x + y + 4 ) z 1 ( x y 4 x + y + 4 ) z 2 = b o + b 2 z 2 1 a 1 z 1 a 2 z 2
Q ( Z ) = ( k 1 y x + y + 4 ) + 2 ( k 1 y x + y + 4 ) z 1 + ( k 1 y x + y + 4 ) z 2 1 ( 2 ( 4 y ) x + y + 4 ) z 1 ( x y 4 x + y + 4 ) z 2 = q b o + q b 1 z 1 + q b 2 z 2 1 a 1 z 1 a 2 z 2
Furthermore, the RMS (Root Mean Square) current of the I L can also be estimated to the Equation (19).
I L ( R M S ) = 1 2 ( d v ) 2 + ( q v ) 2

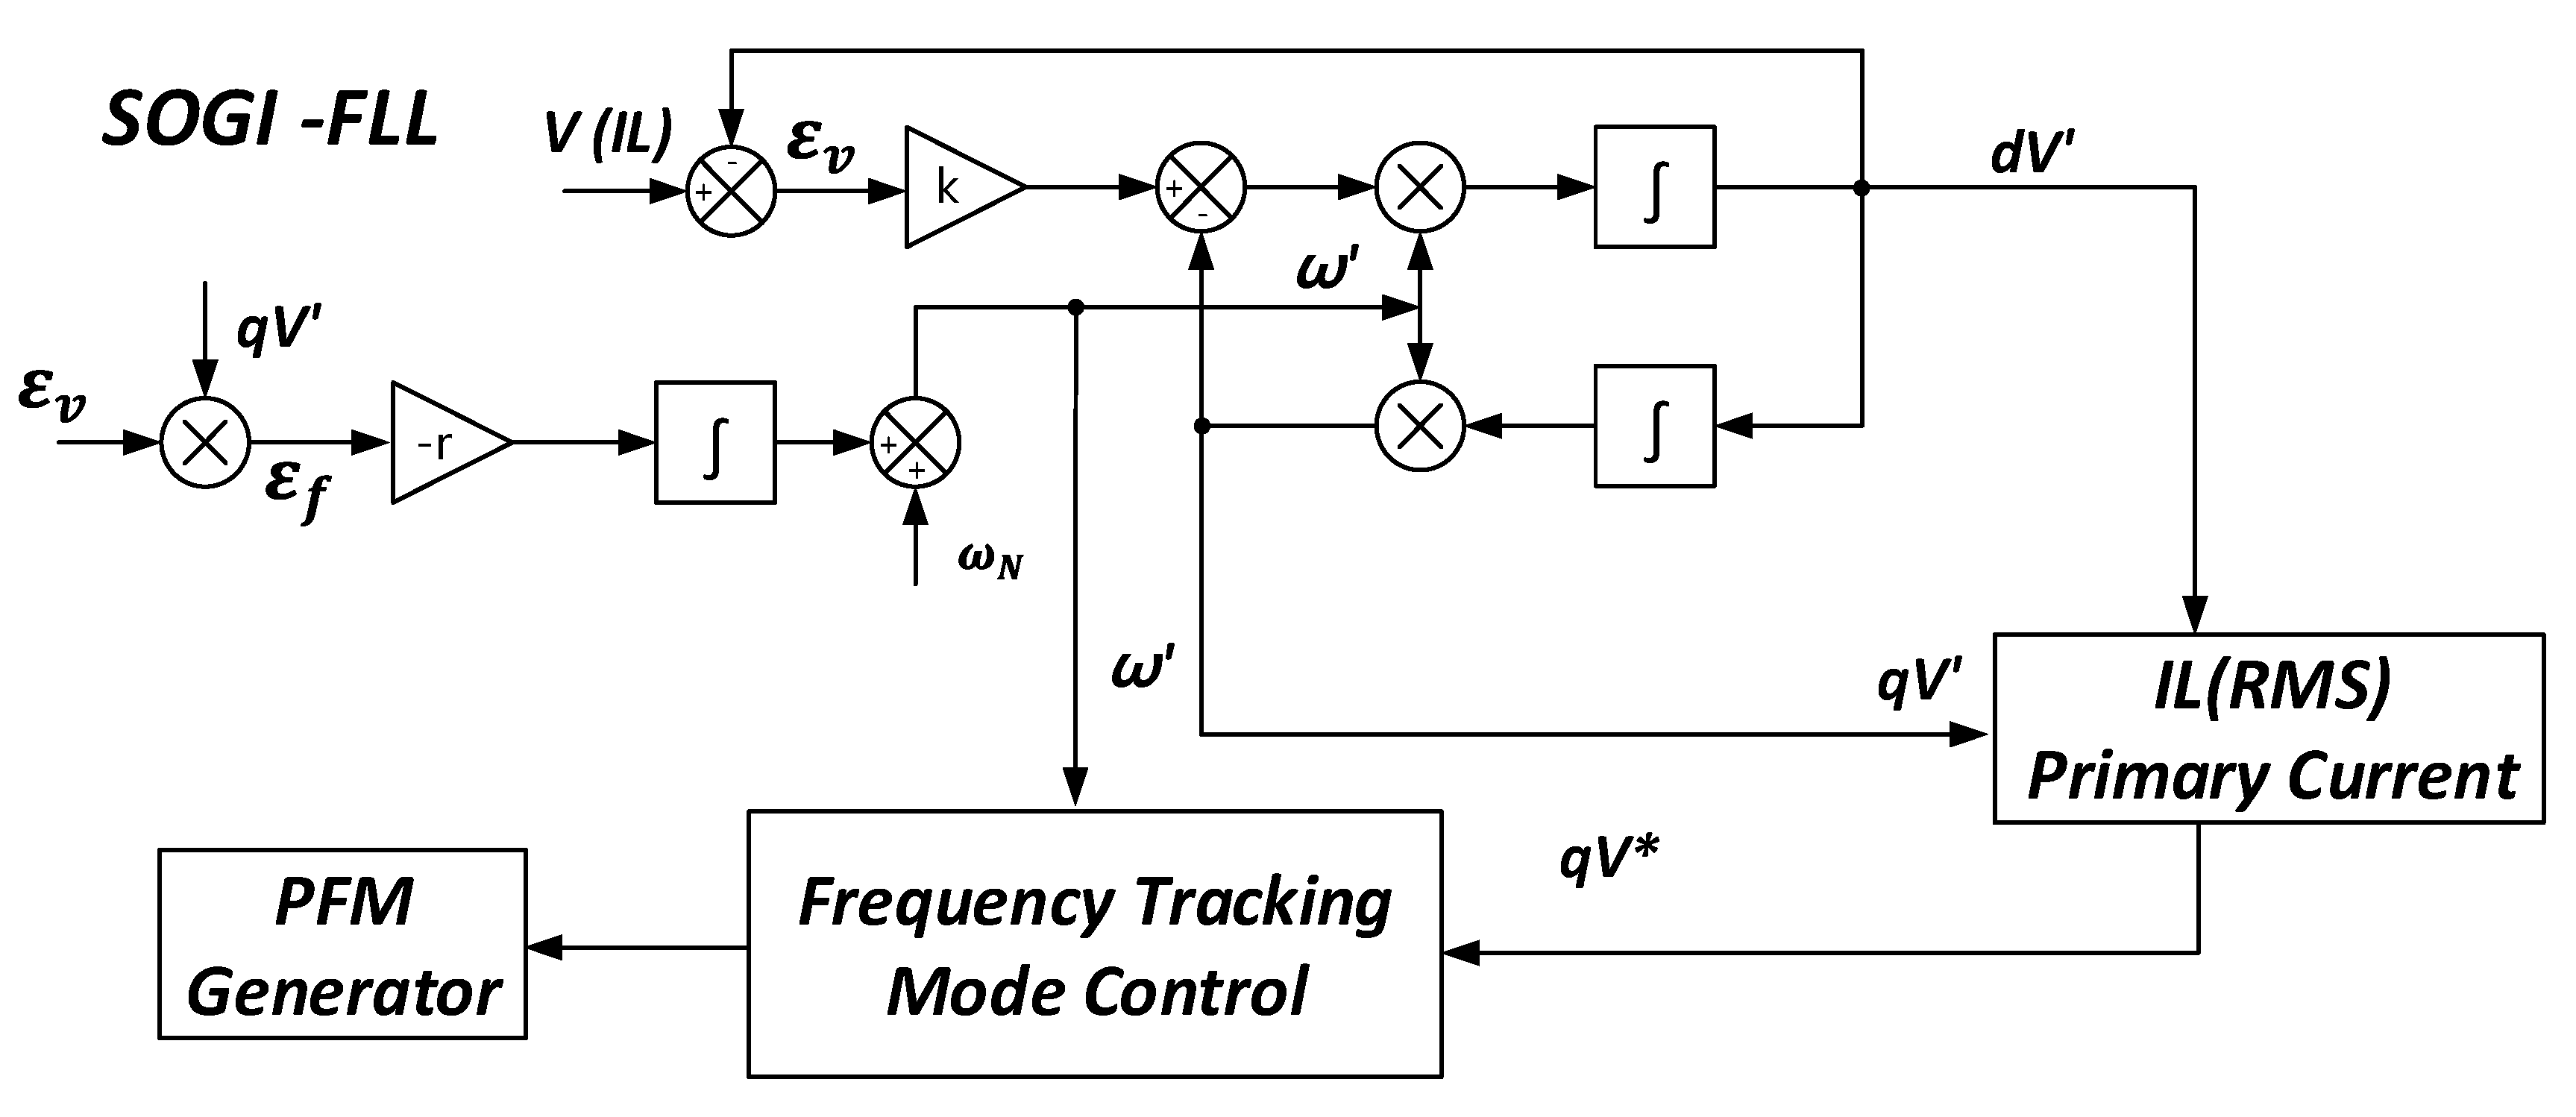
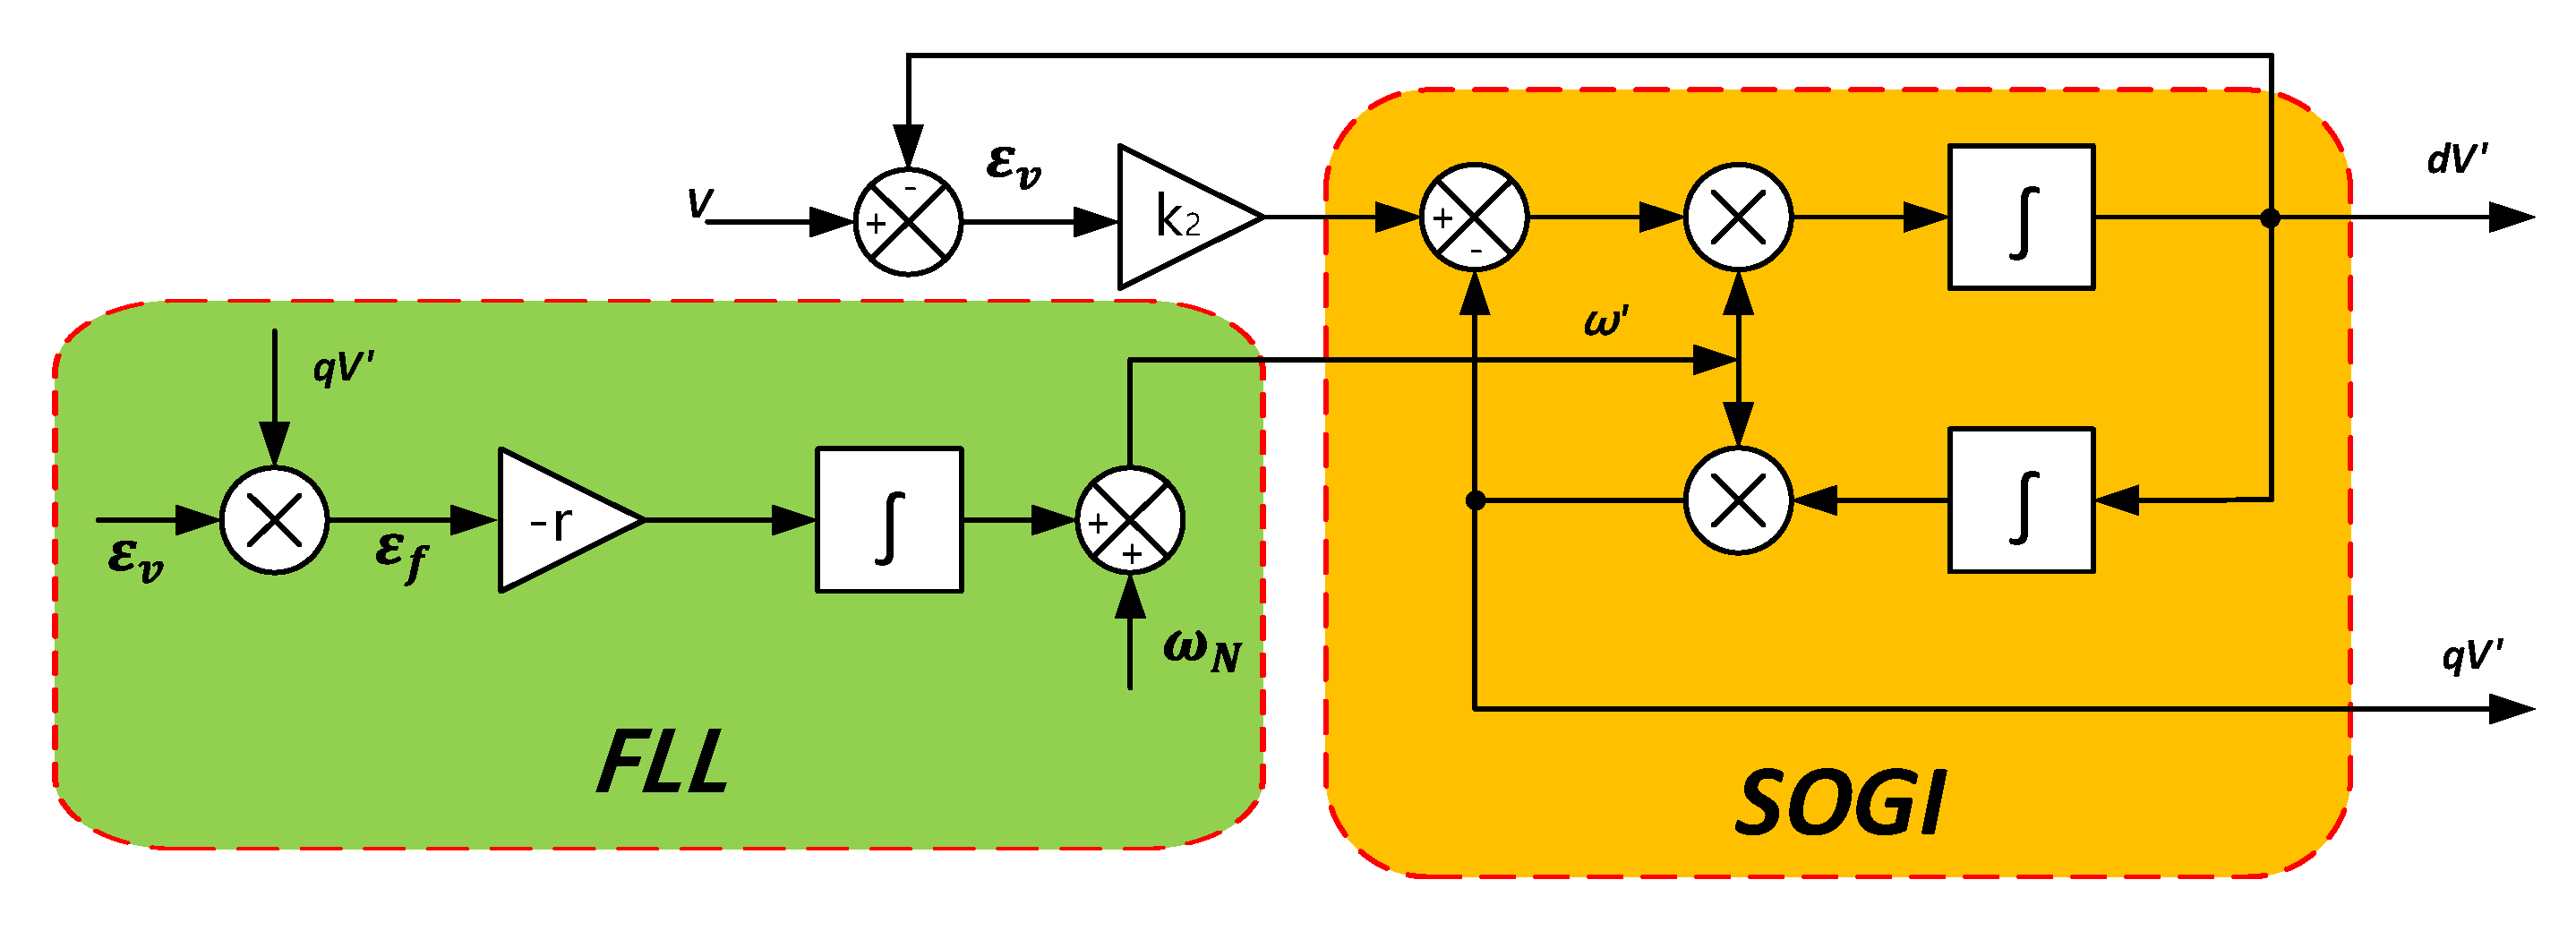
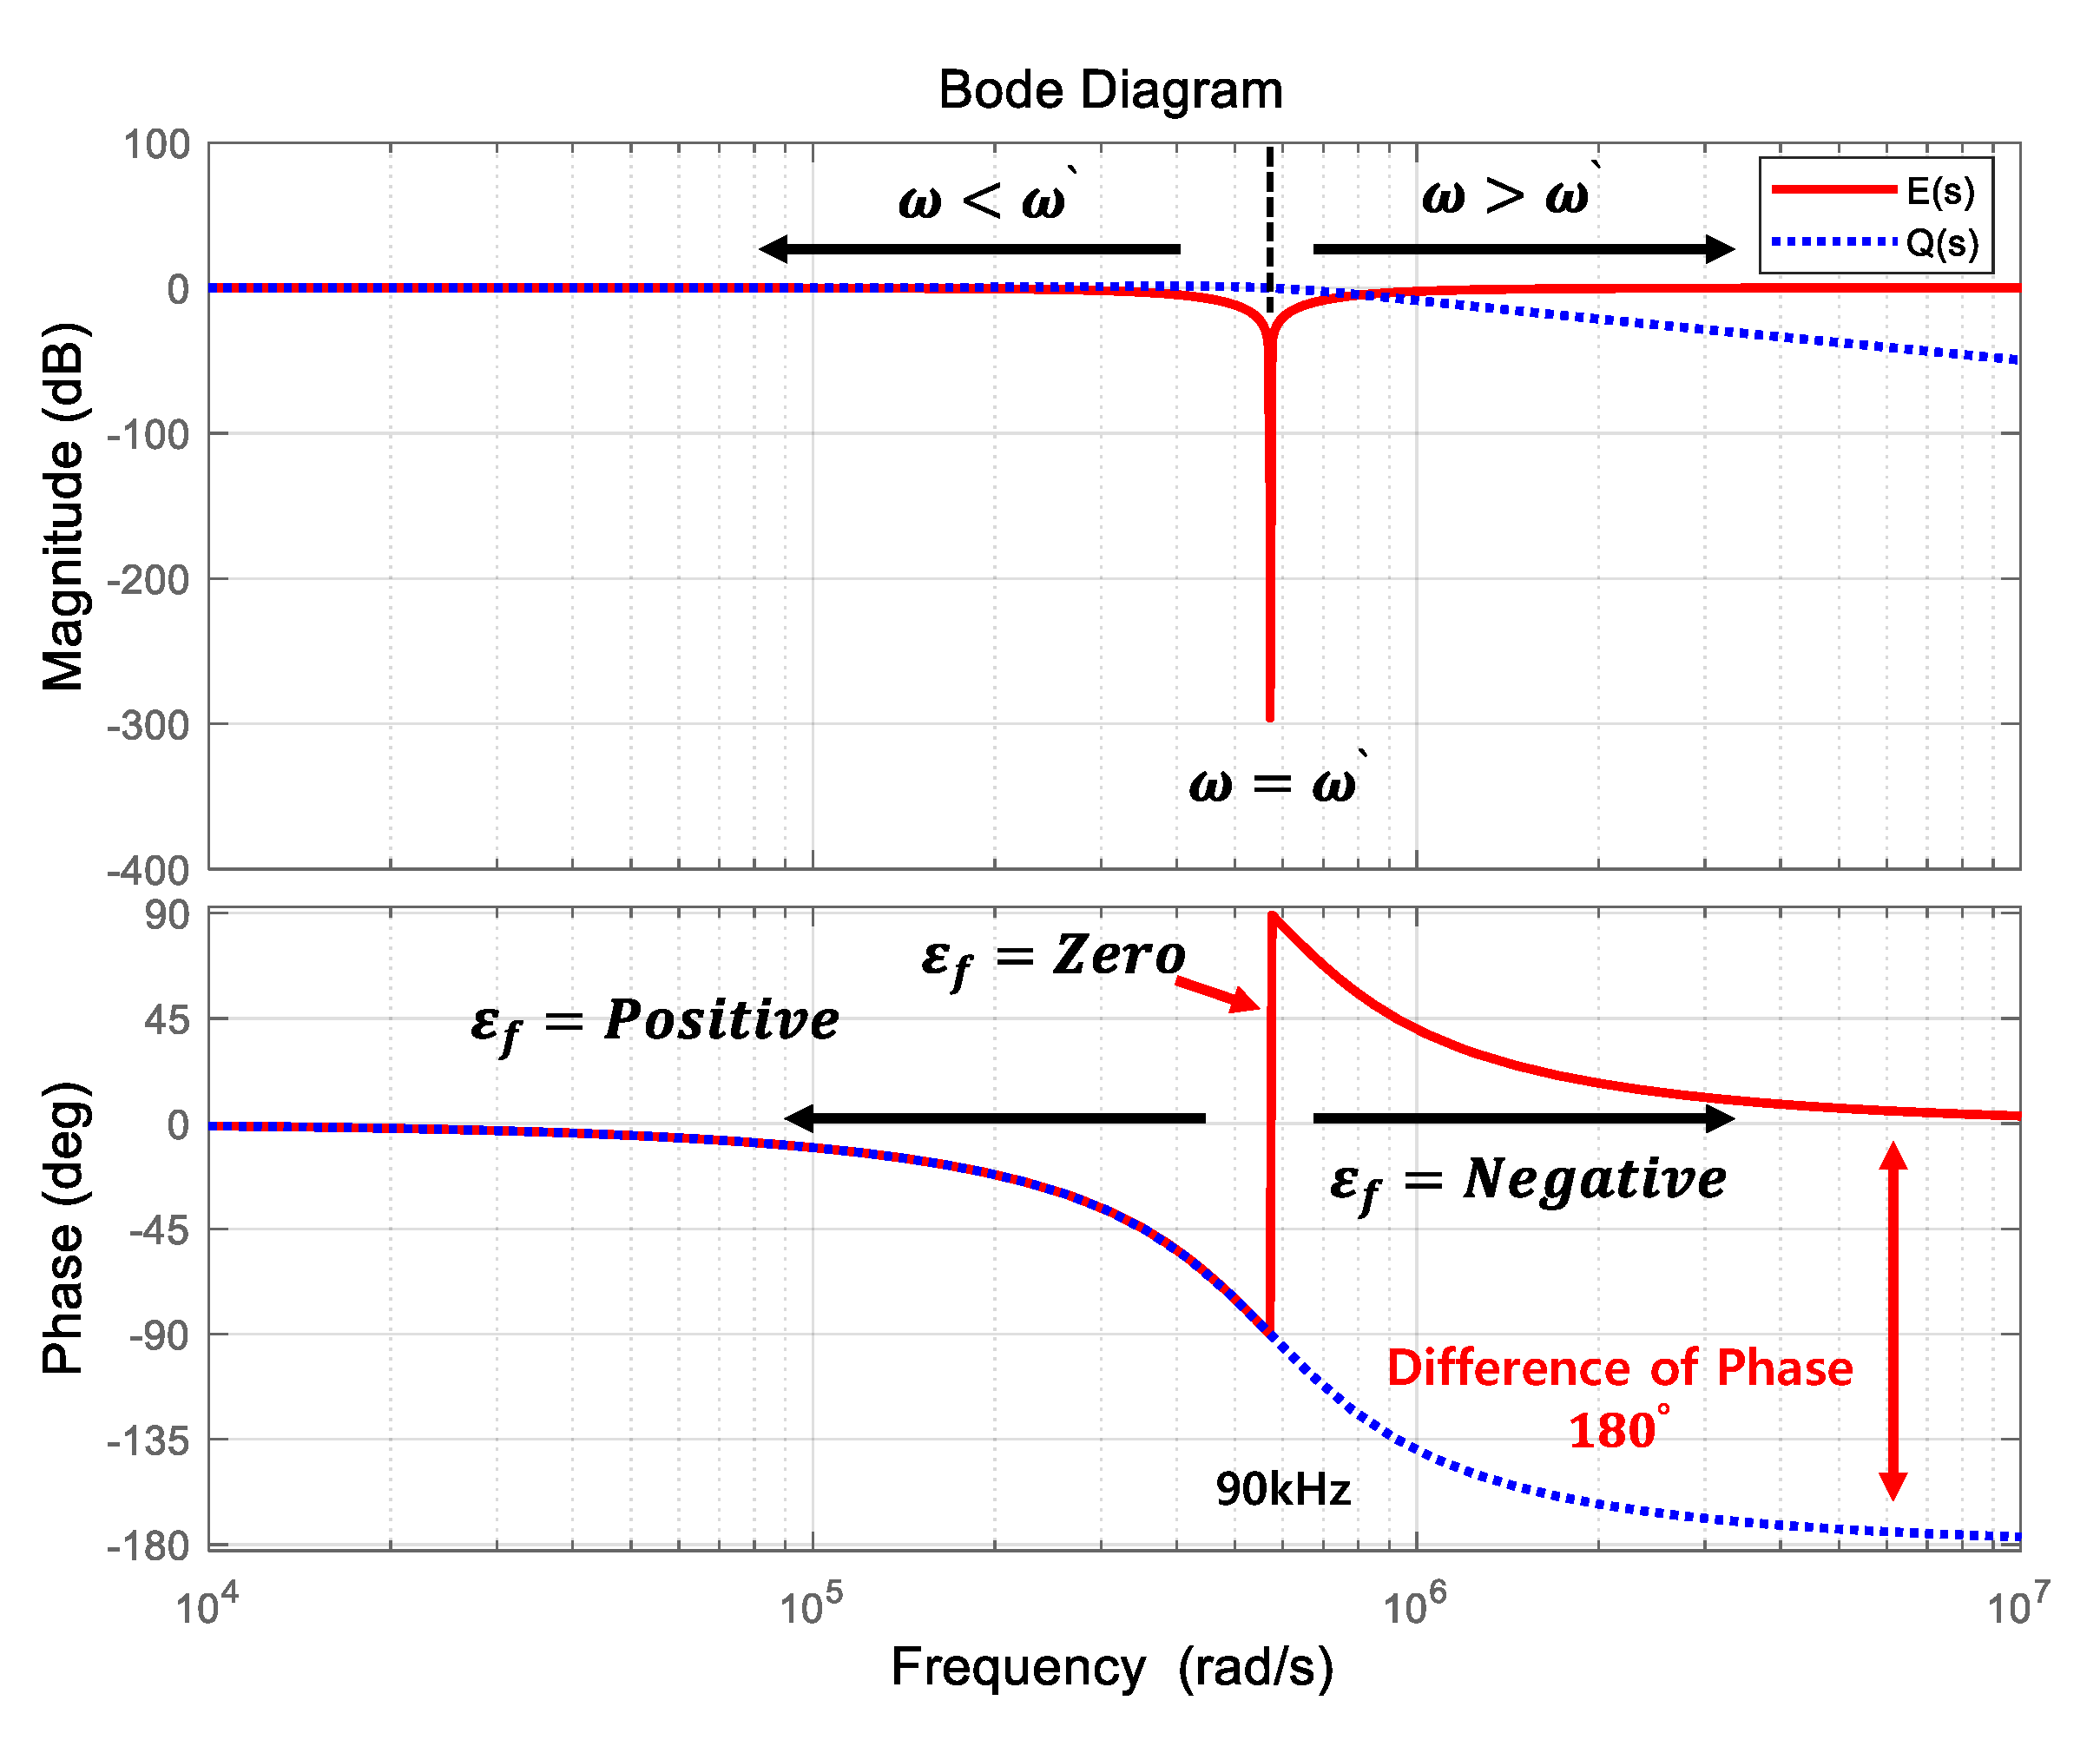
4.2. SOGI-FLL (Frequency Locked Loop)

SOGI-FLL is used for detecting the primary current exactly, even if the primary current frequency is changed by frequency tracking algorithm. To apply SOGI to a system with potential, the center frequency of SOGI must be able to follow the input signal frequency. The FLL extracts the information of the system frequency. FLL extracts the frequency information using the q-axis signal output from the SOGI without calculating the PI (Proportional Integral) controller and trigonometric functions used in the PLL (Phase Locked Loop). Figure 10 shows the block diagram of the SOGI-FLL. The transfer function is expressed in Equation (20) [18,19,20,21].
E ( s ) = ε v v ( s ) = s 2 + ω 2 s 2 + k 2 ω s + ω 2
ε v is the error between the input signal and the output signal of the d-axis, k 2 is gain and the center frequency is ω . Using Equation (20), the Bode diagram is shown in Figure 10. When the frequency of the input signal is lower than the center frequency, ε v and q V are the same phase. That is, the frequency error ε f can be calculated using two signals. When the signal frequency is the same as the center frequency, the ε f becomes zero. When the signal frequency is higher than the center frequency, the ε f has to be negative. As shown in Bode diagram (Figure 11), the negative gain and an integrator are used to make the direct current component of ε f of zero, so that the center frequency follows the input signal frequency. Trapezoidal approximation is applied to obtain the discrete transfer function. It can express the following Equation (21) [22,23,24].
E ( Z ) = ( 2 T s z 1 z + 1 ) 2 + ω 2 ( 2 T s z 1 z + 1 ) 2 + k 2 ω T s 2 z 1 z + 1 + ω 2 = 4 ( z 1 ) 2 + ( ω T s ) 2 ( z + 1 ) 2 4 ( z 1 ) 2 + ( 2 k 2 ω T s ) ( z 2 1 ) + ( ω T s ) 2 ( z + 1 ) 2
By using x = 2 k 2 ω T s and y = ( ω T s ) 2 , it can be expressed as Equation (22) where, the T s is the sampling time, the sampling time is applying the switching frequency of the system. it can be expressed to 1/ F s . The initial switching frequency is 90 kHz. Therefore, the initial sampling time is 0.00001 s.
E ( Z ) = ( 4 + y x + y + 4 ) + ( 2 y 8 x + y + 4 ) z 1 + ( 4 + y x + y + 4 ) z 2 1 ( 2 ( 4 y ) x + y + 4 ) z 1 ( x y 4 x + y + 4 ) z 2 = E o + E 1 z 1 + E 2 z 2 1 a 1 z 1 a 2 z 2
In case of the center frequency and the input frequency are different from each other, accurate calculations are impossible. Therefore, the central frequency has to estimate the input frequency through SOGI-FLL. Figure 12, shows the step response of SOGI-FLL. Figure 12a, shows the step response at the high input frequency compared to the central frequency. and also, Figure 12b, shows the step response at the low input frequency compared to the central frequency. both input frequency can be estimated around the 0.5 s point.

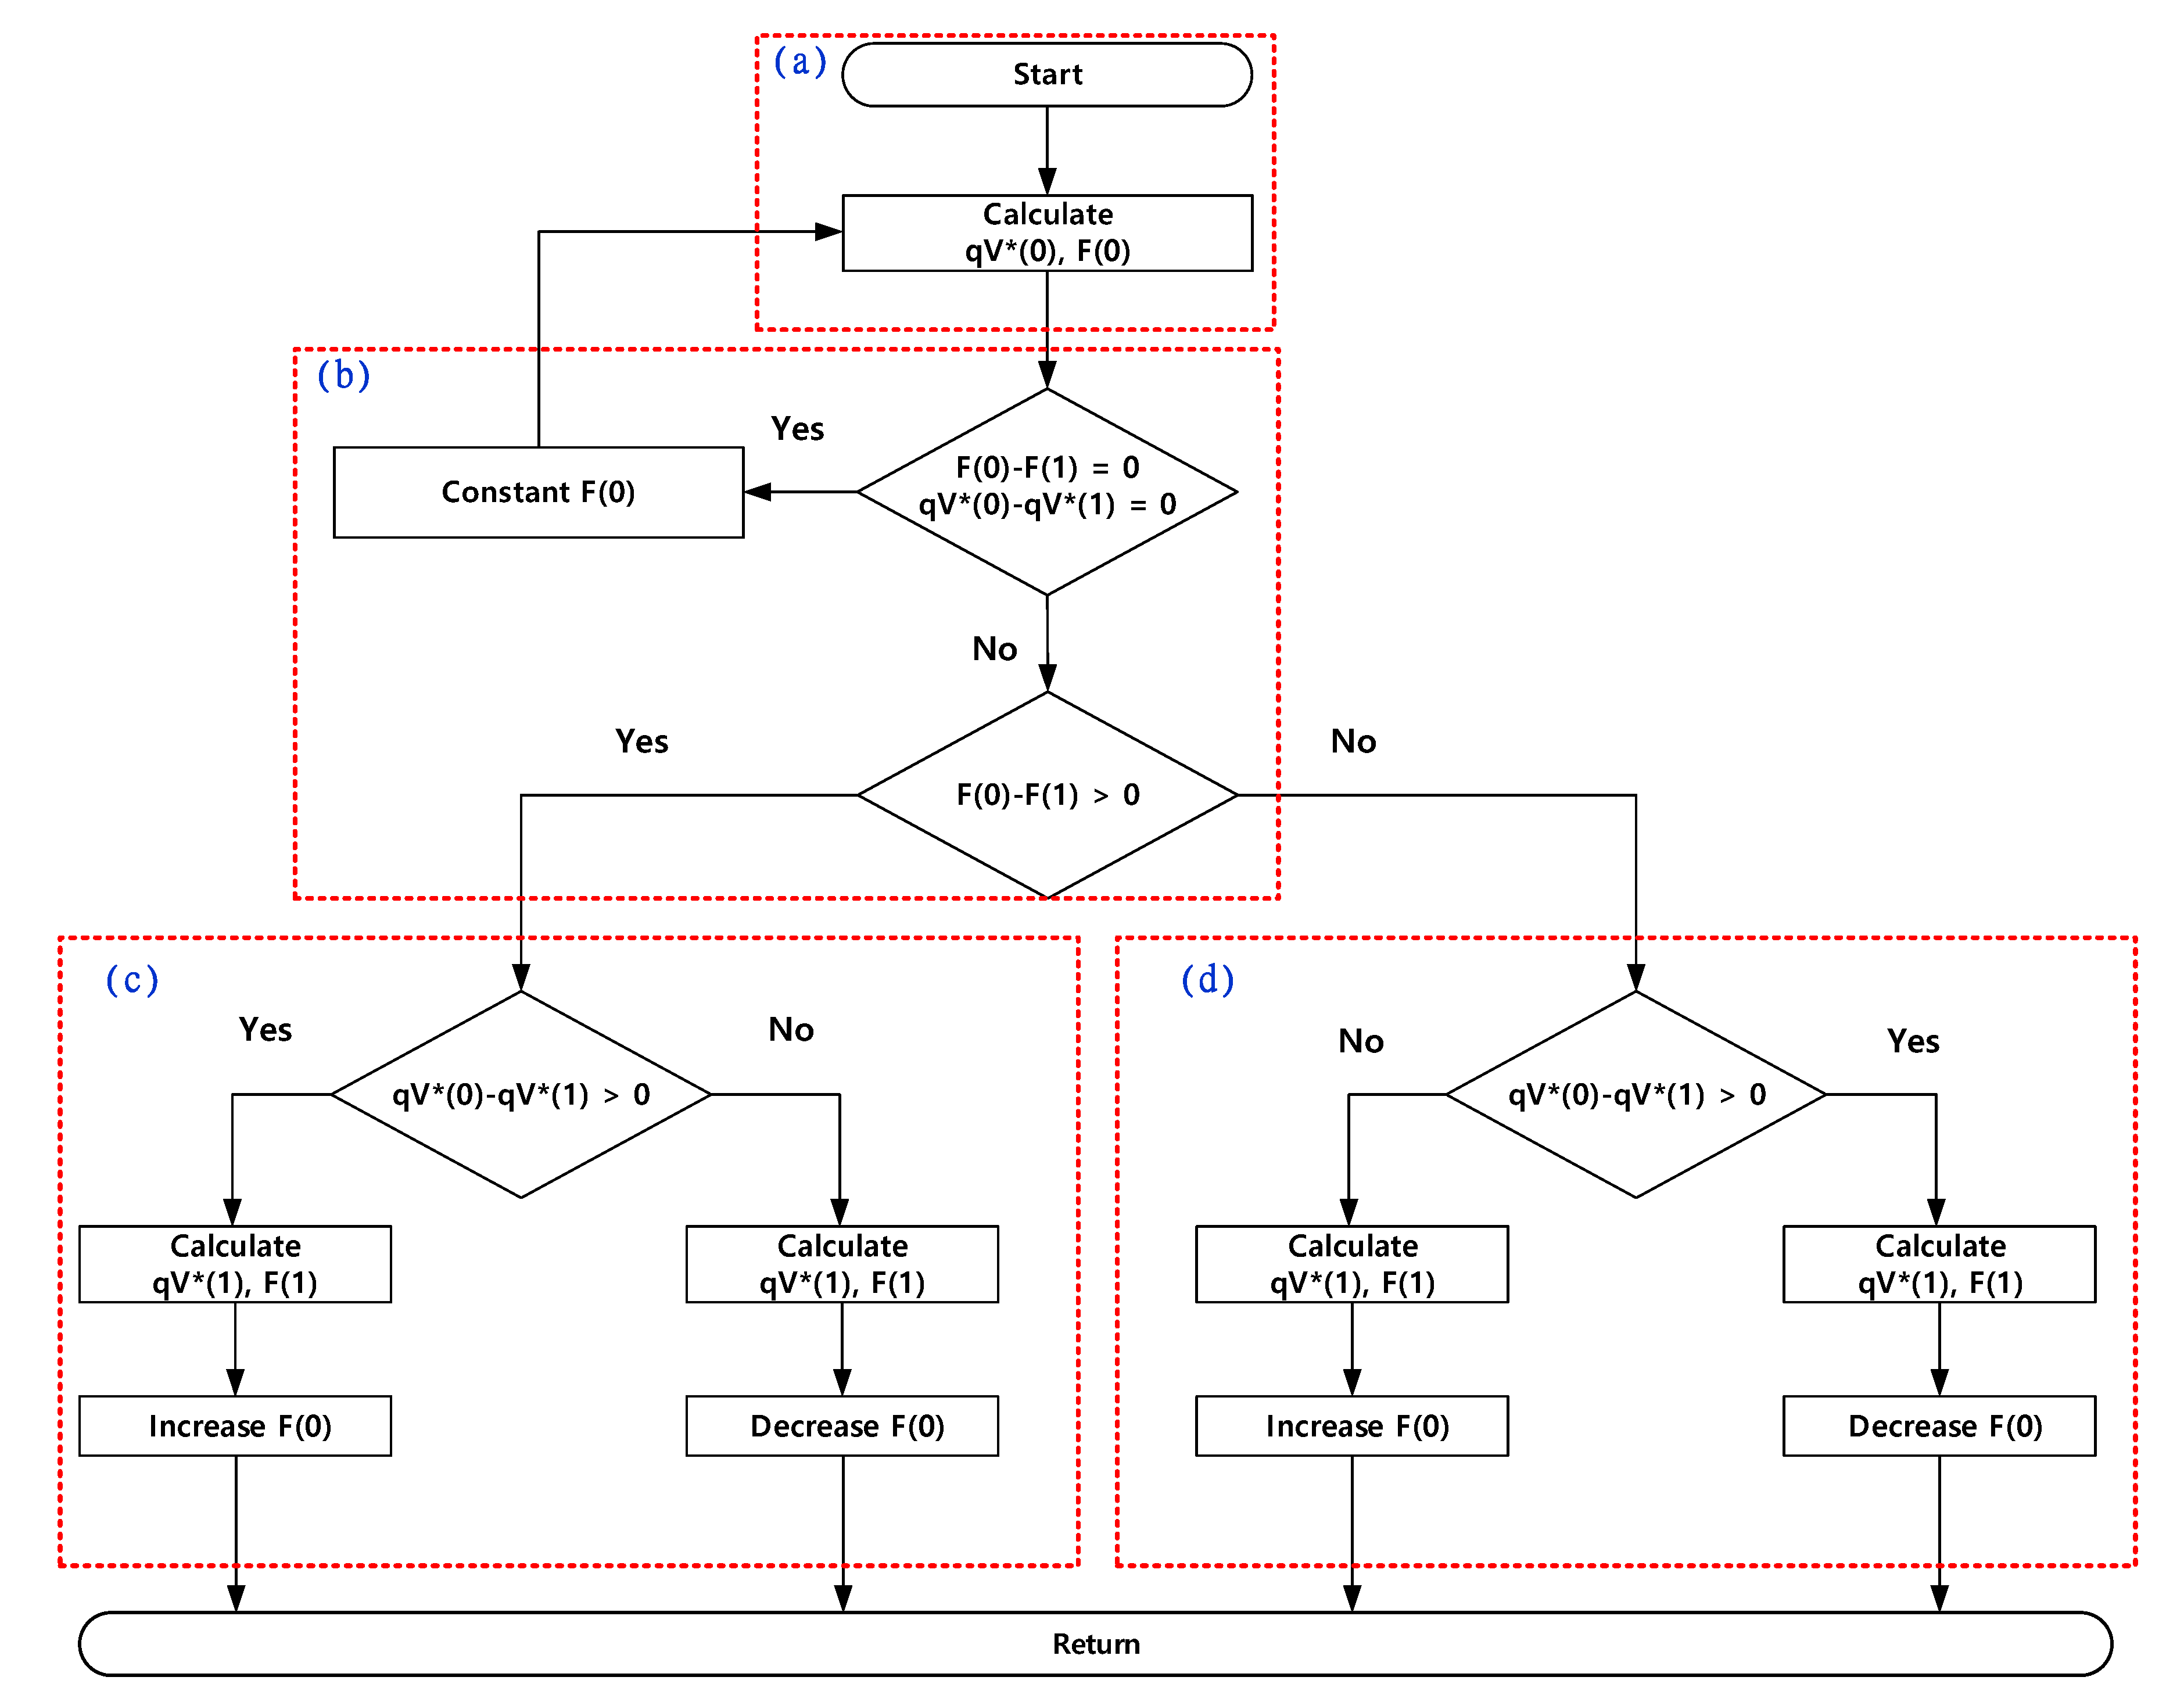
4.3. Proposed Frequency-Tracking Algorithm

The proposed frequency-tracking algorithm operates in ZPA region. To reduce the circulating power and power loss of the WPT system, it has to operate the resonant switching frequency. The ZPA point is the same as the resonant frequency. In case of the WPT system, operating ZVS, ZCS, and ZPA regions are depending on the frequency modulation. The primary current varies depending on the operation of each region. Therefore, to track the ZPA point, it has the maximum primary current compared with the ZVS and ZCS regions. The proposed frequency tracking algorithm is operating stepwise at every switching cycle ( T o = 1 F s ) where, T o is the proposed tracking algorithm operation period. The initial running period is around 0.00001 s. so, it can track the ZPA region quickly.
The proposed frequency-tracking algorithm is shown in Figure 13. The algorithm is divided into four parts such as (a), (b), (c) and (d). and also, the step of algorithm has 3 operations such as (a→b), (a→b→c), (a→b→d). this step is decided by the value of F ( 0 ) , q V * ( 0 ) , F ( 1 ) and q V * ( 1 ) . Where, F ( 0 ) is the present frequency, q V * ( 0 ) is the present primary current, F ( 1 ) is the past frequency and q V * ( 1 ) is the past primary current. and also, the proposed algorithm is calculated by digital controller (TMS320F28335). The calculated switching signal generates a PFM signal through a digital controller, and the PFM signal is transmitted to the DC-chopper circuit.
(a) Calculate the present frequency ( F ( 0 ) ) and the present primary current ( q V * ( 0 ) )
Save and calculate the present frequency F ( 0 ) and the present primary current q V * ( 0 ) calculated through SOGI-FLL
(b) Compare the F ( 0 ) and q V * ( 0 ) with the past frequency F ( 1 ) and the past primary current q V * ( 1 )
Compare with the present ( F ( 0 ) , q V * (0)) and the past ( F ( 1 ) , q V * (1)) data. If the data are the same, the present operating frequency is maintained. Otherwise, the current frequency is compared with the past frequency F ( 1 ) to move to the next operation.
(c) Identify the present operating frequency region ( F ( 0 ) > F ( 1 ) ).
  q V * ( 0 ) > q V * ( 1 ) ZCS   Region F ( 0 )   increase     q V * ( 0 ) < q V * ( 1 ) ZVS   Region F ( 0 )   decrease
By comparing the F ( 0 ) with F ( 1 ) , changeable frequency control can be identified. The F ( 0 ) is higher than the F ( 1 ) means that the frequency has been increased. After increasing the frequency, ZVS and ZCS operation can be estimated from the q V * (0) and q V * (1).
If the q V * (0) is larger than the q V * (1), it can estimate to operate the ZCS region. And the phase can be shifted by increasing the frequency. The F ( 1 ) and q V * (1) are measured before the frequency increases or decreases, and the F ( 0 ) and q V * ( 0 ) are calculated after the increasing or decreasing.
(d) Identify the current operating frequency region ( F ( 0 ) < F ( 1 ) ).
  q V * ( 0 ) < q V * ( 1 ) ZCS   Region F ( 0 )   increase     q V * ( 0 ) > q V * ( 1 ) ZVS   Region F ( 0 )   decrease
By comparing the F ( 0 ) with F ( 1 ) , changeable frequency control can be identified. The F ( 0 ) is smaller than the F ( 1 ) means that the frequency has been decreased. After decreasing the frequency, ZVS and ZCS operation can estimate from the q V * ( 0 ) and q V * ( 1 ) . If the q V * (0) is larger than the q V * (1), it can estimate operating the ZVS region, and the phase can be shifted to the decreasing frequency. If not, it can estimate operating the ZCS region. The F ( 1 ) and q V * ( 1 ) is measured before the frequency increasing or decreasing, and the F ( 0 ) and q V * ( 0 ) is calculated after increasing or decreasing.

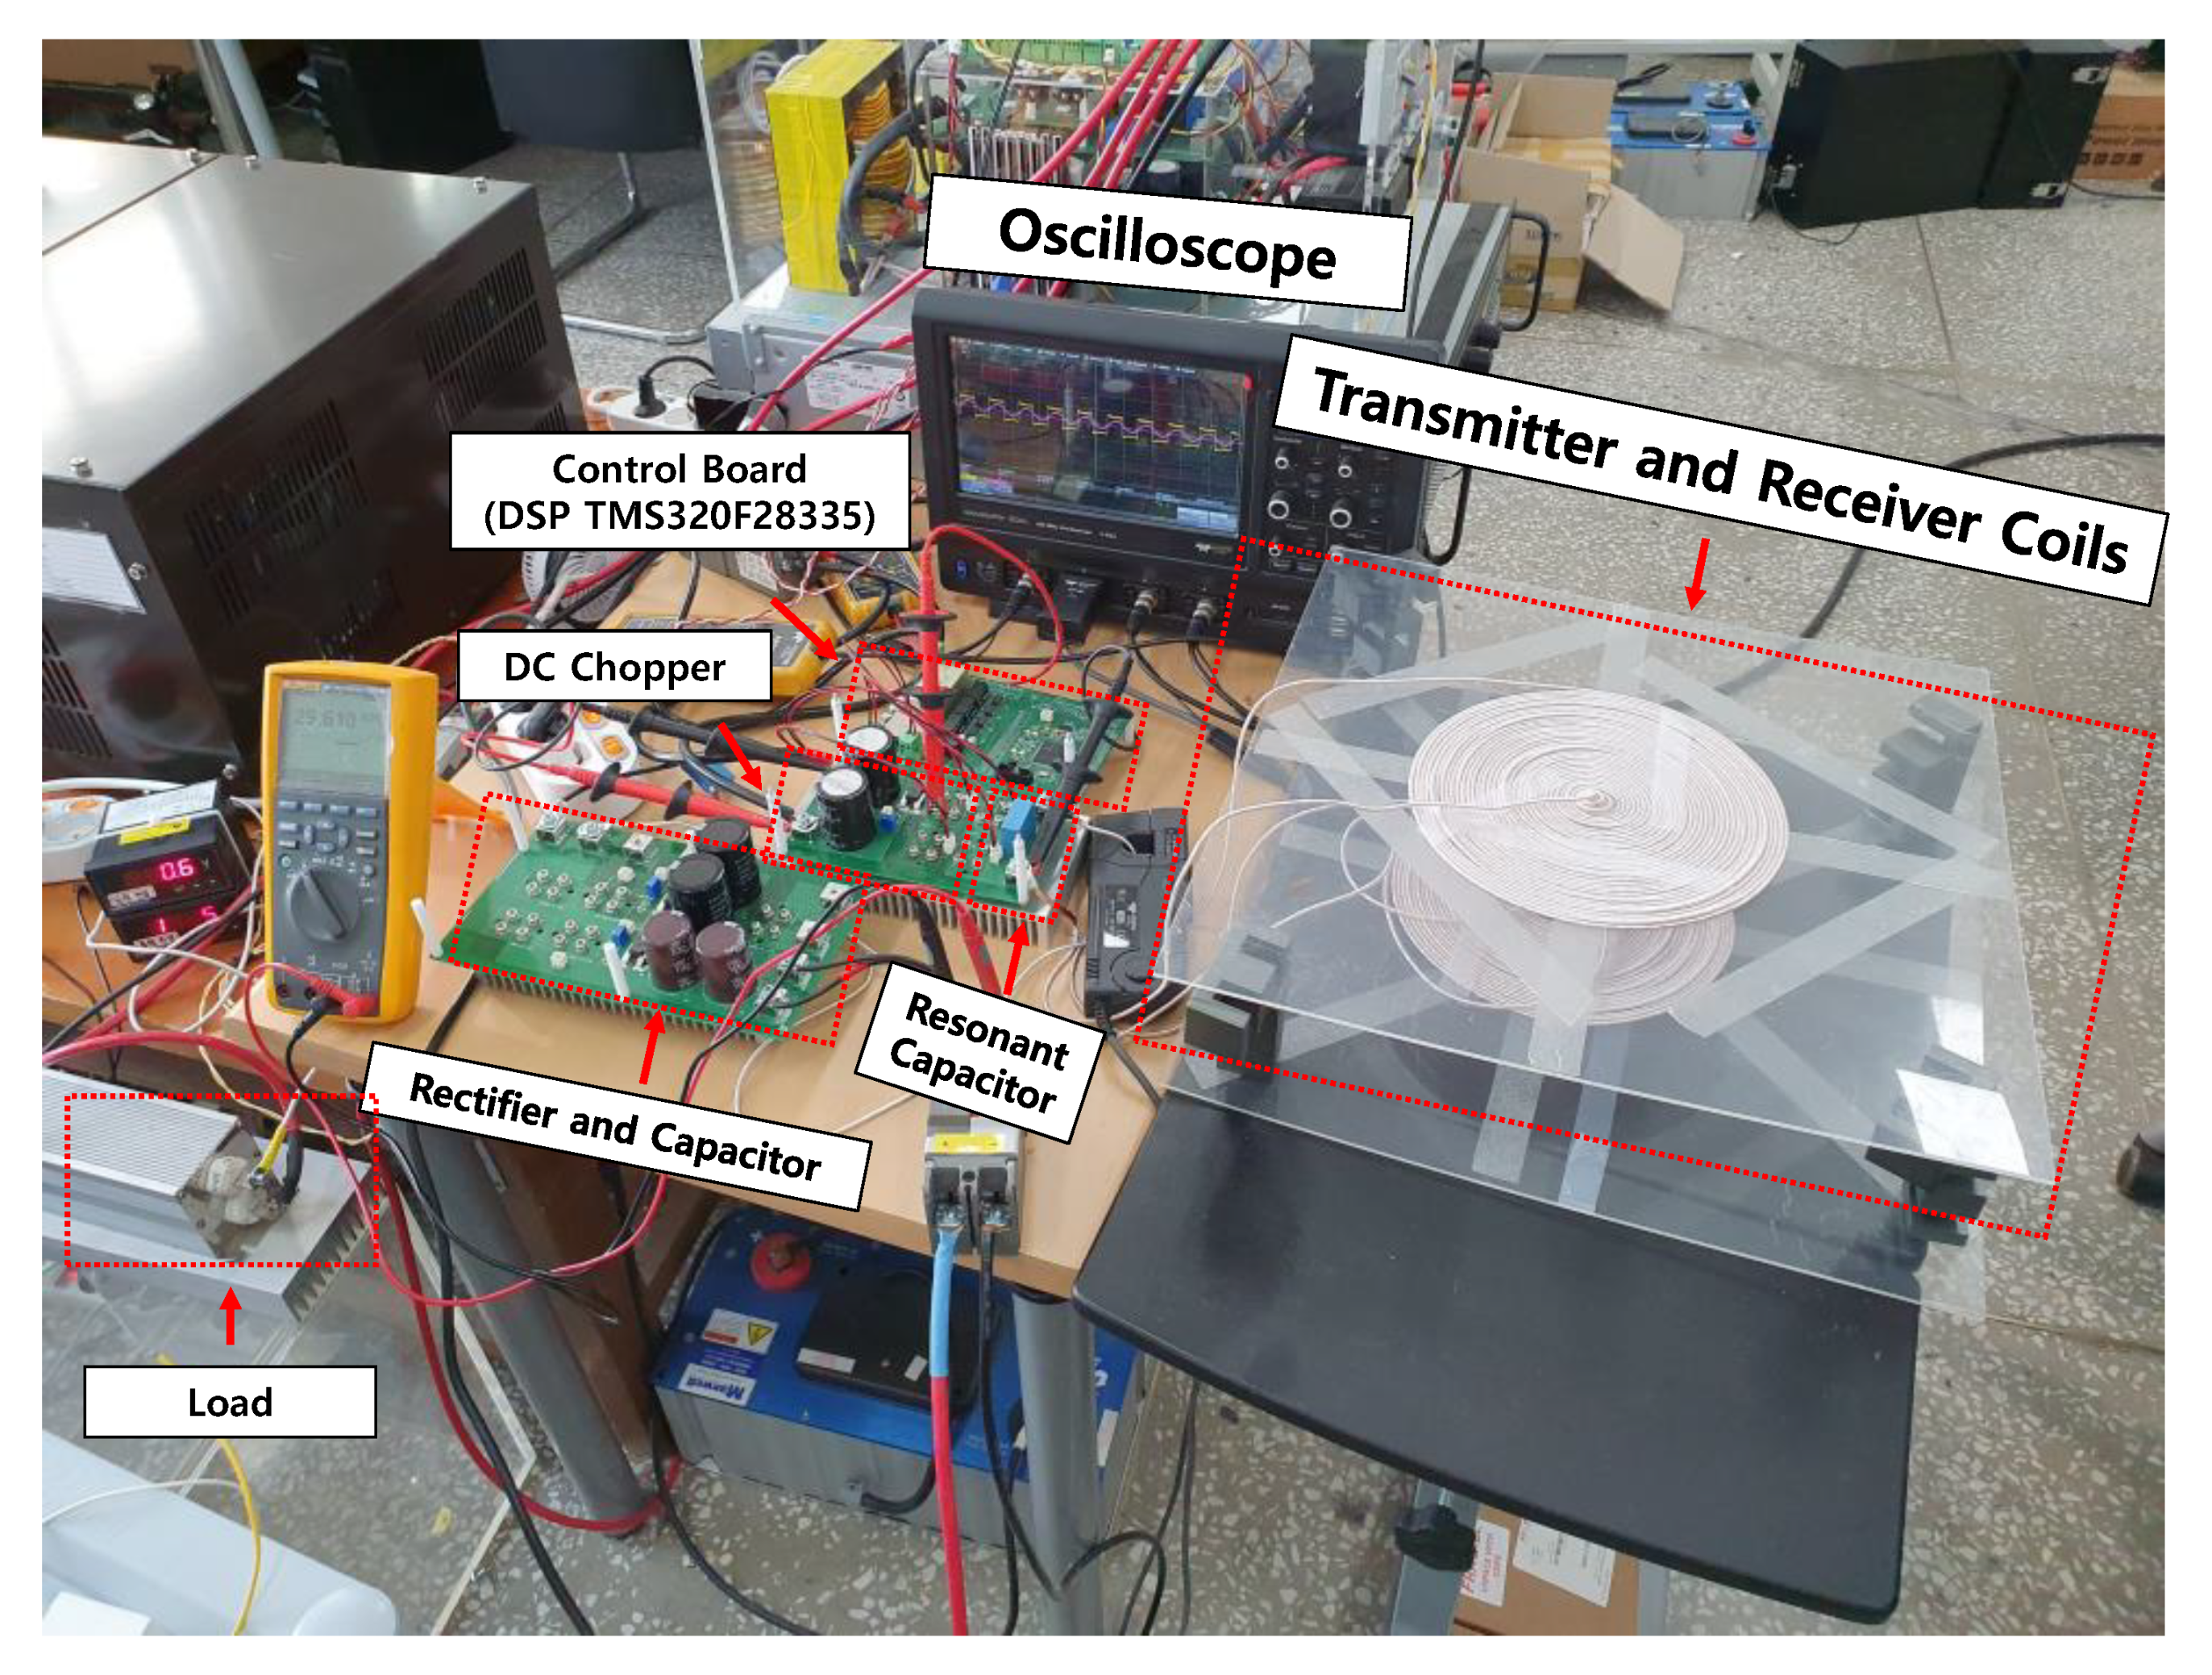
5. Experimental Set-Up

Figure 14 shows the experimental set-up of the proposed WPT system. It consists of control board, DC-chopper, transmitter and receiver coils, rectifier and capacitor, resonant capacitor, load and oscilloscope. The WPT system is designed to reduce the magnetic inductance. So, primary and secondary coil is designed by 1:1 ratio and spiral type. The proposed coils have same size and structure. Table 1 shows the specifications of the proposed WPT system parameter in Figure 14.

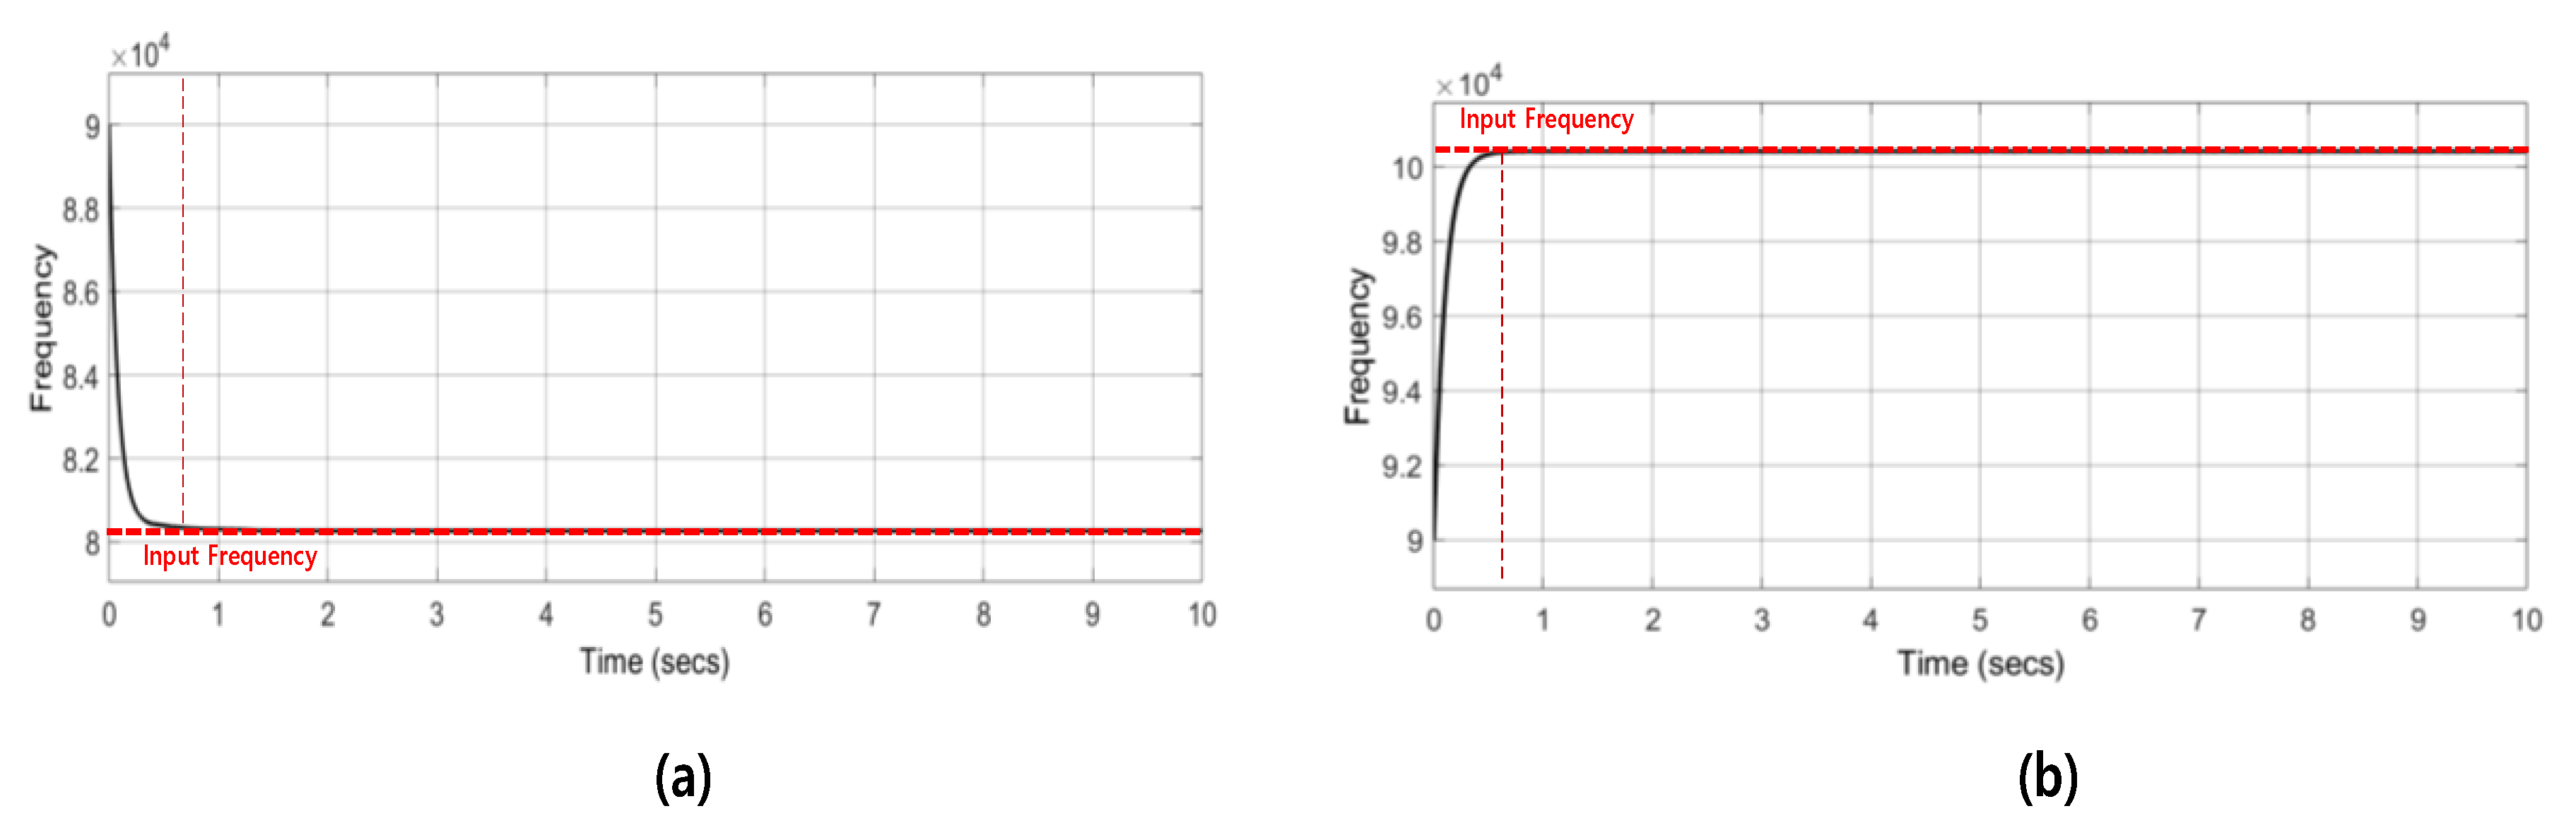
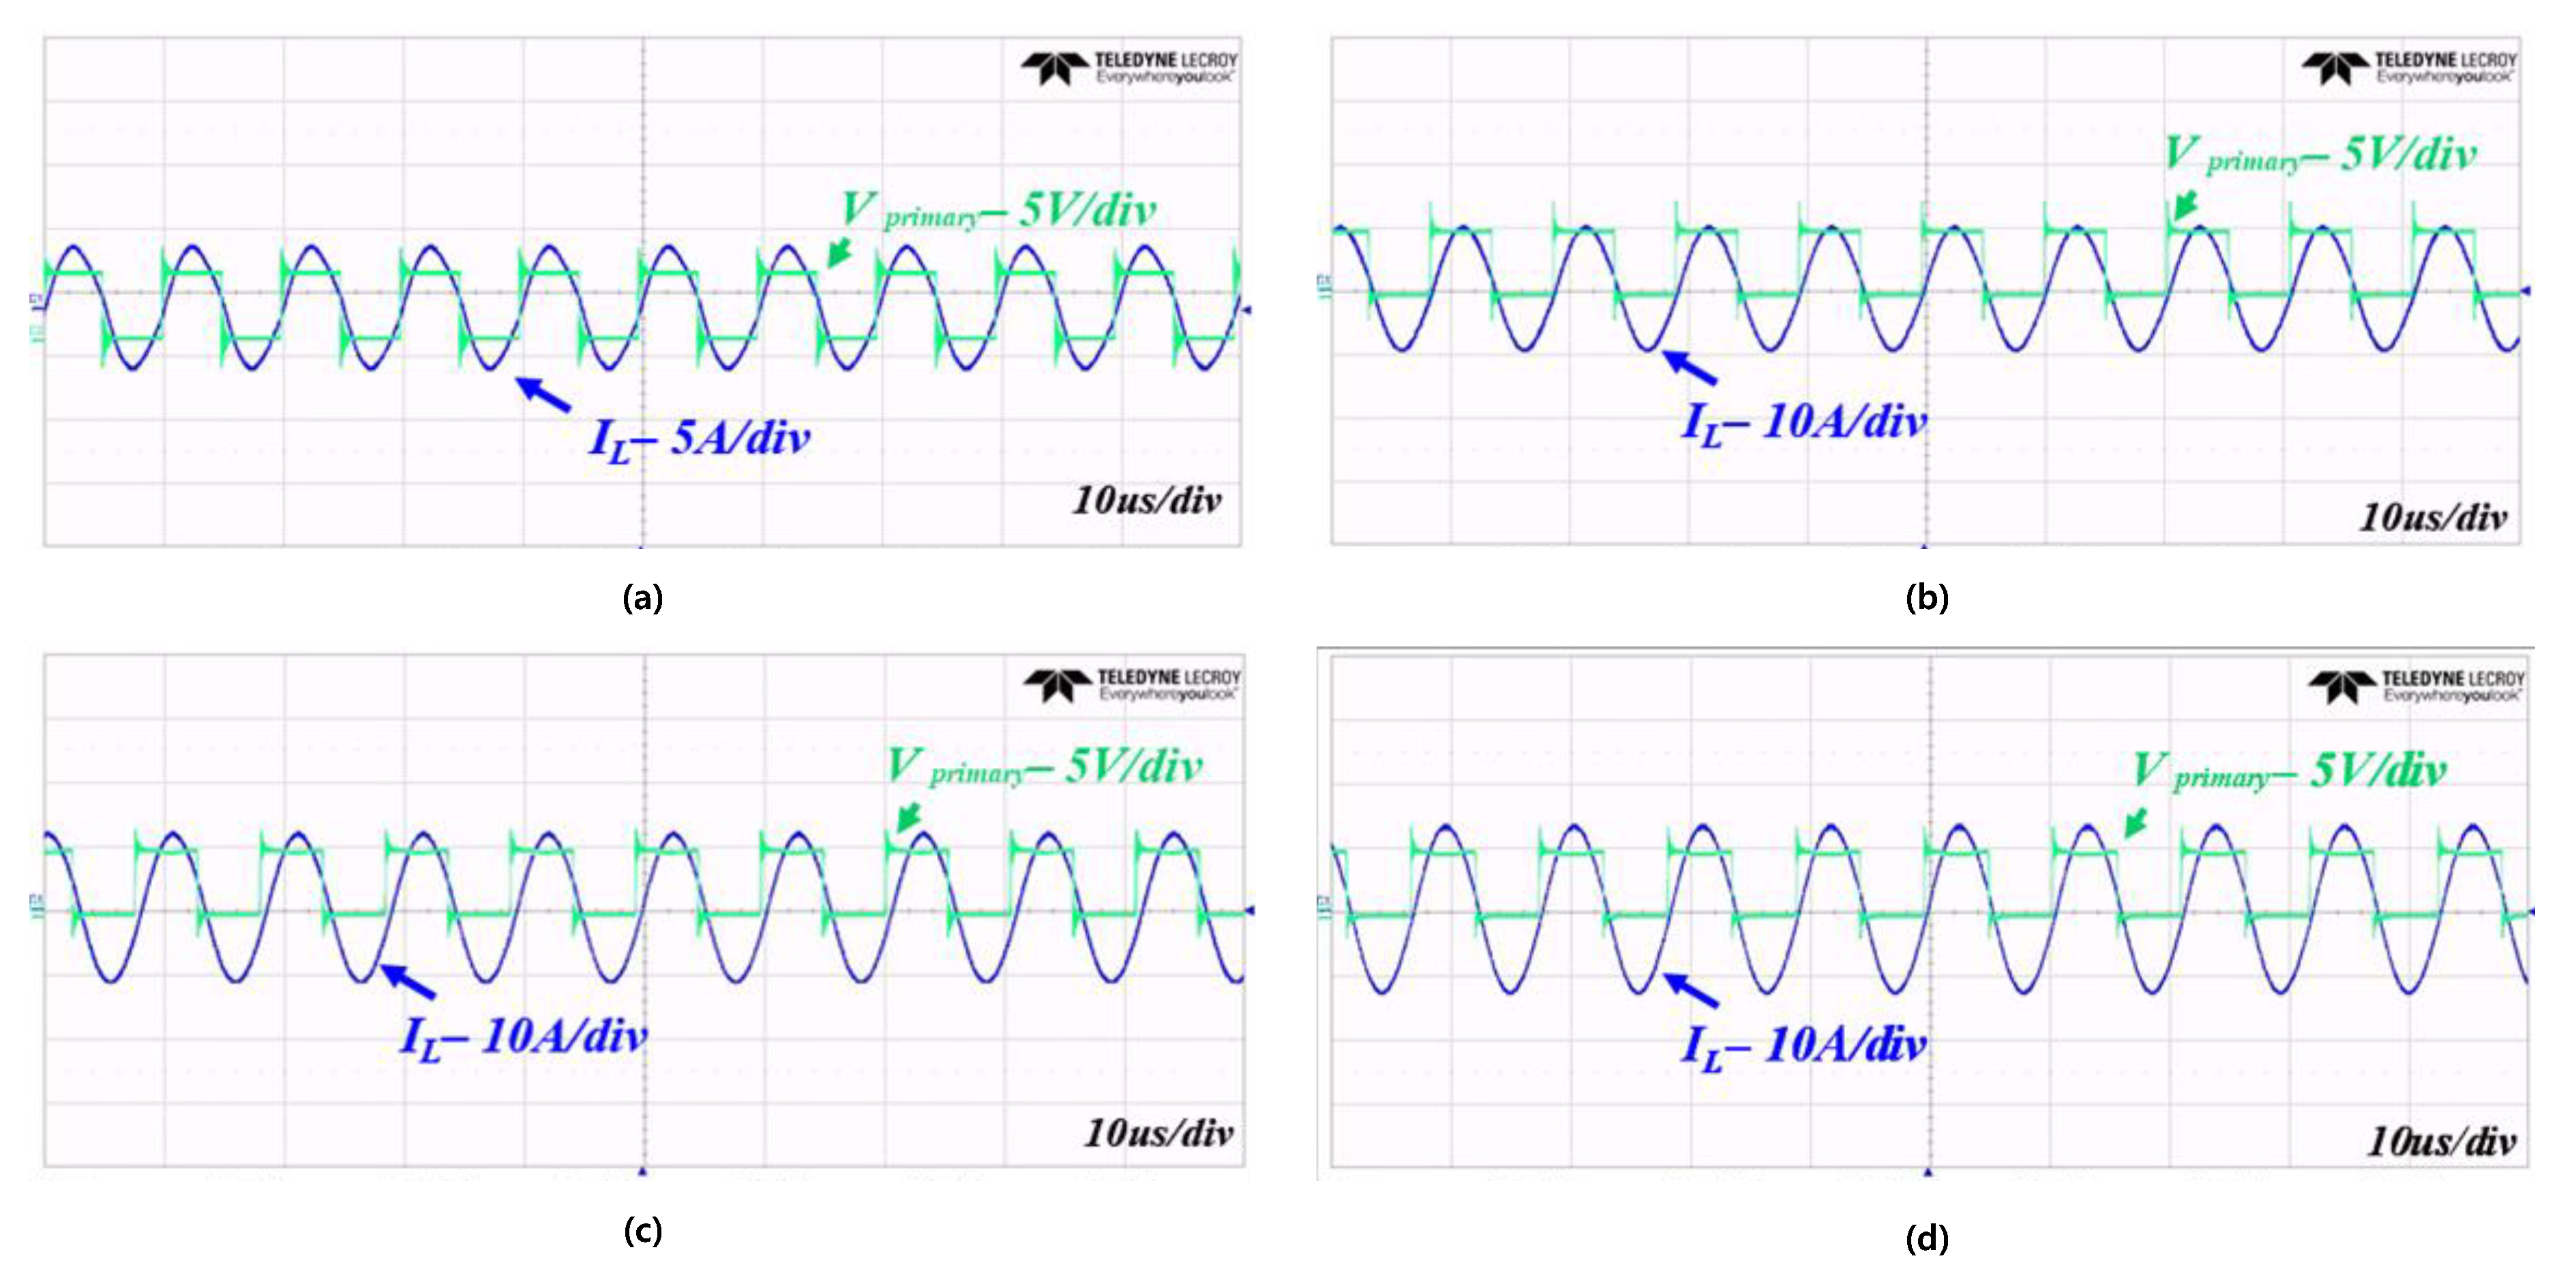
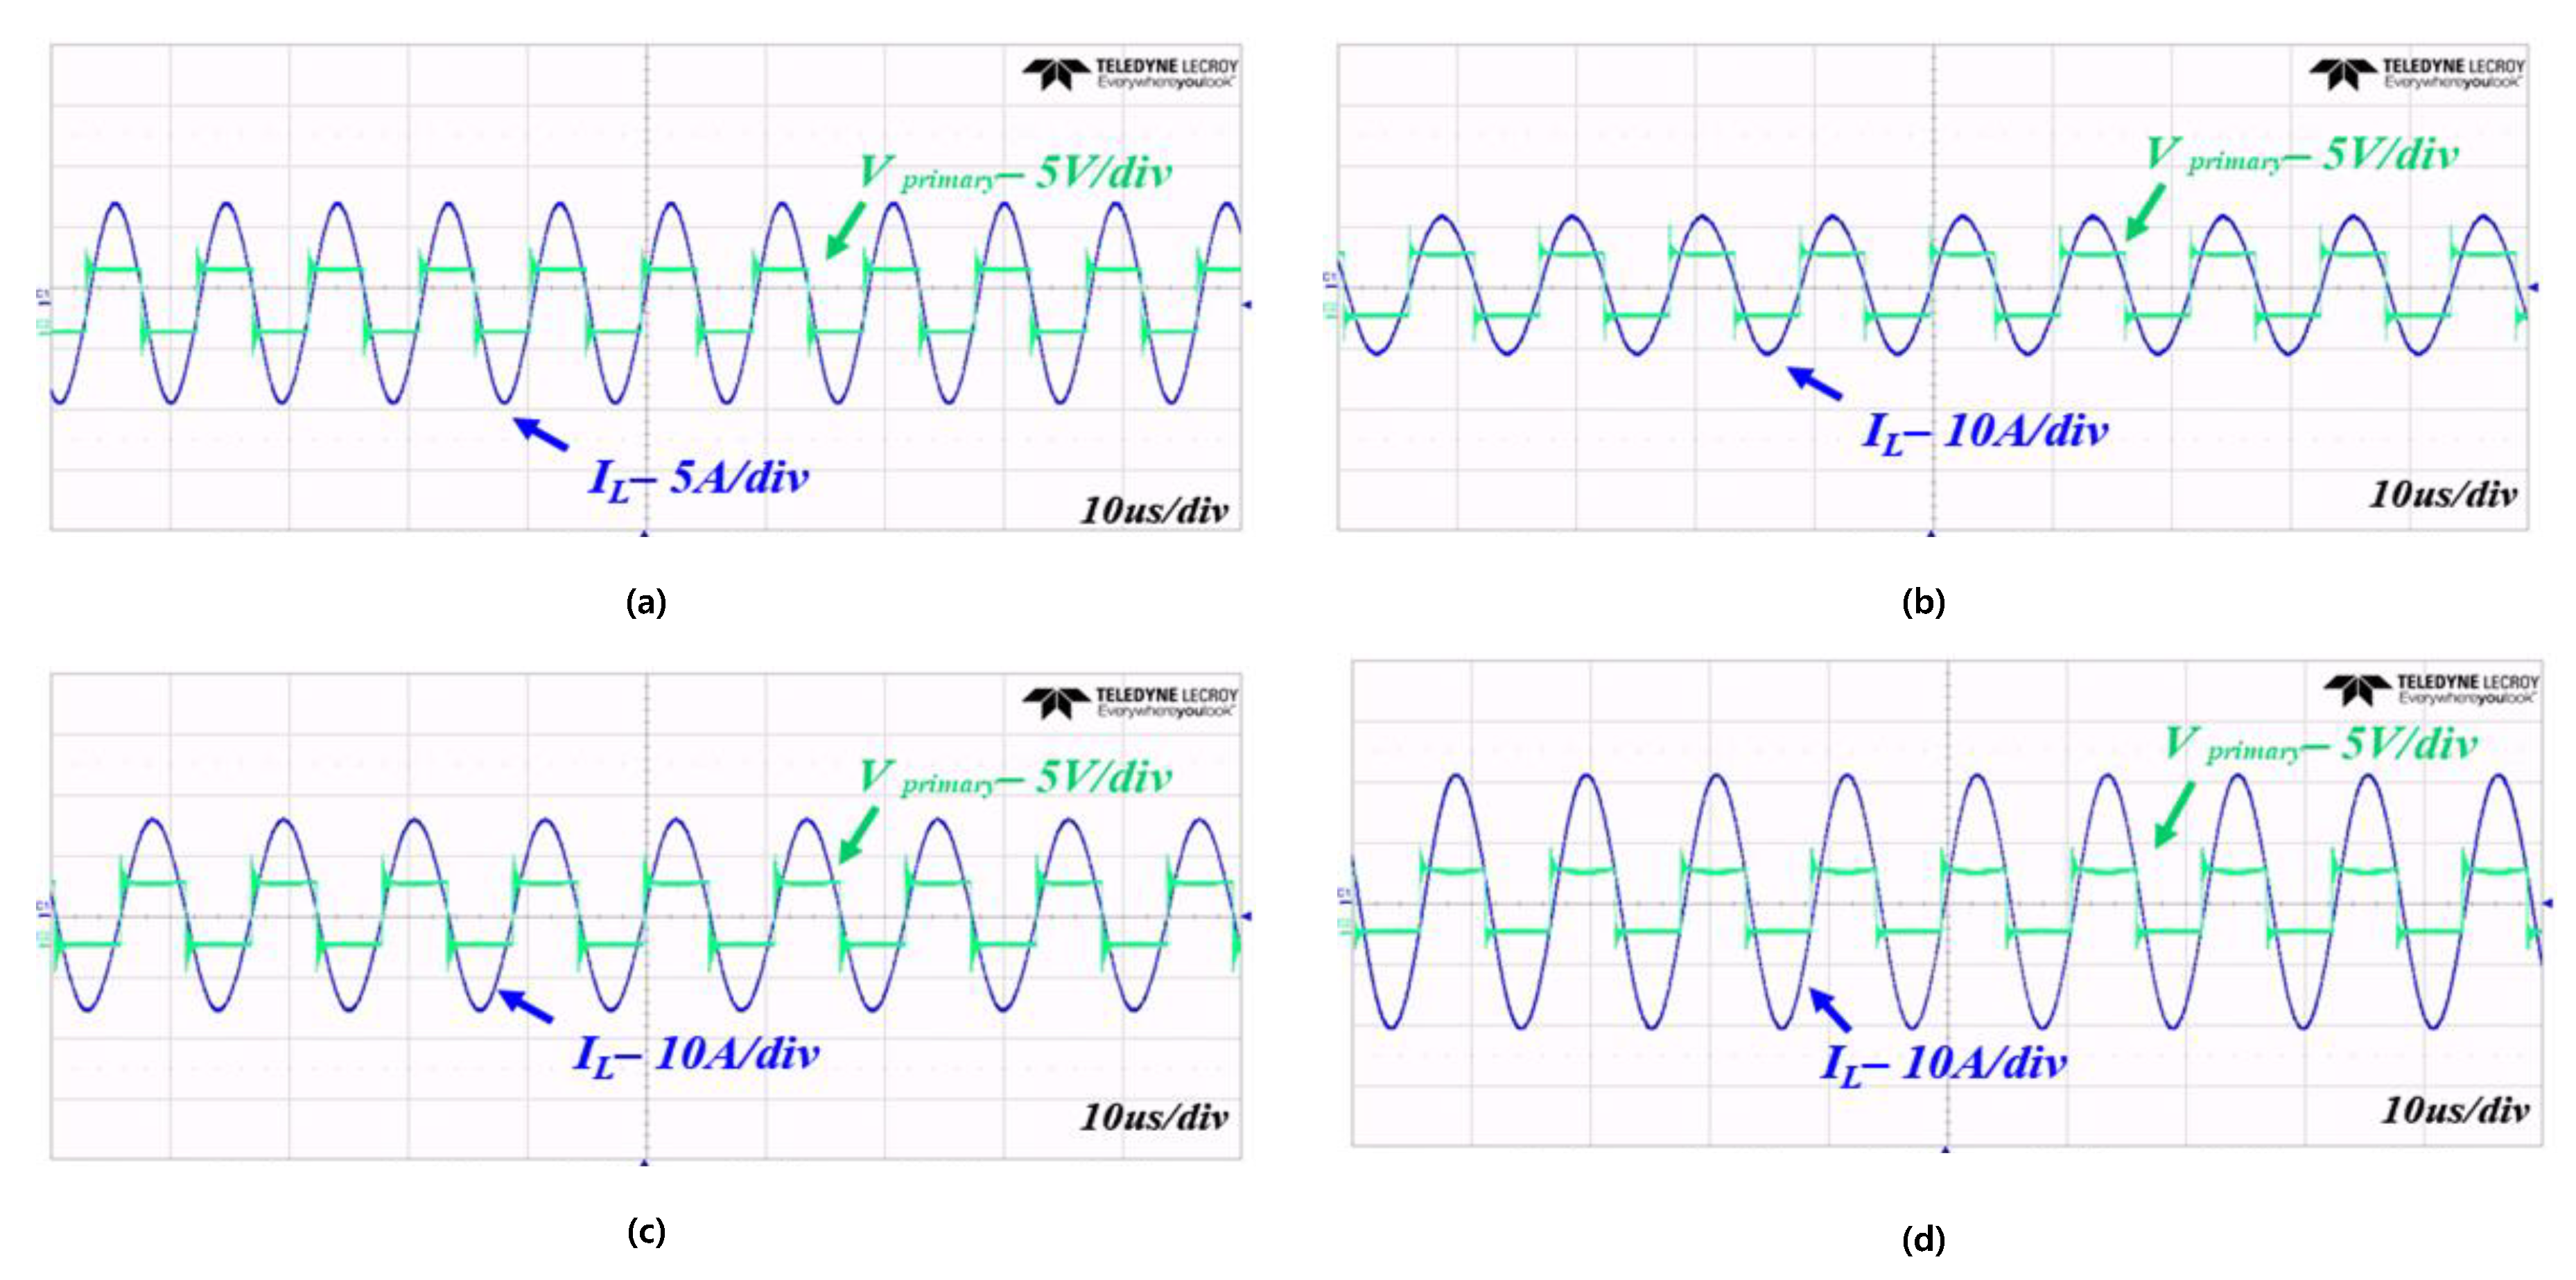
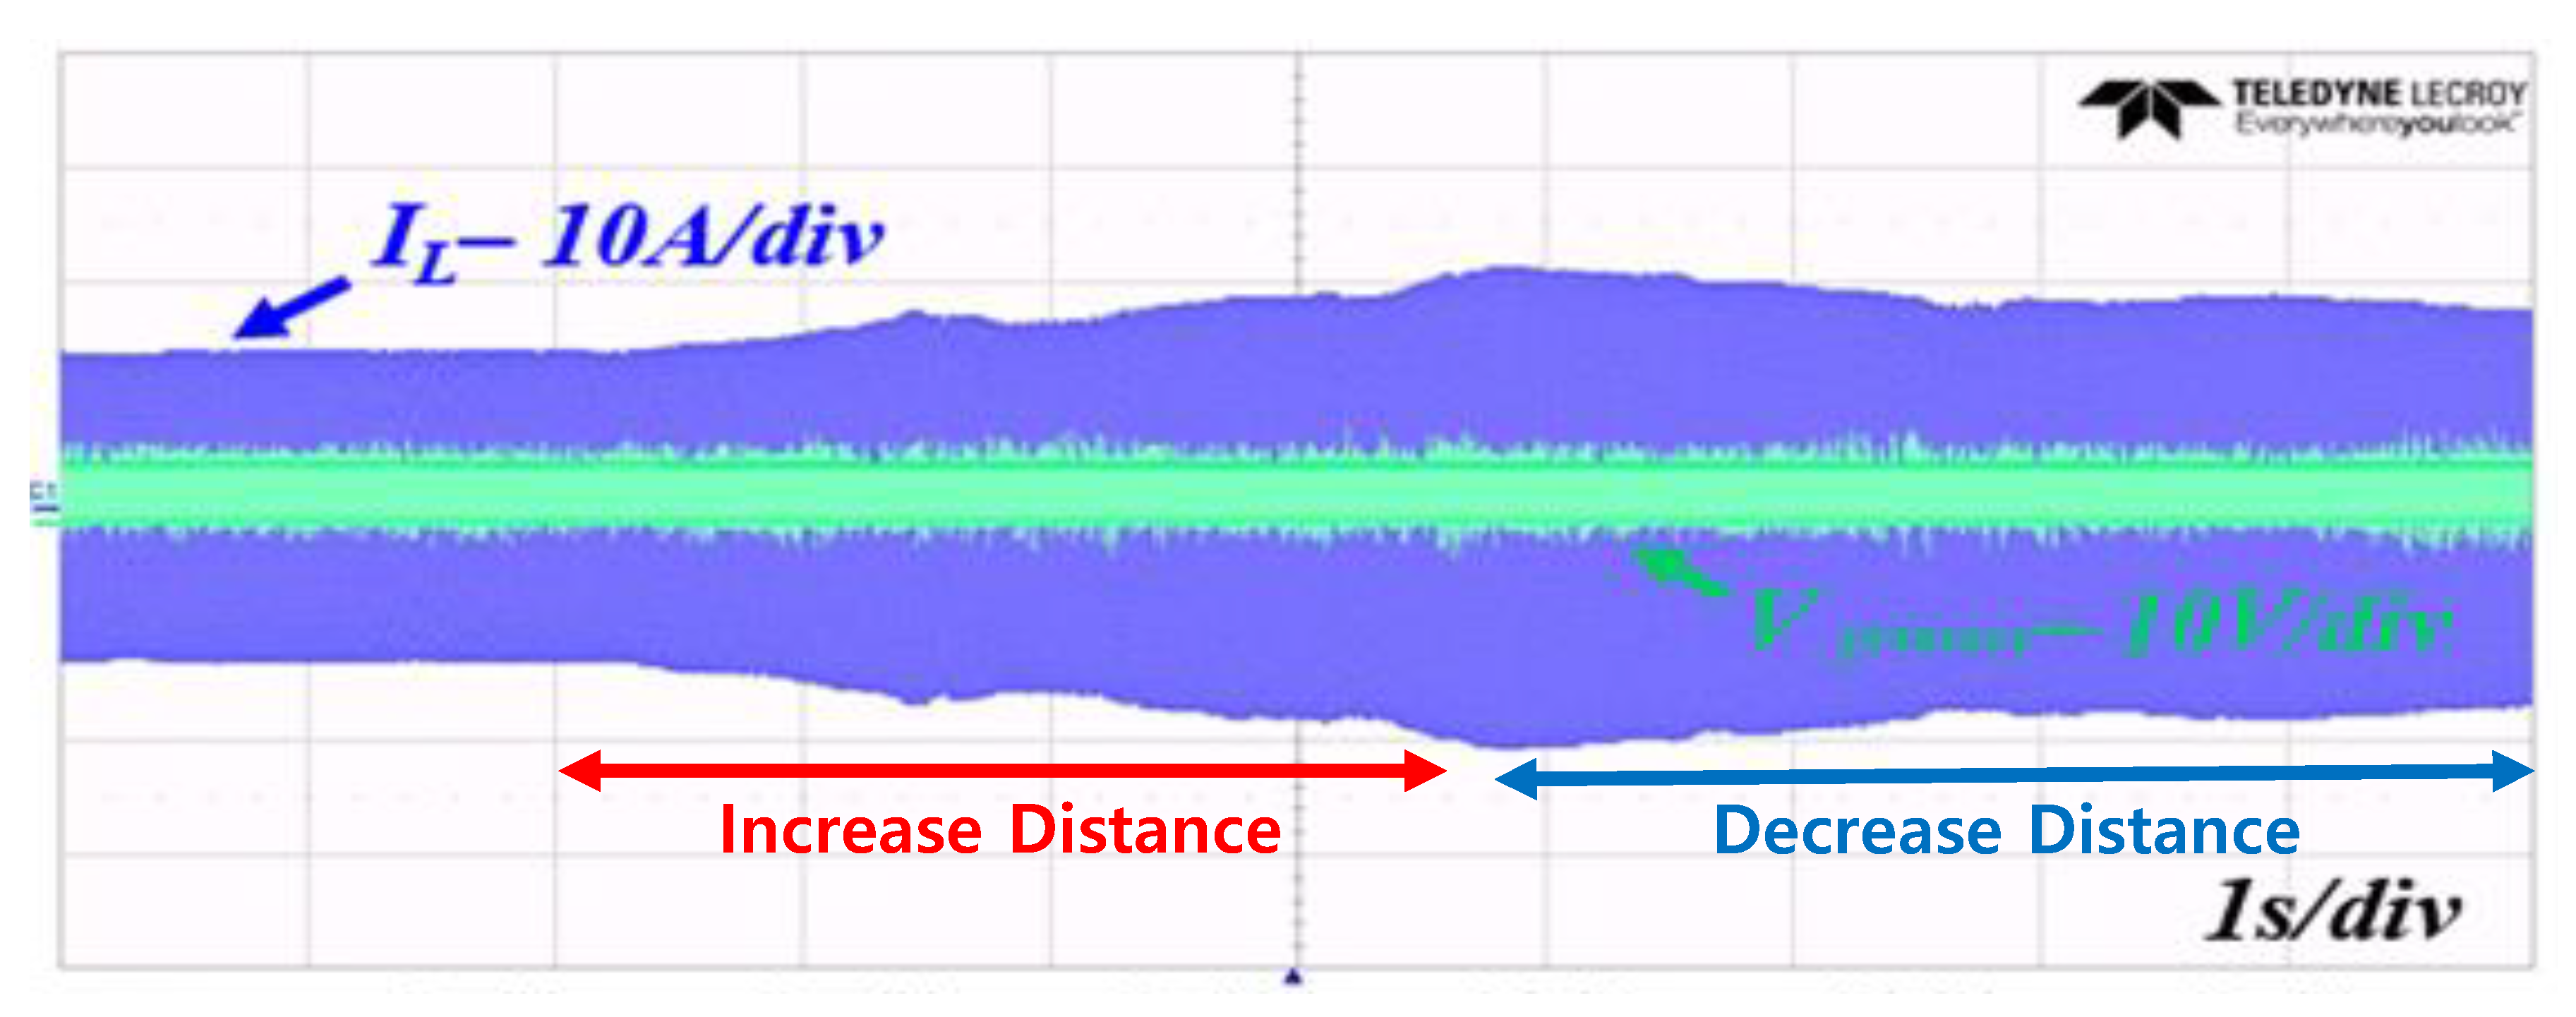
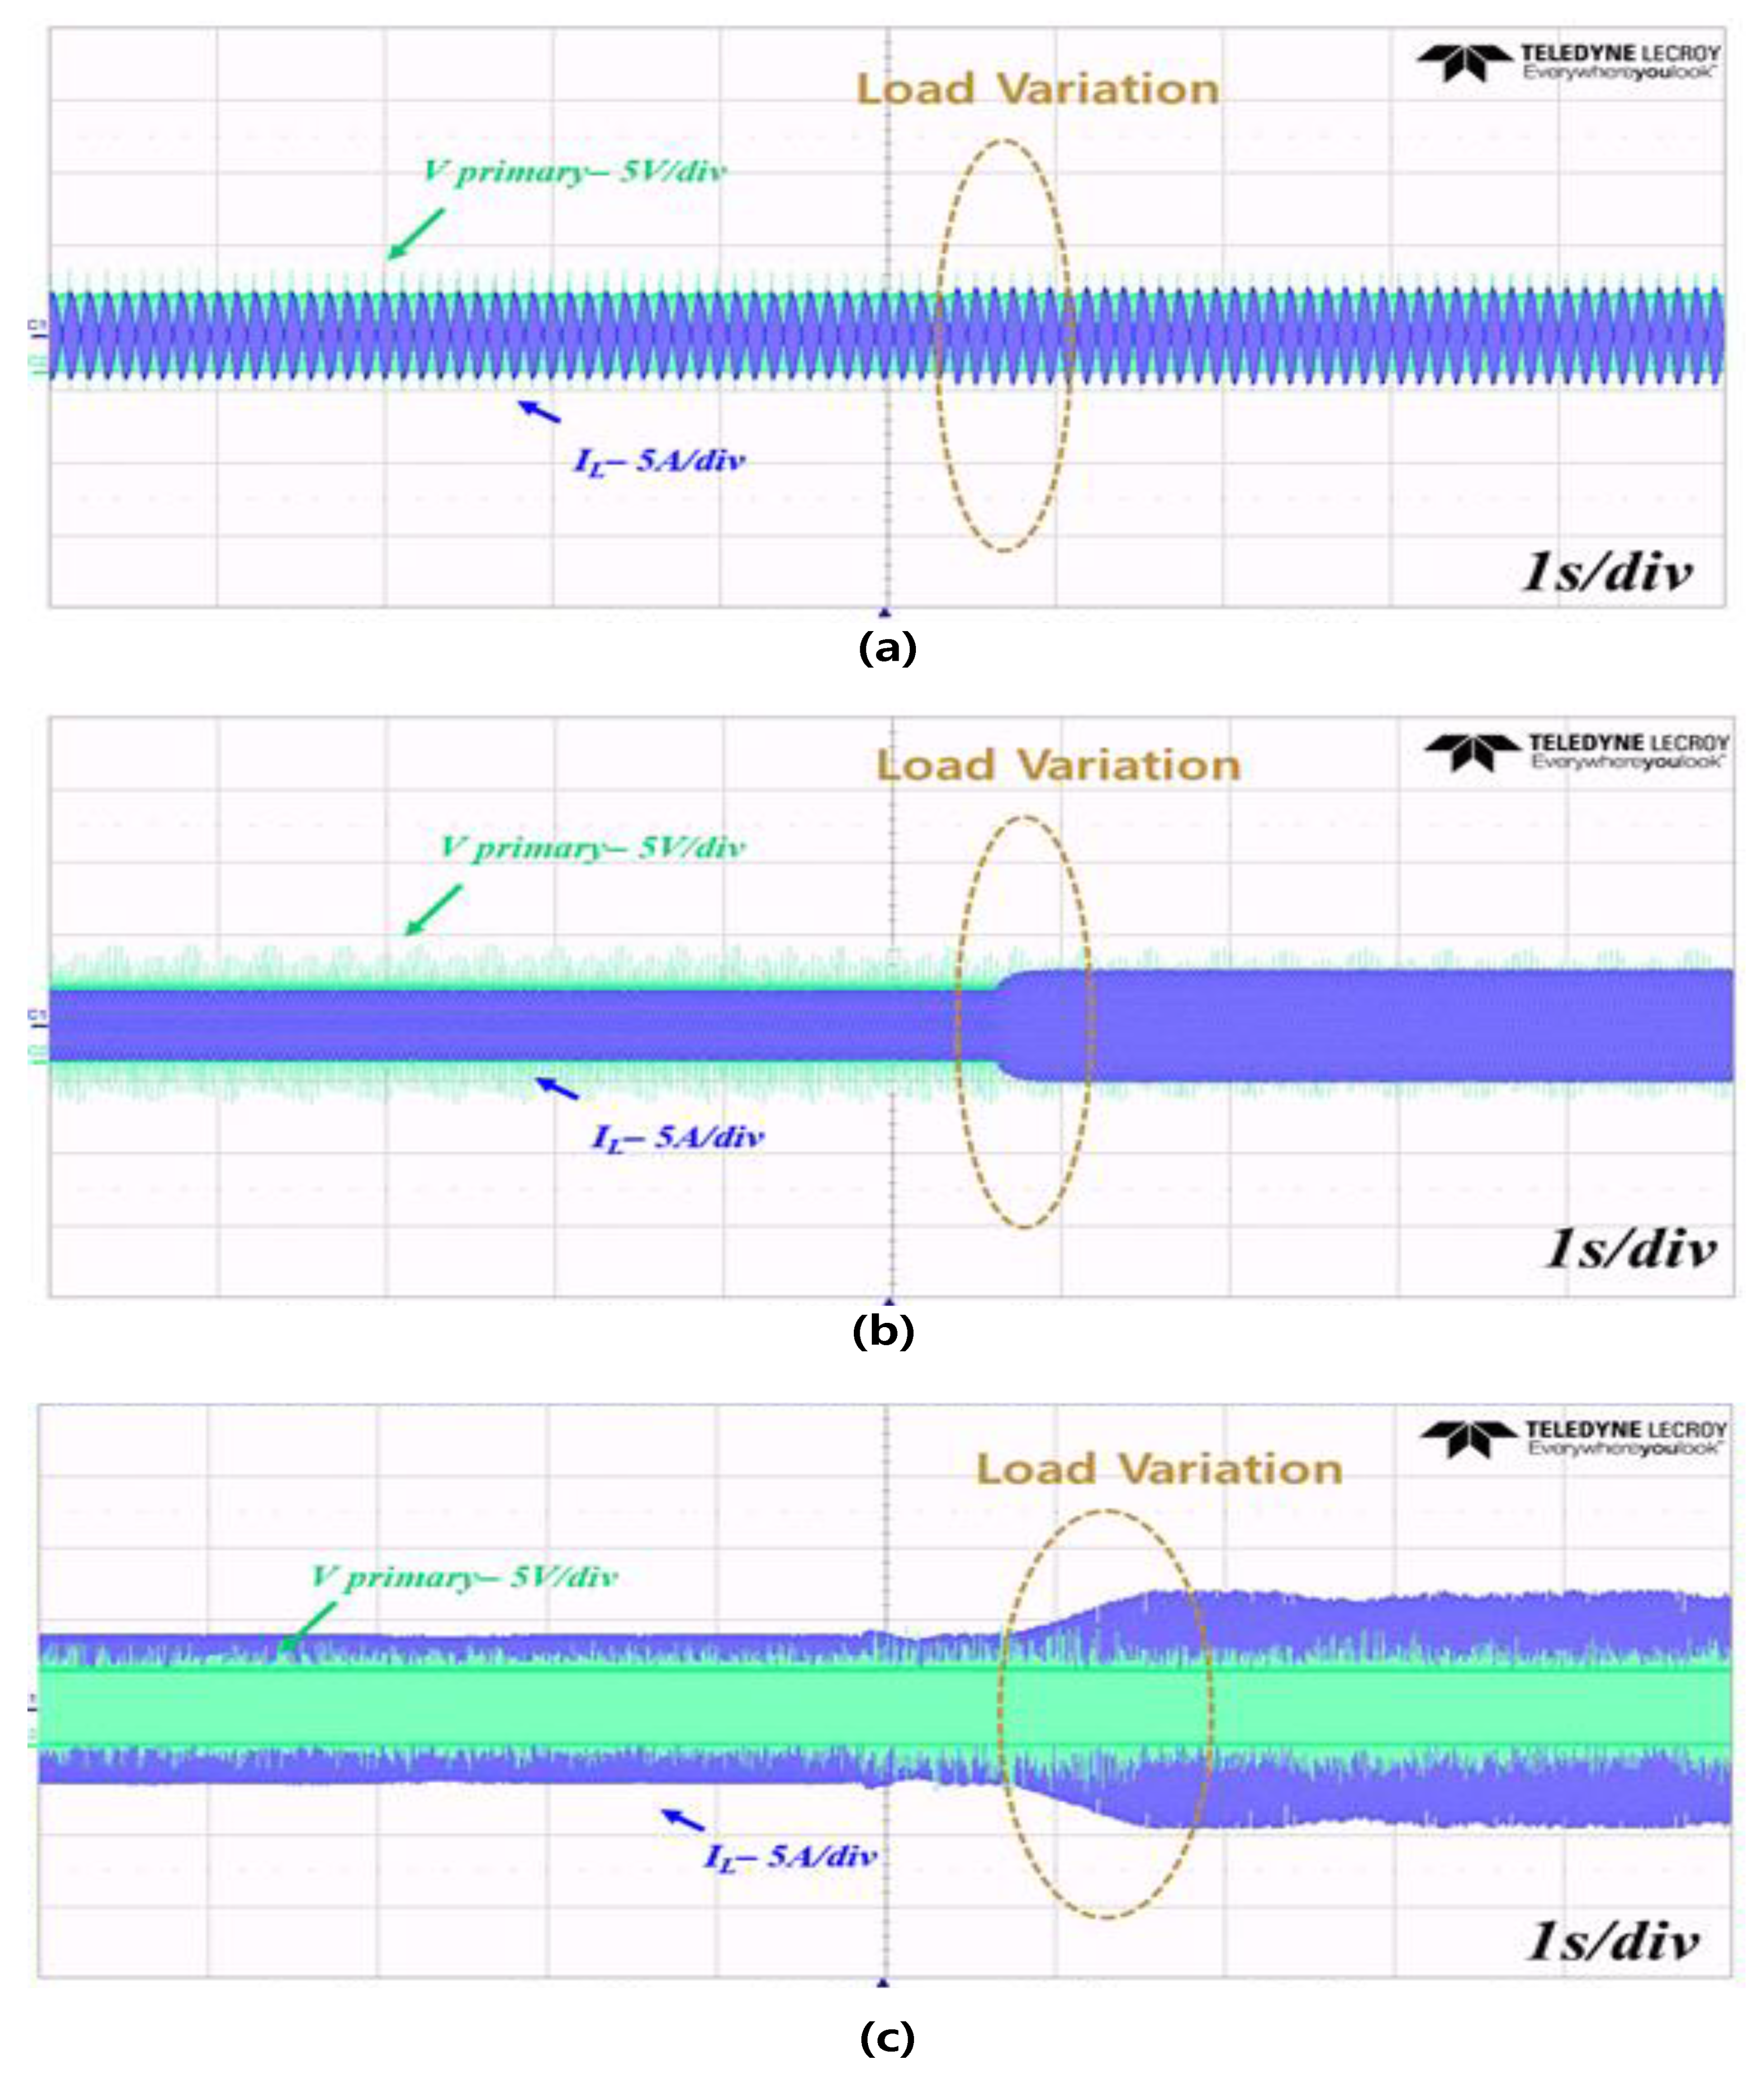
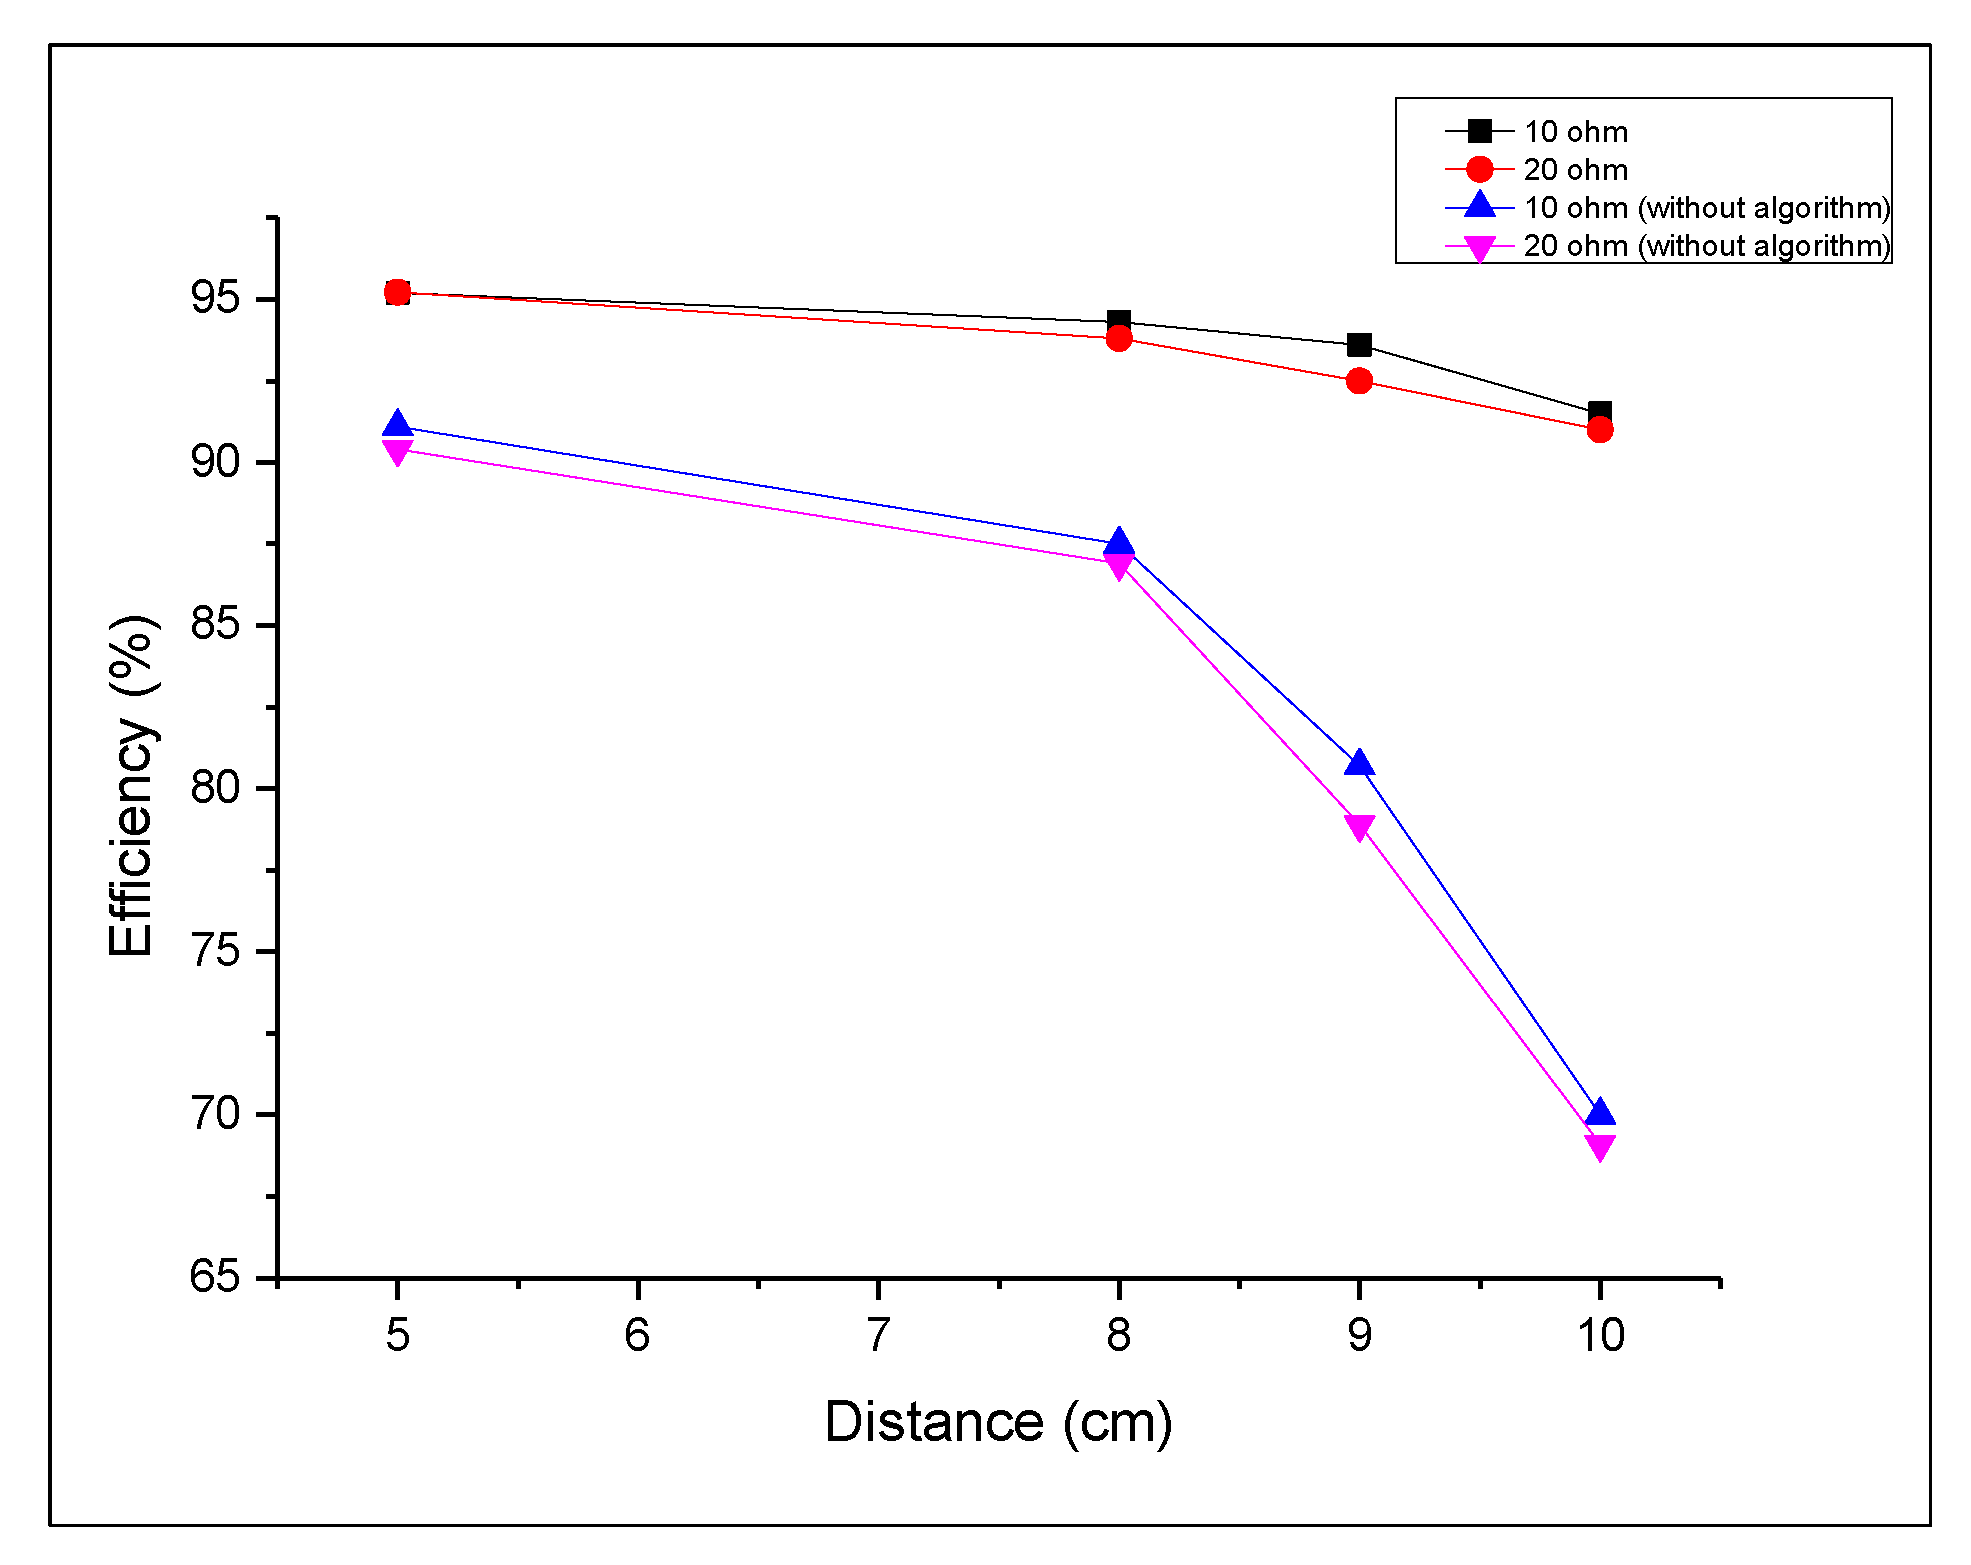
6. Experimental Results

Figure 15 shows the primary voltage and current waveforms of the WPT system. The experiment shows the operating waveform on the fluctuation of the distance between the transmitter and receiver coils at the same load. When the distance between the transmitting and the receiving coils is changing, the ZPA point also changes according to the variation of the coupling coefficient (k). Figure 14 shows the ZPA operation according the changeable distance.
In addition, the variation of the coupling factor shows the variation distance. The coupling factor decreases as the increasing distance. Therefore, the voltage gain increases as the decreasing coupling coefficient due to the resonance characteristics of the SS topology. Comparing with the IL (primary current) waveforms of Figure 15a–d, we can confirm that the current waveform increases as the increasing distance due to the variation of the voltage gain.
Figure 16a–d shows the primary voltage and current waveforms of the WPT system. The experiment shows the operating waveform on the fluctuation of the distance between the transmitter and receiver coils at 20-ohm load. Compared to Figure 15, the experiment carries out by changing only the load in the same coupling factor. As the load changes, Figure 16 shows the low Q factor (Quality factor = ω o L p / R o ) compared with Figure 15. The changeable Q factor has a changeable voltage gain. Therefore, Figure 16 shows the high voltage gain compared with Figure 15. Therefore, the primary current is increased. We can confirm that it operates by the following ZPA point even though the changeable load.
Figure 17 shows the changeable primary current as the increasing distance and decreasing distance during ZPA operation. The power transmission shows ZPA operation even though the changeable distance or a changeable load through the proposed SOGI-FLL based frequency tracking algorithm. According to the ZPA operation, we can transmit energy with maximum power and high efficiency.
Figure 18 shows the primary current and voltage waveforms as the load fluctuates at a distance of 5 cm. Figure 18a,b shows the waveforms according to the load fluctuation without the algorithm. Figure 18a,b shows the operating ZVS and ZCS region. The experimental results show that if the WPT system does not perform in ZPA operation, the circulating power is increasing and the power transmission is not enough. ZPA operation reduces this circulating power. Figure 18c shows ZPA operations through the proposed frequency-tracking algorithm to reduce circulating power. We prove that the power transmission is smooth and has high efficiency due to the reducing circulating power.
Figure 19, shows the efficiency of the WPT system with proposed frequency tracking algorithm and without algorithm, the power conversion efficiency according to the load and the distance. Efficiency is calculated from the DC input voltage, DC input current, the voltage and current delivered to the output load. The input power is ( V d c × I d c ) and the output power can be expressed as ( V o × I o ), where the efficiency is ( V o × I o )/( V d c × I d c ) × 100%.
WPT has a large change in power transmission efficiency according to distance. The short distance has the low coil loss. Therefore, it can minimize the loss of the coils. Both loads at 5 cm have high efficiency of over 95%. In addition, the voltage gain varies depending on the load and distance due to the resonance characteristics. In case of 10 cm, it has similar efficiency. Because the power transmission is high compared with different distance, so there is no significant difference in efficiency.
If the algorithm is not applied, the ZPA operation does not work as the distance increases. Therefore, compensation by the SS topology is not properly performed, and has low efficiency. In that case the proposed algorithm efficiency is 91%–95% and without it the proposed algorithm efficiency is around 70%–91%.

7. Conclusions

We propose the frequency-tracking algorithm for ZPA operation in WPT system. The proposed frequency-tracking algorithm based on SOGI-FLL is tracking in ZPA point. The WPT system hardware consists of the DC chopper, SS topology, rectifier, load and the current sensor. The proposed algorithm can be controlled using one current sensor, and no additional voltage/current sensor is required. We analyze the resonant characteristics according to the changeable distance and load through the experimental results. We prove the changeable coefficient of coupling and the quality factor according to the changeable distance (5–10 cm) and load (10–20 ohm) due to the resonant characteristics, with the changeable voltage gain. In addition, we demonstrate that ZPA operation is maintained even though changeable load and distance. In addition, we can get the high efficiency and maximum power transfer of up to 95%.

Author Contributions

D.-H.K., H.-J.K. conceptualized the idea of this research project. D.-H.K. designed the structure of WPT system. D.-H.K., M.-S.K. designed a PCB board. D.-H.K. developed the frequency-tracking algorithm and DSP program of components. D.-H.K. made an experimental setup and did experiment. The data were analyzed by the team and the paper was written by D.-H.K., H.-J.K. All authors have read and agreed to the published version of the manuscript.

Funding

This research was a part of the project titled ‘Yeongnam Sea Grant’, funded by the Ministry of Oceans and Fisheries, Korea.

Acknowledgments

This research was a part of the project titled ‘Yeongnam Sea Grant’, funded by the Ministry of Oceans and Fisheries, Korea.

Conflicts of Interest

The authors declare no conflicts of interest.

References

  1. Han, L.; Li, L.M. Integrated Wireless Communications and Wireless Power Transfer: An Overview. Phys. Commun. 2017, 25, 555–563. [Google Scholar] [CrossRef]
  2. Garcia, D.T.; Vazque, J.; Roncero, S.P. Design, implementation issues and performance of an inductive power transfer system for electric vehicle chargers with series–series compensation. IET Power Electron. 2015, 8, 1920–1932. [Google Scholar] [CrossRef]
  3. Hui, S.Y.R.; Ho, W.C. A new generation of universal contactless battery charging platform for portable consumer electronic equipment. IEEE Trans. Power Electron. 2005, 20, 620–627. [Google Scholar] [CrossRef]
  4. Campi, T.; Cruciani, S.; Maradei, F.; Feliziani, M. Near Field reduction in a Wireless Power Transfer System using LCC compensation. IEEE Trans. Electromagn. Compat. 2017, 59, 686–694. [Google Scholar] [CrossRef]
  5. Vijayakumaran Nair, V.; Choi, J.R. An Efficiency Enhancement Technique for a Wireless Power Transmission System Based on a Multiple Coil Switching Technique. Energies 2016, 9, 156. [Google Scholar] [CrossRef] [Green Version]
  6. Simic, M.; Bil, M.; Vojisavljevic, V. Investigation in Wireless Power Transmission for UAV Charging. Proc. Comput. Sci. 2015, 40, 1846–1855. [Google Scholar] [CrossRef] [Green Version]
  7. Khazraj, H.; Da Silva, F.F.; Bak, C.L.; Golestan, S. Analysis and design of notch filter-based PLLs for grid-connected applications. Electr. Power Syst. Res. 2017, 147, 62–69. [Google Scholar] [CrossRef]
  8. Xiao, F.; Dong, L.; Li, L.; Liao, X. A Frequency-Fixed SOGI-Based PLL for Single-Phase Grid-Connected Converters. IEEE Trans. Power Electron. 2017, 32, 1713–1719. [Google Scholar] [CrossRef]
  9. Zhou, J.; Zhang, B.; Xiao, W.; Qiu, D.; Chen, Y. Nonlinear Parity-Time-Symmetric Model for Constant Efficiency Wireless Power Transfer: Application to a Drone-in-Flight Wireless Charging Platform. IEEE Trans. Ind. Electron. 2019, 66, 4097–4107. [Google Scholar] [CrossRef]
  10. Rohan, A.; Rabah, M.; Talha, M.; Kim, S.-H. Development of Intelligent Drone Battery Charging System Based on Wireless Power Transmission Using Hill Climbing Algorithm. Appl. Syst. Innov. 2018, 1, 44. [Google Scholar] [CrossRef] [Green Version]
  11. Pahlevaninezhad, M.; Das, P.; Drobnik, J.; Jain, P.K.; Bakhshai, A. A Novel ZVZCS full-bridge DC/DC converter used for electric vehicles. IEEE Trans. Power Electron. 2012, 27, 2752–2769. [Google Scholar] [CrossRef]
  12. Ure, N.K.; Chowdhary, G.; Toksoz, T.; How, J.P.; Vavrina, M.A.; Vian, J. An automated battery management system to enable persistent missions with multiple aerial vehicles. IEEE/ASME Trans. Mechatron. 2015, 20, 275–286. [Google Scholar] [CrossRef]
  13. Zhang, W.; Mi, C.C. Compensation topologies of high-power wireless power transfer systems. IEEE Trans. Veh. Technol. 2016, 65, 4768–4778. [Google Scholar] [CrossRef]
  14. Yi, H.; Wang, X.; Blaabjerg, F.; Zhuo, F. Impedance Analysis of SOGI-FLL-Based Grid Synchronization. IEEE Trans. Power Electron. 2017, 32, 7409–7413. [Google Scholar] [CrossRef]
  15. Sun, Q.; Guerrero, J.M.; Jing, T.; Vasquez, J.C.; Yang, R. An islanding detection method by using frequency positive feedback based on FLL for single-phase microgrid. IEEE Trans. Smart Grid 2017, 8, 1821–1830. [Google Scholar] [CrossRef] [Green Version]
  16. Golestan, S.; Ramezani, M.; Guerrero, J.M.; Monfared, M. dq-frame cascaded delayed signal cancellation-based PLL: Analysis, design, and comparison with moving average filter-based PLL. IEEE Trans. Power Electron. 2015, 30, 1618–1632. [Google Scholar] [CrossRef] [Green Version]
  17. Sun, Y.; De Jong, E.C.W.; Wang, X.; Yang, D.; Blaabjerg, F.; Cuk, V.; Cobben, J.F.G. The Impact of PLL Dynamics. on the Low Inertia Power Grid: A Case Study of Bonaire Island Power System. Energies 2019, 12, 1259. [Google Scholar] [CrossRef] [Green Version]
  18. Rodríguez, P.; Luna, A.; Candela, I.; Mujal, R.; Teodorescu, R.; Blaabjerg, F. Multiresonant frequency-locked loop for grid synchronization of power converters under distorted grid conditions. IEEE Trans. Ind. Electron. 2011, 58, 127–138. [Google Scholar] [CrossRef] [Green Version]
  19. Ye, S. Fuzzy sliding mode observer with dual SOGI-FLL in sensorless control of PMSM drives. ISA Trans. 2019, 85, 161–176. [Google Scholar] [CrossRef]
  20. Kang, J.W.; Shin, K.W.; Lee, H.; Kang, K.M.; Kim, J.; Won, C.Y. A Study on Stability Control of Grid Connected DC Distribution System Based on Second Order Generalized Integrator-Frequency Locked Loop (SOGI-FLL). Appl. Sci. 2018, 8, 1387. [Google Scholar] [CrossRef] [Green Version]
  21. Kim, B.J.; Kum, H.J.; Park, J.M.; Won, C.Y. Analysis, Design and Implementation of Droop-Controlled Parallel-Inverters Using Dynamic Phasor Model and SOGI-FLL in Microgrid Applications. Energies 2018, 11, 1683. [Google Scholar] [CrossRef] [Green Version]
  22. Matas, J.; Martin, H.; De la Hoz, J.; Abusorrah, A.; Al-Turki, Y.A.; Al-Hindawi, M. A family of gradient descent grid frequency estimators for the SOGI filter. IEEE Trans. Power Electron. 2018, 33, 5796–5810. [Google Scholar] [CrossRef]
  23. El Mariachet, J.; Matas, J.; Martín, H.; Li, M.; Guan, Y.; Guerrero, J.M. A Power Calculation Algorithm for Single-Phase Droop-Operated-Inverters Considering Linear and Nonlinear Loads HIL-Assessed. Electronics 2019, 8, 1366. [Google Scholar] [CrossRef] [Green Version]
  24. Du, H.; Sun, Q.; Cheng, Q.; Ma, D.; Wang, X. An Adaptive Frequency Phase-Locked Loop Based on a Third Order Generalized Integrator. Energies 2019, 12, 309. [Google Scholar] [CrossRef] [Green Version]
Figure 1. Equivalent circuit of S-S topology.
Electronics 09 01303 g001
Figure 2. Voltage gain G v according to load quality factor and ω n (k = 1, k = 0.2).
Electronics 09 01303 g002
Figure 3. Current gain G i according to load quality factor and ω n (k = 1, k = 0.2).
Electronics 09 01303 g003
Figure 4. Power gain G p (Efficiency) according to load quality factor and ω n (k = 1, k = 0.2).
Electronics 09 01303 g004
Figure 5. Proposed wireless power transfer (WPT) system diagram.
Electronics 09 01303 g005
Figure 6. WPT system operation following the switching frequency; (a) ZCS operation; (b) ZVS operation; (c) ZVS operation; (d) ZPA operation.
Electronics 09 01303 g006
Figure 7. Block diagram of the overall proposed frequency-tracking algorithm.
Electronics 09 01303 g007
Figure 8. Block diagram of second order generalized integrator (SOGI).
Electronics 09 01303 g008
Figure 9. Bode plot of second-order generalized integrator-quadrature signal generator (SOGI-QSG).
Electronics 09 01303 g009
Figure 10. Block diagram of second-order generalized integrator-frequency locked loop (SOGI-FLL).
Electronics 09 01303 g010
Figure 11. Bode plot of SOGI–FLL.
Electronics 09 01303 g011
Figure 12. SOGI-FLL step response (Frequency estimated value); (a) 80 kHz input frequency; (b) 100 kHz input frequency.
Electronics 09 01303 g012
Figure 13. Flow chart of frequency-tracking algorithm.
Electronics 09 01303 g013
Figure 14. Flow chart of frequency-tracking algorithm.
Electronics 09 01303 g014
Figure 15. Wave of primary voltage and current; (a) d = 5 cm, Ro = 10 ohm; (b) d = 8 cm, Ro = 10 ohm; (c) d = 9 cm, Ro = 10 ohm; (d) d = 10 cm, Ro = 10 ohm.
Electronics 09 01303 g015
Figure 16. Wave of primary voltage and current; (a) d = 5 cm, Ro = 20 ohm; (b) d = 8 cm, Ro = 20 ohm; (c) d = 9 cm, Ro = 20 ohm; (d) d = 10 cm, Ro = 20 ohm.
Electronics 09 01303 g016
Figure 17. Wave of primary voltage and current following the distance.
Electronics 09 01303 g017
Figure 18. Wave of primary voltage and current (d = 5 cm, Ro = 10~20 ohm); (a) zero voltage switching (ZVS) operation without proposed frequency tracking algorithm; (b) zero current switching (ZCS) operation without proposed frequency tracking algorithm; (c) zero phase angle (ZPA) operation with proposed frequency tracking algorithm.
Electronics 09 01303 g018
Figure 19. Efficiency of the WPT system with proposed algorithm.
Electronics 09 01303 g019
Table 1. Specifications of the WPT system.
Var.ValueDescription
V d c 50 Input   DC link   voltage
C 1   ( n F ) 33 Transmitter   side   resoant   capacitor
C 2   ( n F ) 33 Receiver   side   resoant   capacitor
L p   ( m H ) 0.09 Transmitter   side   inductance
L s   ( m H ) 0.09 Receiver   side   inductance
d   ( c m ) 5 ~ 10 Distance   between   two   coils
R o   ( o h m ) ( 10 ,   20 ) Load

