1. Introduction
The European Union wants to lower its greenhouse gas emission by 80% until 2050 in comparison to 1990. The transition from fuel-based to electric mobility is one important aspect in achieving these goals [
1].
Experts do not expect that the integration of electric vehicles (EV) and their charging infrastructure will cause extensive grid expansion in all voltage levels. EV will be connected to the low voltage grid, so that local accumulations of EV are probable there. Problems will initially arise at these accumulations, but their local occurrence is difficult to predict. Grid extension will be necessary to maintain grid stability, when major parts of the households have an EV in Germany. This is a result of an extensive study for different types of low voltage grids in Germany that was presented in [
2]. In [
3], a review is given of additional research activities in Germany that show similar results.
Owners of EV want to charge their vehicles as soon as possible after the purchase at home. This can be possible only with reduced charging power, if the installation of the charging infrastructure for the new EV requires grid expansion. Grid extension in a low voltage grid normally takes about 3–6 months in Germany, due to planning and necessary permissions. The main task of a distribution grid operator is to provide sufficient energy to all residents in his supply area all the time. Using battery storage, a distribution grid operator will be able to connect new charging infrastructure for EV immediately without having to influence the behaviour of vehicle owners. Therefore, this avoids possible disputes between EV owner and distribution grid operator and the distribution grid operator ensures the fulfilment of his mandate.
Besides battery storage systems, there are several other techniques to decrease the burden of EV charging on low voltage grids. In [
4], it is proposed to control the charging process of EV to be able to prevent grid problems. In [
5], authors additionally consider using vehicle-to-grid technologies. This means that besides controlling the charging process, also the discharging capability of an EV is used to reduce problems in a low voltage grid. Both ideas have been further developed in several research activities and a review is given in [
6]. An advantage of using an external battery system in contrast to these techniques is that the grid operator does not have to influence the charging or discharging behaviour of the EV.
Presently, stationary battery storage systems are mainly connected to low voltage grids in households to increase the self-consumption of households with a solar power system as this is economical beneficial in many countries worldwide. For example, in [
7], this is analysed for 400 residential and 26 commercial systems in the Netherlands. Results show that Batteries increase the self-consumption rate depending on the PV size and the battery size. The effect of the battery sizing on the self-consumption for an exemplary house in Sweden is shown in [
8]. In [
9], it is shown that the self-consumption level in a settlement increases by around 25% using a battery system. Including an EV in such a system can have a positive influence on the self-consumption [
10]. Increasing self-consumption as operation method of a battery system relieves the stress of the low voltage grids partly, as it is beneficial to charge the EV using energy out of the battery systems. Nevertheless, not all households owning an EV have a battery system and the state of charge of the battery system might not always be high enough to charge the EV completely.
In contrast, the battery storage for the application in this paper has only the goal to operate in a grid-friendly manner. To handle high photovoltaic (PV) penetrations, this idea was already proposed often in literature. In [
11], a battery storage system is used to prevent overvoltages due to high PV penetration or in [
12] a battery is used to flatten the energy demand of a neighbourhood. Also for EV, this was already adapted and presented. Hereby, a distinction has to be made between using the internal battery of an EV or an external battery. In the above mentioned vehicle-to-grid technologies, the internal battery is used. For example in [
13], the grid load variance is minimized while in [
14] and [
15] the peak power is reduced using the internal battery of an EV. As the grid operator cannot influence if EV are at home and hence, if he is able to use vehicle-to-grid-services, this approach is not adequate for the problem in this paper.
Stationary external battery systems are available all the time. In [
16], the basic idea of such a storage system was presented. In [
17], a storage system was sized for different penetrations of EV to avoid undervoltages. In [
18], a battery storage was dimensioned to decrease the peak power of a low voltage feeder under a given limit to avoid overloading.
The topic of this paper is also the use of a stationary battery system to relieve the stress of a low voltage grid in times of EV charging. In contrast to the other publications about this topic, the focus is not on sizing of a battery system. In this paper, innovative operation strategies for such a battery storage are presented that can be easily implemented in existing battery storage systems. The strategies have been developed and tested using simulations. Most research activity mentioned above is based only on simulations. The reason for that is that nowadays the penetration of EV is not high enough to test the developed algorithms in practice. In contrast, the most promising strategies that have been developed in this publication have been used in a field test in the project “Netzlabor E-Mobility-Allee” including ten EV in a low voltage feeder to prove their capability and validate the simulation results.
Only a few field tests in similar size have been performed until now. Existing projects mainly focus on car parks such as in [
19] and not on home charging. In [
20], 20 EV have been used to test the capability of a low voltage grid to cope with high penetrations of EV using home charging. Actions to decrease the stress is not part of the research.
The publication is structured as follows: In
Section 2, the project “Netzlabor E-Mobility-Allee” is presented, where this approach was tested. The valid grid restrictions for this project are described in
Section 3. In
Section 4 and
Section 5, the regarded low voltage feeder as well as the input data are described. In
Section 7, different operation strategies for the battery storage system are presented. For the testing, at first a simulation framework was used that is described in
Section 6. The results of the simulations of the different strategies are presented in
Section 8. After testing in the simulation framework, two strategies have been chosen for testing in the demonstration project. Results from measurements are shown in
Section 9 and compared to the simulation results. Finally, in
Section 10 conclusions are derived and an outlook is given in
Section 11.
4. Grid Data
Netze BW GmbH, a distribution system operator in the German state of Baden-Württemberg, provides the grid data. It is one part of a 400 V distribution grid in a suburban area and consists of 21 households. In this low voltage feeder the project “Netzlabor E-Mobility-Allee” takes place. The low voltage grid section is connected via a 630 kVA transformer to the medium voltage grid. The overall low voltage grid, which is connected to the transformer, consists of 15 feeders. In this paper, only one feeder of the low voltage grid is examined. Hence, it is not possible to model the use of the transformer appropriate. As an alternative, the maximum power allowed on this feeder is limited to 60 kVA.
A factor of 0.7 is used to take simultaneities and overload capacity into account. In Germany, this is common practice in grid planning processes in distribution grids.
In
Figure 1, a simplified structure of the regarded low voltage feeder is shown. For the position of the battery storage, four positions (see 1, 2, 3, and 4 in
Figure 1) are considered. At Points 2 and 4, an cable distribution cabinet is installed, so the battery can be connected easily. Point 3 is the middle of the feeder. In
Figure 1, the battery is connected to Point 4 as it is done in the project.
In [
18], the approach to dimension a central battery storage for this demonstration project is explained in detail. For better understanding, a summary is given here. The energy demand of the low voltage feeder was modelled using measurement data of the regarded feeder without EV charging. Input profiles for the EV charging process have been applied randomly over a horizon of ten years. In simulations, the maximum necessary power (79.8 kW) as well as the maximum energy capacity (74.6 kWh) to maintain compliance with the given grid limits was determined. For the field test, second life batteries of a BMW i3 are used. It was decided to use two batteries, so in total a 66 kWh lithium ion battery system is installed with a maximum charging and discharging power of 60 kVA.
5. Input Profiles
We are using profiles to take into account that the power flow in a distribution grid is different depending on the time of day. This is necessary to be able to test the operation strategies that will be presented in
Section 7. The profiles will be used as input data for the simulation framework in
Section 6.
The used input profiles are described more detailed in [
18]. To improve understanding, the basic approach is presented here. In the grid, the energy consumption of the households, EV charging processes and the energy consumption of the electric heating devices in the feeder are modelled. A few households also have PV generation, but it is neglected in this paper due to the small amount and difficult predictability. As PV generation lowers the total load, this assumption leads to overestimating of the use of the battery storage. The modelling of the electric heating devices is explained in
Section 5.1 in detail.
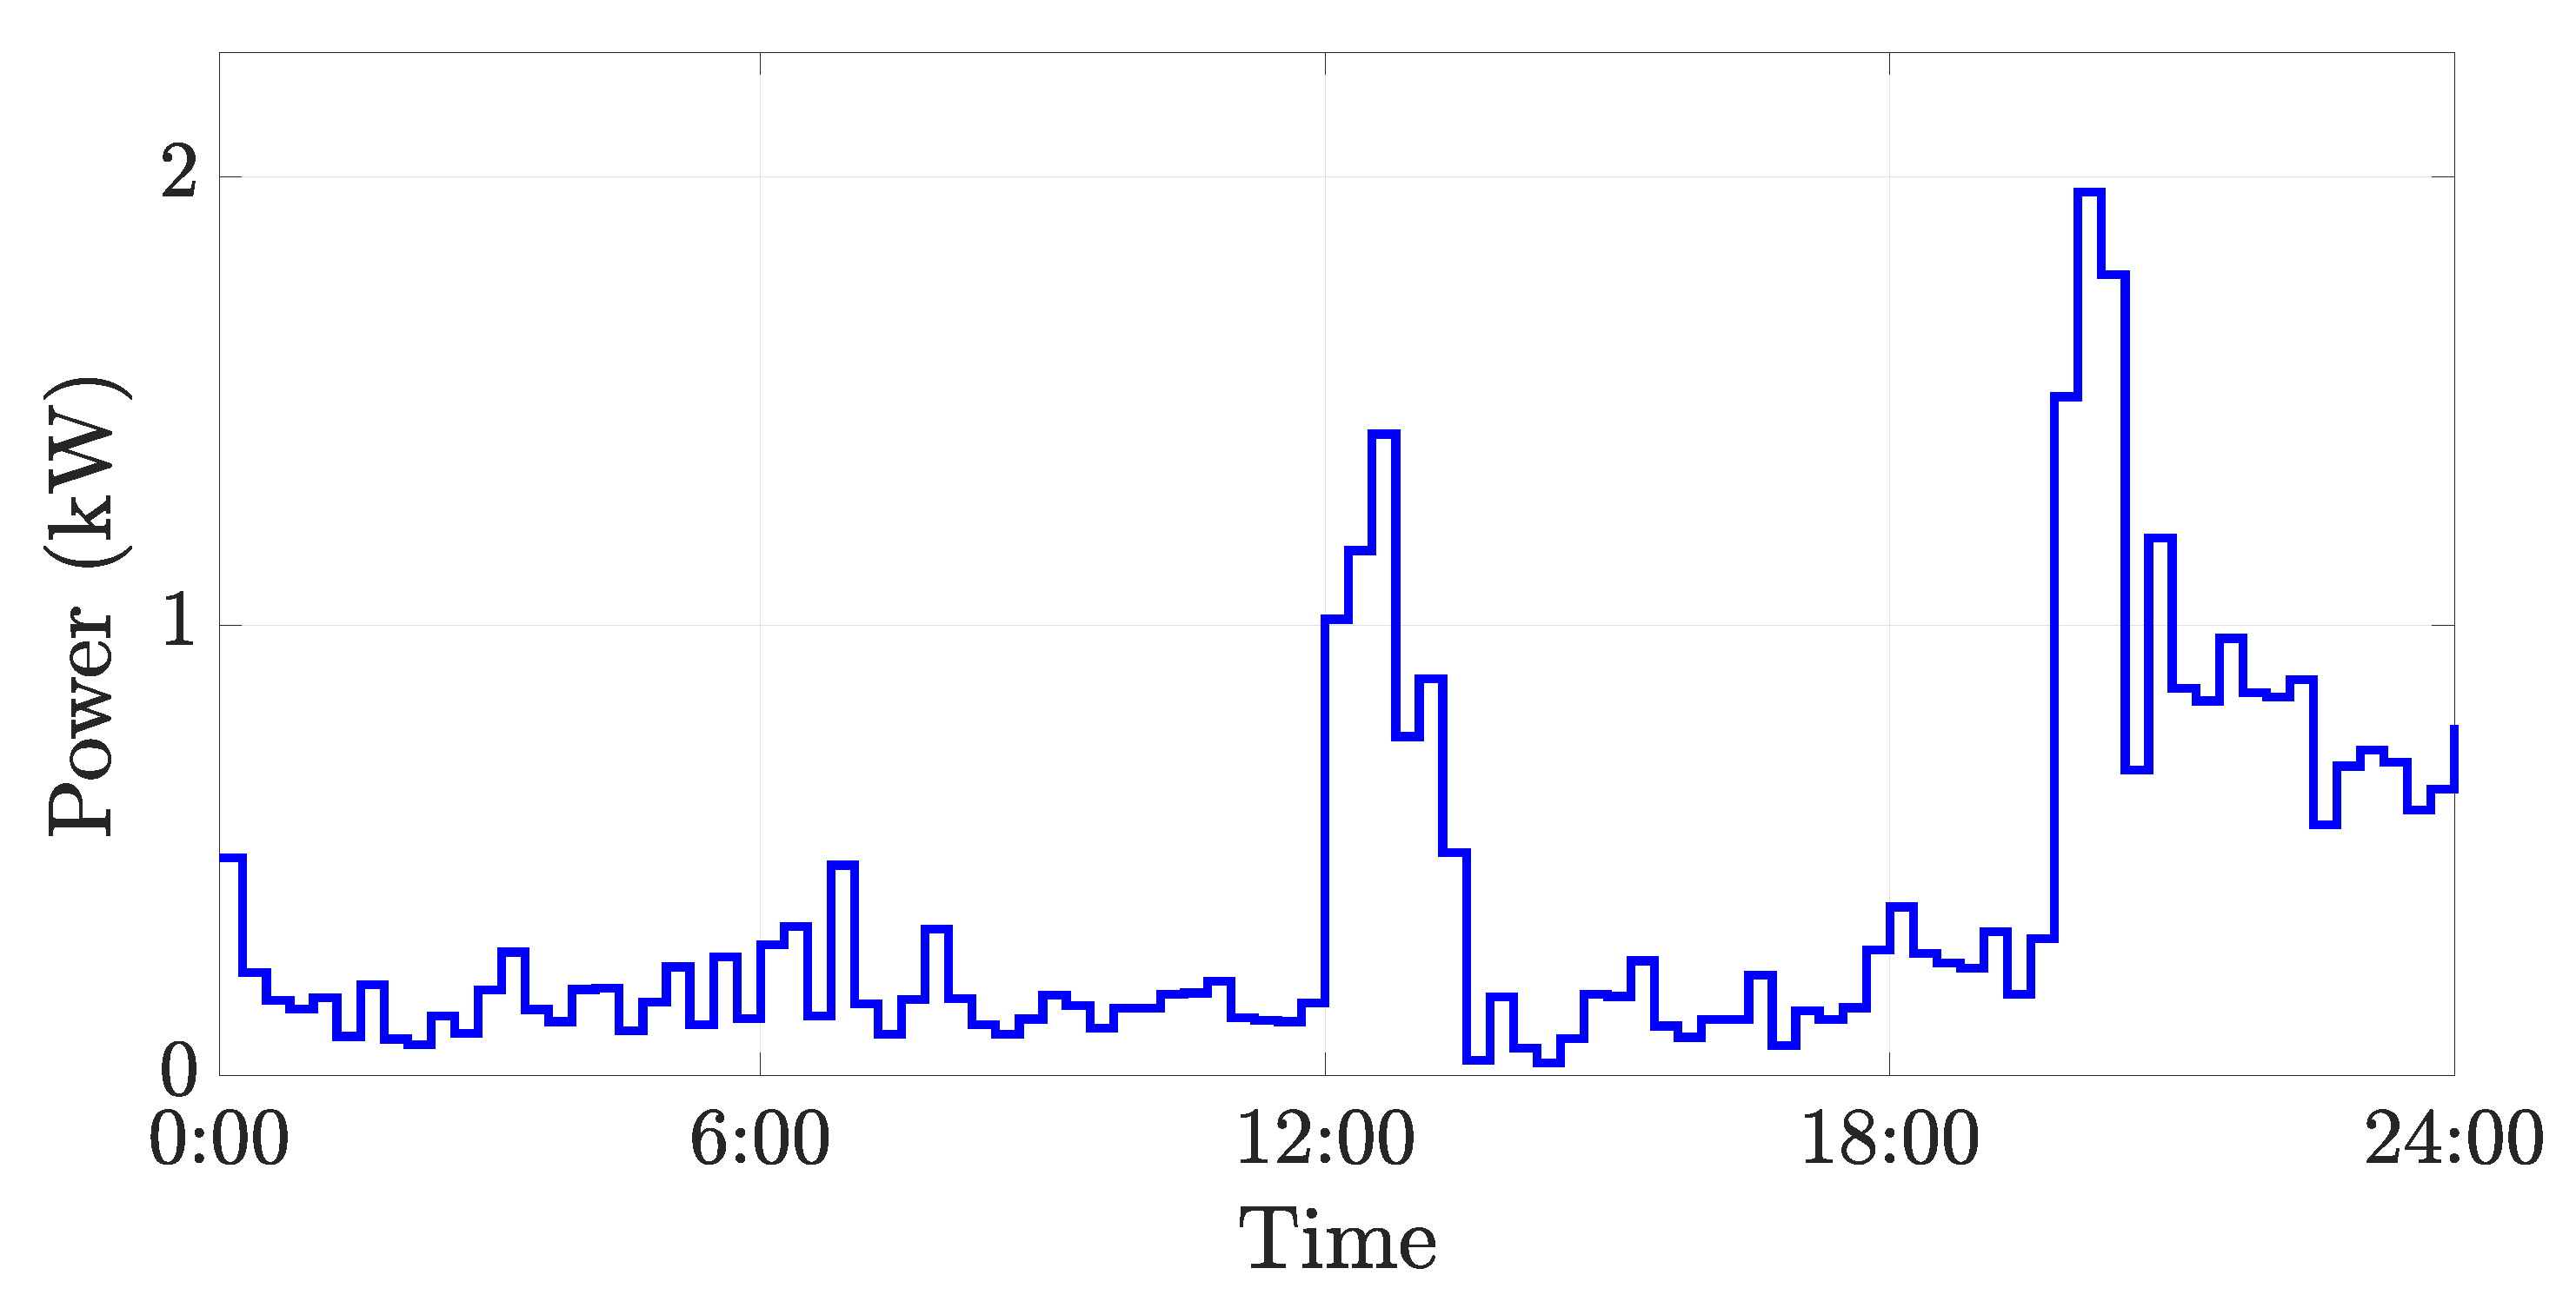
It is especially difficult to predict the charging of EV and household loads. Therefore, several hundred input profiles have been generated and included randomly in the simulations. The charging profiles for the electric vehicles have been developed in [
22] and ten exemplary profiles for one day and a charging power of 11 kW can be seen in
Figure 2. The profiles for the energy consumption have been generated using the tool presented in [
23]. An exemplary profile for one day can be seen in
Figure 3. Each profile is scaled using the yearly energy consumption of each household. In this paper, we are using profiles in 15 min intervals. The horizon of the simulations is one year. Therefore, 365 different courses for each profile as well as seasonal differences are taken into account automatically.
The operating hours depend on the season, which affects the heating demand. Therefore, two different seasons are considered to test the operation strategies. Winter (including electric heating) and summer (excluding electric heating). In
Figure 4, profiles for all types of loads for the regarded feeder are presented for an exemplary weekend day.
5.1. Electric Heating
Several households in the previously mentioned distribution grid use electric heating to heat their houses. As the rated power of these systems is comparably large, their operating hours are restricted in Germany by the grid operator. To reduce their effect on the distribution grid, they are only allowed to heat in off-peak hours. In this paper, we assume that the electric heating systems are only allowed to heat during the times that are listed in
Table 1.
As we can see in
Figure 4, the determination of off-peak hours should be adapted in the future when higher penetrations of EVs are expected as using the current specification leads to simultaneous EV charging and electric heating and hence extraordinary burden for the distribution grid.
In reality, the electric heating is not working during all permitted times. In
Figure 5, measurement data of the power flow on the feeder for a winter day (blue) is displayed. As the electric heating has a total power of 40 kW, its influence on the power flow is significant. There was no additional measurement at the electric heating devices, so that it has to be estimated (yellow curve). Subtracting the power for the electric heating from the total power, the power on the feeder without electric heating (orange) is calculated.
In reality, the energy consumption of the electric heating is not the same, but similar for all days. Through analysing measurement data for about one month, we assume that the electric heating is turned on in the times that are listed in
Table 2. The assumed heating profile is shown in
Figure 5 as purple line.
7. Operation Strategies for the Battery Storage
7.1. Fixed Schedule
The first strategy uses a fixed schedule for the charging and discharging power of the battery storage. As input, only data to characterize the power flow in the low voltage feeder is needed. In this paper, the number of households and their yearly energy consumption as well as the number of electric vehicles and their respective charging power is necessary to generate the necessary profiles as input data (see
Section 5). Additionally, electric heating with specific use times is considered. Therefore, different schedules are used on weekdays and on the weekend. No actual real-time measurement data is needed.
To determine the schedule for charging and discharging, the simulation framework described in
Section 6 is used to determine if there are violations of grid limits in the low voltage feeder for a horizon of one year. In the regarded low voltage grid, the only critical limit is the power limit of the feeder S
Feeder,max. In
Figure 6, the daytimes when the feeder limit S
Feeder,max is exceeded, are shown. The number of overloading events was evaluated in 30 min intervals. The horizon of the simulation was 365 days. As the simulation was done in 15 min intervals, the maximum possible number of events is 730 (=365 × 2). Under- or overvoltages did not occur in the regarded low voltage feeder.
Overloading occurs mainly between 20:00 and 22:00 as well as between 23:00 and 24:00. The events between 13:30 and 14:30 mainly happen on the weekend due to the different operation times of the electric heating. As a result, it can be said that the times of overloading correspond to the operation times of the electric heating. As a consequence the schedule shown in
Table 3 was determined as fixed schedule for the discharging of the battery system.
In
Figure 7, the times of the day with less than 20 kVA power flow into the feeder is shown. At these times, the battery can be recharged without causing any problems in the low voltage feeder. Especially in the morning hours between 04:00 and 08:00, the criterion is fulfilled regularly. Hence, these times are chosen for the charging of the battery system. On the weekend, an additional charging time during the daytime is assigned. The schedule shown in
Table 4 was set for the charging of the battery.
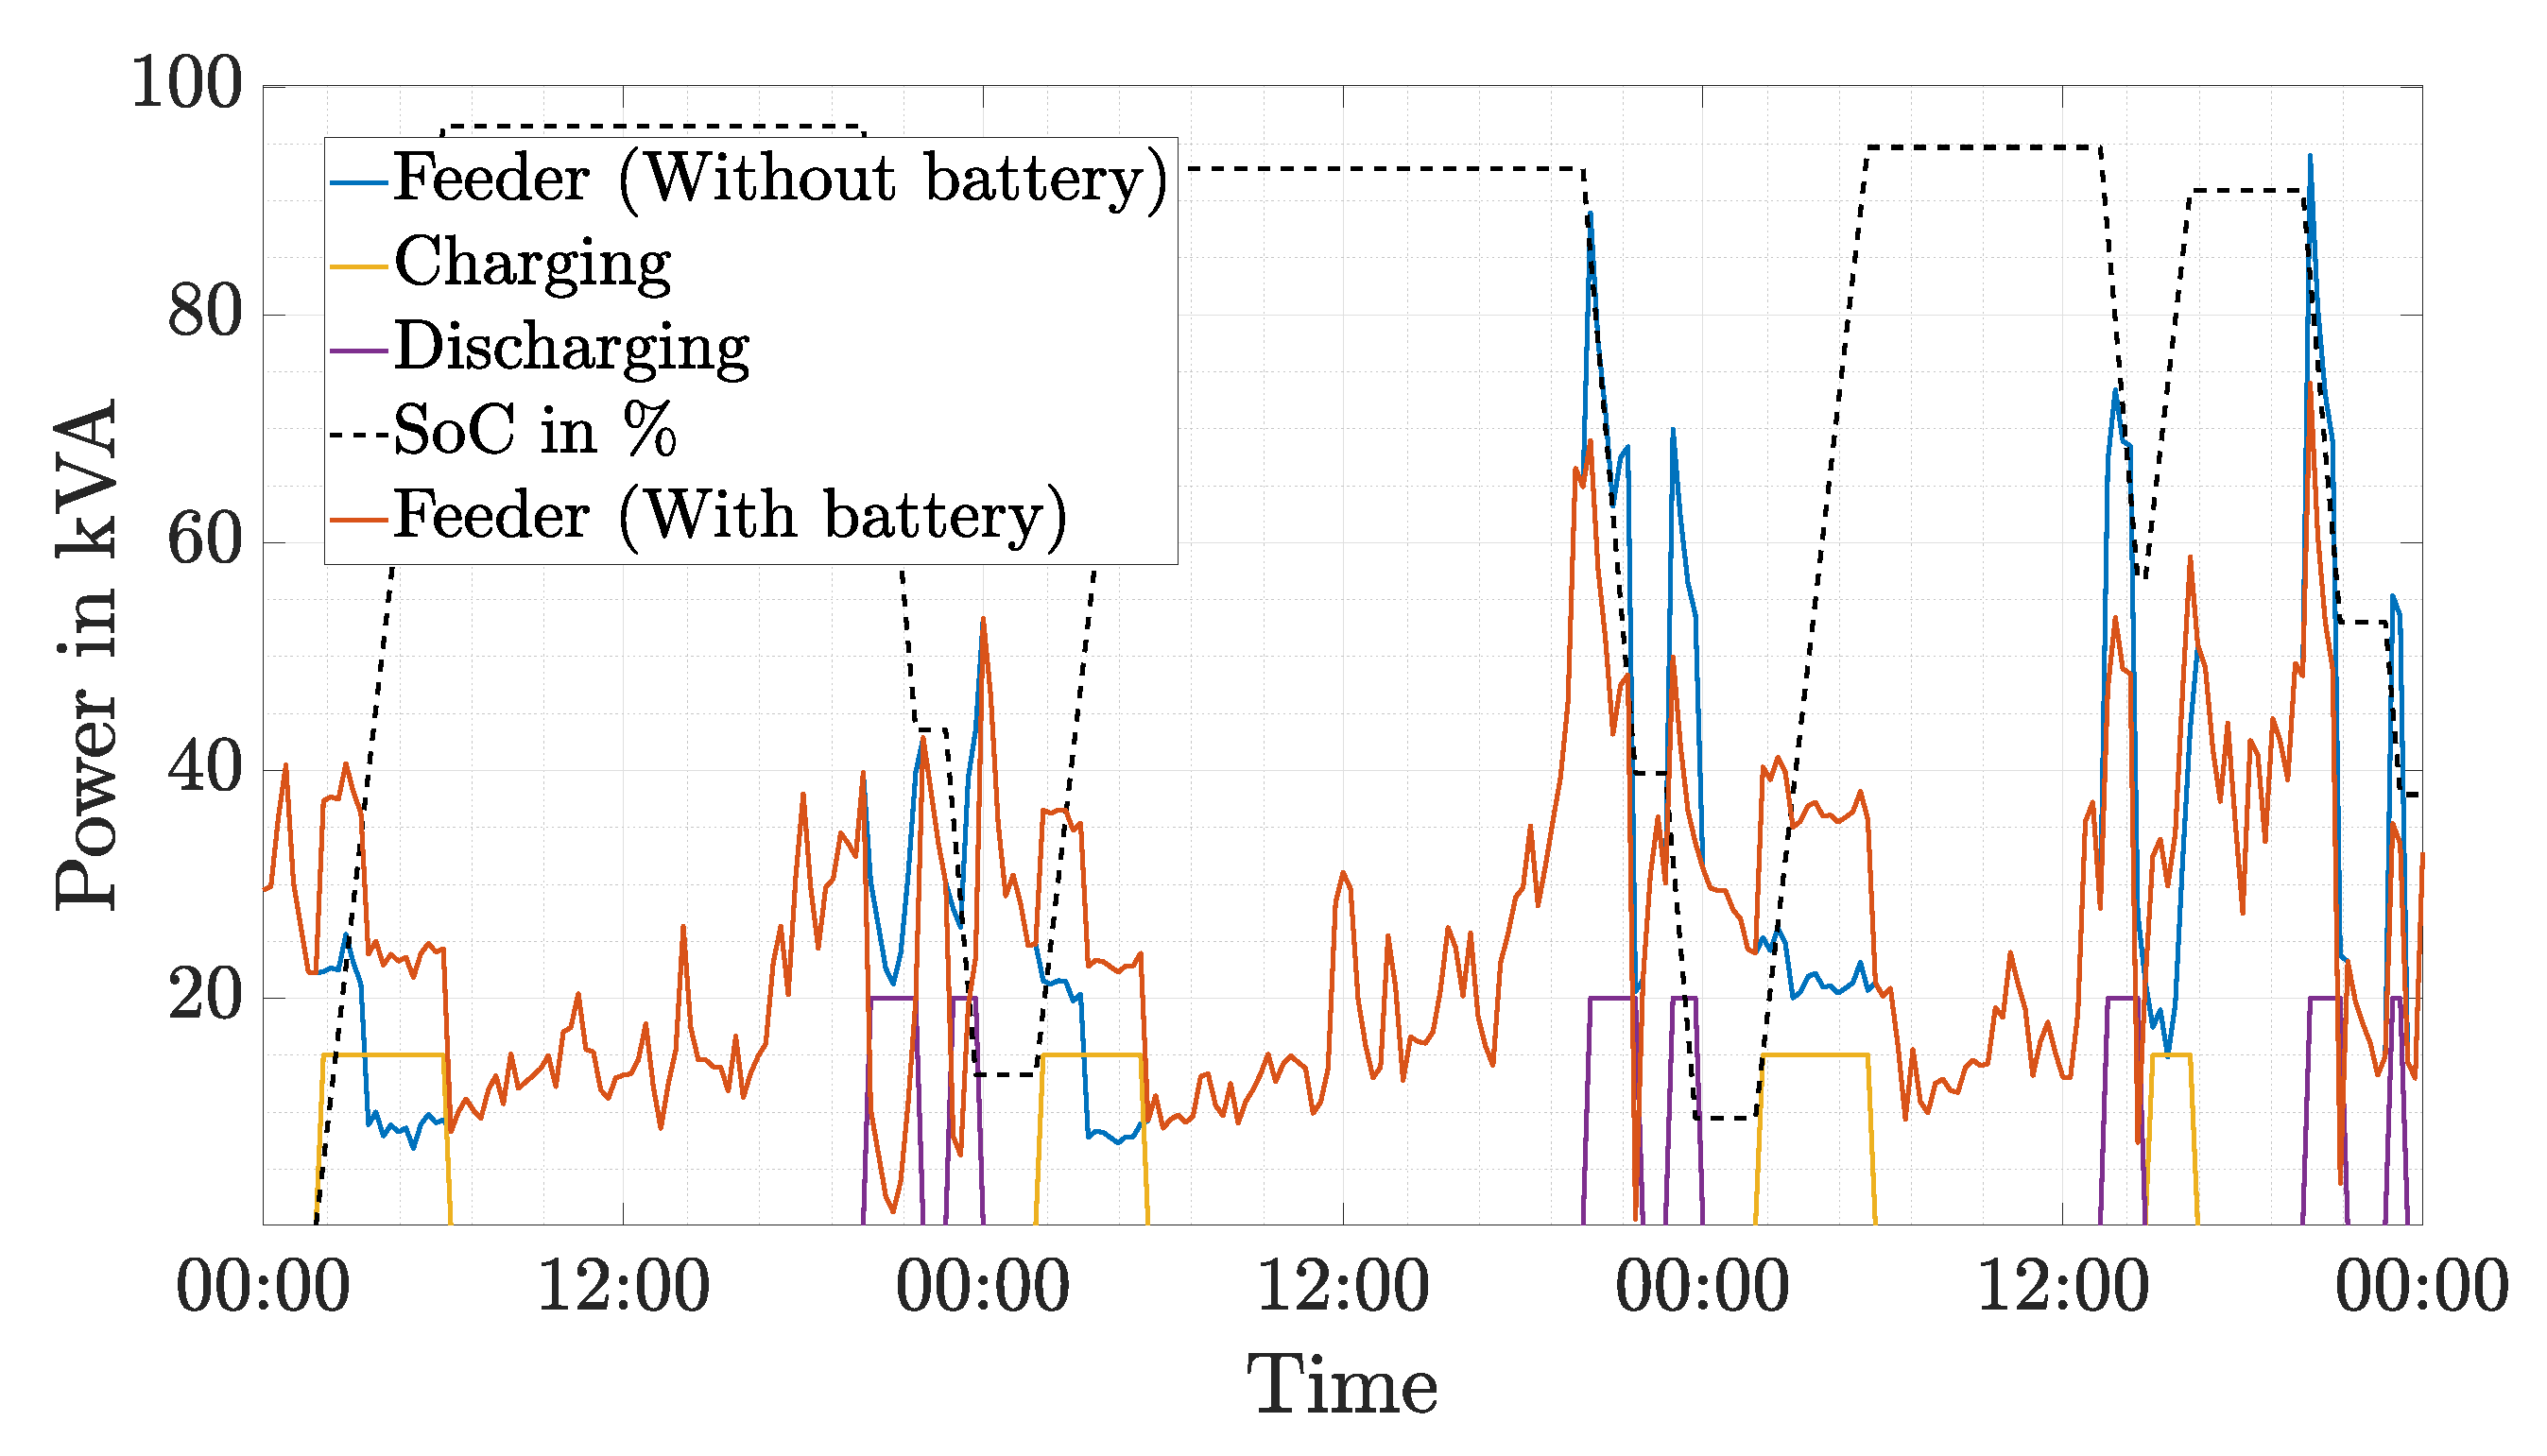
In
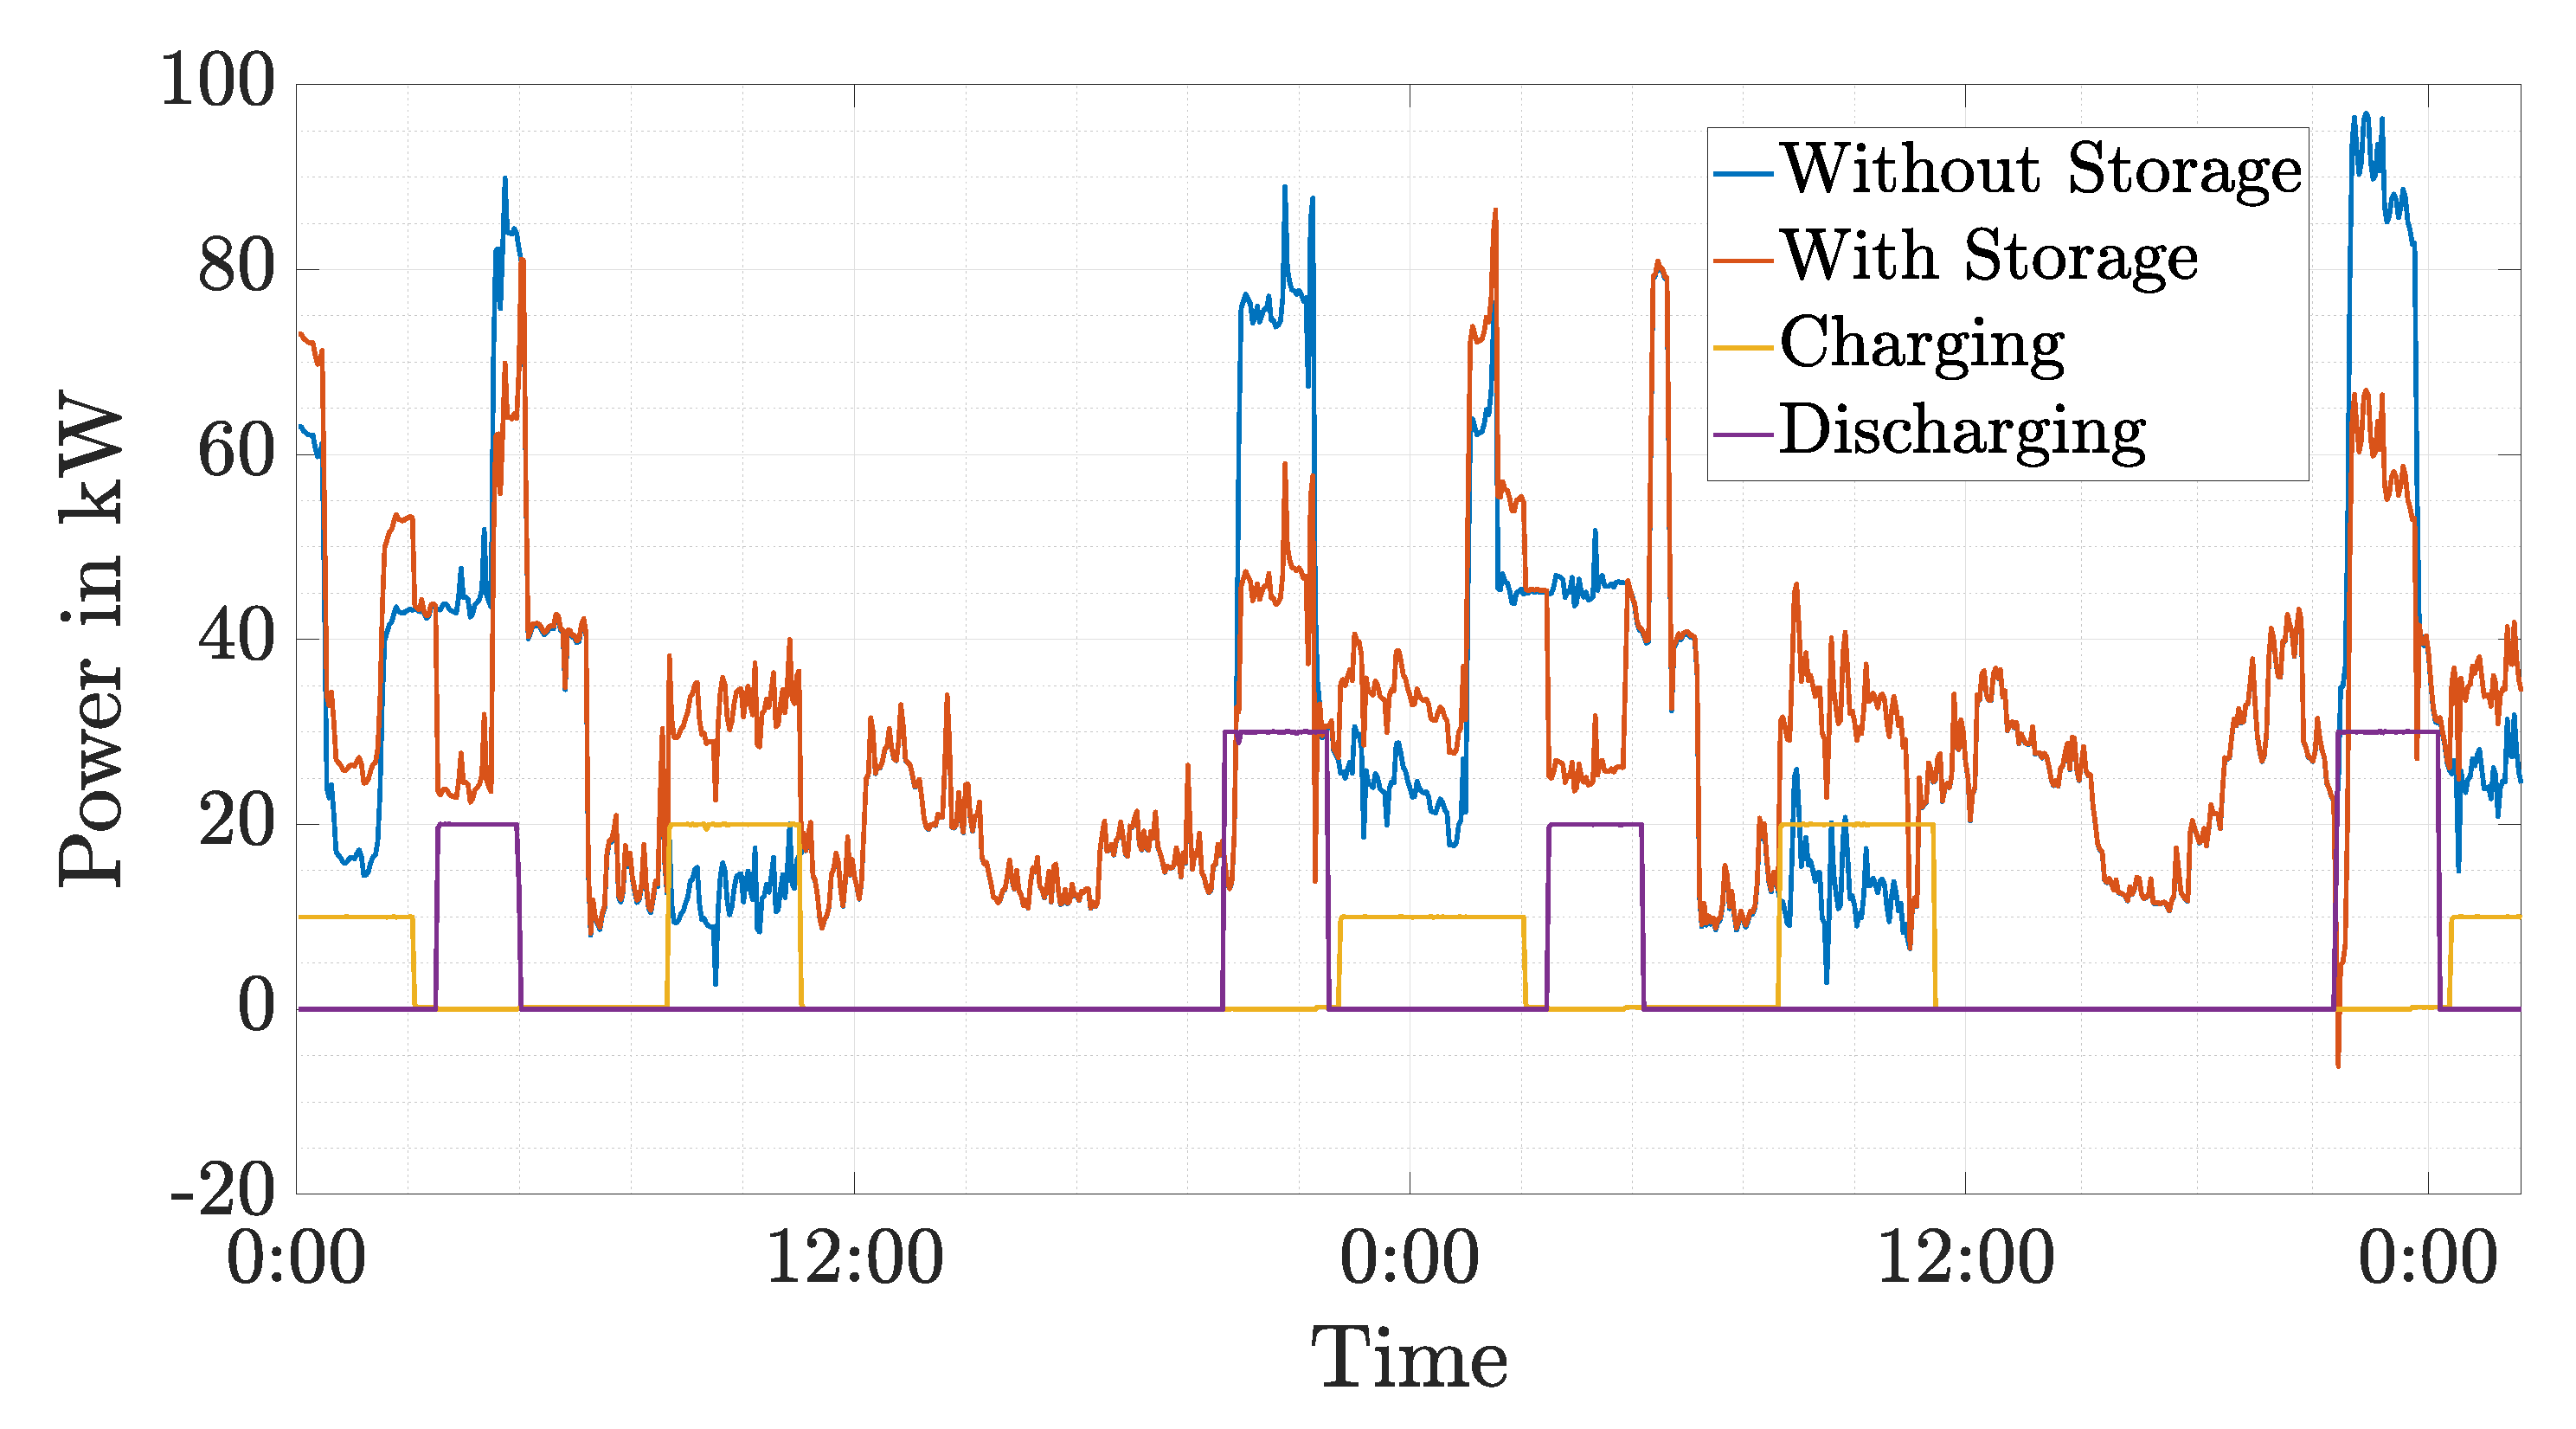
Figure 8, an exemplary course for the fixed schedule strategy for two exemplary days is shown. The blue curve is the power flow into the feeder S
Feeder without the battery system, which is calculated by the simulation framework. The charging power (yellow curve) and discharging power (purple curve) are as defined in
Table 3 and
Table 4. The resulting power flowing into the regarded feeder including the battery system (orange curve) has significant lower peak powers than without out the battery system (blue curve).
7.2. Measurements at the Battery Storage
For the second strategy, real-time measurements at the battery storage are included in the operation strategy of the battery storage. As measured values voltage UStorage, current IStorage and power PStorage are necessary. Battery storage systems have the necessary measurements already included in their battery management systems, so in the future these measurement devices could be used for such a strategy. In the research project “Netzlabor E-Mobility Allee”, this was not possible, so an additional measurement device was installed close to the battery system.
To review the compliance with given grid limits at all points in the grid, the state of the grid at other points has to be estimated. To simplify, only the voltage at the end of the feeder and the power flow into the feeder are estimated in the following algorithm. As the low voltage feeder is neither meshed nor there are any junctions, the minimum voltage is always at the end of the feeder. As the power limit SFeeder,Max is more critical than the current limits for the lines, the currents are not estimated.
For the estimation, the impedance between the transformer and storage Z1 as well as the impedance between the storage and the end of the feeder Z2 have to be known to be able to calculate quantities that are not measured. The necessary calculations for the estimation are performed in the battery management system.
For the calculations, the voltage at the transformer
UTransformer,Est. was set to its nominal value. Hence, the voltage drop between transformer and storage
is estimated as
Using
, the current flowing into the feeder
IFeeder,Est. is estimated as follows
and hence the power flowing into the feeder is
To estimate the minimum voltage in the grid
UMin,Est., it is assumed that the current
IStorage is flowing till the end of the feeder.
The results for the minimum voltage and feeder power estimation depend on the location of the battery storage. Four locations as defined in
Figure 1 are analysed.
In
Table 5, the deviation of the estimated minimum voltage
UMin,Est. from the voltage
UMin,Calc., calculated using the simulation framework, for a horizon of one year is shown. The maximum and minimum deviation as well as the mean value of the deviation is shown.
If the battery system is installed at Point 4, the minimum voltage is measured there automatically, so there is no estimation necessary. At all other points, the deviation is always positive. Hence, the estimation is a worst case estimation. The maximum deviation occurs if the storage is at Point 1. It is 1.246% of the nominal voltage while the mean deviation is just 0.241% of the nominal voltage. To evaluate this numbers, it has to be taken into account that the voltage drop in the regarded low voltage feeder is quite small. For grids with longer cable lengths (e.g., on the country side) and therefore higher voltage drops, higher deviations are expected.
In
Table 6, the deviation between the calculated values in the simulation framework
SFeeder,Calc. and the estimated values
SFeeder,Est. of the power flow into the feeder are compared. If the battery storage is placed at Point 1, the power is already measured through the battery storage, so no deviations occur. In comparison to
Table 5, the minimum deviation is negative. Hence, the power flow is overestimated as well as underestimated. Deviation arise when the energy consumption along the feeder is not evenly distributed. The maximum deviation happens when the storage is connected to Point 4 with 89.1 kVA. The comparison with the maximum allowed power on this feeder
SFeeder,Max (60 kVA) shows the extent of the deviation. This maximum deviation just happened on one time step. The mean deviation on Point 4 is just 5.6 kVA.
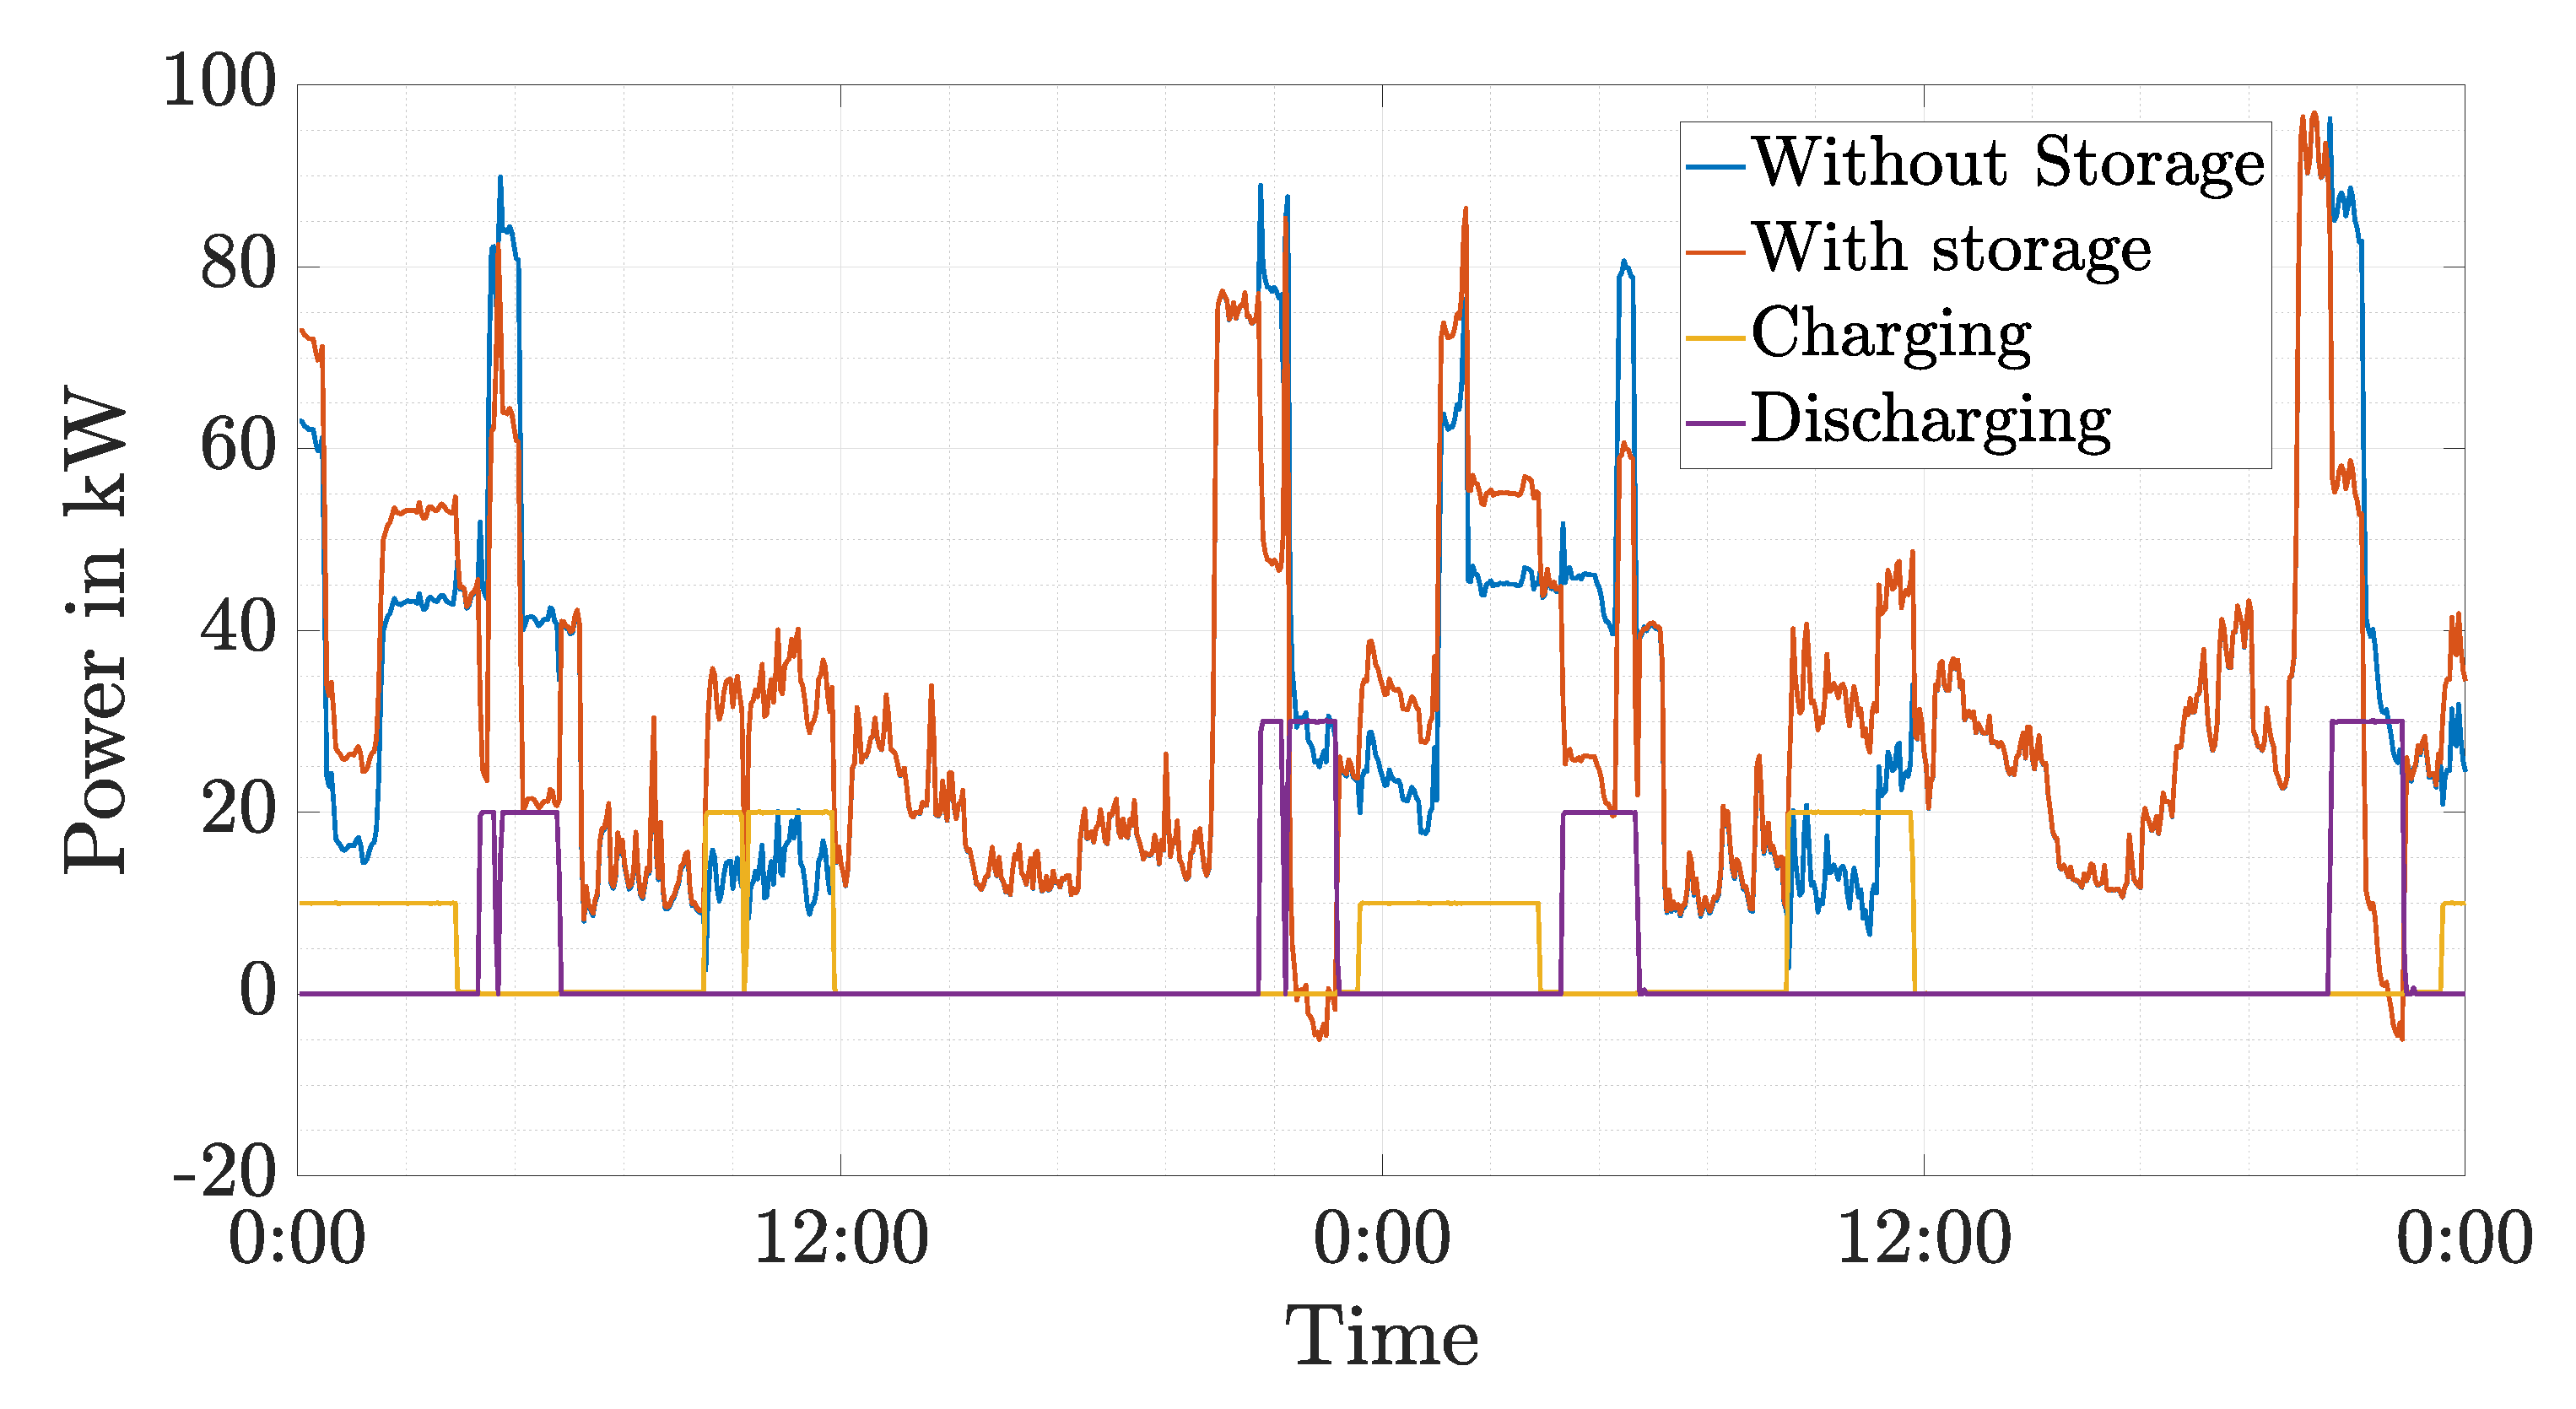
In
Figure 9, the power flows into the feeder as well as charging and discharging power on two exemplary days are shown. For this simulation, the battery storage was connected to Point 2. The blue curve is the power flow into the feeder
SFeeder without the battery system. The battery is discharging (purple curve), whenever
SFeeder (blue curve) is exceeding the limit
SFeeder,Max. The battery storage gets recharged (yellow curve) as soon as the power flowing into the feeder is less than 30 kVA.
7.3. Measurements at the Battery Storage and the Start of The Feeder
For the third strategy, in comparison to
Section 7.2, an additional measurement device is added at the beginning of the feeder. The second measurement device measures the power flow in the feeder
SFeeder exactly, so that this quantity does not have to be estimated in contrast to
Section 7.2. The minimum voltage in the feeder
UMin,Est. does still have to be estimated as long as the storage is not connected at the end of the feeder. For the estimation of the minimum voltage in the feeder
UMin,Est., the same approach as in
Section 7.2 is used.
Disadvantages of this strategy are that an additional measurement device is needed as well as communication between the measurement device at the start of the feeder and the battery storage to transfer the measurement values. Main advantage is that SFeeder is measured and does not have to be estimated.
7.4. Measurements Data from Smart Meter
Smart Meters are installed at each household already in several countries (e.g., Spain) or will be installed in the next years (e.g., Germany). Instead of own measurements devices in the low voltage feeder, also Smart Meter data could be used. The main advantage is that no new devices have to be installed and that data is available for each household. Therefore, no estimation of grid values is needed and hence no information about the low voltage feeder is needed in advance. Only a communication channel between Smart Meters and the battery management system has to be established.
In this scenario, the compliance with the given grid limits can be verified always and necessary actions performed. Therefore, it was not necessary to test this strategy in the simulations.
8. Simulation Results
In the following chapter, the simulations results are presented and discussed. The presented operation strategies have been tested using input data from the simulation framework as artificial measurement data. It is then tested if the proposed strategies are able to detect a necessary operation of the battery storage. Therefore, three different findings are possible:
Correct: An operation of the battery storage is necessary and detected by the operation strategy
Fault 1: An operation of the battery storage is necessary, but not detected by the operation strategy
Fault 2: An operation of the battery storage is not necessary, but detected by the operation strategy
In
Table 7, the results are shown for a scenario without a battery storage and with the fixed schedule. Without the battery storage, the grid restrictions are not fulfilled for 2248 15-min intervals for a simulation horizon of one year. Using the battery storage with a fixed schedule, only for 537 15-min intervals there is no compliance with the grid limits. This is a decrease of more than 76%. However, the battery storage is also used in 1653 15-min intervals without a violation of grid limits (see Fault 2). The results for the Fixed Schedule strategy do not dependent on the position of the battery storage. For the following discussion of results, the strategy with the fixed schedule is set as reference as it is easy to implement and no measurements are necessary.
In
Table 8, the results for the strategy “Measurements at the battery storage” (see
Section 7.2) are presented. The results depend on the position of the battery storage. In general, it can be seen that the correct detection of events decreases with increasing distance to the MV/LV transformer. The reason is that in the regarded low voltage feeder only feeder overloading problems arise. Hence, the power flow at the beginning of the feeder is the only relevant value to detect violations of grid limits. This power flow is estimated more accurate if the battery storage is closer to the beginning of the feeder as it is shown in
Table 6.
The results for the scenario “Measurements at the battery storage and the start of the feeder” can be seen in
Table 9. As explained in the previous paragraph, for the investigated grid only S
Feeder,max is the relevant value to detect grid violations. Consequently, all the violations can be detected with the measurement at the start of the feeder. As the measurement at the battery storage is not needed, the position of the battery storage does not have any influence.
Finally, it has to be said that a detection of an event does not mean automatically that it can be solved. The charging and discharging power of the used battery storage is limited.
9. Results from The Project
After analysing the simulation results, two of the developed strategies have been chosen for testing in reality in the research project “Netzlabor E-Mobility-Allee”. One strategy is the fixed schedule strategy as it is quite easy to implement. For the second strategy, measurement devices at the start of the feeder as well as the storage are used. For details on this strategy, see
Section 7.3. This was chosen, as this strategy was able to prevent all violations of the grid limits for the given battery position in the project (Position 4 in
Figure 1).
9.1. Fixed Schedule
The first strategy with a fixed schedule was tested from 05/02/2019 to 17/02/2019. Measurement data was recorded in a 3-min interval. In this period, in 493 intervals the power demand would have been higher than 60 kVA without the battery storage. As a consequence of new measurement data, the schedule for the battery storage was adjusted to the times in
Table 10.
The new measurement data was recorded during cold winter times, wherefore the electric heating was used more as seen in previous measurements. Therefore, the discharging time in the afternoon on weekends was extended and an additional charging time introduced. Additionally, the discharging power at 20:00 was increased and the discharging period lengthened. Furthermore, an additional discharging time between 03:00 and 05:00 was introduced, followed by a charging time between 08:00 and 11:18.
In
Figure 10, the measurement data for the 05/02/2019 and the 06/02/2019 can be seen. Due to a time difference problem, there was a one-hour time offset between the real and the intented schedule for the battery storage. Overall, the number of intervals with more than 60 kVA power demand have been reduced by more than 16% to 414 intervals during the test phase. As this is a significant difference to the simulation result (decrease of more than 76%), the deviations will be analysed in the ongoing section.
In
Figure 11, the course of the data can be seen after recalculating the time shift. Neglecting the time shift leads to a decrease of more than 41% in intervals with feeder overloading. Hence, the correction of the time shift increases the correct fault prevention by around 25%.
As can be seen in
Figure 11, there is a malfunction of the battery system during charging or discharging (e.g., on the first day at 03:20). An additional removal of this malfunction (see
Figure 12) would lead to a decrease of approximately 44.8% in intervals with feeder overloading. In comparison to just correct the time shift, this is an increase of 3.4%.
Furthermore, the whole energy capacity of 66 kWh of the battery system could not be used, which leads to decreased charging and discharging periods. Correcting this effect (see
Figure 13), leads to another decrease of 3.7% in the number of intervals with feeder overloading. In
Figure 13, the charging and discharging times neglecting the decreased energy capacity, can be seen. In
Figure 13, the schedule for the battery storage is equal to the original planned schedule.
Nevertheless, there is still a significant difference to the simulation results. The reason is, that in the simulations the amount of intervals, where a overloading occurs and is detected was determined. The capability of the battery system to prevent the feeder loading was not checked. This leads to situation, that for many intervals the discharging power was not sufficient to prevent the feeder from overloading. Increasing the power limit of the feeder SFeeder,max by just 5 kVA to 65 kVA would lead to a total decrease of 71.6% in overloaded intervals. This proves the given statement.
9.2. Measurements at the Battery Storage and the Start of The Feeder
The second strategy was tested between 19/02/2019 and 1/3/2019. As this period was quite warm, S
Feeder,max was set to 40 kVA to be able to test the strategy appropriately. In
Figure 14, measurement data for the 21/02/2019 and 22/02/2019 is shown.
During the test period, 491 intervals with feeder overloading would have been occurred without the battery system. Using the measurement devices and the battery system, only 22 intervals with overloading existed in reality (e.g., on the second day at 21:30 in
Figure 14). This means that the number of overloading intervals could be decreased by 95.5% during the test period. In the remaining 22 intervals, the overloading could not be prevented because of malfunction of the battery storage as well as discharging power limitations of the battery storage.
If the original SFeeder,max of 60 kVA would have been used, the number of intervals could have been decreased by 98.6%. The residual 1.4% of intervals are caused by malfunction only. Hence, the simulations results and field test results correspond for this strategy.
10. Summary and Conclusions
In this paper, different strategies for the operation of a battery storage as a temporary equipment during grid reinforcement have been developed and tested in simulations as well as in reality. Four different strategies have been simulated. A result of the simulation was that the ability of the battery storage to prevent the violation of grid limits depends on the position of the battery storage as well as the used measurements as input data. For the test in the project “Netzlabor E-Mobility-Allee” the two most promising strategies have been chosen.
For the strategy with a fixed schedule, a precise model of the low voltage feeder is necessary to determine an appropriate schedule. Nevertheless, it is not possible to prevent all grid limit violations using this strategy. Main advantage is that no measurement devices have to be installed. This decreases the effort in comparison to measurement-based strategies significantly. The strategy with a fixed schedule showed a different result in the field test than in the simulations. Instead of 76%, only around 16% of all grid violations could be prevented. The reason for that was a time difference problem, malfunction of the storage as well as limited capacity of the storage.
In a second strategy, only one measurement device was installed at the battery system. This measurement values have been used to estimate all important quantities to review the compliance with the given limits. In simulations, it was shown that the results show a good performance on average, but high deviations can occur in extraordinary circumstances.
In the third strategy, besides a measurement device at the battery storage, also at the start of the feeder a measurement device was installed. Disadvantage of this solution is not only the installation of additional measurement equipment, but also the need of communication infrastructure to transfer measurement values from the second device to the battery management system. In the regarded low voltage feeder, the critical parameter regarding the grid limits was only the power flow into the feeder. Using this strategy, in simulations all problems in the grid can be prevented. Using this strategy in the field test, 95.5% of all grid violations have been prevented. The remaining violations occur because of a malfunction of the battery system. Hence, this strategy is the most promising strategy tested in this paper to be able prevent the violation of grid limits. At this point, it has to be mentioned that this statement is only valid for low voltage feeder with similar critical grid parameters.
In the future, the installation of measurement devices might not be necessary any more, as Smart Meters will be installed in the grids extensively. Their measurement data can then be used instead of other measurement devices that have to be installed.


