Review

Electric Vehicles: A Data Science Perspective Review

Faculty of Electrical Engineering and Computing, University of Zagreb, Zagreb 10000, Croatia
*
Author to whom correspondence should be addressed.
These authors contributed equally to this work.
Electronics 2019, 8(10), 1190; https://doi.org/10.3390/electronics8101190
Submission received: 2 September 2019 / Revised: 28 September 2019 / Accepted: 13 October 2019 / Published: 18 October 2019
(This article belongs to the Special Issue Electric Vehicles in Smart Grids)

Abstract

:
Current trends are showing that the popularity of electric vehicles (EVs) has significantly increased over the last few years, causing changes not only in the transportation industry but generally in business and society. This paper covers one possible angle to the (r) evolution instigated by EVs, i.e., it provides the data science perspective review of the interdisciplinary area at the intersection of green transportation, energy informatics, and economics. Namely, the review summarizes data-driven research in EVs by identifying two main research streams: (i) socio–economic, and (ii) socio–technical. The socio–economic stream includes research in: (i) acceptance of green transportation in countries and among different populations, (ii) current trends in the EV market, and (iii) forecasting future sales for the green transportation. The socio–technical stream includes research in: (i) electric vehicle battery price and capacity and (ii) charging station management. This kind of study is especially important now when the question is no longer whether the transition from internal-combustion engine vehicles to clean-fuel vehicles is going to happen but how fast it will happen and what are going to be implications for society, governmental policies, and industry. Based on the presented literature review, the paper also outlines the most significant open questions and challenges that are yet to be solved: (i) scarcity of trustworthy (open) data, and (ii) designing a generalized methodology for charging station deployment.

1. Introduction

In the last five years, electric vehicles (EVs) have gained increased popularity [1]. There are multiple reasons behind that fact. Firstly, technology is constantly advancing, and considering research and development trends today, wide acceptance of EVs is a step in the evolution of public and private transport. Secondly, the transportation sector is considered to be one of the main contributors to CO2 emissions, one of the crucial factors behind climate change [2]. Wider acceptance of EVs, and of green transportation in general, is one of the possible solutions to lower those emissions that are part of the greenhouse gases (GHG), as stated by Saber and Venayagamoorthy [3]. Finally, from the economics point of view, EVs are sustainable (i.e., when they are sourced through renewable sources, such as solar energy, wind energy, or biomass energy) and the price of electricity is by order of magnitude lower than the price of fossil fuels (Granovskii et al. [4]) which is an important factor for consumers.
Even with the current growing trend of the EV market share, there are several main obstacles for EVs to release their full potential: battery capacity, battery price, charging time, and availability of charging stations. Nowadays, EV batteries have limited range that they can cover while being fully charged, and as the range increases, so does the price of the battery, which based on our literature review (see Section 4 and Section 4.1), is a major influence between potential EV owners. In 2014, the price for an average EV battery, i.e., 30 kWh, was around 12,000 USD and EVs powered by that kind of battery could travel approximately 100 km [5]. The forecast is that in the following years, due to technological advances, the price of batteries will significantly drop [6]. Apart from batteries, a particular focus is placed on charging infrastructure development, i.e., infrastructure used by EV owners to recharge their EVs. The main problem with charging stations is that their infrastructure is scarce, especially in underdeveloped countries [7] (e.g., Croatia has a small number of charging stations, and their placement and control is decentralized and unplanned). Also, before-mentioned factors (i.e., small battery capacity and underdeveloped charging infrastructure) together result in the phenomenon known as range anxiety. Neuber and Wood [8] define range anxiety as fear of running out of electricity before reaching an available (i.e., unoccupied) charging station (CS). Despite the increase in the number of EVs on the road, range anxiety is still one of the key negative factors for the potential new EV owners [9].
There are many studies related to EVs. Since the technology related to EVs is relatively new, the majority of those studies are in the field of electrical engineering. The first research papers date to mid-1960s and they are mostly progress reports (Hender [10]) and discussions on recent developments in the field of EVs (e.g., development of EV batteries and engine by Rees et al. [11]). Up until the 90’s, the concept of EVs was not widely accepted and research centered around them was scarce and oriented towards electrical engineering. In early 90’s, the first papers from the field of Information and Communication Technology (ICT) started to appear (e.g., Golob et al. [12], which deals with the problem of forecasting the market penetration of electric and clean-fuel vehicles). Nowadays, there are ever-increasing numbers of EV-related papers from many fields, including:
  • social studies (e.g., influence of sustainable transport on society and environment, such as Tanaka et al. [13]);
  • economics (e.g., market penetration and economical changes due to increase in electric power consumption, such as [6]);
  • informatics (e.g., computational algorithms for managing charging infrastructure, such as Pevec et al. [14], Babic et al. [15]);
  • telecommunications (e.g., protocols for communicating with charging stations or for payment, such as Buamod et al. [16] and van Amstel et al. [17]);
  • electrical engineering (e.g., development of low cost batteries, power electronics for the chargers, the motor driver, and improving existing technologies, such as Ruiz et al. [18] and Yilmaz et al. [19].)
This paper is a review which explores EVs from the aspect of three interdisciplinary studies—green transportation, energy informatics, and economics—as depicted in Figure 1. That perspective gives us a clear view of the current state and the future development of private transport. Even though green transportation is a generic term for zero-emission vehicles (e.g., cars, trains, and buses), within this work, we use the term green transportation to refer to battery electric vehicles (BEV) and plug-in hybrid electric vehicles (PHEV). Energy informatics is also a generic term that includes a broad field of research with a focus on information in energy systems. This paper only observes energy informatics studies that are strongly associated with EVs (e.g., charging of electric vehicles, the impact of EVs on a power grid). Economics is a highly relevant research domain since the EVs introduce great changes in the petrol industry and vehicle market. Previous three research fields will be observed from the data science point of view. Data science, according to the Van Der Aalst [20] can be defined as a combination of classical disciplines, i.e., statistics, data mining, databases, and distributed systems, for solving various challenges using domain-related datasets. The focus of this paper is an intersection of all four domains and to the best of our knowledge, this is the first review that aims to systematically provide such an overview of this interdisciplinary research field.
Figure 2 gives an overview of entities relevant to the interdisciplinary research targeted by this paper, as well as presents relationships among them. An EV owner, who charges her/his EV on a charging station that is connected to a power grid and interacts with other people is in the domain of green transportation. The flow of information from the owner to the power grid can result in an energy efficiency increase, what is the key idea behind energy informatics that studies how to use information and communication technologies to tackle the energy domain challenges. Advanced operations using information flow (e.g., predicting utilization with the goal to optimally allocate charging stations) us characteristic for the data science field of research.
The rest of the paper is organized as follows. Section 2 describes the methodology used to perform the review (e.g., keywords for querying several scientific databases, and filters applied). Section 3 describes methods through which EV-related data can be acquired as well as popular EV data sources, while Section 4 provides outlook of socio–economic factors of green transportation: EV market, together with different forecasts for future of EVs (e.g., market penetration, cost of EVs, or cost of EV batteries). The socio–technological aspect of green transportation is presented in Section 5. Section 6 proposes a research agenda by synthesizing open research questions, while Section 7 concludes this paper.

2. Review Methodology

We now explain the methodology used for the literature review. This review focuses on papers that were published between 2011 and 2018 since, as described in the Introduction Section, studies from earlier years are mainly focused on the electrical engineering aspect of the research area. The next filter is about the subject area: this paper focuses only on computer science and mathematics since the primary focus is placed on data science in the area of EVs and those two broad areas are employing data science relevant methodologies. Lastly, we only consider publications that are either conference papers or articles. The three scientific databases that were used are Scopus, the Elseviers’ database of peer-reviewed literature [21], and IEEE Xplore Digital Library [22].
The keyword that the search was based upon was applied to the title of a paper, the abstract, and keywords of the paper. The core search term was “electric vehicles”, which corresponds to our definition of green transportation (see Figure 1), and with all applied filters as described above, this search resulted with 5612 papers. Both search engines that were used have an option to search within results (i.e., within those 5612 papers), and since area of interest is intersection between four research areas (see Figure 1), search was further refined using three new keywords to cover the remaining three research areas: charging station, data, and market (see Figure 3). Note that the same paper can appear in multiple categories since e.g., one paper can have keywords data and charging station.
The “data” science part is covered with keywords: analysis (1140 results), prediction (370 results), and big data (81 results). Since the keyword analysis returned 1140 different results, that branch was further extended with keywords: descriptive, context, and behavior so we can differentiate studies that analyze the effect of surroundings (context analysis), and the effect of user behavior on EVs. This group of papers is especially interesting, since this group can cover more topics, including the ones mentioned before (i.e., charging stations and market).
The “market” part covers the area of economics. That branch of related papers is further extended with keywords: forecast and review with 129 and 479 papers with those keywords. Papers in this area are mainly focused on market penetration, battery prices, and the forecast of previously mentioned.
Lastly, the “charging stations” keyword covers the area of energy informatics, after further extending the search for keywords: deployment and location, in this branch of related papers, there were 182 and 264 papers respectively.
The detailed taxonomy of keywords used for the related work is depicted in Figure 3. Each child node is derived from the search results of the parent node (e.g., the keyword prediction returns 370 papers that are all between 1705 papers that were returned by search with the keyword data). After this step, relevant papers were hand-picked after reading their abstract and with regard to the number of citations and relevance for the area of interest.
All papers in this review that are published before 2011 are taken directly from the references of papers found with the previously described method, because of their high relevance and value for the respective research field. The final number of papers that were processed in this review is 96.

3. Role and Sources of Data in the Electric Vehicle Domain

Nowadays, data is one of the most important components in all fields of research which is not surprising as the amount of data generated is constantly growing [23,24]. For example, Kaggle is one of the most popular community-driven data science platforms, that provides numerous interesting datasets and organizes competitions in solving various data science problems [25]. The increase of the data that is being generated is especially significant in the field of transportation, since the transportation sector is responsible for one of its biggest evolutionary steps since the second industrial revolution—electrification of vehicles [26]. The increased flow of data greatly impacts the energy informatics field, as stated by Watson et al. [27,28]: the higher granularity of data the better information system can be developed for optimizing the energy consumption in highly complex systems. The data in this interdisciplinary research field can be obtained through different sources and with different methods. We now describe some of the most popular data sources and methods for data gathering that are used in EV-related studies.
Data repositories have a significant role in enforcing studies in this field since aggregated data they provide can help scientists to conduct the research without the need to perform data collection. Some of the most popular EV-related data repositories besides Kaggle include:
  • Alternative fuels data center [29] which contains data about EV sales and charging stations for each state of USA;
  • Alternative fuel vehicle data [30] which also contains information about alternative fuel vehicles for USA;
  • EV volumes [31] that contains informations about world sales of EVs; and
  • data.gov [32] which is a search platform for various datasets.
The valuable data can also be collected through publicly available APIs (application programming interface). Frequently utilized APIs in this research field are:
  • Nokia HERE API that is used for routing and calculating distances between geographical coordinates with many advanced parameters, similarly to Google Maps API and Open Street Map API;
  • Oplaadpalen API that provides information about charging stations around the world same as Open charge map; and
  • Vehicle API by edmunds that provides the data about vehicles (e.g., manufacturer or engine type).
Besides data repositories and APIs, surveys can also be valuable source of the data. For example, the National Household Travel Survey [33] is an organization that conducts various surveys and provides results via their Web page. If the regulated data is not available, researchers may opt to conduct surveys themselves.
The data can also be obtained through companies. The example of a third-party data provider is ElaadNL, one of the charging infrastructure providers in the Netherlands. It often collaborates with researchers providing them the data about their charging infrastructure transactions [34]. Another example is Renault that is also known to share their data with researches in order to analyze their vehicles’ potential [35].
Some researchers have developed their own methodology for data gathering. For example, the authors in [14,36] conceptualized data gathering of EV-related data by combining data provided by a company as well as several APIs. The other method is to use existing on-board sensors or to install new sensors for collecting and transmitting the data to the cloud for research purposes. Svendsen et al. [37] have developed previously described methodology to derive the EV driving patterns.
In contrast to the above-mentioned research examples, in which the data is available from the deployed system, researches of the energy systems of the future often use simulations to augment the existing data and to tackle interesting research challenges. For example, Babic et al. [38] have developed the agent-based simulation model which as a result provides the data about different business models (in article referred as parking policies) related to charging service. Studies by Ketter et al. [39,40] also employ simulation platforms to obtain data for solving various problems in the field of energy informatics.
One of the common divisions of the data is into primary and secondary data [41]. Primary data is the data collected with methods specifically developed for solving domain-specific problem (i.e., Table 1: Smart ED Platform and manual data collection methods), while secondary data is the data that is collected by someone other than the user (e.g., Table 1: data repositories, or the National Household Travel Survey).
All previously described data gathering methodologies are summarized in Table 1. Category ‘other’, means that the data is initially created to be private but can be shared with others for scientific reasons.

4. EV Market: Data for Modelling Economic Factors
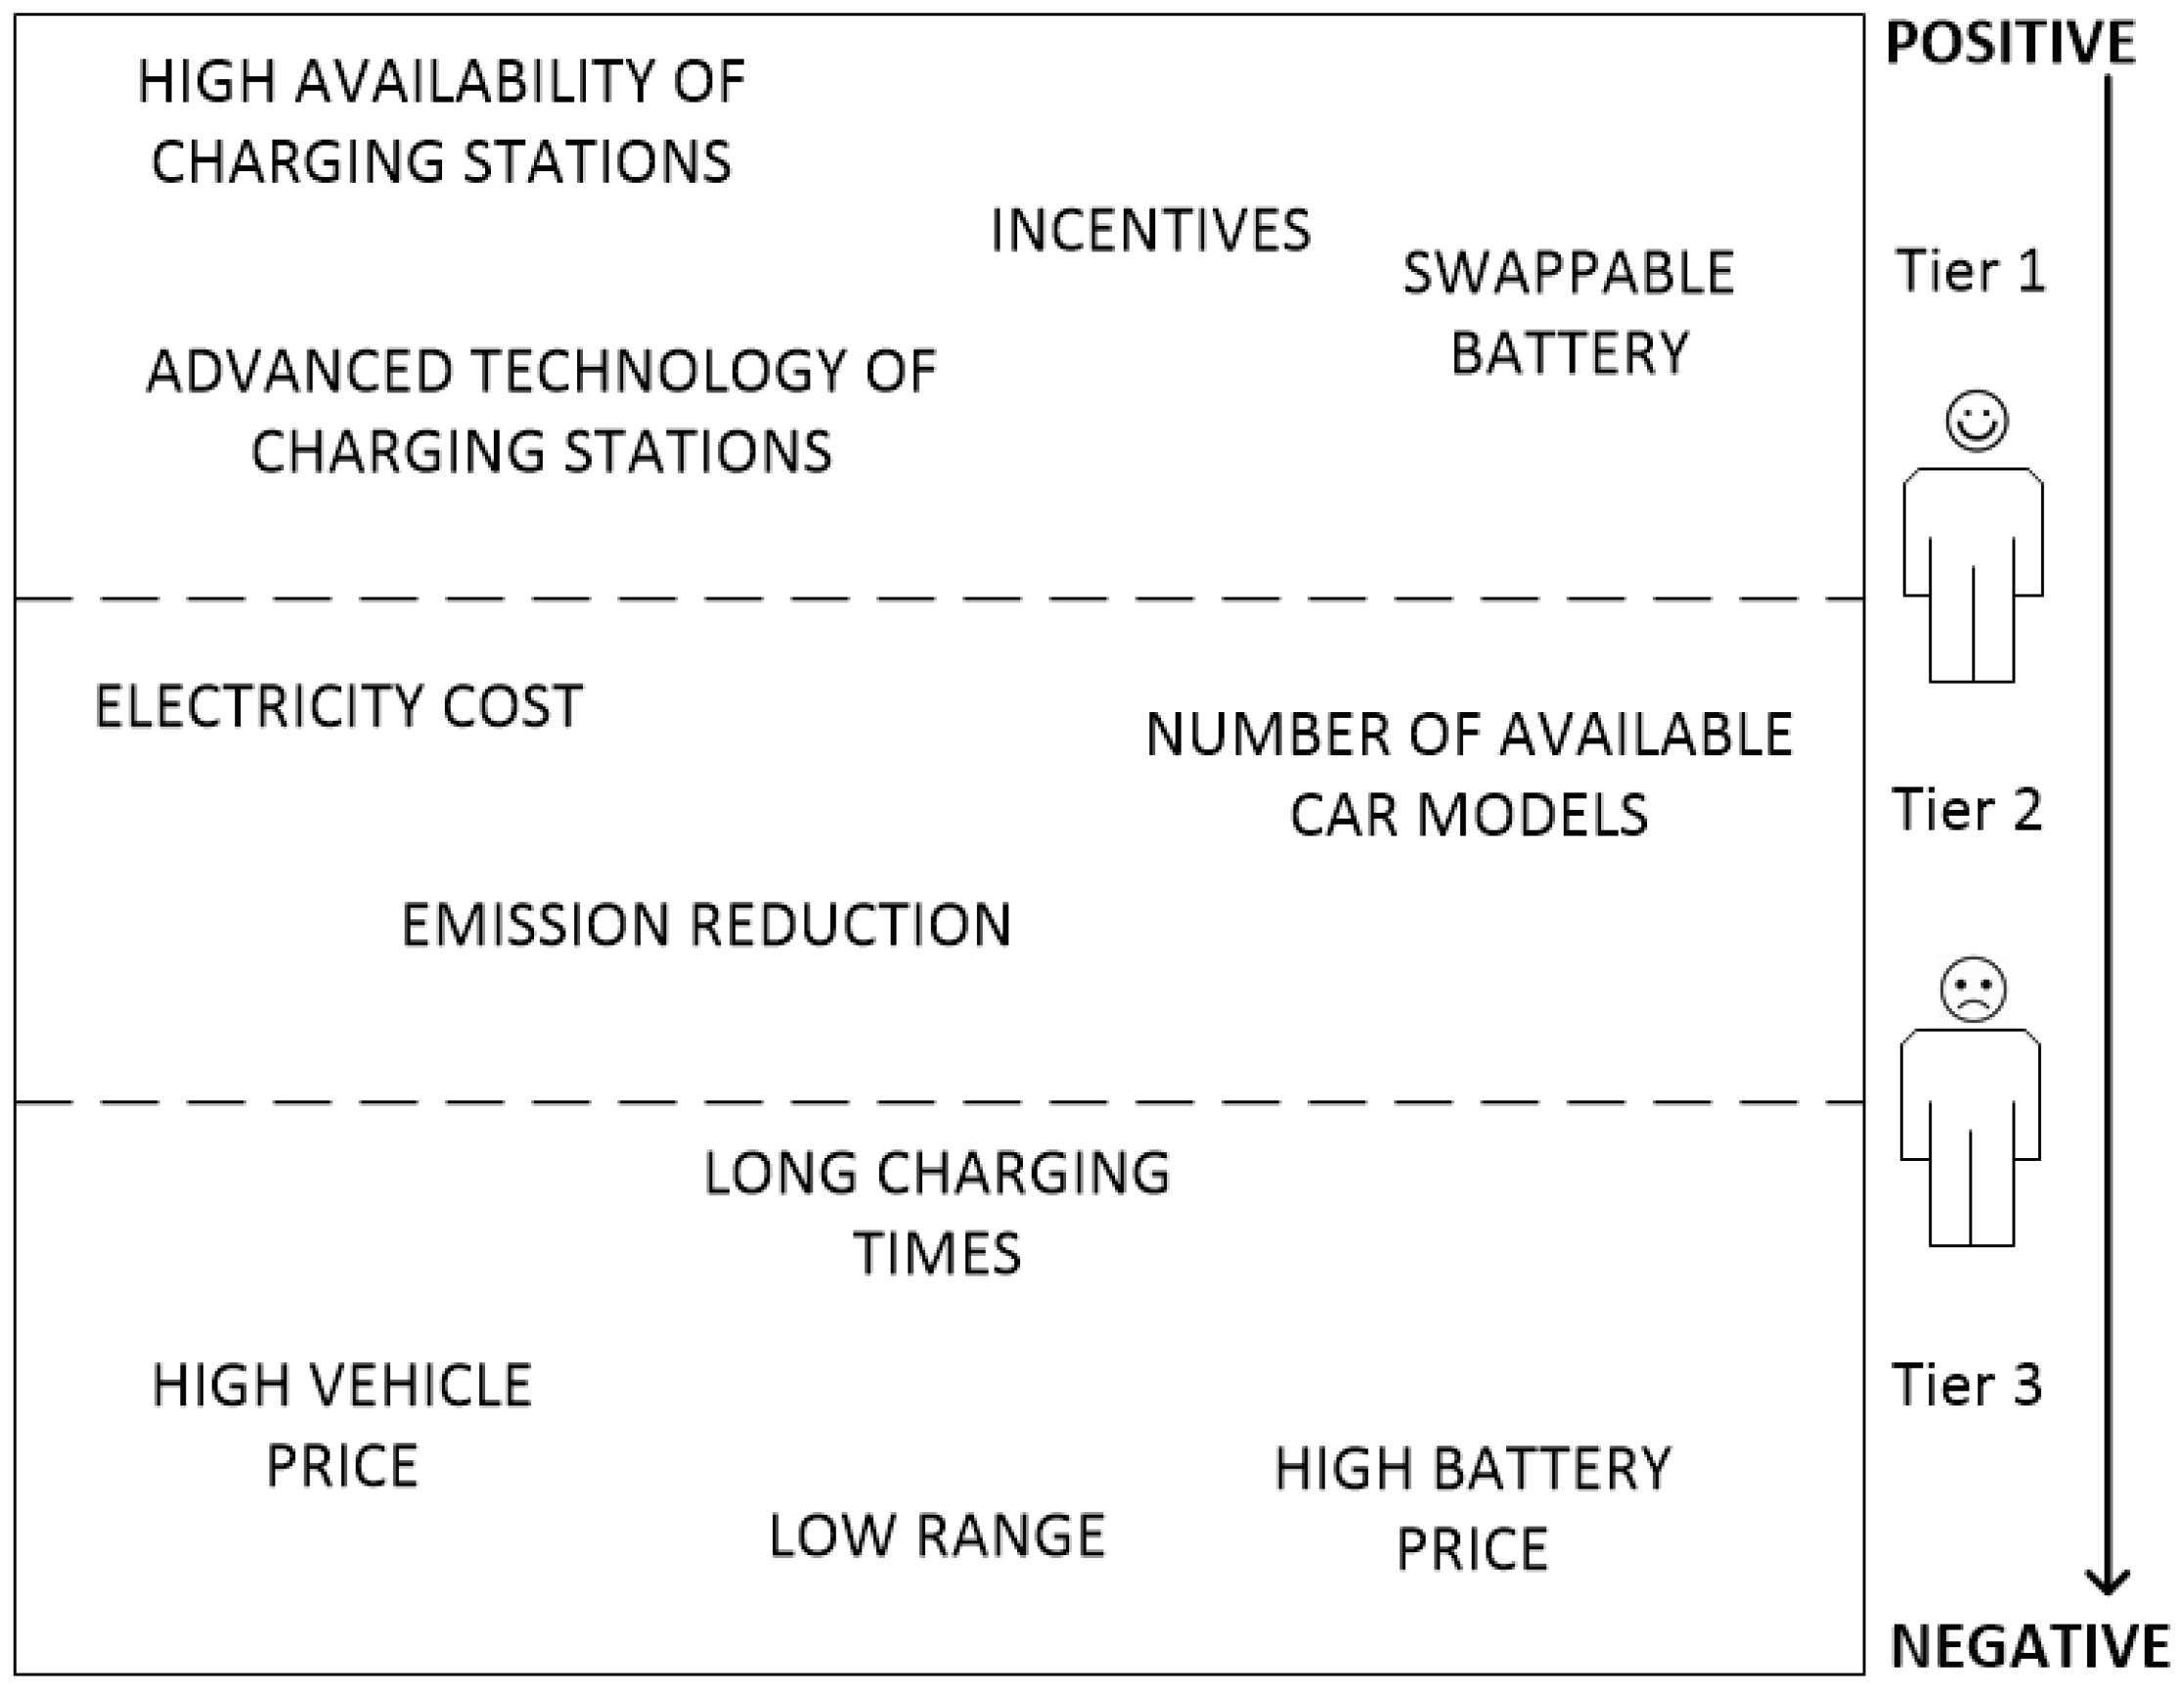
The EV market is an interesting field of research, because it does not only cover the sales number, but also innovations and current trends in the EV industry from the marketing perspective, (potential) EV owners motivations, constraints, and various forecasts (e.g., sales, battery capacity, etc.). Statistics about the number of EVs and prices are given through various reports on global and local scale.
The number of EVs is growing more and more each year, however the growth is not as steep as expected, as stated by Carty [55], United States, in 2009, invested over 2 billion dollars into development and subsidies for electric cars with goal to increase the number of EVs in US to at least 1 million until the end of 2015. Since at the end of 2016 the number of EVs in US was around 570,000 (Figure 4), one can conclude that the goal was not reached despite the forecasts. One of the main reasons behind that fact is range anxiety and the unfamiliarity of the potential EV owners with the electric vehicles, as we described in Section 4.1. More recent reports [56] suggest that in the 2017 and 2018 cumulative sales of BEVs and PHEVs was around 550,000 which almost doubles the number of EVs in the USA.
In contrast to well-established car manufacturers of internal combustion engines (ICVs), EV-only manufacturers such as Tesla, become well known in the last decade due to popularity of EVs [58], and they are partially responsible for speeding up the transition to EVs (i.e., competition with other car manufacturers was one of the factors for traditional ICE car manufacturer switching to EVs [59]).
Another fact that supports the claim that EVs are the future of private and public transportation is the end of ICE vehicles (i.e., removing ICE vehicles from the market). Great Britain and France set the year 2040 as the year when ICE vehicles will be removed from the market, and every vehicle that is sold will have electric motor [60,61,62]. Germany had a similar initiative; the plan was to ban ICE vehicles from the market by 2030, which was proven to be unrealistic and therefore declined [63]. Other countries that have the same initiatives to ban the ICE vehicles are either highly developed and environmentally friendly countries (e.g., Netherlands or Norway) or countries with great air pollution (e.g., India or China) [64].
Figure 5 depicts the popularity of EVs in the global market by the end of 2016. As it can be seen, despite Tesla’s advanced technology, due to the price of the competitors’ vehicles, it is not the most popular option. Instead, Nissan Leaf takes the first spot with nearly 40% market share, although, Tesla plans to change that with the introduction of their Model 3 with the best price-to-range ratio [58].

4.1. EV Acceptance

To increase potential EV owner’s familiarity with electric vehicles, research based on the potential EV owner’s preferences (e.g., range, speed, and comfort) is crucial. The following paragraphs describe studies for parameters that have the highest influence on a decision to buy or not to buy an EV in five regions with the highest EV market penetration. Figure 6 depicts the main findings of those studies. The focus is on the potential EV owners and each circle represents the factor that influences the potential EV owners (i.e., the inner circle is positive, while outer is the most negative).
Ko and Hahn [65] (2013) stated the importance of knowing the potential EV owner’s preferences about electric vehicles. They further research their preference through the questionnaire among 250 households at the end of June 2009 in Korea. They used six key attributes to asses the willingness to pay for an EV: battery price, holding tax, subsidies type, subsidies level, battery swappability, and availability of recharging infrastructure. As expected, potential EV owners are willing to pay more if EV has a swappable battery and if charging infrastructure is developed and easy to access, since that considerably lowers the range anxiety. The consumers also prefer lump-sum payment over the installment payment of subsidies. This research was of great importance for car manufacturers, governments, and the charging infrastructure providers, because it gives an insight into user preferences for adoption of EVs.
Wee et al. [66] (2018) looked into subsides and what effect they have on the EV adoption rate. Authors used rich data set from 50 U.S. states about semi-annual new EV registrations from 2010 to 2015 to develop subsidy-dependent models. Authors conclude that 1000 $ increase in the subsidies for the specific model in a specific state led to around 10% increase in that model registrations number.
Zhang et al. [67] (2016) presented a framework used to estimate the elasticity of the demand and supply of EVs. Authors took into consideration the price of EVs, their technology, and incentives (i.e., bus lane access, toll waiver, and charging station density). To test their framework, the data from the organization of actors in the transport sector in Norway was used. The data consists of BEV sales from 2011 to 2013. The authors confirmed their hypothesis that the price is a negative factor, while innovative car technology is a very significant positive factor. Incentives are also positive factors, except access to bus lanes, which in the case of personal consumers can be negative. There is also a significant difference between personal and business potential EV owners—business potential EV owners are less affected by price and technology. However, this work could be further improved by adding the estimated influence of other incentives (e.g., taxes, subsidizing the purchase of EVs) or different data, since Norway has a very specific EV market (i.e., around 25% of vehicles on the road are electric [6]). Authors also stated that higher density of charging stations has a high influence on potential EV owners; since 2013, battery technology has improved and range that EVs can cover has nearly doubled, which means that charging station density should not be critical, but instead smart allocation of charging stations is highly important.
As the studies before, research from Hidrue et al. [68] (2011) is based on the data from more than five years ago, collected using on-line survey with the purpose to asses the willingness to pay for electric vehicles. The data was collected in US for 2009. Attributes that were taken into consideration were: price, driving range, time to charge for 50 km driving range, acceleration, pollution, the fuel cost of a preferred gas vehicle. Attributes price and pollution are compared to a preferred gas vehicle. With statistical methods, authors found that driving distance, charging time, performance, and pollution (in that order) have a high impact on potential EV owners. The most important factor is saving (i.e., compared to gas vehicles, since the price of electricity is lower than the price of gas). Authors have explained that behavior with interest to save fuel since long drives consume more fuel. The survey also suggests that younger, educated, and people with a green lifestyle are more likely to buy a EV.
Hoen and Koetse [69] (2014) conducted similar research as previous authors. In the Netherlands survey was conducted among 15,221 households with one or more cars (2011). Attributes considered were: car type, price, monthly cost, driving range, recharge/refueling type, additional detour time to reach a fuel or charging station, number of available models, and policy measure. Results show that potential EV owners prefer more conventional technologies (i.e., gas-fueled cars), than alternative fueled vehicles. The main reasons behind that were limited driving range and long refueling time. The novelty of this work is the segmentation of participants into second-hand and new buyers, where second-hand buyers are more sensitive about price than new car buyers. This paper stated that low range and high refueling times are the main factors behind lower acceptance of EVs.
Tanaka et al. [13] (2014) explore differences between US and Japanese potential EV owners regarding alternative fueled vehicles. The dataset used was collected over an on-line survey, with around 4000 participants from each state. Attributes used in this model were: purchase price, fuel cost (compared to gas-fueled vehicles), driving range, emission reduction (compared to gas-fueled vehicles), alternative fuel availability (share from all refueling stations), and home plug-in construction fee. Results show that US citizens are more sensitive about price reduction and availability of refueling stations than Japanese, while they are similarly influenced by a driving range and emission reductions. This work also presents an interesting overview for 4 States in US: California, Texas, Michigan, and New York. California has around 50% higher willingness to pay for price reduction than the other three states. The authors concluded, that in the future, due to technology advancement, the share of the alternative-fueled vehicles on the market would be doubled.
Smith et al. [70] (2017) conducted similar research as the studies before, but in the year 2017. Using a survey platform, 440 households in Australia were questioned about their preferences in a vehicle choice. As much as 48% answered that electric vehicle is their first choice of vehicle. The most influential negative factor on the potential EV owners is not the low range (i.e., small battery capacity), instead, it is recharging infrastructure availability. As opposed to the previous studies that concentrate assumptions on the social-demographic factor, this research stated that far more important factors are the attitude towards the environment and the technology.
Between newer studies, the notable ones, beside the study by Smith et al. [70] is study by Wang et al. [71] (2017) and Anderson et al. [72] (2018). Wang et al. [71] in their paper presents the incentives for the purchase of EVs that are currently active in China and develop a model for the forecast of EV acceptance based on the linear regression. The data used in this research is sales numbers from 41 pilot cities and from the 37 cities with no purchase restriction. For each scenario (i.e., 41 cities and 37 cities), linear regression was performed for BEVs and PHEVs with independent socio–economic variables (e.g., population size, income per capita). The only common factor that was proven to be extremely significant for all cases was the density of charging stations. Other notable factors that influence the decision to purchase the EV in this research are education level and license fee. Anderson et al. [72] applied survey methods to analyze EV owner’s preferences about the charging infrastructure. Authors concluded that more public chargers are needed and that slower chargers are acceptable on more visited locations, while fast chargers are needed on less frequently visited locations.
Previous studies are summarized in Table 2, with factors that were taken into consideration, and the factors that have proven to be the most influential for the (potential) EV owners.

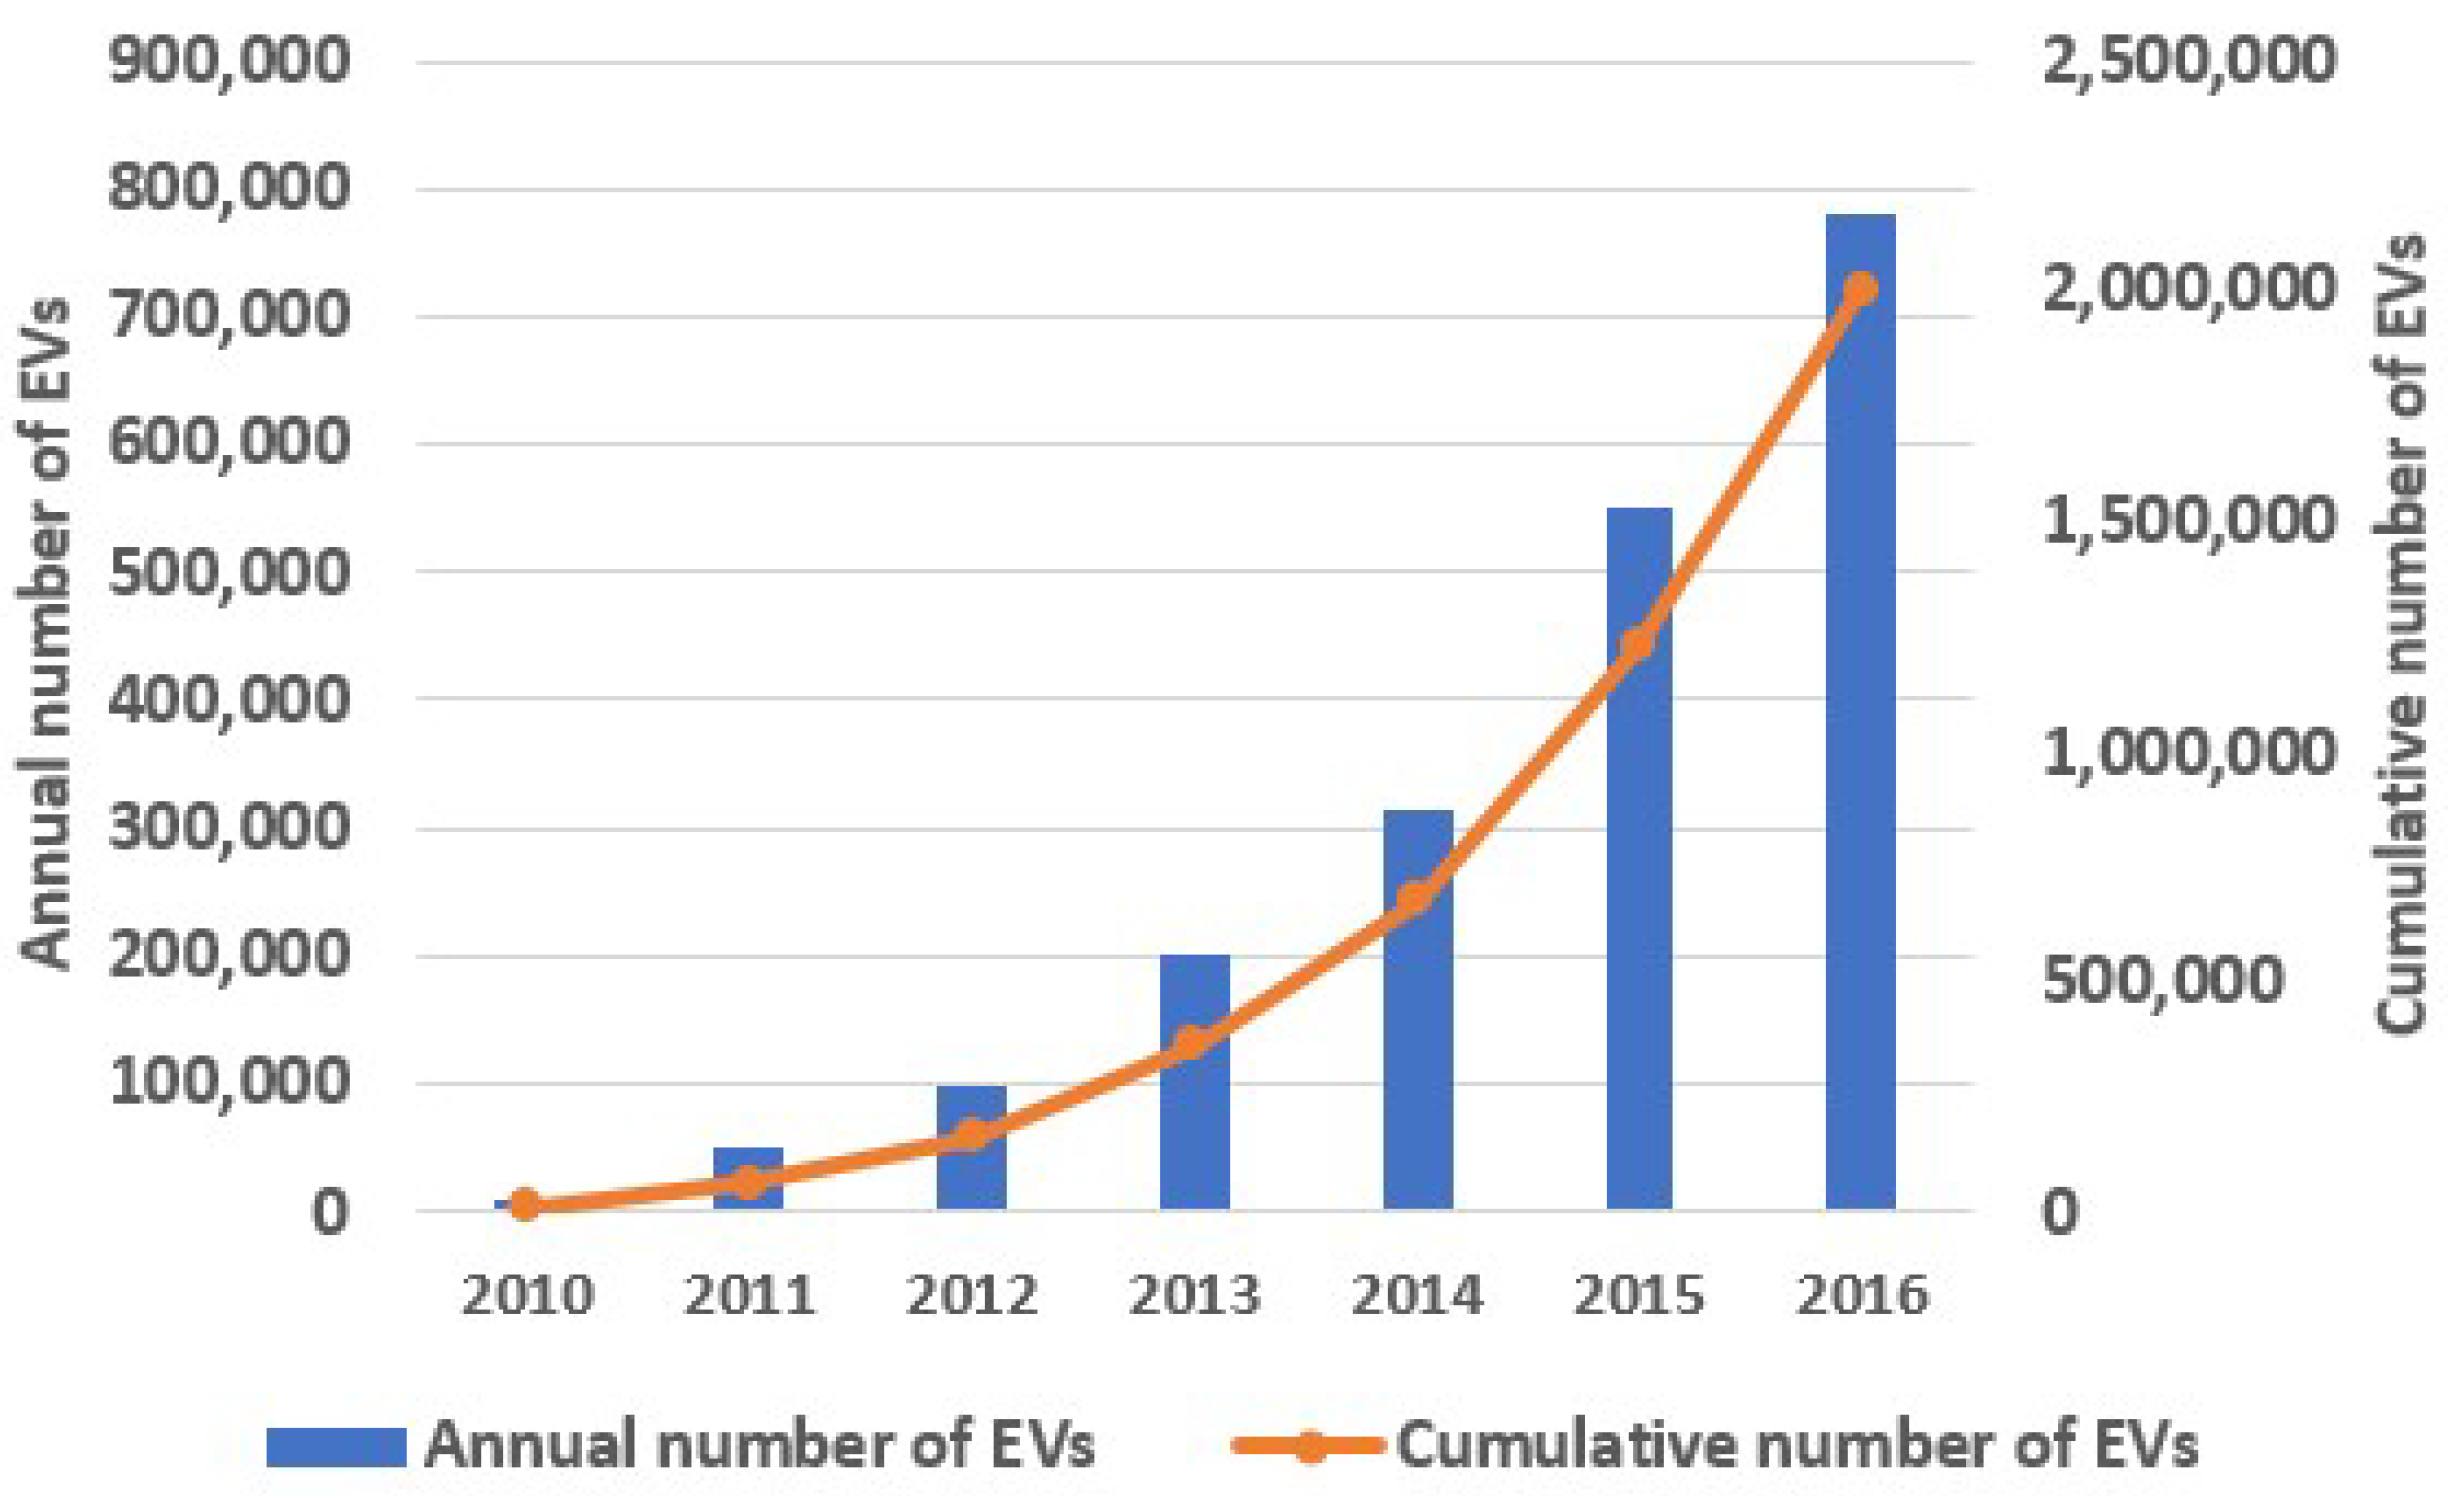
4.2. EV Future Sales

When it comes to exploring future sales of EVs, most of the studies in this field use either agent-based modeling or conjoint analysis methods, very few studies use other methods.
Agent-based modelling is a computational method that observes interaction and evolution of complex objects (i.e., agents) [75]. Agents enable reproduction of complex social interactions, which other methods (e.g., game theory or other equation-based models) cannot as stated by Janssen [76]).
Agent-based modeling was used in by Yang et al. [77], Sullivan et al. [78], and Shafiei et al. [79]. All those studies define multiple agents: consumer population and car population. Studies [77,78] additionally define government and gas supplier agents, while in [77] charger and grid operators are also defined.
Besides the agent-based model, Yang et al. [77] define the system dynamics model that enables authors to analyze the impact of various parameters on the evolution of the defined EV ecosystem. On the case study of China, authors derived results for both models. Firstly according to the results of the system dynamics model, with time, ownership of EVs will grow, while expectedly, ownership of conventional vehicles will drop. Agent-based modeling is used to simulate EV adoption in three types of regions: developed, middle-developed, and underdeveloped. According to the simulation, by 2030, the market share of EVs in developed and middle-developed regions will be between 80% and 90%, while underdeveloped regions will have share of 30%.
Sullivan et al. [78] have used agent-based simulation for the forecast of PHEV adoption rates on the United States market. Complex model, although again without social interactions, provides accurate results for near-future prediction. Market penetration is predicted for 2015 and for 2020. For 2015 results show that sales of PHEVs could reach 2–3% while market penetration would be 1%, which is accurate for US market. The prediction for 2020 is that sales could reach 4–5% while fleet penetration would reach only 2%. This model also explores the role of subsidies, without them, the penetration on the market would be below 1%.
A similar study was conducted using the case study of Iceland by Shafiei et al. [79]. This model does not take into consideration complex dependencies between car manufacturers, energy grid, providers of charging infrastructure, or gas suppliers. Instead, this paper is more focused on the interaction between (potential) EV owners and factors that influence them: marketing, word of mouth, and indirect word of mouth. Predictions developed with this model vary from market share of 70% all to 100% by 2040, dependant on the price of gasoline and the price of EVs.
Another group of studies is about conjoint analysis (i.e., survey-based statistical technique) and choice-based modeling. studies in this field date all to the late 1990s (e.g., Segall [80]), those research results are not applicable today because of different levels of knowledge about EVs. Despite that, those studies have greatly influenced some of the notable studies today.
Glerum et al. [35] have research what influences sales of Renault EV in Switzerland. Their research is based on a survey conducted in 2011. The survey was structured in two phases: stated preferences (i.e., information about vehicles in the respondent’s households) and choice situation (i.e., three different cars similar to their own). To interpret survey results, the author used statistical models: logit and latent variable model. The framework itself is not generated towards annual forecasting, but instead for forecasting market share when certain parameters are changed (e.g., price of EVs, monthly cost, subsidies, etc.). Similar work that does not focus on annual growth rates to 1981, and uses survey where participants ranked 16 cars. Beggs et al. [81] also used logistic model to interpret results.
Using the data from the same year as previous authors, Lebeau et al. [47] analyzed the adoption of BEVs and PHEVs in Belgium based on conjoint choice modeling. The novelty of this research is in the fact that authors modeled the future choice as the weighted function of car utilities (e.g., speed, acceleration, airbags, etc.). The forecast is that the number of PHEVs will be higher than the number of BEVs in the near future (i.e., the prediction was made up to 2030). The baseline is the penetration in the time research was conducted, which was around 4.85% for both PHEVs and BEVs. Prediction for 2020 is 13% while for 2030 it is 45%.
Another work that introduces novelty is studied by Jensen et al. [46]. The authors of this paper created the survey with participants before and after driving the EV. The survey was conducted in Norway, Denmark, and Netherlands since they represent the most developed countries in Europe (EV wise). With basic model assumptions (i.e., assuming EV technology will only improve, which would lower the EV price) model resulted in the prediction of 40% market share for 2020. The problem with this model is the assumption, new technologies do not mean necessarily lower prices. Also, the prediction is consistent with the penetration today, which for Norway is around 30%.
Between notable studies are two papers from 2012, Higgins et al. [44] and Eggers [45]. The first one was conducted based on the survey in Australia. It combines methods of choice modeling, multi-criteria analysis, and Bass diffusion model. The framework is used to analyze adoption patterns in consideration of factors that are important for the potential EV owners. The developed framework estimates the penetration of 45% by 2030. This research also gives insight into the adoption of EVs based on monthly income. The second research is based on the data from Germany, and same as the first research uses a combined method for prediction, choice and diffusion modeling. Predictions from that model are that penetration EVs and PHEVs will be around 55%, which is not the case. The model would have more reliable results if it included human interaction factor [82].
There are two distinguished studies that use none of the methods used above. The first one is a paper by Becker et al. [84], in which the author used simple Bass diffusion that is typically used to describe the process of how new products get adopted. The result is the most interesting part of that research, dated to 2009. It forecast the number of EVs on the US market to approximately 600,000 by 2016, which is accurate according to the global EV outlook for the year 2016 [6]. The reason behind that accuracy is that authors did not only model potential EV owner’s behavior, but oil prices, internal combustion car cost, and other parameters. The article goes further in time, and predicts the 64% of sales and 24% of the fleet (i.e., around 2.8 million) will be EVs by 2030. Other work is Zhang et al. [83]. This research uses multivariate and univariate time-series models for forecast based on the 60-month sales data in China, from January 2011, to December 2015. This work besides the forecast of EV market growth presents the comparison of the two before mentioned models (similar to Du and Witt [85] in the domain of tourism demand). Since the univariate model is used for short term forecast, in contrast to multivariate model (Chayama and Hirata [86]), that methodology is applied in this research too. For the short term forecast (i.e., end of 2017, around 350,000 EVs should be sold). For long term forecast (i.e., 2020) more than 1 million EVs should be sold. Besides from the economic point of view, research from Li et al. [87] forecast the number of EVs with the goal to balance the demand for electricity supply.
The majority of studies in this research area are from developed countries that are focusing their research and development on renewable energy sources. Since the EV industry is not yet fully developed, the market penetration forecast is mainly for the long future (i.e., 15+ years). More details about the main findings are summarized in the Table 3.

5. EV Infrastructure: Data for Modelling Technical Factors

The previous section dealt with challenges in EV market penetration and acceptance (see first three actors in Figure 2). This section summarizes the studies with the main focus on charging infrastructure, vehicle-to-grid technologies, and users’ driving patterns concerning charging and energy balancing.

5.1. Batteries

Batteries are the crucial part of electric vehicles and they are directly connected with EV acceptance rate, as described in previous paragraphs (e.g., range anxiety, charging infrastructure, price, etc.). There are many studies relevant to EV battery, although, not many in the field of data science. The most information about battery capacities and prices are available through global reports and price lists. However, there are some studies about the second use potential of EV batteries like Nauber et al. [88] and [89]. Both works are motivated with restrictions for market penetration growth due to battery cost. The first work is oriented towards defining second-use for retired EV lithium-ion batteries which could partially recover the cost of the battery. Authors concluded that using retired EV batteries as uninterruptible power supply, instead of lead-acid batteries, is more effective and would result in payback through seven years. With various factors in mind (e.g., price of new battery or price of repurposing), authors calculated that the price of the repurposed battery would range from 38–132 $/kWh. The second paper is earlier work of the same authors where they introduce their plan to research the second-use of EV batteries.
Ahmadian et al. [90] reviewed the various studies on battery degradation models and compared them with each other. Ahmadian et al. concluded that degradation of batteries is primarily caused by two factors: (i) time degradation and (ii) cycle degradation. Time degradation is dependant on temperature and the age of the battery, while cycle degradation is dependant on the number of charging cycles and the depth of discharge. The main contribution in research by Ahmadian et al. is a conceptual framework that enables the use of batteries degradation models for smart grid studies.
From the market perspective, the best situation of current trends is given in the report [6]. Figure 7 depicts the prices of battery in from 2010 to 2015. As can be seen, the prices stagnate from 2013 to 2015, those prices are relevant even today. Prices stay the same because of physical restrictions (e.g., materials used and dimensions) and because of the lack of mass battery production. Tesla plans to change that with its Gigafactory that would mass-produce the batteries [91]. To produce battery with higher capacity, one of the options is to build a larger battery. The problem with large batteries is safety, the larger the battery is, the greater the chances are that it will break. Ruiz et al. [18] extensively reviewed the standards for safety testing of batteries.
The rest of the studies that do not belong in the electrical engineering field are closely related to the prediction of the state of charge (SOC) and prediction of available range in the future based on various factors and past development.

5.2. Charging Stations

Charging stations are in this state of development, underdeveloped [93,94]. They are an important factor in the acceptance of EVs as a primary transport solution, since the problem of range anxiety is closely dependent on the number of charging stations [9]. Charging stations can be categorized based on the speed of charging and ownership. Based on the charging speed chargers are divided into four types. Level-1 charging is a synonym for charging a car via the household outlet of 120 volts. Level-2 charging chargers at the 240 volts and provides five times faster charging than Level-1. Level-3 and Level-4 charging is also known as fast-charging since it provides energy for approximately 125 miles per hour, depending on a type of vehicle. Based on the ownership, the charging stations can be divided as private chargers and public chargers. Private chargers are considered those that are installed in someone’s home or as private ownership of someone (e.g., private firm parking). Public chargers are available to anyone, and they are the main focus of the majority of researchers, since, data related to public charging stations are more accessible than for private chargers [95]. The future of charging stations is in the wireless chargers that can be placed under the road and ensure charging even while driving [96].

5.2.1. Deployment

Charging station deployment is one of the most challenging tasks, since it is not enough to simply place charging station somewhere, it is important to strategically place charging station on the right location. This subsection will provide survey of studies and their methods towards achieving that goal. Most of them can be divided into two categories, weather they use real-world data or simulation data, majority of studies in this field are either optimization problems or simulation, as can be seen in Table 4.
He et al. [104] proposed a mathematical framework for the macroscopic deployment of charging stations taking into account the equilibrium between demand and supply of energy. User’s desire to choose a destination was formulated based on: time, price, and availability of chargers. Supply-side was formulated as the price of providing electricity. This paper focuses on a large scale charging station (CS) deployment and this framework is able to answer only how many CSs should be deployed in a certain region—specific location of CS cannot be determined.
Ip et al. [52] implements a two-step approach to decide optimal location for new CS. Although research methodology is similar to the one authors of the previous paper used, this one provides a more accurate location for CS. The first step is to determine pieces of roads that are utilized the most and to divide them into x–y grid. The second step is to cluster those squares in the grid based on the intensity of road utilization and to apply an optimization algorithm to decide the most suitable cluster for CS deployment. This method uses the data generated by various sensors on the road (assuming there are sensors) and the limitation of this study is that collecting the data needed for calculations is impossible out of specifically developed areas. However, this work proposes the framework that itself is general and can be applied whenever there is a need for deciding the optimal location for something (e.g., train station or restaurant).
Frade et al. [105] on the case study of Lisbon, Portugal, implements an optimization model (i.e., maximize coverage) for CS deployment taking into account coverage of a single charging station between 400 and 600 m walking distance and the demand for CS. To estimate the number of EVs, regression was used with parameters: the size of household, building type, age, education, and employment. With those parameters, an accurate model for the number of cars can be derived, but the number of EVs was further estimated with information about EV penetration. The demand for charging stations was calculated independently for day and night time, since those two time intervals have completely different patterns. This work, however, does not account for increasing EV penetration, and for factors that influence utilization of charging stations (e.g., places of interest), therefore, charging stations could be underutilized.
Chen et al. [100] deals with the charging station deployment problem from the perspective of car parking. Firstly, based on the data from Washington state, parking space and duration were determined. This information was used to build a regression model for zone-level parking demands and trip-level parking demands. The last step is using mixed linear integer programming to chose the optimal place for charging stations based on minimization of price and distance between zones that have great parking demand. This model has proven to be fast and reliable, but it does not include data only on electric cars—for parking location and duration. The location of existing charging stations has great influence on EV owner parking behavior. As opposed to previous studies, this one besides mathematical programming uses regression for forecasting demand for zone and trip level parking, which is valuable information for different fields of research.
Xi et al. [106] have developed a model for deploying charging stations in a way that maximizes their use by private EV owners. The model does not use real-world data concerning charging stations, EVs, or driving patterns, instead, based on the number of population and households, authors have estimated the number of cars, and with the 1% EV penetration—number of EVs. The trip data was artificially generated by Mid-Ohio Regional Planning Commission. Using the integer programming optimization technique, the authors calculated an optimal number of charging stations in each traffic analysis zone. Another finding of this study is that a combination of level 1 (i.e., 1.4 kWh) and 2 (i.e., 4 kWh) chargers is the most efficient, but with not enough funds, only level 1 chargers should be deployed.
Yan et al. [53] tested their optimization method on the case study based on the 30-day taxi trace with 315 taxis and 4638 landmarks in Rome. Optimization methods goal is to maximize the flow of vehicles, with constraints to budget, charging availability, EV battery capacity, and energy consumption. With their algorithm, under different budget scenarios authors calculated the optimal number of charging stations at each landmark. This work has a simplified environment, where authors assumed that the cost of deploying charging stations is the same for all charging stations, and that cars and drivers are homogeneous, which is not the case in reality. There are many social factors that influence the driving patterns, charging stations are only one of many.
The following studies, while also using optimization methods, base their optimization techniques on genetic and greedy algorithms.
Research by Hess et al. [101] aims to decide the optimal location of a charging station based on the genetic optimization algorithm. The only data that is used in this research is the map of Vienna, parameters of electric cars, and the location of gas stations - this research as initial location of charging stations assumes the location of gas stations. The optimization function used is to minimize the whole trip time of an electric vehicle owner. This research extended the well-known traffic simulation tool SUMO with electric vehicle behavior. This work could be further improved by taking into account positions of current charging stations instead of gas stations.
Mehar and Senouci [102] are proposing a genetic algorithm that takes into consideration area traffic density, land cost, infrastructure cost, investment cost, transportation cost toward the CS, charging station capacity and, energy grid capability. To optimize the placement of charging stations, authors propose to minimize two objective functions: minimize the objective cost and minimize the transportation cost. The algorithm was tested on a simulation that describes the traffic in Cologne (Germany) from 6 a.m. to 8 a.m., since that time window is considered to be peak hour. The algorithm is fast but lacks some context information. It does not take into consideration the proximity of charging stations to public transport, or shops. Even if traffic is dense in a certain area, the population of cars in that area does not have to be comprised of EVs (i.e., authors assumed EV rate).
As opposed to previous studies, research by Sadeghi et al. [103] has a goal to optimally place fast chargers in the urban area. Fast chargers have the capability to fully charge EV battery in 20–30 min [110]. The approach is based on genetic optimization algorithm, with no EV related dataset. Authors have defined six test scenarios: minimize all cost, ignore land cost, ignore the cost for EV owners, ignore the electric grid loss, no electricity charge to CS owners, private sector invest in CSes. Authors decided to set the minimal distance between charging stations to 3 km, and considering previous scenarios they proposed optimal positioning of fast-charging stations. This work is greatly significant considering the amount of research about deploying fast-charging stations. Xie et al. [107] are also dealing with the challenge of fast charger deployment. They tackled the challenge in three phases: (i) 2015–2019, (ii) 2020–2024, and (iii) 2025–2029. Authors developed optimization-based model that serves as a decision support system for policymakers for where, when, and how many fast chargers should be deployed.
A study by Vaziveh et al. [99] is using real-world data collected through the cell phone data over the Boston area, and with that, whole trip of a user was known. The goal of that research was to minimize the aggregate distance all drivers have to drive, from the end of their intended trip to the nearest charging station. Methods used to achieve previously described goal were: greedy and genetic algorithm. With those heuristic algorithms, near-optimal locations of charging stations can be found. Although the algorithm used in this paper includes the parameter charging station coverage, which limits the number of charging stations, it does not include the cost of new charging stations, or contextual information if a user really needs to charge on the end of the trip, which makes this model currently not reliable. While this work uses a genetic algorithm with the same goal as the previous two studies, this one builds the model with real-world data.
The next three studies are based on machine learning techniques. First, two uses only clustering, enhancing it with mathematics. The second research uses out-of-the-box machine learning algorithms to forecast utilization of charging stations and decide where another one could be deployed. Naturally, both studies use real-world data.
Andrenacci et al. [97], used the demand-side approach to decide the best placement for new CSes. Data used in this work is real traffic flow (i.e., GPS data) from 6% of privately owned cars in Rome. The assumption is that all of those are electric (i.e., switch to electric transportation). All destinations that ended in Rome’s urban area are further clustered in sub-areas where charging infrastructure is associated with the center of a cluster. The next step is to mathematically calculate the demand for energy, the sum of all energy spent to arrive at the goal, and that is the number of CSs needed in that area. This method has high-quality data, and valuable division of Rome urban area into sub-areas. However, the number of CSes is not reliable, since the assumption is that all vehicles are electric (i.e., full conversion to electric transportation) and that all vehicles can satisfy their energy needs without queuing. This work does not provide an exact location where CS should be deployed, rather the number of CSs in a specific sub-area.
Momtazpour et al. [98] used a synthetic dataset because of the lack of real-world data. Authors take into consideration the duration of charging and decided to place chargers in locations that people visit for an extended period of time. The region of Portland was divided into three clusters: high electricity load-low charging need-low stay duration, low electricity load-high charging need-high stay duration, and low electricity load-low charging need-low stay duration. Based on the cluster description, the second cluster is ideal for deployment of charging stations: it can handle electricity load since it is low, there is a need for more chargers, and people stay there for an extended period of time. This work included places of interest in their research and the energy load making it significant and highly valuable.
Pevec et al. [36] has developed a real-world, data-driven, generic framework for extending EV charging infrastructure. The data used in that framework is from ELaadNL, one of the biggest charging infrastructure providers in the Netherlands. The data consist of all transactions for four consecutive years (i.e., 2013–2016). The first part of the framework clusters existing charging stations in clusters based on the distance between them with the hierarchical clustering method. After charging stations have been clustered into zones, in each zone utilization of charging stations was calculated and used as the dependent variable in the machine learning algorithm. The framework uses machine learning algorithm XGBoost to predict utilization when certain parameters are changed. Parameters taken into consideration were: places of interest, EV penetration, time of day, number of charging stations in the defined zone, number of competitors charging stations, and is it weekend or weekday, since it has a drastic effect on charging pattern. The third part of the framework based on the optimization function provided decides the best zone to place another charging station. The precision of the framework is (i.e., the place where another charging station should be deployed) is dependant on the distance that clusters are based on.
The last category in research in this field is simulation-based research. Those research do not use real-world data, only some information to tune the simulation. All the relevant data is generated by simulation itself.
Sweda and Klabjan [108] have developed and described an agent-based decision support system for the placement of charging stations. Although, they use real-world data for prices and sales numbers of electric vehicles, most of the parameters are artificially tuned (e.g., driving patterns, state of charge, etc.) with randomness. This study manages to implement social interactions between car owners and with that it is possible to simulate the decision to buy EV and increase the EV population in the system. Another feature of the model is to compare sales of alternative fuelled cars with a dependency to fossil fuel prices. This work is based on the area of Chicagoland. The model is tested against two different proposed charging station placements. When comparing results with the current state in that area, improvement can be noticed. The major downside of this approach is that it does not offer a possible location for CS, it analyses the placement provided to it. An updated version of the research is provided in a full report by Sweda and Klabjan [109].
Authors Lu and Hua [51] developed a location-sizing model for the charging station. The goal is to optimize the location and the size (i.e., number of plugs) of a charging station, based on the demand. Their model is based on queuing theory and it is a continuation of earlier work by Capar et al. [111].
As we mentioned before, range anxiety is one of the greatest challenges left to overcome in order to raise EV acceptance, and it is closely related to the development of charging station infrastructure. Even though the capacity of the EV battery is nominally enough for intra-city traversal, the familiarity with the existing gas station infrastructure greatly influences potential EV owners in the decision not to buy an EV. Pevec et al. assessed the range preferences of potential EV owners considering the settlement hierarchy based on the settlement population [112]. As for the inter-city traversal, most of the EVs do not have sufficient battery capacity and this is the prime example of the range anxiety. One of the solutions considered by the researchers is the deployment of charging stations along the highway near existing gas stations, since they have necessary infrastructure [113,114].
Another major challenge in the field of the charging station deployment is the capacity of electric power distribution networks capacity. As mentioned in Section 4 the number of EVs is expected to grow, and that could cause major issues since the demand for electricity could be higher than the supply. Wange et al. [115], Abdalrahman and Zhuang [116], and Masoum et al. [117] took an approach to the charging station development considering previous limitations, i.e., ensuring reduced power loss of distribution systems.
In this Section the problem of charging station infrastructure development was investigated, and one of the conclusions is that the behavior of EV owners is extremely important for strategical planning of the charging infrastructure. Therefore, the next Section will explore user charging behavior.

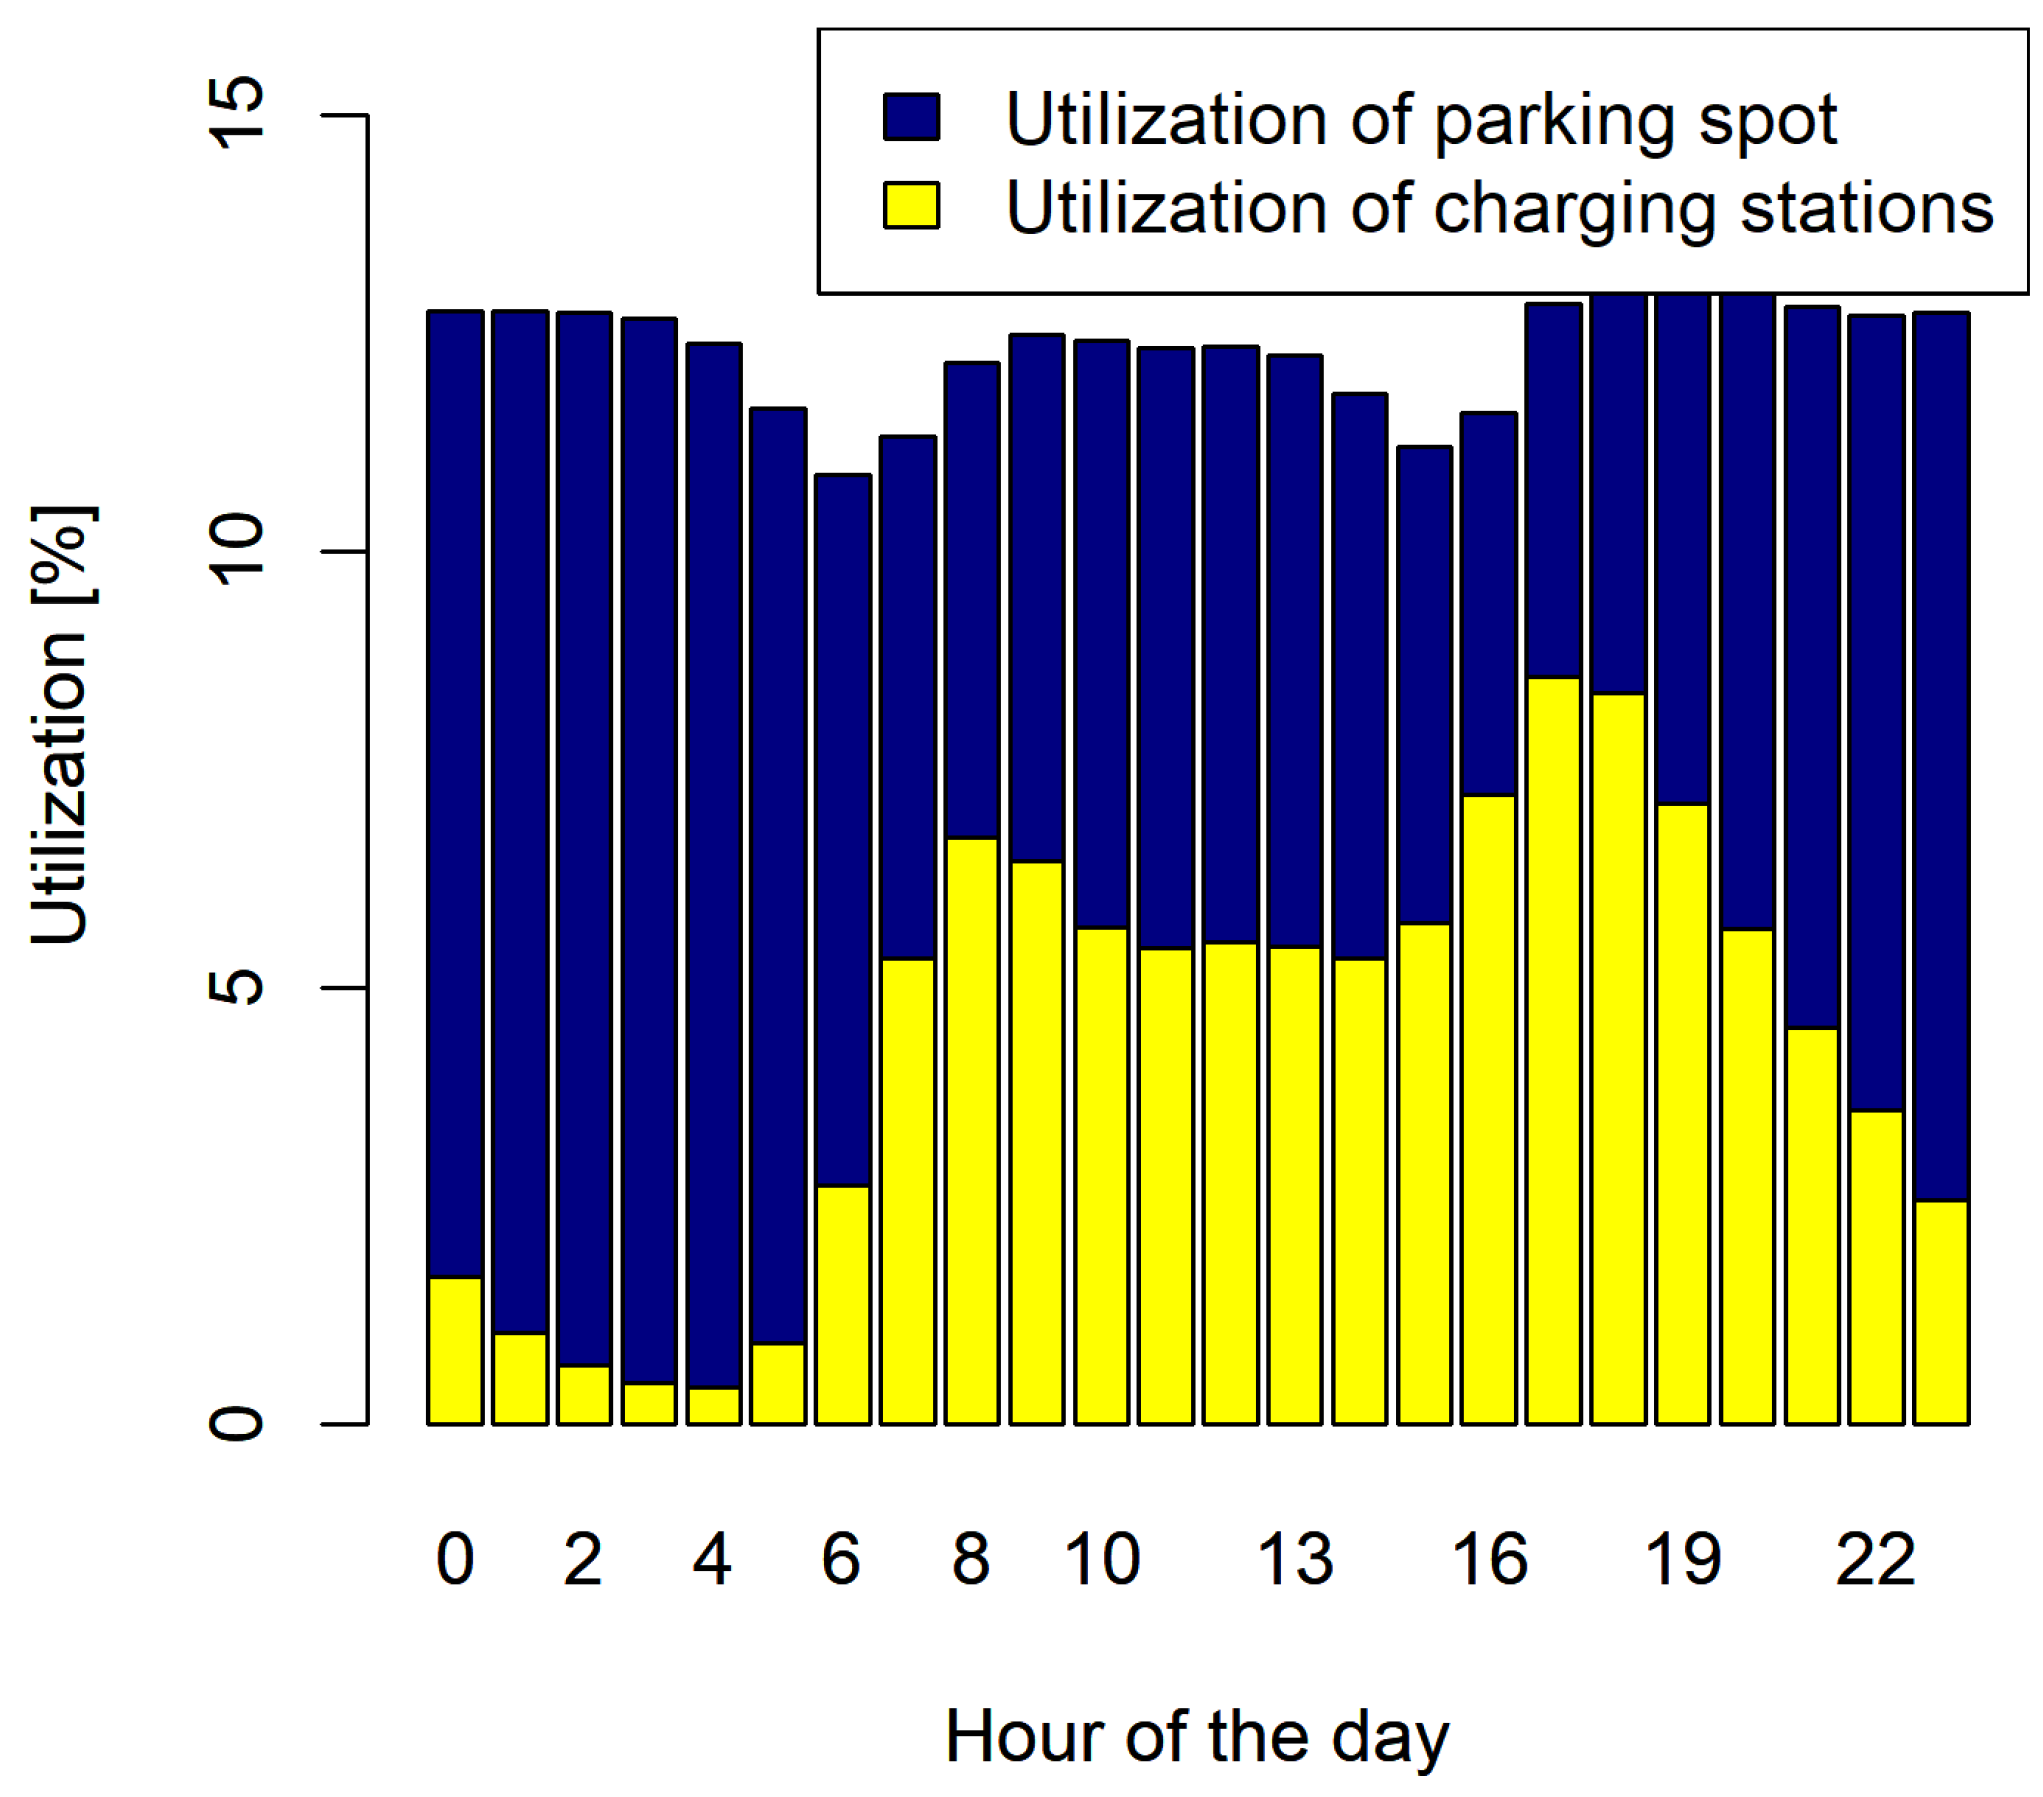
5.2.2. User Charging Behavior

Section 4 explored the behavior of potential EV owners, and assumed the behavior of the EV owners based on the behavior of the owners of traditional fossil-fueled vehicles. This section explores the user behavior in more detail, since it is not only important for the charging infrastructure providers and the EV manufacturers, it is also important for the power grid management.
Qian et al. described [118] four different scenarios of user charging patterns with the goal of modeling the load demand of the energy grid. The first presented scenario was uncontrolled domestic charging which is characterized with no incentive for owners to charge off the peak hours. The second scenario is uncontrolled off-peak domestic charging where incentives to charge the EV in off-peak hours have been introduced. Smart domestic charging is defined as charging accordingly to the real-time electricity rate to decrease the cost for EV owners and to decrease the load on the energy grid. The last scenario is presented as uncontrolled public charging throughout the day where a certain share of EVs charge at the working place on the public chargers. Besides describing the charging patterns of the EV owners, this research compares that behavior with the load of energy grid.
Koroleva et al. [119] have introduced their research in progress about exploring the demand response of EV owners in response to the price of the electricity. Factors that authors considered in their model are range anxiety, uncertainty about the travel, risk attitude, and social influence. The model uses a simulated EV environment to observe the driving and charging behavior of EV owners. In the future authors plan to implement the mobile application that would use that model to visually describe patterns when certain factors change.
To determine a load on the energy grid, researchers Taylor et al. [120], in the scope of a larger project, have developed a framework that is based on the data acquired by the National Household Travel Survey [121] (NHTS). Based on the traveled distance, the battery state of charge is estimated and assuming that PHEV owner charges the vehicle to the full capacity, load on the energy grid can be calculated. An interesting observation in this work is about the traveled distances and the times of home departures/arrivals. The longer the traveling time is, the earlier is the time of departure. The energy grid is under heavier load around 5 PM which correspondent with the times of PHEV owners arriving at home from work—this leads to the conclusion that PHEV owners are likely to charge their vehicle when they arrive to home.
Like the previous study, Kelly et al. [122] are basing their research on the data provided by the National Household Travel Survey and also describes users charging behavior at home based on different parameters. The peak in energy grid load is highest around 8 p.m., and noticeably higher on weekdays than on the weekends. Load on the energy grid caused by EV charging is never zero, since at all times cars are charging. After analyzing the impact of battery capacity on the load, authors concluded that increased battery capacity does not only increase the magnitude of the load on the energy grid, but also shifts it in time (i.e., the peak will occur later than with the batteries with smaller capacity). From the demographic aspect, the authors concluded that the households with the highest income generate peaks in the energy grid load 41% higher than the households with lower income and the households with lower income have earlier peaks. Regardless of the driver sex, based on the sample provided by NHTS, the older population generate a peak in the load earlier than the younger people.
Dealing with the same problem as previous studies (i.e., energy grid integration), Shao and Rahman [123] also derived conclusions about the EV owners charging behaviors. Using the same data (i.e., NHTS) that indicates that cars are parked for more than 90% of the time and that arrivals to home from work are in different times of the day, authors calculated (again based on the distance traveled and battery state of charge) that the peak occurs at 6 p.m. with one hour variance.
As opposed to the previous research, the next studies do not describe patterns of EV owners charging and driving behavior as a consequence of solving a different problem, but as a problem on its own.
Develder et al. [48] conducted research that is based on determining EV owners’ charging patterns. Two different real-world datasets were used, each one belonging to the different EV charging infrastructure providers (ElaadNL and iMove). Based on clustering the arrival and departure times of EV to the charging station, charging session has been classified as park to charge when charging times are scattered through the day and the duration of charging session is not much longer than the time needed to charge the EV, charging near home sessions are characterized with departure times in the morning, and with the arrivals in the evening. Lastly, charging sessions have been also classified as charging near work where departure times are in the evening and the arrival times are in the morning. Besides this conclusion, with simple statistics, authors also concluded the pattern differences between weekdays and weekends. The contribution of this work is not only in the previously stated conclusions, but in the fact that previously stated conclusions were drawn for two infrastructure providers and compared between them.
Frenkie and Krems [124] investigated the EV owner driving and charging behavior using the data collected from travel and charging diaries from EV owners provided by EV and private charging station. The dataset contains only information from Monday to Friday, since weekends have atypical patterns. The average distance per user for a day is 38 km, while the maximum distance traveled without recharging is 124.9 km. The charging patterns are different than in most studies, since this study uses private charging stations that are available to the EV owners, and they can charge their car when needed, not when the opportunity arrives. On average, users charged 3.1 times per week, while the charging event occurred when the remaining capacity is around 30% or below 15%, which is also when the car system notifies the owner about the state of charge.
Bingham et al. [54] used the data collected from the Smart ED platform (i.e., platform for collecting the data from pure electric driven two-seat passenger car). Based on the data it was calculated that battery consumption is equivalent to 1.275% of the battery state of charge, which leads to the conclusion that, on average, the EV in this case study can travel 78.4 km on full battery (i.e., from 71 km to 88 km). Authors concluded that reducing the amount of accelerating and decelerating, a significant amount of energy can be saved, which would extend the driving distance of EV.
Pevec et al. [14] have reported as a part of their contributions the statistics which depicts EV owners charging behavior on the case of Netherlands, based on the dataset provided by one of the charging infrastructure providers in the Netherlands (i.e., ElaadNL). This research describes utilization of EV charging stations through different time intervals (i.e., hourly, daily, and yearly), on the hourly basis there are two peaks in the utilization levels, around 8 a.m. and 5 p.m., which corresponds with the time of EV owners arrival to work and to home from work, also, the utilization of parking spaces follow that pattern with the drop in utilization right before the peaks in the charging stations utilization-EV owners and on the road, thus parking space is unoccupied. On the daily basis, authors concluded that there is no difference in utilization patterns on weekdays, but the weekdays greatly differ from weekends where utilization has only one peak midday. On the yearly basis, utilization has a significant drop during the summer, when people usually go on a vacation. Besides the user charging behavior, this research also describes utilization from the charging station perspective (e.g., is charger located near home, or near the workplace, how specific chargers are utilized, etc.). Figure 8 depicts a comparison of charging station and parking spot utilization per hour of the day where previously described behaviors can be observed.
Babic et al. [43,125] in their research have modeled the willingness to pay for charging service. The model used three control variables: charging speed, referent electricity price, and state of charge. Based on the randomize values for control variables, users answered the survey (deployed via Qualitrics) with the price they are willing to pay for the charging service (i.e., answers were collected using Mechanical Turk, crowd-sourcing platform). After collecting the data, multiple linear regression model was developed with the goal to analyze the influence of certain variable and the combination of variables on the willingness to pay for charging service. As a continuation of this research, Dorcec et al. [126] extended this methodology with the information about the time-of-the-day when EV is being charged. This research, as well as previous research, confirmed the hypothesis that referent price and state of charge have a great role in EV owners willing to pay for a charging service.
One of the most common conclusions in this research area is about user charging times, i.e., when are they charging their car, and for how long, which is important for managing the electricity demand and supply. Besides the demand and supply, this information can also be used for smart charging station placement [14]. More interesting observations related to user charging behavior are represented in Table 5.

5.3. Vehicle-To-Grid

Vehicle-to-grid (V2G) is a concept of a process in which electric vehicles provide power to the energy grid while parked and connected to a charger, since most of the time, the car is parked and thus, battery unused (Clement et al. [127]). With this method, owners of EVs can return some of the cost, since providing electricity to the grid would be compensated (e.g., free charging, money) (see Figure 2—bidirectional energy exchange between EV-CS and CS-energy grid). A simple scenario of V2G technology is as follows when there is a high demand for electricity, electric vehicles that are parked and connected to the charger would discharge and when overall energy consumption is low, they would charge. The vast majority of work in this area is focused on the implementation of V2G technology. However, some researchers are focused on scheduling and the impact of the realization of that technology.
He et al. [128] have developed an optimization framework for scheduling EV charging and discharging times. First, they solve the problem of minimization of the cost on a global scale. This approach has proven to be inefficient, since, it assumes that the arrival times and load during the day is known in advance. The second problem was defined on a local scale (i.e., EVs that perform charging and discharging in one parking lot). This approach is applicable on a larger scale, and is resilient to dynamic EV arrival. The authors tested their framework on a case study involving the data Toronto on 21 August 2009. The simulation results indicated that the local scheduling can achieve results close to those on a global scale.
Wang et al. [74] have defined V2G EV as an electric vehicle that has low driving time and high parking time, which ideally describes personal vehicles. The goal of this study was to analyze the impact of EV charging on energy grid load. Authors propose three models: uncontrolled charging where user randomly charges EV, controlled charging by tariff structure (charge during off-peak hours), and controlled charging/discharging (charge during off-peak, discharge during on-peak hours). The first model as expected has proven to be the worst during peak hours, while the second and third models improved the load of the power grid during peak hours. The third model was able to efficiently exchange energy with the power grid and further flatten the load curve.
Soares et al. [129] utilize Particle Swarm Optimization (population-based stochastic optimization, similar to the genetic algorithm, Kennedy [130]) to tackle the problem of energy management with a high number of V2G capable EVs. This paper introduces a method that is for the order of magnitude faster than standard non-linear programming, and can find an optimal solution in a matter of seconds, which is of great importance for the day-ahead planning.
In this area of research, there are some studies that focus on energy grid load balancing with agent-based modeling: Kahlen et al. [131], Vytelingum et al. [132], Kamboj et al. [133], Valogianni et al. [134], and Ramchurn et al. [135]. All those studies have defined their own models with agents (e.g., car, electricity provider) with different behavior (e.g., electricity storage provider has a goal to maximize the cost, EV owners charge randomly).
More extensive research on vehicle-to-grid EV integration is provided in research by Mwasilu et al. [136].
Currently, vehicle-to-grid technologies are tested in Netherlands with the collaboration with Stedin, GE, Renault, and ELaadNL [137], and in USA, PG&E are converting company-owned Prius to V2G PHEVs at Google campus, while Xcel Energy is converting six Ford Escape Hybrids into V2G capable vehicles as described by Fang et al. [138].

6. Discussion

Throughout the paper, EV-related studies from fields of green transportation, energy informatics, and economics are reviewed and summarized in a systematic way by using the data science perspective (see Section 2), as explained in Figure 1. The described research area is gaining an increase in popularity with the growing trend of EVs on the market [6]. Up until now, the data science approaches, methods, and tools in the domain of EVs were present only in a small number of studies, since the research focus was mainly on the electrical engineering aspect (i.e., the number of EVs was not large enough for implementing solutions based on the data science and there was no enough data). However, the situation is changing what can be noted from a growing number of EV-related data science research papers. Consequently, data science is becoming a highly relevant approach for green transportation, energy informatics, and EV-related economics studies. Researchers are actively cooperating with the industry since there is no conventional way to gather the EV-related data and the private, i.e., company-owned, data is the most used source in various studies (e.g., [48,139]). Following paragraphs will consolidate main scientific observations for research problems covered in the paper: EV acceptance, EV market penetration, charging station deployment, and EV owner charging behavior.
Based on the insights in Section 4, EV acceptance is usually tackled with conjoint analysis with different factors considered, e.g., range anxiety, education, age, and income. The most important factors in EV adoption are proven to be government incentives and high availability of charging stations which consequentially lowers range anxiety. Negative influence on the EV adoption rate is mostly long recharging times and low range with a fully charged battery. The second part of Section 4 deals with the research problem of predicting EV future sales. Researchers in the sales forecast field mostly use analysis based on the historical data and well established statistical approaches or simulations that mimic potential owners’ adoption rate and other complex EV environment interactions. Some of the studies analyzed in this paper, i.e., those that are dated before 2015, have accurate predictions for the near future and very optimistic predictions for the period of the next 10 years (i.e., growth around 30–40%).
Section 5 deals with the charging station deployment and user charging behavior, which has proven to be valuable information for deciding the location for new charging stations. Both research problems employ similar methods to tackle their respective challenges: data analysis, machine learning, mathematical programming, and simulations, with the emphasis on the latter two. Majority of studies about EV owners charging patterns have similar conclusions: EV owners are most likely to charge their car when they arrive to work and to home from work, i.e., peaks in the charging station utilization are around 8 a.m. and 5 p.m. Besides the charging station deployment, charging behavior is an important aspect in research related to energy grid load demand optimization. The next observed challenge, the one dealing with the deployment of charging stations, is nowadays the most important since it directly impacts EV adoption and consequentially the development of EVs. While being extremely important, the EV charging infrastructure is generally underdeveloped due to short existence. Lack of data in this research area is the reason why researches are mainly employing methods of mathematical programming and simulations. For now there is no generally applicable method for deployment of charging stations, since, to the best of the author’s knowledge, the existing studies are specific and cover either specific area, i.e., due to simulation restrictions, or specific case, e.g., macro/micro deployment or deployment along the highways. Finally, one of the greatest challenges in this domain is the adaptation of existing energy infrastructure to accommodate the EV charging needs. This challenge is being tackled by the smart charging research, partially discussed in the Section 5.3. In order to offload the energy grid, it is important to determine in which time intervals the electric vehicle should be a charge, should it be used as energy storage during the peak load times, and how to manage the EV battery to satisfy both the owner’s needs and the energy grid.

7. Conclusions

This paper is a data science perspective review of the multi-disciplinary research area centered around electric vehicles. The review was systematically performed using specific keywords, as explained in Section 2, which ensured a detailed overview of data-driven research performed in the field of EVs in the period from 2011 to 2018.
Based on the presented review, we conclude that data science should be today widely used to solve various EV-related challenges. The EV-related data is nowadays generated from numerous sources such as road sensors, vehicles, and EV charging stations. Furthermore, industry more and more provides researchers with otherwise private data and catalyzes the development of high-quality data-driven research. Of course, both researchers and industry need to be careful about what and how data can be shared and analyzed not to compromise data and end-user privacy, where data (pseudo-)anonymization methods will play an important role. However, it is not only that a data-driven approach is nowadays possible for the EV-related research, but such an approach is sometimes necessary and very often it generates beneficial added value. There are various emerging research problems that cannot be tackled using traditional methods, such as mathematical programming. An example is the smart charging station management, i.e., deploying, removing, and re-allocating charging stations. There are numerous research initiatives that aim to solve this problem by not using real-world data that requires setting many assumptions, making them less accurate and consequentially lowering their applicability in real-world scenarios.
Based on the analysis in the paper, we identified two most important unsolved challenges in the research field of EVs, when observed from the perspective of data science: data acquisition and methodology for charging station deployment.
Sources of EV-related data nowadays exist, but are still scarce. The most common way of acquiring the data is either through the cooperation with private companies or through proprietary devices developed for the research purpose, what presents a major obstacle for producing high-quality data science research in the EV area even though the amount of data being generated from EVs and charging stations is growing every day.
The importance of the generalized methodology for charging station deployment is already elaborated in this paper. A potential solution lies in using open access to charging station data, which will enable designing and fine-tuning of advanced machine learning algorithms, and other data science approaches, for charging station deployment. In their future work, the authors plan to propose the data-driven computational framework for charging station deployment.

Author Contributions

Conceptualization of this research was performed by J.B., V.P. and D.P. Methodology, as well as the investigation was done by D.P. D.P. prepared the initial draft of the paper, while J.B. and V.P. performed reviewing and editing. Visualization and analysis was preformed by D.P., while J.B. and V.P. supervised the work and acquired funding.

Funding

This research received no external funding.

Acknowledgments

The authors acknowledge the support of the Croatian Science Foundation under the grant DOK-2015-10-1777. This research has also been partly supported by the European Regional Development Fund under grants KK.01.1.1.01.0009 (DATACROSS), KK.01.2.1.01.0020 (RASCO-FER-SMART-EV) and KK.01.2.1.01.0077 (bigEVdata).

Conflicts of Interest

The authors declare no conflict of interest.

References

  1. International Energy Agency. Global EV Outlook 2018; International Energy Agency: Paris, France, 2018. [Google Scholar]
  2. Babcock, L.R., Jr. A combined pollution index for measurement of total air pollution. J. Air Pollut. Control Assoc. 1970, 20, 653–659. [Google Scholar] [CrossRef]
  3. Saber, A.Y.; Venayagamoorthy, G.K. Plug-in vehicles and renewable energy sources for cost and emission reductions. IEEE Trans. Ind. Electron. 2011, 58, 1229–1238. [Google Scholar] [CrossRef]
  4. Granovskii, M.; Dincer, I.; Rosen, M.A. Economic and environmental comparison of conventional, hybrid, electric and hydrogen fuel cell vehicles. J. Power Sources 2006, 159, 1186–1193. [Google Scholar] [CrossRef]
  5. Nykvist, B.; Nilsson, M. Rapidly falling costs of battery packs for electric vehicles. Nat. Clim. Chang. 2015, 5, 329–332. [Google Scholar] [CrossRef]
  6. International Energy Agency. Global EV Outlook 2016; International Energy Agency: Paris, France, 2016. [Google Scholar]
  7. Revolve. Electric Vehicles in the Developing World. 2016. Available online: https://insideevs.com/news/341919/new-study-shows-which-countries-lead-trail-in-electric-car-adoption/ (accessed on 23 December 2018).
  8. Neubauer, J.; Wood, E. The impact of range anxiety and home, workplace, and public charging infrastructure on simulated battery electric vehicle lifetime utility. J. Power Sources 2014, 257, 12–20. [Google Scholar] [CrossRef]
  9. Rauh, N.; Franke, T.; Krems, J.F. Understanding the impact of electric vehicle driving experience on range anxiety. Hum. Factors 2015, 57, 177–187. [Google Scholar] [CrossRef]
  10. Hender, B. Recent developments in battery electric vehicles. Proc. Inst. Electr. Eng. 1965, 112, 2297–2308. [Google Scholar] [CrossRef]
  11. Jeremy, K.; McKellen, P.; Williams, K.; Rees, M.; Pearson, G.; Bird, B.; Harlen, R.; Brown, J.; Winn, R.; Hender, B. Discussion on Recent Developments in Battery Electric Vehicles. Proc. Inst. Electr. Eng. Lond. 1966, 113, 1809. [Google Scholar]
  12. Golob, T.F.; Kitamura, R.; Bradley, M.; Bunch, D.S. Predicting the market penetration of electric and clean-fuel vehicles. Sci. Total Environ. 1993, 134, 371–381. [Google Scholar] [CrossRef]
  13. Tanaka, M.; Ida, T.; Murakami, K.; Friedman, L. Consumers’ willingness to pay for alternative fuel vehicles: A comparative discrete choice analysis between the US and Japan. Transp. Res. Part A Policy Pract. 2014, 70, 194–209. [Google Scholar] [CrossRef]
  14. Pevec, D.; Kayser, M.; Babic, J.; Carvalho, A.; Ghiassi-Farrokhfal, Y.; Podobnik, V. A Computational Framework for Managing Electric Vehicle Charging Infrastructure. In Proceedings of the 9th international Exergy, Energy and Environment Symposium, Split, Hrvatska, 14–17 May 2017. [Google Scholar]
  15. Babic, J.; Carvalho, A.; Ketter, W.; Podobnik, V. Extending parking lots with electricity trading agent functionalities. In Proceedings of the Workshop on Agent-Mediated Electronic Commerce and Trading Agent Design and Analysis (AMEC/TADA 2015)@ AAMAS, Istanbul, Turkey, 4 May 2015. [Google Scholar]
  16. Buamod, I.; Abdelmoghith, E.; Mouftah, H.T. A review of OSI-based charging standards and eMobility open protocols. In Proceedings of the 2015 6th International Conference on the Network of the Future (NOF), Montreal, QC, Canada, 30 September–2 October 2015; pp. 1–7. [Google Scholar]
  17. Van Amstel, M.; Ghatikar, R.; Wargers, A. Importance of Open Charge Point Protocol for the Electric Vehicle Industry. Available online: https://www.openchargealliance.org/uploads/files/OCA-EN_whitepaper_OCPP_vs_proprietary_protocols_v1.0.pdf (accessed on 23 December 2018).
  18. Ruiz, V.; Pfrang, A.; Kriston, A.; Omar, N.; Van den Bossche, P.; Boon-Brett, L. A review of international abuse testing standards and regulations for lithium ion batteries in electric and hybrid electric vehicles. Renew. Sustain. Energy Rev. 2017, 81, 1427–1452. [Google Scholar] [CrossRef]
  19. Yilmaz, M.; Krein, P.T. Review of battery charger topologies, charging power levels, and infrastructure for plug-in electric and hybrid vehicles. IEEE Trans. Power Electron. 2012, 28, 2151–2169. [Google Scholar] [CrossRef]
  20. Van Der Aalst, W. Data science in action. In Process Mining; Springer: New York, NY, USA, 2016; pp. 3–23. [Google Scholar]
  21. Scopus Preview. Available online: https://www.scopus.com/search/form.uri?display=basic (accessed on 23 December 2018).
  22. IEEE Xplore Digital Library. Available online: https://ieeexplore.ieee.org/Xplore/home.jsp (accessed on 23 December 2018).
  23. The Exponential Growth of Data. 2017. Available online: https://insidebigdata.com/2017/02/16/the-exponential-growth-of-data/ (accessed on 23 December 2018).
  24. Bichler, M.; Heinzl, A.; van der Aalst, W.M. Business Analytics and Data Science: Once Again? Bus. Inf. Syst. Eng. 2017, 59, 77–79. [Google Scholar] [CrossRef]
  25. Your Home for Data Science. Available online: https://www.kaggle.com/ (accessed on 23 December 2018).
  26. Russell Hensley, S.K.; Pinner, D. Electrifying cars: How three industries will evolve. Mckinsey Q. 2009, 3, 87–96. [Google Scholar]
  27. Watson, R.T.; Boudreau, M.C.; Chen, A.J. Information systems and environmentally sustainable development: Energy informatics and new directions for the IS community. MIS Q. 2010, 34, 23–38. [Google Scholar] [CrossRef]
  28. Watson, R.T.; Howells, J.; Boudreau, M.C. Energy Informatics: Initial thoughts on data and process management. In Green Business Process Management; Springer: New York, NY, USA, 2012; pp. 147–159. [Google Scholar]
  29. Alternative Fueling Station Counts by State. Available online: https://afdc.energy.gov/stations/states (accessed on 23 December 2018).
  30. U.S. Energy Information Administration-EIA-Independent Statistics and Analysis. Available online: https://www.eia.gov/ (accessed on 23 December 2018).
  31. Global Plug-in Sales for 2017 Q1 April. Available online: http://e-hike.net/tr/content/global-plug-vehicle-sales-q1-2017 (accessed on 23 December 2018).
  32. Data.gov. Available online: https://www.data.gov/ (accessed on 23 December 2018).
  33. NHTS Home Page. Available online: https://nhts.ornl.gov/ (accessed on 23 December 2018).
  34. ElaadNL. Smart Charging: Leven van de Wind en Rijden op de Zon! Available online: https://www.infiniot.nl/projecten/elaad_leven_van_de_wind_en_rijden_op_de_zon (accessed on 23 December 2018).
  35. Glerum, A.; Stankovikj, L.; Thémans, M.; Bierlaire, M. Forecasting the demand for electric vehicles: Accounting for attitudes and perceptions. Transp. Sci. 2013, 48, 483–499. [Google Scholar] [CrossRef]
  36. Pevec, D.; Kayser, M.; Babic, J.; Carvalho, A.; Ghiassi-Farrokhfal, Y.; Podobnik, V. A Data-driven Framework for Extending Electric Vehicle Charging Infrastructure. In Proceedings of the Winter Conference on Business Analytics, Snowbird, UT, USA, 2–4 March 2017. [Google Scholar]
  37. Svendsen, M.; Winther-Jensen, M.; Pedersen, A.B.; Andersen, P.B.; Sørensen, T.M. Electric vehicle data acquisition system. In Proceedings of the 2014 IEEE International Electric Vehicle Conference (IEVC), Florence, Italy, 17–19 December 2014; pp. 1–7. [Google Scholar]
  38. Babic, J.; Carvalho, A.; Ketter, W.; Podobnik, V. Evaluating Policies for Parking Lots Handling Electric Vehicles. IEEE Access 2018, 6, 944–961. [Google Scholar] [CrossRef]
  39. Ketter, W.; Collins, J.; Reddy, P. Power TAC: A competitive economic simulation of the smart grid. Energy Econ. 2013, 39, 262–270. [Google Scholar] [CrossRef]
  40. Ketter, W.; Peters, M.; Collins, J.; Gupta, A. A Multiagent Competitive Gaming Platform to Address Societal Challenges. MIS Q. 2016, 40, 447–460. [Google Scholar] [CrossRef]
  41. Hox, J.; Boeije, H. Data collection, primary versus secondary. Encycl. Soc. Meas. 2005, 1, 593. [Google Scholar]
  42. Babic, J.; Carvalho, A.; Ketter, W.; Podobnik, V. Modeling Smart Parking Lots through a Discrete-Event Simulation. In Proceedings of the 2016 Winter Conference on Business Intelligence (WCBI), Sandy, UT, USA, 3–5 Mar 2016. [Google Scholar]
  43. Babic, J.; Carvalho, A.; Ketter, W.; Podobnik, V. Estimating Profitability of EV-enabled Parking Lots: A Simulation-based Approach. In Proceedings of the Workshop on Information Technology and Systems (WITS), Dublin, Ireland, 15–16 December 2016. [Google Scholar]
  44. Higgins, A.; Paevere, P.; Gardner, J.; Quezada, G. Combining choice modelling and multi-criteria analysis for technology diffusion: An application to the uptake of electric vehicles. Technol. Forecast. Soc. Chang. 2012, 79, 1399–1412. [Google Scholar] [CrossRef]
  45. Eggers, F.; Eggers, F. Where have all the flowers gone? Forecasting green trends in the automobile industry with a choice-based conjoint adoption model. Technol. Forecast. Soc. Chang. 2011, 78, 51–62. [Google Scholar] [CrossRef]
  46. Jensen, A.F.; Cherchi, E.; Mabit, S.L.; Ortúzar, J.D. Predicting the potential market for electric vehicles. Transp. Sci. 2016, 51, 427–440. [Google Scholar] [CrossRef]
  47. Lebeau, K.; Van Mierlo, J.; Lebeau, P.; Mairesse, O.; Macharis, C. The market potential for plug-in hybrid and battery electric vehicles in Flanders: A choice-based conjoint analysis. Transp. Res. Part D Transp. Environ. 2012, 17, 592–597. [Google Scholar] [CrossRef]
  48. Develder, C.; Sadeghianpourhamami, N.; Strobbe, M.; Refa, N. Quantifying flexibility in EV charging as DR potential: Analysis of two real-world data sets. In Proceedings of the 2016 IEEE International Conference on Smart Grid Communications (SmartGridComm), Sydney, Australia, 6–9 November 2016; pp. 600–605. [Google Scholar]
  49. Bikcora, C.; Refa, N.; Verheijen, L.; Weiland, S. Prediction of availability and charging rate at charging stations for electric vehicles. In Proceedings of the 2016 International Conference on Probabilistic Methods Applied to Power Systems (PMAPS), Beijing, China, 16–20 October 2016; pp. 1–6. [Google Scholar]
  50. Babic, J.; Carvalho, A.; Ketter, W.; Podobnik, V. On the Profitability of the Smart Parking Lots. In Proceedings of the 2015 Winter Conference on Business Intelligence (WCBI), Snowbird, UT, USA, 12–14 March 2015. [Google Scholar]
  51. Lu, F.; Hua, G. A location-sizing model for electric vehicle charging station deployment based on queuing theory. In Proceedings of the 2015 International Conference on Logistics, Informatics and Service Sciences (LISS), Barcelona, Spain, 27–29 July 2015; pp. 1–5. [Google Scholar]
  52. Ip, A.; Fong, S.; Liu, E. Optimization for allocating BEV recharging stations in urban areas by using hierarchical clustering. In Proceedings of the 2010 6th International Conference on Advanced Information Management and Service (IMS), Seoul, Korea, 30 November–2 December 2010; pp. 460–465. [Google Scholar]
  53. Yan, L.; Shen, H.; Li, S.; Huang, Y. Electrical Vehicle Charging Station Deployment based on Real World Vehicle Trace. In Proceedings of the International Conference on Internet of Vehicles, Nadi, Fiji, 7–10 December 2016. [Google Scholar]
  54. Bingham, C.; Walsh, C.; Carroll, S. Impact of driving characteristics on electric vehicle energy consumption and range. IET Intell. Transp. Syst. 2012, 6, 29–35. [Google Scholar] [CrossRef]
  55. Carty, S.S. Obama Pushes Electric Cars, Battery Power This Week. 2010. Available online: http://content.usatoday.com/communities/driveon/post/2010/07/obama-pushes-electric-cars-battery-power-this-week-/1 (accessed on 23 December 2018).
  56. Gohlke, D.; Zhou, Y. Assessment of Light-Duty Plug-In Electric Vehicles in the United States, 2010–2018; Technical Report; Argonne National Lab. (ANL): Argonne, IL, USA, 2019. [Google Scholar]
  57. Lutsey, N. The Rise of Electric Vehicles: The Second Million. 2017. Available online: https://theicct.org/blogs/staff/second-million-electric-vehicles (accessed on 23 December 2018).
  58. Randall, T. Driving Tesla’s Model 3 Changes Everything. 2017. Available online: https://www.bloomberg.com/news/articles/2017-07-31/driving-tesla-s-model-3-changes-everything (accessed on 23 December 2018).
  59. Winton, N. Here’s The Competition For Tesla’s Model 3. 2016. Available online: https://www.forbes.com/sites/neilwinton/2016/03/31/teslas-model-3-will-join-small-group-of-pioneering-battery-powered-cars/ (accessed on 23 December 2018).
  60. Condliffe, J. Volvo is killing off internal combustion-kinda. Available online: https://www.technologyreview.com/s/608228/volvo-is-killing-off-internal-combustion-kind-of/ (accessed on 23 December 2018).
  61. Chrisafis, A.; Vaughan, A. France to Ban Sales of Petrol and Diesel Cars by 2040. 2017. Available online: https://www.theguardian.com/business/2017/jul/06/france-ban-petrol-diesel-cars-2040-emmanuel-macron-volvo (accessed on 23 December 2018).
  62. Condliffe, J. Britain is Getting Rid of the Internal-Combustion Engine. 2017. Available online: https://www.technologyreview.com/s/608347/britain-is-getting-rid-of-the-internal-combustion-engine/ (accessed on 23 December 2018).
  63. Schmitt, B. German Transport Minister: ICE Ban By 2030 “Utter Nonsense”. 2016. Available online: https://www.forbes.com/sites/bertelschmitt/2016/10/11/german-transport-minister-ice-ban-by-2030-utter-nonsense/ (accessed on 23 December 2018).
  64. Which Country Will Become the First to Ban Internal Combustion Cars? 2016. Available online: https://www.greentechmedia.com/articles/read/what-country-will-become-the-first-to-ban-internal-combustion-cars (accessed on 23 December 2018).
  65. Ko, W.; Hahn, T.K. Analysis of consumer preferences for electric vehicles. IEEE Trans. Smart Grid 2013, 4, 437–442. [Google Scholar] [CrossRef]
  66. Wee, S.; Coffman, M.; La Croix, S. Do electric vehicle incentives matter? Evidence from the 50 US states. Res. Policy 2018, 47, 1601–1610. [Google Scholar] [CrossRef]
  67. Zhang, Y.; Qian, Z.S.; Sprei, F.; Li, B. The impact of car specifications, prices and incentives for battery electric vehicles in Norway: Choices of heterogeneous consumers. Transp. Res. Part C Emerg. Technol. 2016, 69, 386–401. [Google Scholar] [CrossRef]
  68. Hidrue, M.K.; Parsons, G.R.; Kempton, W.; Gardner, M.P. Willingness to pay for electric vehicles and their attributes. Resour. Energy Econ. 2011, 33, 686–705. [Google Scholar] [CrossRef] [Green Version]
  69. Hoen, A.; Koetse, M.J. A choice experiment on alternative fuel vehicle preferences of private car owners in the Netherlands. Transp. Res. Part A Policy Pract. 2014, 61, 199–215. [Google Scholar] [CrossRef]
  70. Smith, B.; Olaru, D.; Jabeen, F.; Greaves, S. Electric vehicles adoption: Environmental enthusiast bias in discrete choice models. Transp. Res. Part D Transp. Environ. 2017, 51, 290–303. [Google Scholar] [CrossRef]
  71. Wang, N.; Pan, H.; Zheng, W. Assessment of the incentives on electric vehicle promotion in China. Transp. Res. Part A Policy Pract. 2017, 101, 177–189. [Google Scholar] [CrossRef]
  72. Anderson, J.E.; Lehne, M.; Hardinghaus, M. What electric vehicle users want: Real-world preferences for public charging infrastructure. Int. J. Sustain. Transp. 2018, 12, 341–352. [Google Scholar] [CrossRef]
  73. Dorcec, L.; Pevec, D.; Vdovic, H.; Babic, J.; Podobnik, V. How do people value electric vehicle charging service? A gamified survey approach. J. Clean. Prod. 2019, 210, 887–897. [Google Scholar] [CrossRef]
  74. Wang, S.; Zhang, N.; Li, Z.; Shahidehpour, M. Modeling and impact analysis of large scale V2G electric vehicles on the power grid. In Proceedings of the Innovative Smart Grid Technologies-Asia (ISGT Asia), Tianjin, China, 21–24 May 2012; pp. 1–6. [Google Scholar]
  75. Helbing, D. Agent-based modeling. In Social Self-Organization; Springer: New York, NY, USA, 2012; pp. 25–70. [Google Scholar]
  76. Janssen, M.A. Agent-Based Modelling. Available online: http://isecoeco.org/pdf/agent_based%20_modeling.pdf (accessed on 17 October 2019).
  77. Yang, W.; Zhou, H.; Liu, J.; Dai, S.; Ma, Z.; Liu, Y. Market evolution modeling for electric vehicles based on system dynamics and multi-agents. In Proceedings of the 2015 International Symposium on Smart Electric Distribution Systems and Technologies (EDST), Vienna, Austria, 8–11 September 2015; pp. 133–138. [Google Scholar]
  78. Sullivan, J.L.; Salmeen, I.; Simon, C. PHEV Marketplace Penetration: An Agent Based Simulation; Technical Report for Transportation Research Institute: Ann Arbor, MI, USA, July 2009. [Google Scholar]
  79. Shafiei, E.; Thorkelsson, H.; Ásgeirsson, E.I.; Davidsdottir, B.; Raberto, M.; Stefansson, H. An agent-based modeling approach to predict the evolution of market share of electric vehicles: A case study from Iceland. Technol. Forecast. Soc. Chang. 2012, 79, 1638–1653. [Google Scholar] [CrossRef]
  80. Segal, R. Forecasting the market for electric vehicles in California using conjoint analysis. Energy J. 1995, 16, 89–111. [Google Scholar] [CrossRef]
  81. Beggs, S.; Cardell, S.; Hausman, J. Assessing the potential demand for electric cars. J. Econom. 1981, 17, 1–19. [Google Scholar] [CrossRef]
  82. Pentland, A.; Liu, A. Modeling and prediction of human behavior. Neural Comput. 1999, 11, 229–242. [Google Scholar] [CrossRef]
  83. Zhang, Y.; Zhong, M.; Geng, N.; Jiang, Y. Forecasting electric vehicles sales with univariate and multivariate time series models: The case of China. PLoS ONE 2017, 12, e0176729. [Google Scholar] [CrossRef]
  84. Becker, T.A.; Sidhu, I.; Tenderich, B. Electric Vehicles in the United States: A New Model with Forecasts to 2030; Center for Entrepreneurship and Technology, University of California, Berkeley: Berkeley, CA, USA, 2009; Volume 24. [Google Scholar]
  85. Du Preez, J.; Witt, S.F. Univariate versus multivariate time series forecasting: An application to international tourism demand. Int. J. Forecast. 2003, 19, 435–451. [Google Scholar] [CrossRef]
  86. Chayama, M.; Hirata, Y. When univariate model-free time series prediction is better than multivariate. Phys. Lett. A 2016, 380, 2359–2365. [Google Scholar] [CrossRef] [Green Version]
  87. Li, F.; Dou, C.; Xu, S. Optimal Scheduling Strategy of Distribution Network Based on Electric Vehicle Forecasting. Electronics 2019, 8, 816. [Google Scholar] [CrossRef]
  88. Neubauer, J.S.; Pesaran, A.; Williams, B.; Ferry, M.; Eyer, J. A Techno-Economic Analysis of PEV Battery Second Use: Repurposed-Battery Selling Price and Commercial and Industrial End-User Value; Technical Report for SAE International: Troy, MI, USA, April 2012. [Google Scholar]
  89. Neubauer, J.; Pesaran, A.A. NREL’s PHEV/EV Li-Ion Battery Secondary-Use Project; National Renewable Energy Laboratory: Lakewood, CO, USA, 2010. [Google Scholar]
  90. Ahmadian, A.; Sedghi, M.; Elkamel, A.; Fowler, M.; Golkar, M.A. Plug-in electric vehicle batteries degradation modeling for smart grid studies: Review, assessment and conceptual framework. Renew. Sustain. Energy Rev. 2018, 81, 2609–2624. [Google Scholar] [CrossRef]
  91. Battery Cell Production Begins at the Gigafactory. 2017. Available online: https://www.tesla.com/blog/battery-cell-production-begins-gigafactory (accessed on 23 December 2018).
  92. Boyd, S. Batteries and Electrification R and D Overview; Department of Energy: Washington, DC, USA, 2018. [Google Scholar]
  93. Dharmakeerthi, C.; Mithulananthan, N.; Saha, T. Planning of electric vehicle charging infrastructure. In Proceedings of the Power and Energy Society General Meeting (PES), Vancouver, BC, Canada, 21–25 July 2013; pp. 1–5. [Google Scholar]
  94. Nilsson, M.; Habibovic, A. Identifying EV drivers needs for information communication technology to ease the EV charging process. In Proceedings of the Adjunct 5th International Conference on Automotive User Interfaces and Interactive Vehicular Applications (AutoUI) 2013, Eindhoven, The Netherlands, 28–30 October 2013; pp. 13–16. [Google Scholar]
  95. Administrator. Navigation. Available online: http://www.evtown.org/about-ev-town/ev-charging/charging-levels.html (accessed on 23 December 2018).
  96. Miller, J.M.; Onar, O.C.; White, C.; Campbell, S.; Coomer, C.; Seiber, L.; Sepe, R.; Steyerl, A. Demonstrating dynamic wireless charging of an electric vehicle: The benefit of electrochemical capacitor smoothing. IEEE Power Electron. Mag. 2014, 1, 12–24. [Google Scholar] [CrossRef]
  97. Andrenacci, N.; Ragona, R.; Valenti, G. A demand-side approach to the optimal deployment of electric vehicle charging stations in metropolitan areas. Appl. Energy 2016, 182, 39–46. [Google Scholar] [CrossRef]
  98. Momtazpour, M.; Butler, P.; Hossain, M.S.; Bozchalui, M.C.; Ramakrishnan, N.; Sharma, R. Coordinated clustering algorithms to support charging infrastructure design for electric vehicles. In Proceedings of the ACM SIGKDD International Workshop on Urban Computing, Beijing, China, 12 August 2012; pp. 126–133. [Google Scholar]
  99. Vazifeh, M.M.; Zhang, H.; Santi, P.; Ratti, C. Optimizing the deployment of electric vehicle charging stations using pervasive mobility data. arXiv 2015, arXiv:1511.00615. [Google Scholar] [CrossRef]
  100. Chen, T.D.; Kockelman, K.M.; Khan, M. The electric vehicle charging station location problem: A parking-based assignment method for Seattle. In Proceedings of the Transportation Research Board 92nd Annual Meeting, Washington, DC, USA, 13–17 January 2013; Volume 340. [Google Scholar]
  101. Hess, A.; Malandrino, F.; Reinhardt, M.B.; Casetti, C.; Hummel, K.A.; Barceló-Ordinas, J.M. Optimal deployment of charging stations for electric vehicular networks. In Proceedings of the First Workshop on Urban Networking, Nice, France, 10 December 2012; pp. 1–6. [Google Scholar]
  102. Mehar, S.; Senouci, S.M. An optimization location scheme for electric charging stations. In Proceedings of the 2013 International Conference on Smart Communications in Network Technologies (SaCoNeT), Paris, France, 17–19 June 2013; Volume 1, pp. 1–5. [Google Scholar]
  103. Sadeghi-Barzani, P.; Rajabi-Ghahnavieh, A.; Kazemi-Karegar, H. Optimal fast charging station placing and sizing. Appl. Energy 2014, 125, 289–299. [Google Scholar] [CrossRef]
  104. He, F.; Wu, D.; Yin, Y.; Guan, Y. Optimal deployment of public charging stations for plug-in hybrid electric vehicles. Transp. Res. Part B Methodol. 2013, 47, 87–101. [Google Scholar] [CrossRef]
  105. Frade, I.; Ribeiro, A.; Gonçalves, G.; Antunes, A. Optimal location of charging stations for electric vehicles in a neighborhood in Lisbon, Portugal. Transp. Res. Rec. 2011, 2252, 91–98. [Google Scholar] [CrossRef]
  106. Xi, X.; Sioshansi, R.; Marano, V. Simulation–optimization model for location of a public electric vehicle charging infrastructure. Transp. Res. Part D Transp. Environ. 2013, 22, 60–69. [Google Scholar] [CrossRef]
  107. Xie, F.; Liu, C.; Li, S.; Lin, Z.; Huang, Y. Long-term strategic planning of inter-city fast charging infrastructure for battery electric vehicles. Transp. Res. Part E Logist. Transp. Rev. 2018, 109, 261–276. [Google Scholar] [CrossRef]
  108. Sweda, T.; Klabjan, D. An agent-based decision support system for electric vehicle charging infrastructure deployment. In Proceedings of the Vehicle Power and Propulsion Conference (VPPC), Chicago, IL, USA, 6–9 September 2011; pp. 1–5. [Google Scholar]
  109. Sweda, T.M.; Klabjan, D. Agent-Based Information System for Electric Vehicle Charging Infrastructure Deployment. J. Infrastruct. Syst. 2014, 21, 04014043. [Google Scholar] [CrossRef]
  110. Botsford, C.; Szczepanek, A. Fast charging vs. slow charging: Pros and cons for the new age of electric vehicles. In Proceedings of the International Battery Hybrid Fuel Cell Electric Vehicle Symposium, Stavanger, Norway, 13–16 May 2009. [Google Scholar]
  111. Capar, I.; Kuby, M.; Leon, V.J.; Tsai, Y.J. An arc cover–path-cover formulation and strategic analysis of alternative-fuel station locations. Eur. J. Oper. Res. 2013, 227, 142–151. [Google Scholar] [CrossRef]
  112. Pevec, D.; Babic, J.; Carvalho, A.; Ghiassi-Farrokhfal, Y.; Ketter, W.; Podobnik, V. Electric Vehicle Range Anxiety: An Obstacle for the Personal Transportation (R) evolution? In Proceedings of the 2019 4th International Conference on Smart and Sustainable Technologies (SpliTech), Split, Croatia, 18–21 June 2019; pp. 1–8. [Google Scholar]
  113. Sathaye, N.; Kelley, S. An approach for the optimal planning of electric vehicle infrastructure for highway corridors. Transp. Res. Part E Logist. Transp. Rev. 2013, 59, 15–33. [Google Scholar] [CrossRef]
  114. Jia, L.; Hu, Z.; Song, Y.; Zhan, K.; Ding, H. Planning of electric vehicle charging stations in highway network. Autom. Electr. Power Syst. 2015, 39, 82–89. [Google Scholar]
  115. Wang, G.; Xu, Z.; Wen, F.; Wong, K.P. Traffic-constrained multiobjective planning of electric-vehicle charging stations. IEEE Trans. Power Deliv. 2013, 28, 2363–2372. [Google Scholar] [CrossRef]
  116. Abdalrahman, A.; Zhuang, W. A survey on PEV charging infrastructure: Impact assessment and planning. Energies 2017, 10, 1650. [Google Scholar] [CrossRef]
  117. Masoum, A.S.; Deilami, S.; Moses, P.; Masoum, M.; Abu-Siada, A. Smart load management of plug-in electric vehicles in distribution and residential networks with charging stations for peak shaving and loss minimisation considering voltage regulation. IET Gener. Transm. Distrib. 2011, 5, 877–888. [Google Scholar] [CrossRef]
  118. Qian, K.; Zhou, C.; Allan, M.; Yuan, Y. Modeling of load demand due to EV battery charging in distribution systems. IEEE Trans. Power Syst. 2011, 26, 802–810. [Google Scholar] [CrossRef]
  119. Koroleva, K.; Kahlen, M.; Ketter, W.; Rook, L.; Lanz, F. Tamagocar: Using a simulation app to explore price elasticity of demand for electricity of electric vehicle users. In Proceedings of the Thirty Fifth International Conference on Information Systems, Auckland, New Zealand, 14–17 December 2014; pp. 1–8. [Google Scholar]
  120. Taylor, J.; Maitra, A.; Alexander, M.; Brooks, D.; Duvall, M. Evaluation of the impact of plug-in electric vehicle loading on distribution system operations. In Proceedings of the Power & Energy Society General Meeting (PES’09), Calgary, AB, Canada, 26–30 July 2009; pp. 1–6. [Google Scholar]
  121. Vyas, A.; Santini, D. Use of national surveys for estimating’full’PHEV potential for oil use reduction. In Proceedings of the PLUG-IN 2008 Conference, San Jose, CA, USA, 21–24 July 2008. [Google Scholar]
  122. Kelly, J.C.; MacDonald, J.S.; Keoleian, G.A. Time-dependent plug-in hybrid electric vehicle charging based on national driving patterns and demographics. Appl. Energy 2012, 94, 395–405. [Google Scholar] [CrossRef]
  123. Shao, S.; Pipattanasomporn, M.; Rahman, S. Grid integration of electric vehicles and demand response with customer choice. IEEE Trans. Smart Grid 2012, 3, 543–550. [Google Scholar] [CrossRef]
  124. Franke, T.; Krems, J.F. Understanding charging behaviour of electric vehicle users. Transp. Res. Part F Traffic Psychol. Behav. 2013, 21, 75–89. [Google Scholar] [CrossRef]
  125. Babic, J.; Carvalho, A.; Ketter, W.; Podobnik, V. Modelling electric vehicle owners’ willingness to pay for a charging service. In Proceedings of the Erasmus Energy Forum, Rotterdam, The Netherlands, 18–19 May 2016; pp. 1–8. [Google Scholar]
  126. Dorcec, L.; Pevec, D.; Vdovic, H.; Babic, J.; Podobnik, V. Exploring Willingness to Pay for Electric Vehicle Charging with Gamified Survey. In Proceedings of the 3rd International Conference on Smart and Sustainable Technologies (SpliTech 2018), Split, Croatia, 26–29 June 2018. [Google Scholar]
  127. Clement-Nyns, K.; Haesen, E.; Driesen, J. The impact of vehicle-to-grid on the distribution grid. Electr. Power Syst. Res. 2011, 81, 185–192. [Google Scholar] [CrossRef]
  128. He, Y.; Venkatesh, B.; Guan, L. Optimal scheduling for charging and discharging of electric vehicles. IEEE Trans. Smart Grid 2012, 3, 1095–1105. [Google Scholar] [CrossRef]
  129. Soares, J.; Sousa, T.; Morais, H.; Vale, Z.; Canizes, B.; Silva, A. Application-Specific Modified Particle Swarm Optimization for energy resource scheduling considering vehicle-to-grid. Appl. Soft Comput. 2013, 13, 4264–4280. [Google Scholar] [CrossRef] [Green Version]
  130. Kennedy, J. Particle swarm optimization. In Encyclopedia of Machine Learning; Springer: New York, NY, USA, 2011; pp. 760–766. [Google Scholar]
  131. Kahlen, M.; Ketter, W. Aggregating Electric Cars to Sustainable Virtual Power Plants: The Value of Flexibility in Future Electricity Markets. In Proceedings of the AAAI, Austin, TX, USA, 25–30 January 2015; pp. 665–671. [Google Scholar]
  132. Vytelingum, P.; Voice, T.D.; Ramchurn, S.D.; Rogers, A.; Jennings, N.R. Agent-based micro-storage management for the smart grid. In Proceedings of the 9th International Conference on Autonomous Agents and Multiagent Systems: Volume 1. International Foundation for Autonomous Agents and Multiagent Systems, Toronto, ON, Canada, 10–14 May 2010; pp. 39–46. [Google Scholar]
  133. Kamboj, S.; Decker, K.; Trnka, K.; Pearre, N.; Kern, C.; Kempton, W. Exploring the Formation of Electric Vehicle Coalitions for Vehicle-to-Grid Power Regulation. Available online: http://citeseerx.ist.psu.edu/viewdoc/download?doi=10.1.1.452.3152&rep=rep1&type=pdf (accessed on 17 October 2019).
  134. Valogianni, K.; Ketter, W.; Collins, J.; Zhdanov, D. Effective Management of Electric Vehicle Storage Using Smart Charging. In Proceedings of the AAAI, Québec City, QC, Canada, 27–31 July 2014; pp. 472–478. [Google Scholar]
  135. Ramchurn, S.D.; Vytelingum, P.; Rogers, A.; Jennings, N. Agent-based control for decentralised demand side management in the smart grid. In Proceedings of the 10th International Conference on Autonomous Agents and Multiagent Systems-Volume 1. International Foundation for Autonomous Agents and Multiagent Systems, Taipei, Taiwan, 2–6 May 2011; pp. 5–12. [Google Scholar]
  136. Mwasilu, F.; Justo, J.J.; Kim, E.K.; Do, T.D.; Jung, J.W. Electric vehicles and smart grid interaction: A review on vehicle to grid and renewable energy sources integration. Renew. Sustain. Energy Rev. 2014, 34, 501–516. [Google Scholar] [CrossRef]
  137. Fleet of 150 Renault ZOE for Smart Solar Charging Project. 2016. Available online: https://media.group.renault.com/global/en-gb/groupe-renault/media/pressreleases/76330/une-flotte-de-150-renault-zoe-pour-un-projet-neerlandais-de-recharge-solaire-intelligente (accessed on 17 October 2019).
  138. Fang, X.; Misra, S.; Xue, G.; Yang, D. Smart grid—The new and improved power grid: A survey. IEEE Commun. Surv. Tutor. 2012, 14, 944–980. [Google Scholar] [CrossRef]
  139. Pevec, D.; Babic, J.; Kayser, M.A.; Carvalho, A.; Ghiassi-Farrokhfal, Y.; Podobnik, V. A Data-Driven Statistical Approach for Extending Electric Vehicle Charging Infrastructure. Int. J. Energy Res. 2018, 2018, 3102–3120. [Google Scholar] [CrossRef]
Figure 1. Thematic positioning of the paper: intersection of interdisciplinary fields.
Electronics 08 01190 g001
Figure 2. Interaction between entities in research area of interest.
Electronics 08 01190 g002
Figure 3. Hierarchy of keywords for related work search.
Electronics 08 01190 g003
Figure 4. The number of electric vehicles (EVs) from 2010 to 2016 in the USA (annually and cumulative), derived from [6,57].
Electronics 08 01190 g004
Figure 5. The global market share of the most popular EVs according to the survey [6].
Electronics 08 01190 g005
Figure 6. Factors that influence potential EV owners’ decision to buy EV.
Electronics 08 01190 g006
Figure 7. Battery prices, derived form [6,92].
Electronics 08 01190 g007
Figure 8. Comparison of hourly charging station and parking spot utilization, taken from [14].
Electronics 08 01190 g008
Table 1. Data gathering methodology with examples and tariff model for each data source.
Data Acquiring MethodExamplePublicTariff ModelResearch Example
FreePaidTrialOther
Data RepositoriesAlternative Fuels Data Centre [42,43]
Alternative Fuel Vehicle Data
City of Melbourne open data platform
data.gov
EV-Volumes
APINokia HERE [14,36]
Google Maps
Oplaadpalen
Open Street Maps
puni.hr
Vehicle API
plugshare.com
openchargemap.org
SurveyNational Household Travel Survey [44,45,46,47]
Qualitrics
CompaniesElaadNL [14,35,48,49]
Renault
Smart ED Platform
SimulationsAgent-based [15,39,50,51,52,53]
Mathematical
ManualAggregation from multiple existing sources [14,36,54]
New data collecting system
Table 2. Comparison of important factors for purchasing electric vehicles.
StateYearAll FactorsMost Important FactorsPaper
Korea2009battery price, holding tax, subsidies type, subsidies level, battery swappability, and availability of recharging infrastructureswappable battery and availability of recharging infrastructure[65]
Norway2011, 2012, 2013price, technology, incentives (i.e., bus lane access, toll waiver, and charging station density)technology[67]
US2018, 2012, 2009price, driving range, time to charge, acceleration, pollution, fuel cost, alternative fuel availability, and home plug-in construction feeprice reduction[13,66,68,73]
Netherlands2011car type, price, monthly cost, driving range, recharge/refuelling type, additional detour time to reach a fuel or charging station, number of available models, and policy measurelow range, long refueling times[69]
Japan2012price, fuel cost, driving range, emission reduction, alternative fuel availability, and home plug-in construction feeavailability of charging stations[13]
Australia2017environmental concerns, technology, range, charging infrastructureenvironmental concerns, technology[70]
Croatia2019range, battery capacity, pricing of the charging servicepricing of the charging service[73]
China2017environmental concerns, technology, education, charging infrastructure density, driving restrictioncharging infrastructure density, licence fee[74]
Germany2018environmental concerns, number of charging stations, charging station speedavailability of charging stations[72]
Table 3. Comparison of studies on forecasting future sales of electric vehicles (EVs).
StateForecasting FactorsForecast YearObservationResearch MethodResearch
ChinaDependency of decrease of the number of traditional cars on increase of EVs2030Developed regions 80–90% EV market penetration, underdeveloped regions 30% market penetrationagent-based modelling[77]
Data from sales (i.e., from 2011 to 2015)20201 million EVs soldunivariate and multivariate time series modelling[83]
United StatesSubsidies2020EV sales 4–5%, EV fleet share 2%agent-based modelling[78]
Gasoline prices, traditional car cost2030EV sales 64%, EV fleet share 24%Bass diffusion[84]
IcelandMarketing and word of mouth204070–100% EV adoption, based on the prices of gasoline and EVsagent-based modelling[79]
SwitzerlandChoice between predefined carsnoneChanges in market influenced by EV cost, subsidies, and monthly cost of ownershipconjoint analysis[35]
BelgiumCar utilities202013% EV market shareconjoint analysis[47]
203045% EV market share
Norway, Netherlands, and DenmarkSurvey before and after driving a EV202040% EV market shareconjoint analysis[46]
AustraliaPrices of electricity, income, and subsidies203045% EV market shareconjoint analysis and Bass diffusion[44]
Table 4. Categorization of studies about charging station (CS) deployment based on data and methodology.
EV DataMethodAlgorithmResearch
YesMachine LearningXGBoost, Clustering[36]
Clustering[97,98]
OptimizationGreedy, Genetic[99]
Mathematical programming[52,53,100]
NoOptimizationGenetic[101,102,103]
Mathematical programming[104,105,106,107]
SimulationQueuing theory[51]
Agent-based modelling[108,109]
Table 5. EV owners’ charging behavior and patterns.
Observed Dependency on Charging BehaviorObserved BehaviorPeak HoursResearch
Grid loaduncontrolled domestic charging, uncontrolled off-peak domestic charging, smart domestic charging, and uncontrolled public chargingnone[118]
Traveling distanceThe longer the traveling time the earlier the departure is5 p.m.[120]
Load on the energy grid caused by EVs is never 0, households with greater income cause greater load, older population generates peak earlier than younger population8 p.m.[122]
Cars are parked more than 90% of times6 p.m.[123]
Charging timesThe charging pattern differs between weekdays and weekends, classification of charging session as: charging near home, charging near work, and park to chargenone[48]
Two peaks in charging utilization, in the morning charge near work, and in the evening charge near home. Drop in charging utilization during the summer8 a.m. and 5 p.m.[14]
Driving pattern and battery state-of-chargeExtended driving distance can be achieved with reducing the amount of accelerating and de-acceleratingnone[54]
Traveling distance and driving durationOn average users charge 3.1 times a week when the remaining battery capacity is under 30% or under 15%none[124]

