Article

Comparative Performance Evaluation of Modern Heterogeneous High-Performance Computing Systems CPUs

by
Aleksei Sorokin
1,
Sergey Malkovsky
1,*,
Georgiy Tsoy
1,
Alexander Zatsarinnyy
2 and
Konstantin Volovich
2
1
Computing Center of the Far Eastern Branch of the Russian Academy of Sciences, 680000 Khabarovsk, Russia
2
Federal Research Center “Computer Science and Control” of the Russian Academy of Sciences, 119333 Moscow, Russia
*
Author to whom correspondence should be addressed.
Electronics 2020, 9(6), 1035; https://doi.org/10.3390/electronics9061035
Submission received: 20 May 2020 / Revised: 11 June 2020 / Accepted: 19 June 2020 / Published: 23 June 2020
(This article belongs to the Special Issue High-Performance Computer Architectures and Applications)

Abstract

:
The study presents a comparison of computing systems based on IBM POWER8, IBM POWER9, and Intel Xeon Platinum 8160 processors running parallel applications. Memory subsystem bandwidth was studied, parallel programming technologies were compared, and the operating modes and capabilities of simultaneous multithreading technology were analyzed. Performance analysis for the studied computing systems running parallel applications based on the OpenMP and MPI technologies was carried out by using the NAS Parallel Benchmarks. An assessment of the results obtained during experimental calculations led to the conclusion that IBM POWER8 and Intel Xeon Platinum 8160 systems have almost the same maximum memory bandwidth, but require a different number of threads for efficient utilization. The IBM POWER9 system has the highest maximum bandwidth, which can be attributed to the large number of memory channels per socket. Based on the results of numerical experiments, recommendations are given on how the hardware of a similar grade can be utilized to solve various scientific problems, including recommendations on optimal processor architecture choice for leveraging the operation of high-performance hybrid computing platforms.

1. Introduction

The advent of specialized algorithms and software data-processing systems using the capabilities of graphic coprocessors (GPUs) has led to an increase in the demand for hybrid high-performance computing systems. The effectiveness of calculations using the GPU and related development tools (for example, CUDA) is the subject of a large number of works that have shown a high increase in productivity in solving scientific problems in various fields of knowledge. As an example, we can single out the tasks of image processing [1], which have found completely new capabilities for data analysis and interpretation.
Most of the above studies evaluate only the GPU in detail [2], paying very little attention to central processors. This issue is extremely important, since in supercomputer centers that provide access to their computing resources for scientists, it is necessary to use the capabilities of modern computing systems built on the basis of the GPU as efficiently as possible [3]. With the seemingly limited choice of CPU manufacturers, each of them (Intel (Santa Clara, CA, USA), IBM (Armonk, NY, USA), etc.) is trying to develop a relatively independent ecosystem, including various sets of system libraries and compilers. Their performance can vary significantly across different classes of tasks and affect the overall performance of a hybrid computing system. In this regard, the urgent task is to assess the functioning of the CPU when performing typical operations. This is an important issue, since the central processors in hybrid systems, in addition to dispatching functions, also perform a large amount of operations related directly to numerical calculations. The results of such studies, depending on the purpose of the computing system, will make it possible to choose the most efficient architectures, as well as give recommendations on their use in calculations in various fields of knowledge.
To solve the abovementioned objectives, a study of modern IBM POWER series processors was conducted. The first phase [4] includes the performance analysis of a hybrid computing cluster based on IBM POWER8 processors. The obtained results show that these systems proved to be effective for solving machine learning and deep learning problems, as well as for calculations in various software packages designed to fully utilize CPU resources. These systems demonstrate high performance due to architectural solutions of POWER processors (in particular, simultaneous multithreading technology (SMT) [5]), as well as the efficient utilization of GPUs assisting with calculations, which becomes possible with modern special-purpose libraries (for example, IBM ESSL) that boost application execution speed without modifying the application’s source code.
This paper presents the second part of the results of this study, which contains benchmark data for modern IBM POWER series processors, including a comparison with Intel Xeon Platinum 8160 processors benchmarks. Based on a comprehensive benchmarking of these computing systems running parallel applications, the objective of this study is to substantiate recommendations on the choice of processor architectures to leverage the operation of hybrid computing platforms.

2. Materials and Methods

2.1. The Description of Computing Platforms and Utilized System Software

The following three hybrid systems were chosen as computer technology samples for analysis—IBM Power Systems S822LC 8335-GTB, IBM Power Systems AC922 8335-GTG, and Huawei FusionServer G5500 Server G560 V5.
The IBM Power Systems S822LC 8335-GTB server (hereinafter referred to as IBM POWER8 system) is based on two superscalar 10-core IBM POWER8 processors [6] with a maximum operating frequency of 4.023 GHz and SMT technology support (up to 8 threads per core), having two NVIDIA Tesla P100 GPU accelerators. One of the distinctive features of this system is that RAM is not directly connected to a CPU’s four-channel memory controllers, but via specialized Centaur chips [7], which ensure data-transfer planning and control (one chip per memory channel). Each memory controller channel running at 9.6 GHz can read 2 bytes and write 1 byte at a time. Thus, the theoretical total memory bandwidth for the considered server is (2 B + 1 B) × 9.6 GHz × 4 × 2 = 230.4 GB/s [7]. Detailed system specifications are given in Reference [4].
The latest in the POWER series, IBM Power Systems AC922 8335-GTG (hereinafter referred to as IBM POWER9 system), is based on a hybrid architecture incorporating two superscalar IBM POWER9 processors [8] with a maximum operating frequency of 3.5 GHz and four NVIDIA Tesla V100 GPU accelerators. The server uses SO (scale-out) processor variations, with the main difference from the SU (scale-up) variation being the direct connection of RAM to its memory controller, without a Centaur buffer chip. This processor has 20 cores supporting SMT4 technology (80 hardware threads per socket). There are 512 KB of shared L2 cache and 10 MB of shared L3 cache for every two cores. Peak memory bandwidth for this computing system totals 340 GB/s [9].
The Huawei FusionServer G5500 Server G560 V5 computing system (hereinafter referred to as Intel Xeon Platinum 8160 system) is based on Intel processors. It incorporates two superscalar Intel Xeon Platinum 8160 processors with a maximum operating frequency of 2.1 GHz, which are based on the Skylake microarchitecture [10], and eight NVIDIA Tesla V100 GPU accelerators. The processors support SMT (Hyper-Threading) technology, allowing up to 2 hardware threads to be executed on each core. Thus, a 24-core CPU can simultaneously run 48 hardware threads. Peak memory bandwidth for the G5500 Server G560 V5 system is 256 GB/s [11].
Summary information with detailed specifications of the studied computing systems CPUs is presented in Table 1.
The following compilers and MPI libraries were used for the study (Table 2), providing the optimal performance level for calculations on these types of computing systems, according to previous benchmarks [12].

2.2. Benchmark Conditions and Means

Hardware performance issues related to the execution of parallel applications (see Section 1) were considered in the study. In particular, the bandwidth of memory subsystems was evaluated, and the parallel computing performance of the studied computing systems was analyzed. To study the abovementioned issues, the widely used benchmarks were performed, as listed in Table 3.
To evaluate the real memory bandwidth, the STREAM benchmark was used. It examines the steady-state bandwidth for read and write operations that are performed in conjunction with arithmetic operations. The benchmark contains four computational kernels (Copy, Scale, Add, and Triad), which are described in Table 4.
Computational cores work with arrays of double-precision numbers (8 B), whose sizes are set during benchmark compilation. To do the correct memory bandwidth benchmark, arrays should be at least 4 times bigger than the sum of all last-level caches. Therefore, an array of size 8.4 × 10⁷ elements was used for benchmarking the considered computing systems.
The benchmark results are compared with the theoretical memory bandwidth values listed in Table 5.
Performance analysis for the studied computing systems using parallel computing with OpenMP and MPI technologies was carried out by using the NPB. The NBP consists of several individual benchmark problems: kernels and pseudo-applications. Kernels and pseudo-applications can perform calculations in the following problem classes: S, W, A, B, C, and D. The sizes of main arrays, the amount of data, and the number of iterations of the main program loops increase as the problem class increases. The following NPB kernels and pseudo-applications were used for research: EP (embarrassingly parallel), LU (lower-upper decomposition), MG (multigrid), CG (conjugate gradient), FT (fast Fourier transform), and IS (integer sort).
To compile all benchmarks, we used compilers presented in Table 2, with optimization flags listed in Table 6. When compiling MPI versions of the NPB, OpenMP-technology-related flags (“-qsmp = omp” for IBM POWER8 and POWER9 Systems, “-qopenmp” for Intel Xeon Platinum 8160 System) were omitted.
To eliminate the possibility of erroneous results caused by other users’ activity, all numerical calculations were performed in a single-user mode. Dynamic CPU frequency scaling was disabled. Furthermore, CPUs were set to their maximum frequency, acceptable at a simultaneous maximum load of all computing cores (see Table 1).
Benchmark results and their analysis are given in the corresponding sections of this paper.

3. Computing Systems’ Benchmarks Results

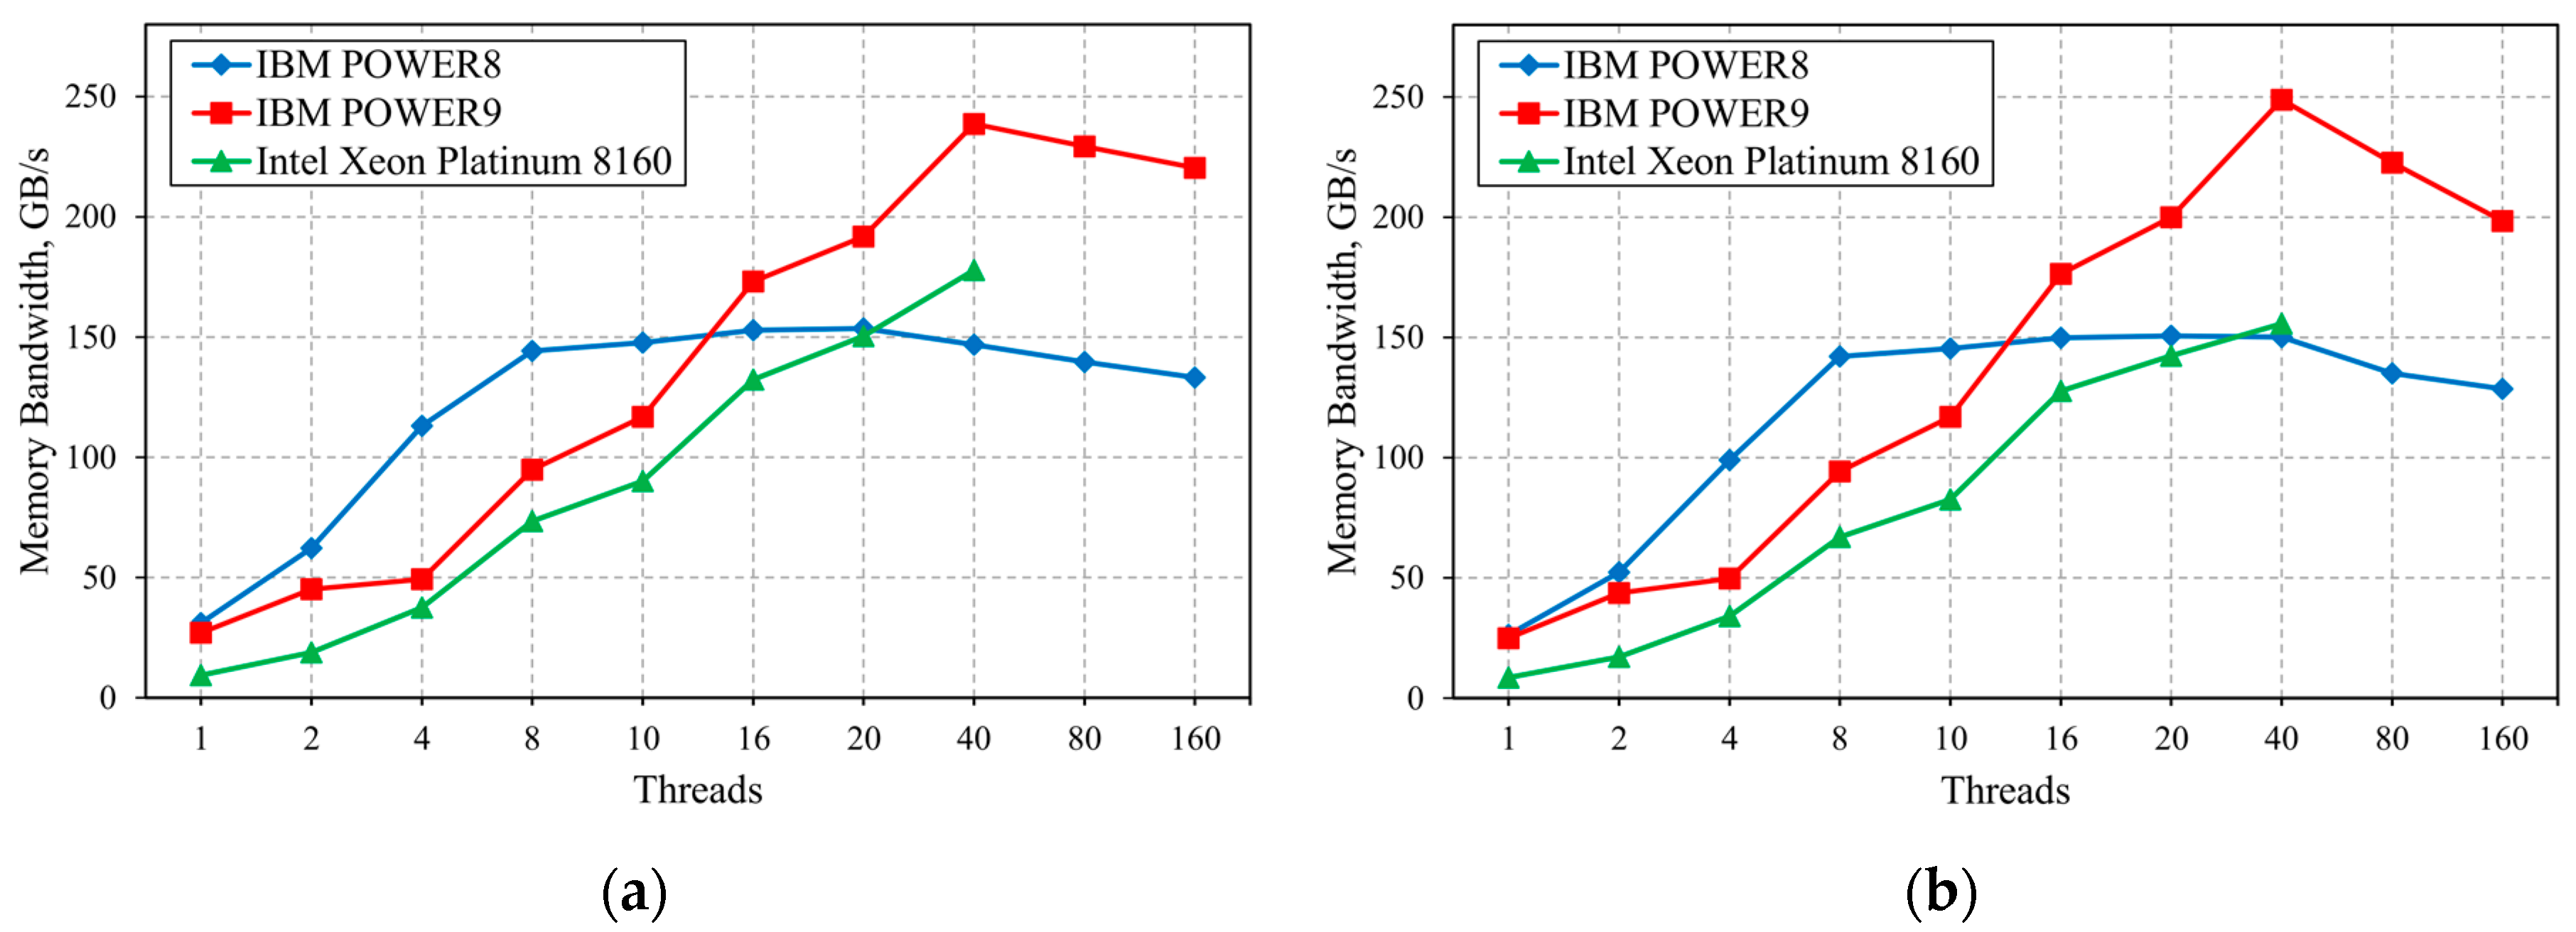
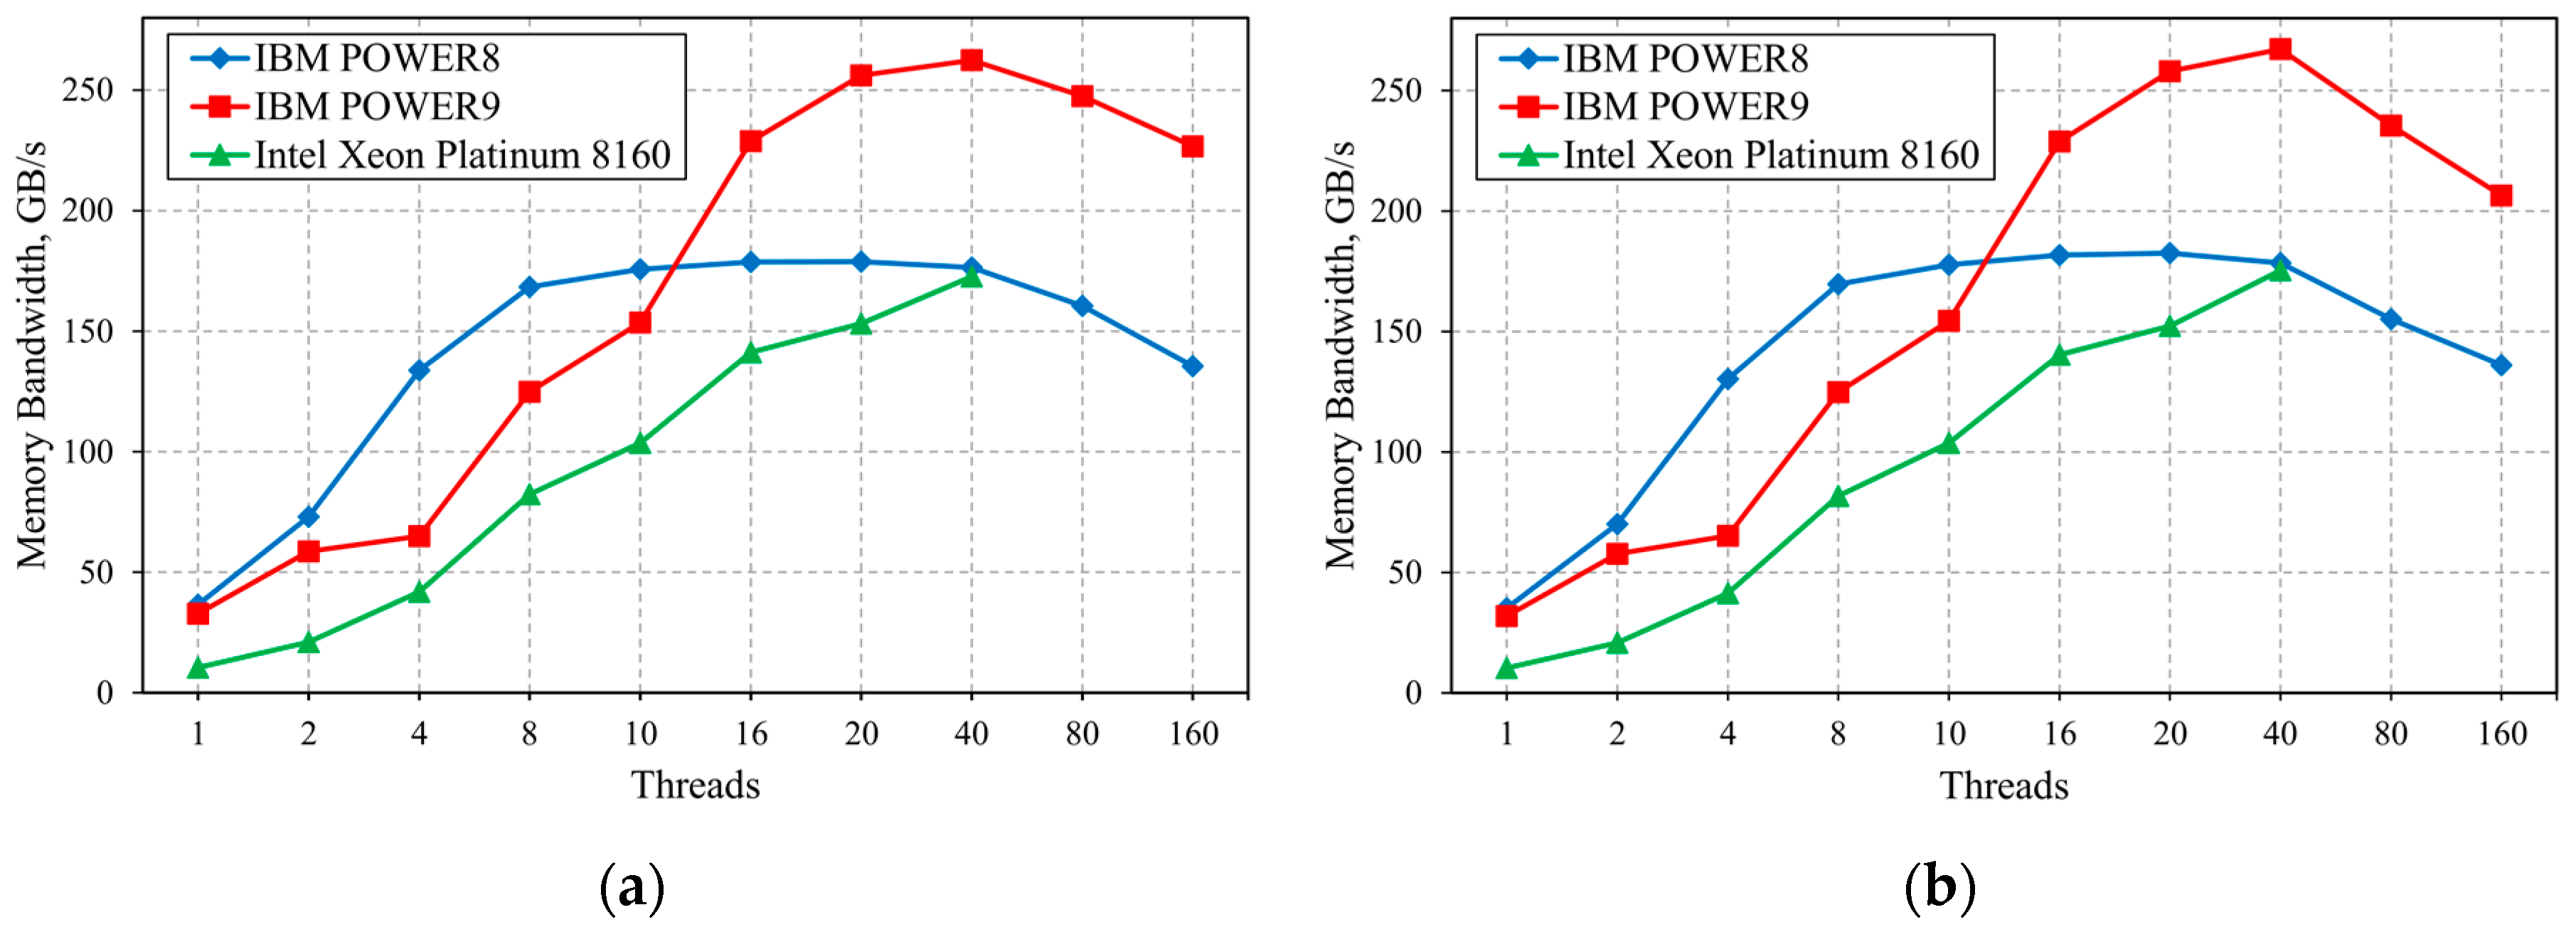
3.1. Memory Bandwidth Benchmark

STREAM benchmark calculations were performed with a different number of computational threads that were uniformly distributed over sockets (half of overall threads number on each). ST (Single Thread, one thread per core) mode was used for the IBM POWER8 processor for a case when the number of threads did not exceed 20. When the number of threads equals to 40, 80, and 160, the SMT2, SMT4, and SMT8 modes (two, four, and eight threads per core) were used, respectively. IBM POWER9 and Intel Xeon Platinum 8160 processors have more cores, so ST mode was used for them when the number of threads did not exceed 40. SMT2 and SMT4 modes were used for 80 and 160 threads, respectively.
The test results for the Copy, Scale, Add, and Triad kernels are shown in Figure 1 and Figure 2.
Benchmark results show that the optimal mode for maximizing memory access speed is running one process per core (ST mode). In this case, the maximum memory bandwidth for IBM-processors-based systems is achieved on a Triad kernel, and for Intel-based systems, it is achieved on a Copy kernel, respectively. The IBM-POWER8-processor-based system demonstrates 182.5 GB/s (79.2% of the peak value), which is achieved by running the benchmark on 20 threads. Similarly, the IBM POWER9 system demonstrates 267.1 GB/s (78.6% of the peak value) on 40 threads, while the Intel Xeon Platinum 8160 system demonstrates 177.8 GB/s (69.5% of the peak value) on 40 threads. Increasing the number of threads to 48 for the Intel Xeon 8160 processor leads to a negligible drop in memory bandwidth down to 176.6 GB/s.
Analysis of the obtained data shows that the biggest bandwidth improvement for IBM POWER8 processors is achieved with a sequential increase in the number of threads up to the number of available memory channels. A further increase in the number of threads up to the number of available cores leads to a bandwidth increase of 6–7.5%. On the other hand, the increase of bandwidth for IBM POWER9 and Intel Xeon Platinum 8160 is relatively uniform when computational cores are sequentially added in ST mode. All considered systems demonstrate a decrease in memory bandwidth in SMT mode, due to a growing number of cache conflicts.

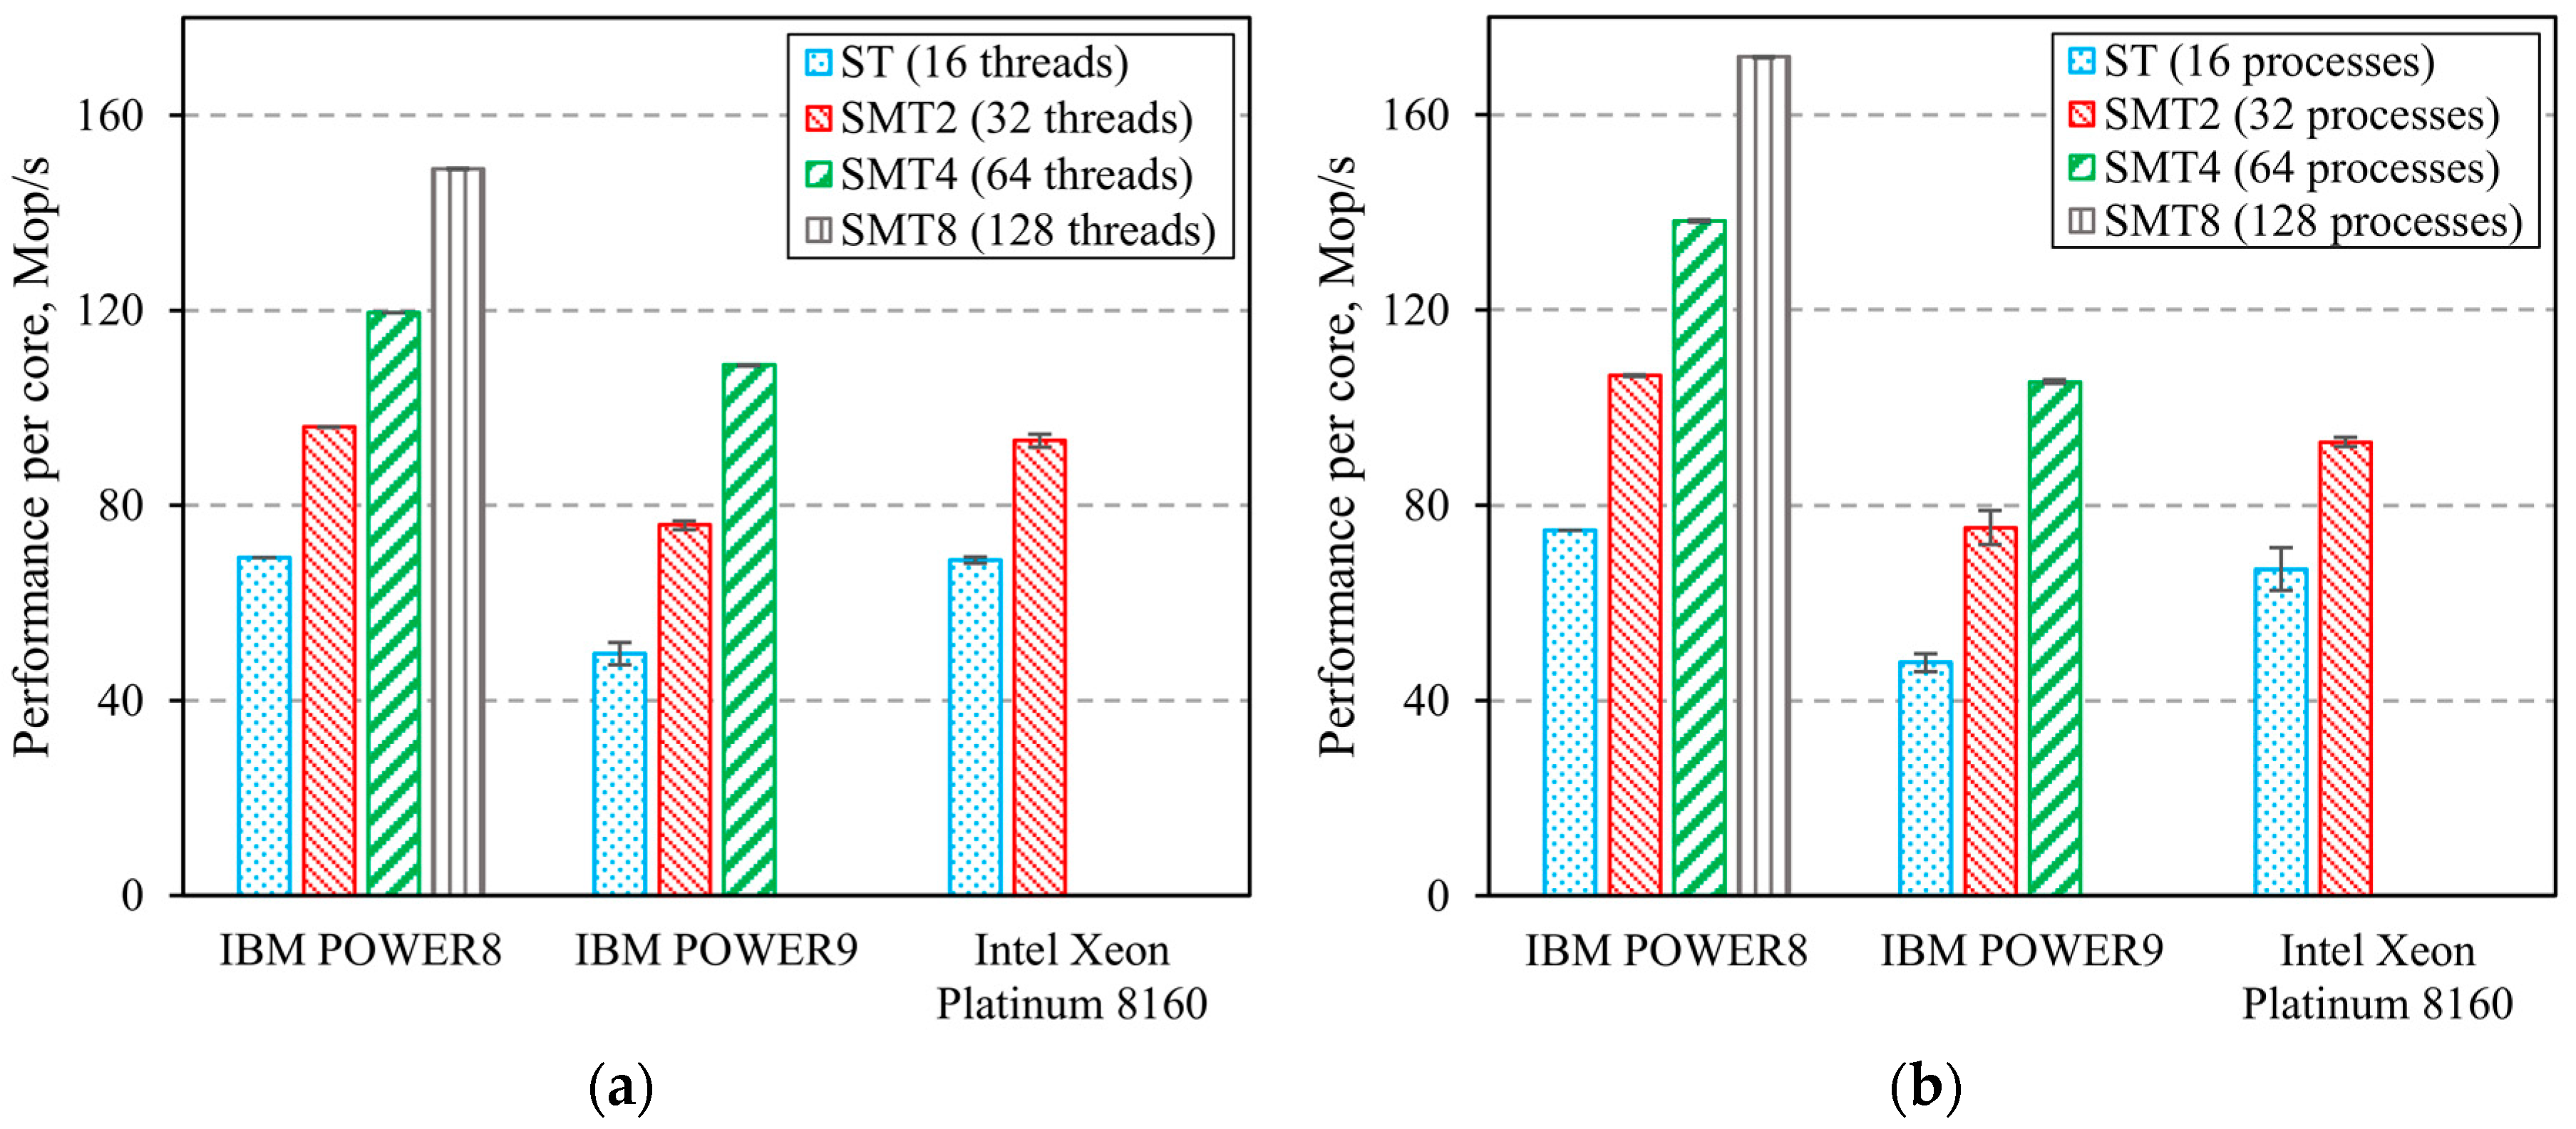
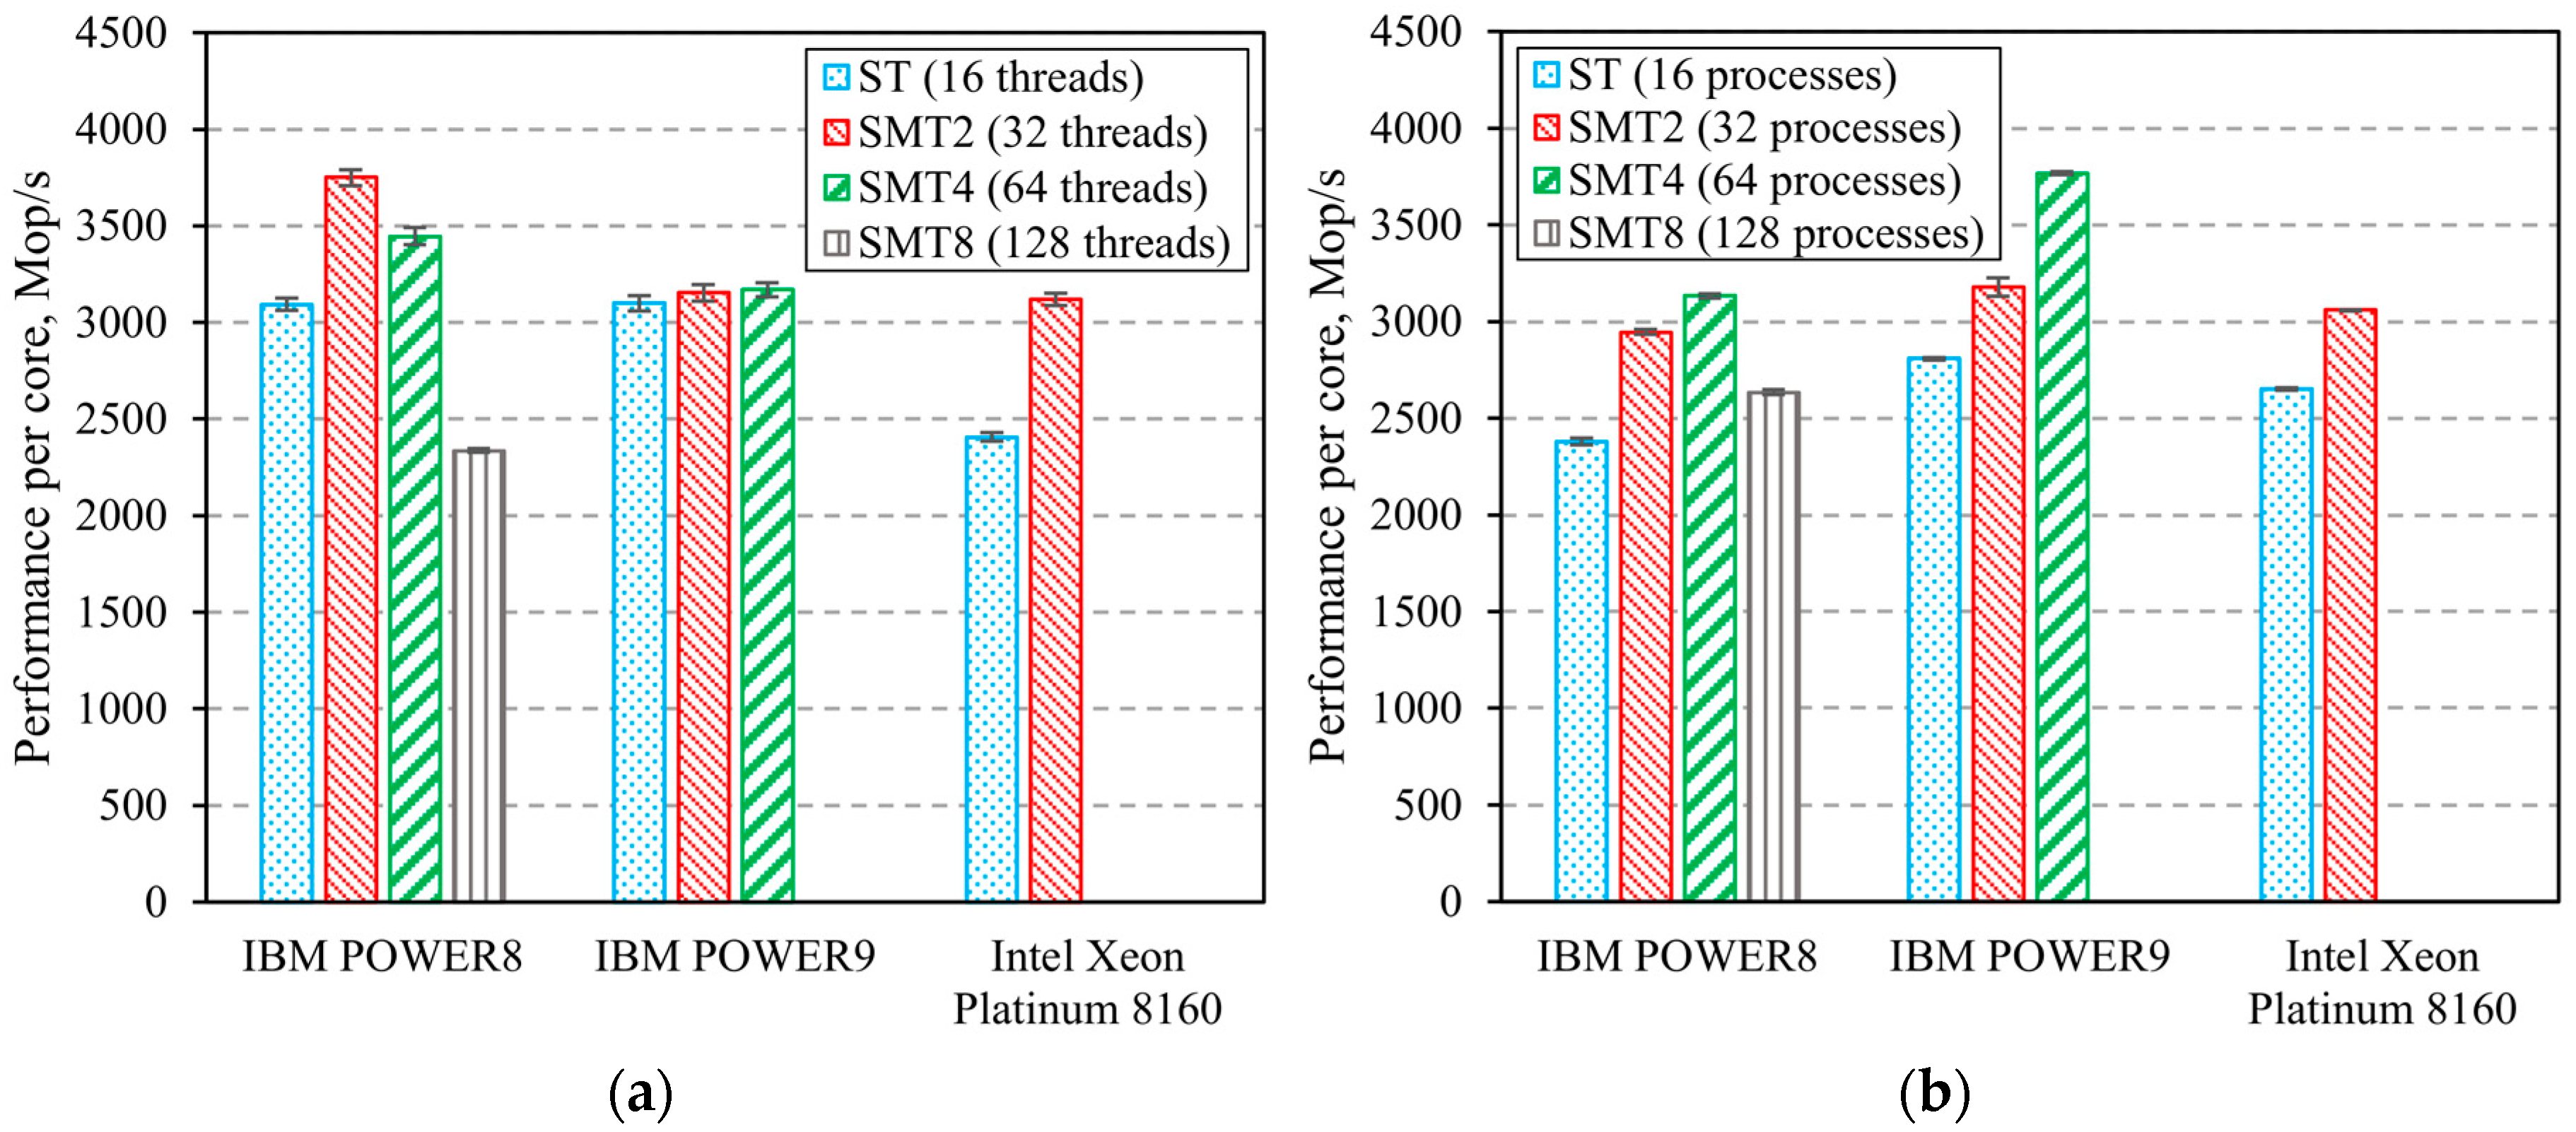
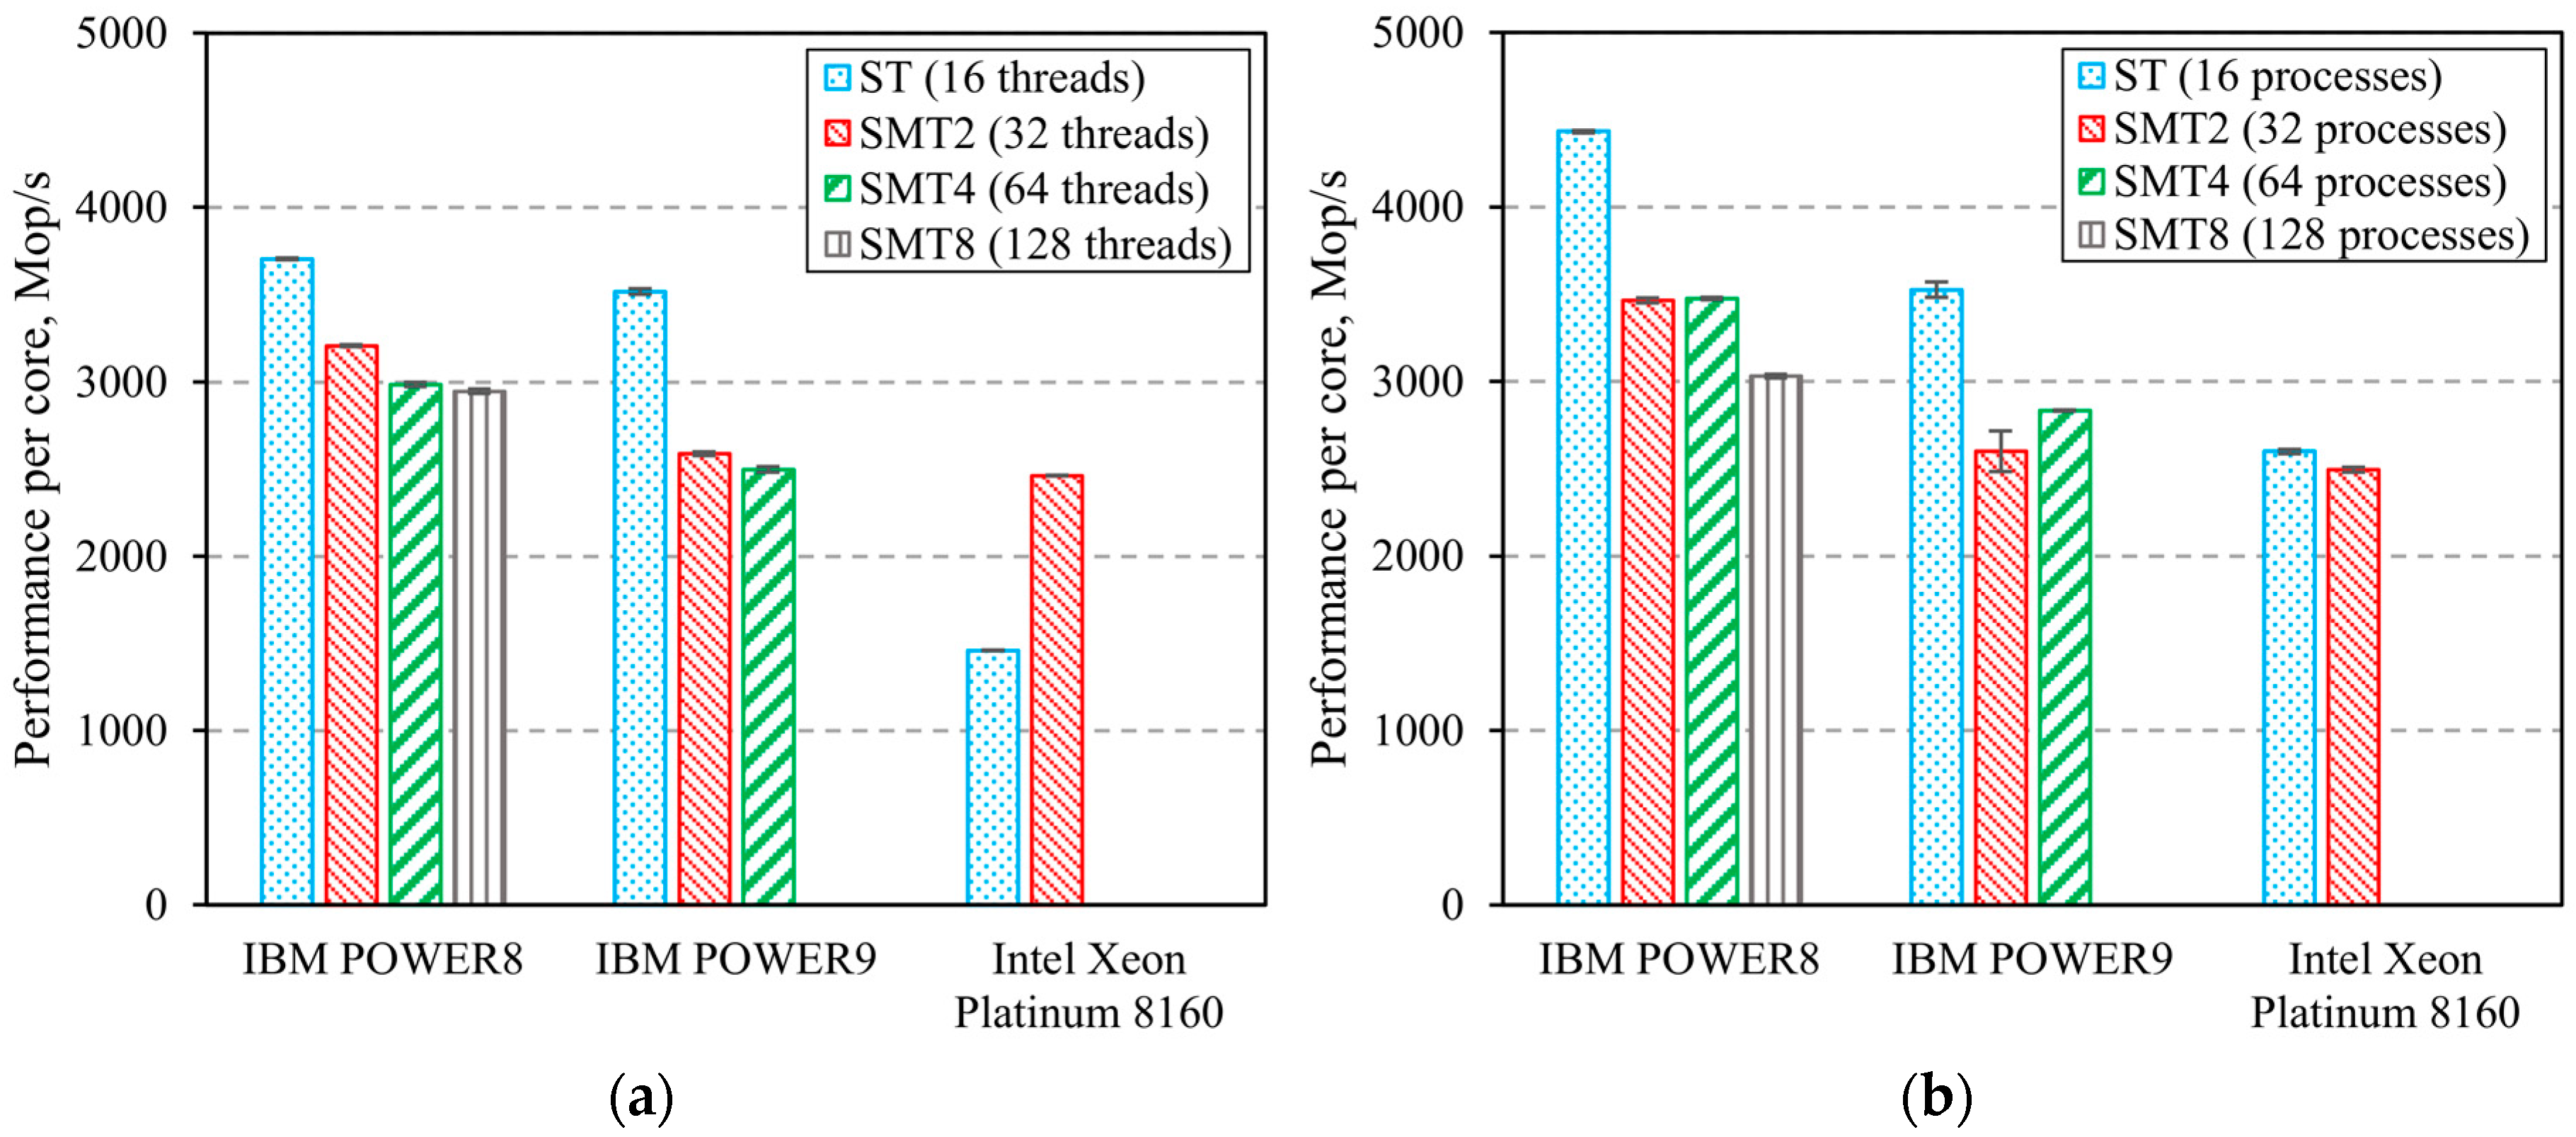
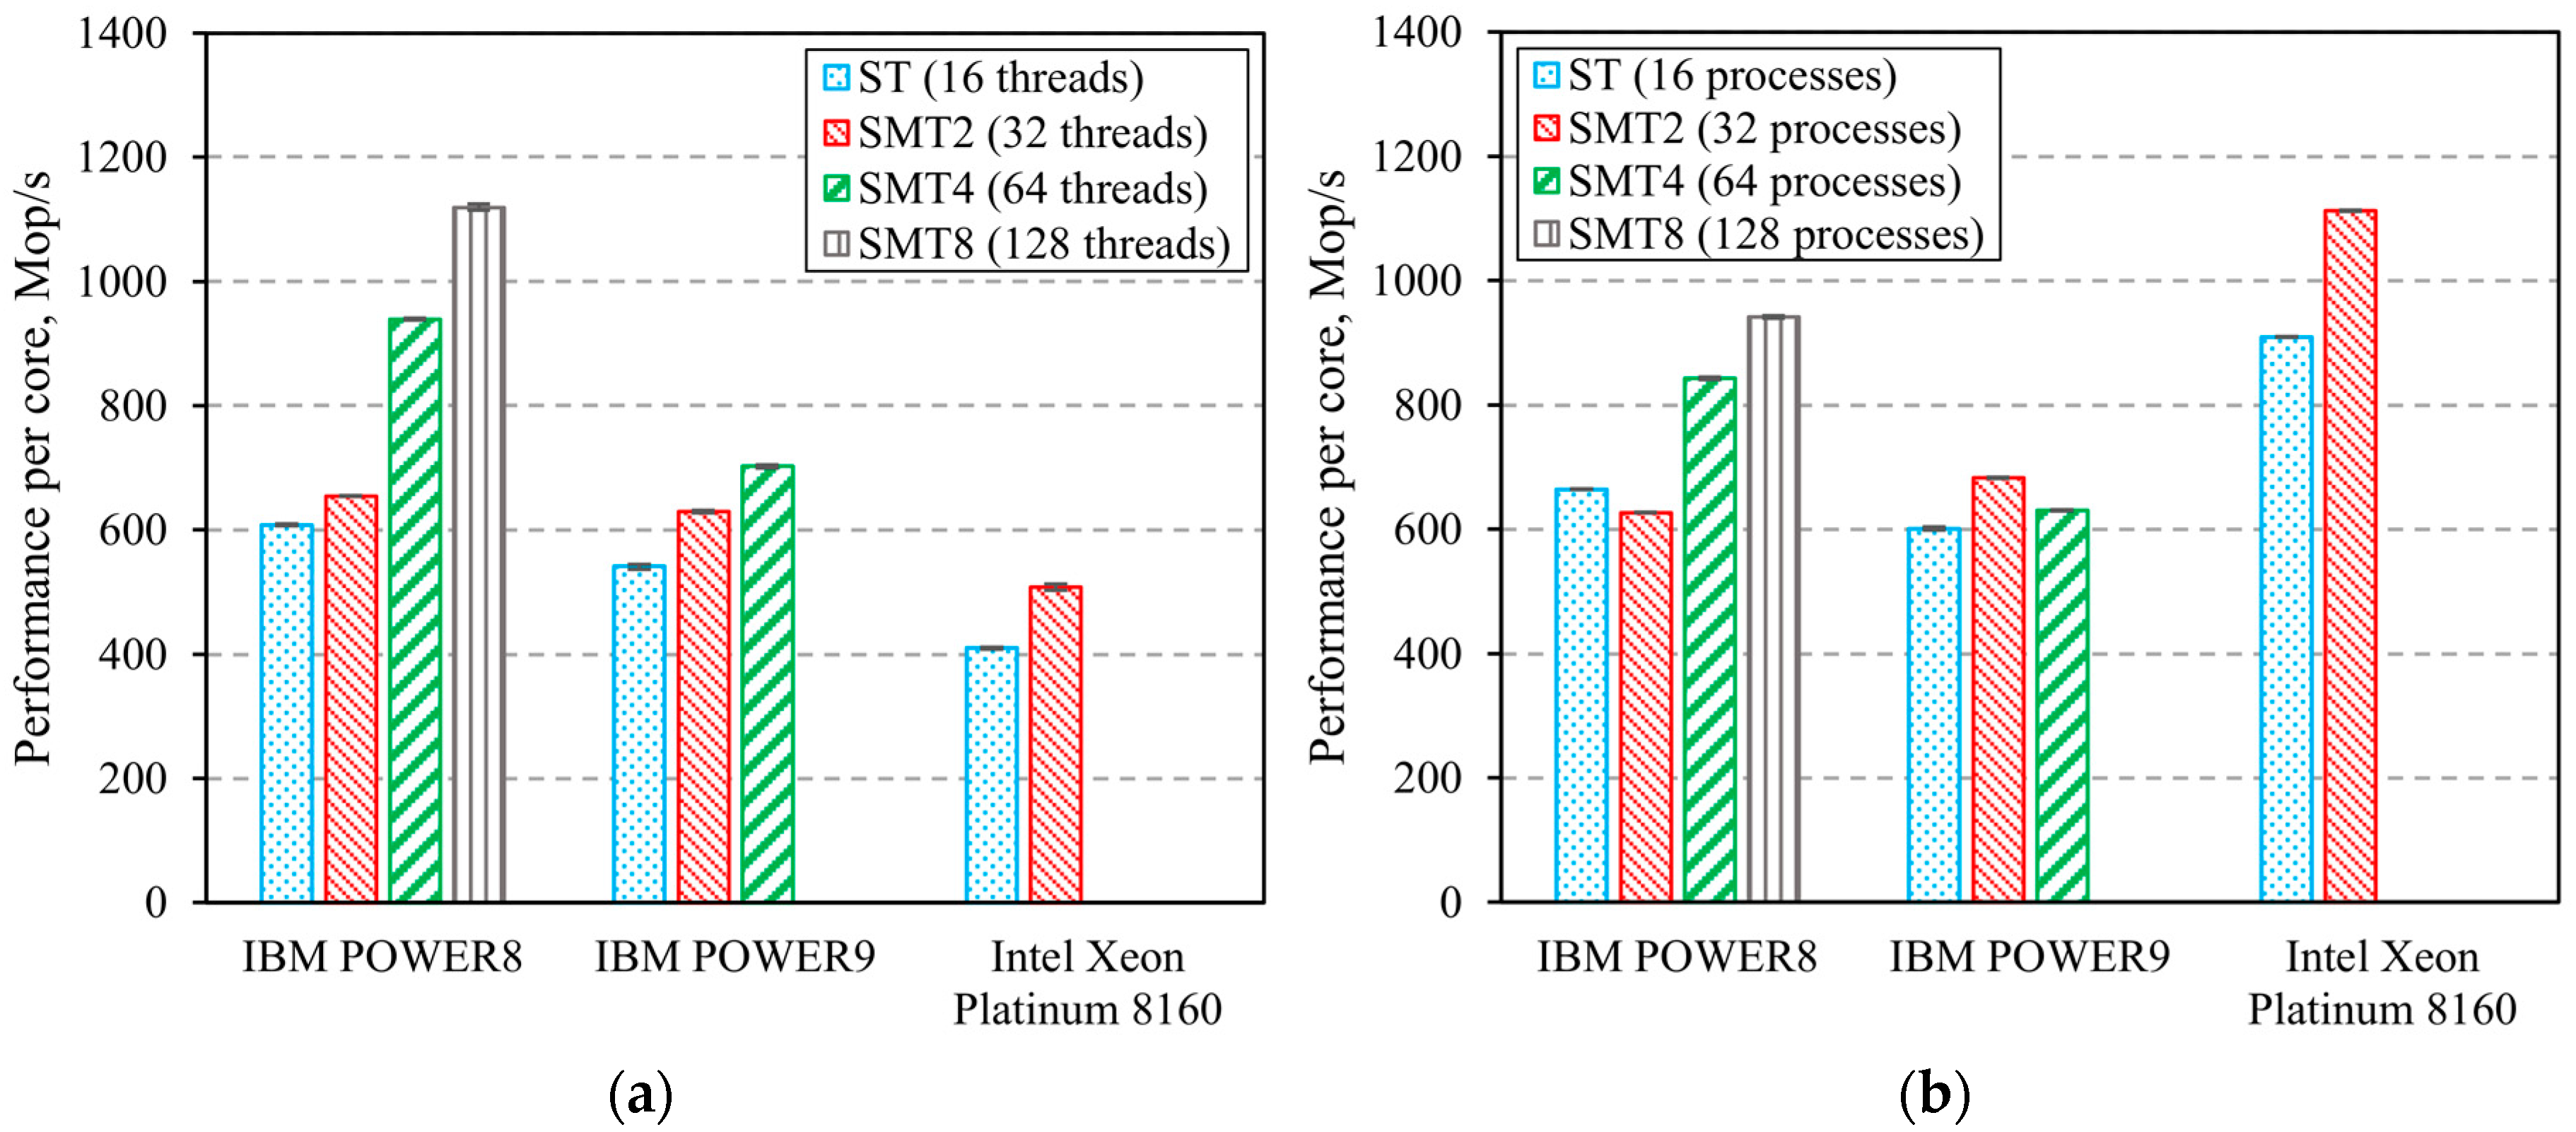
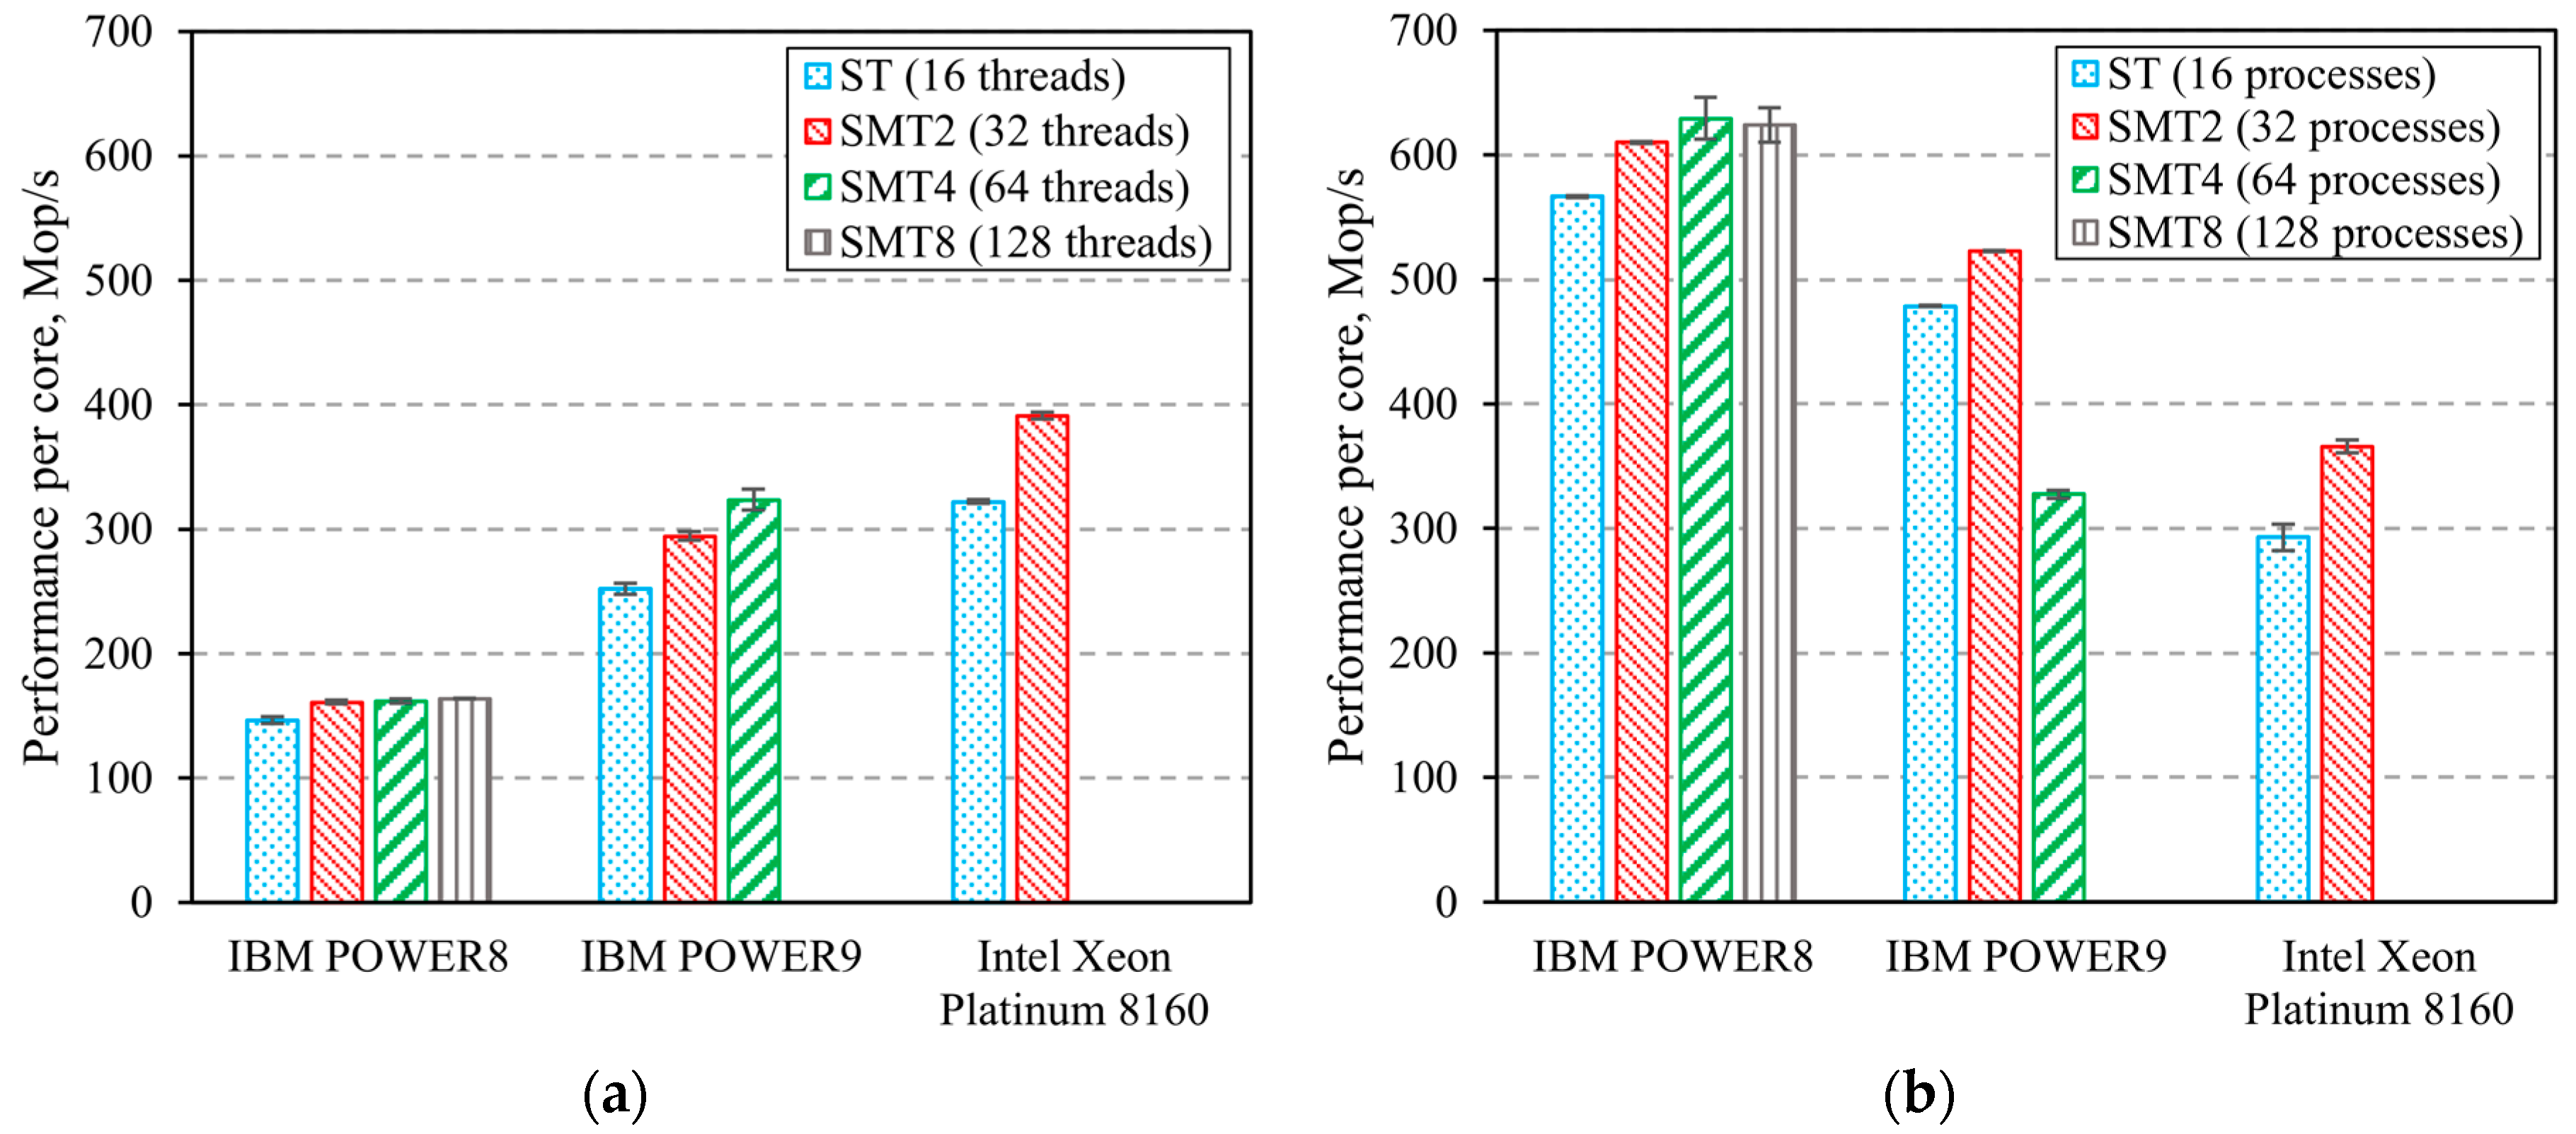
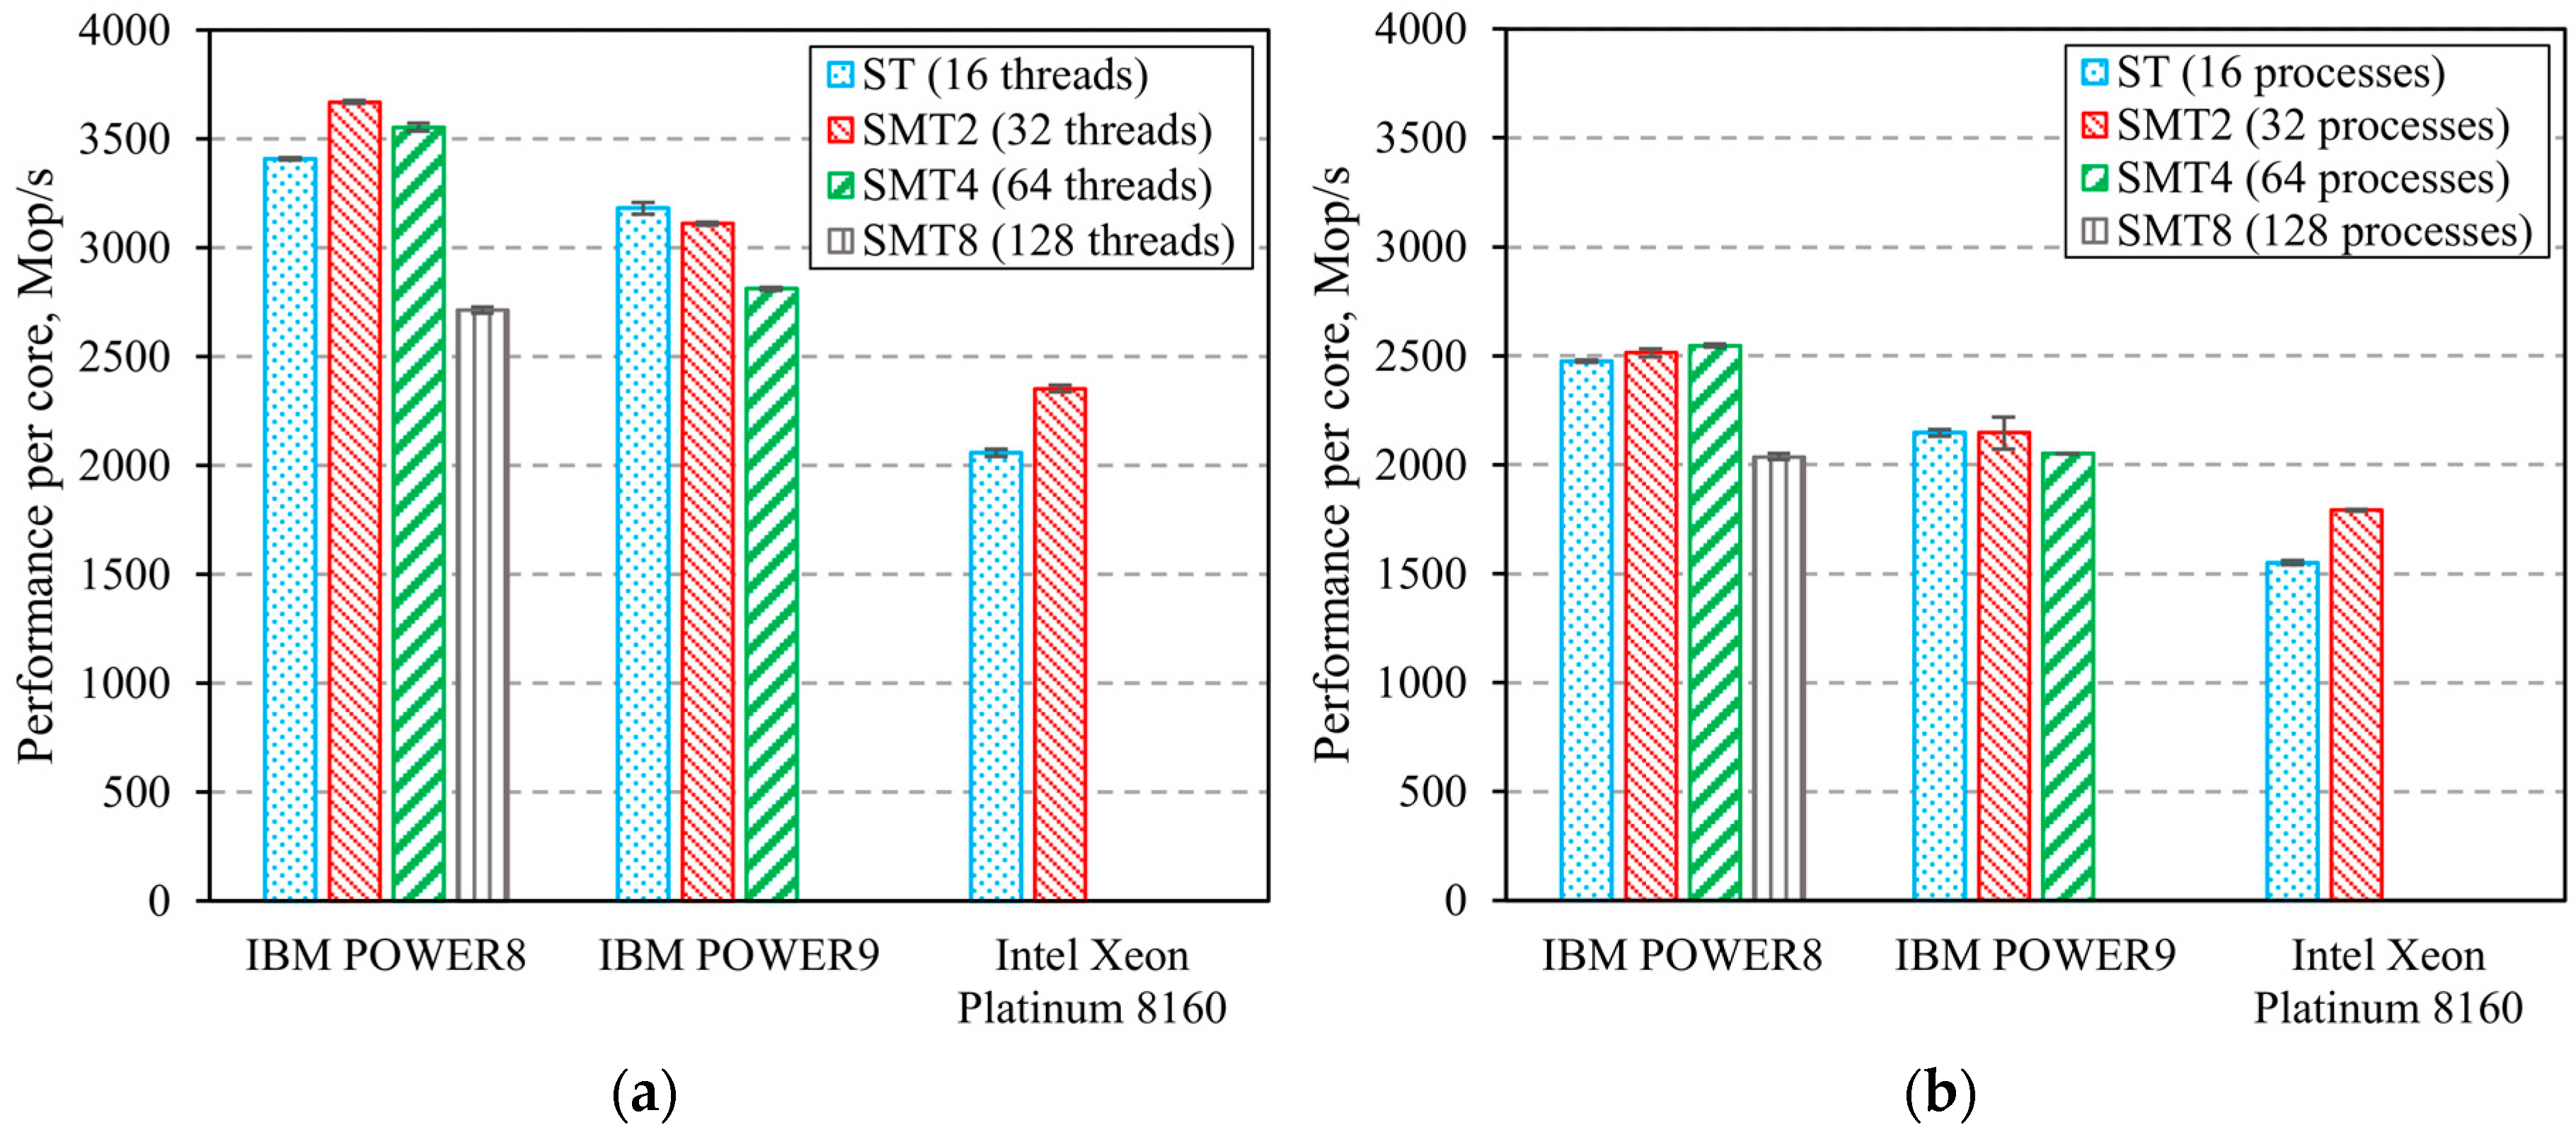
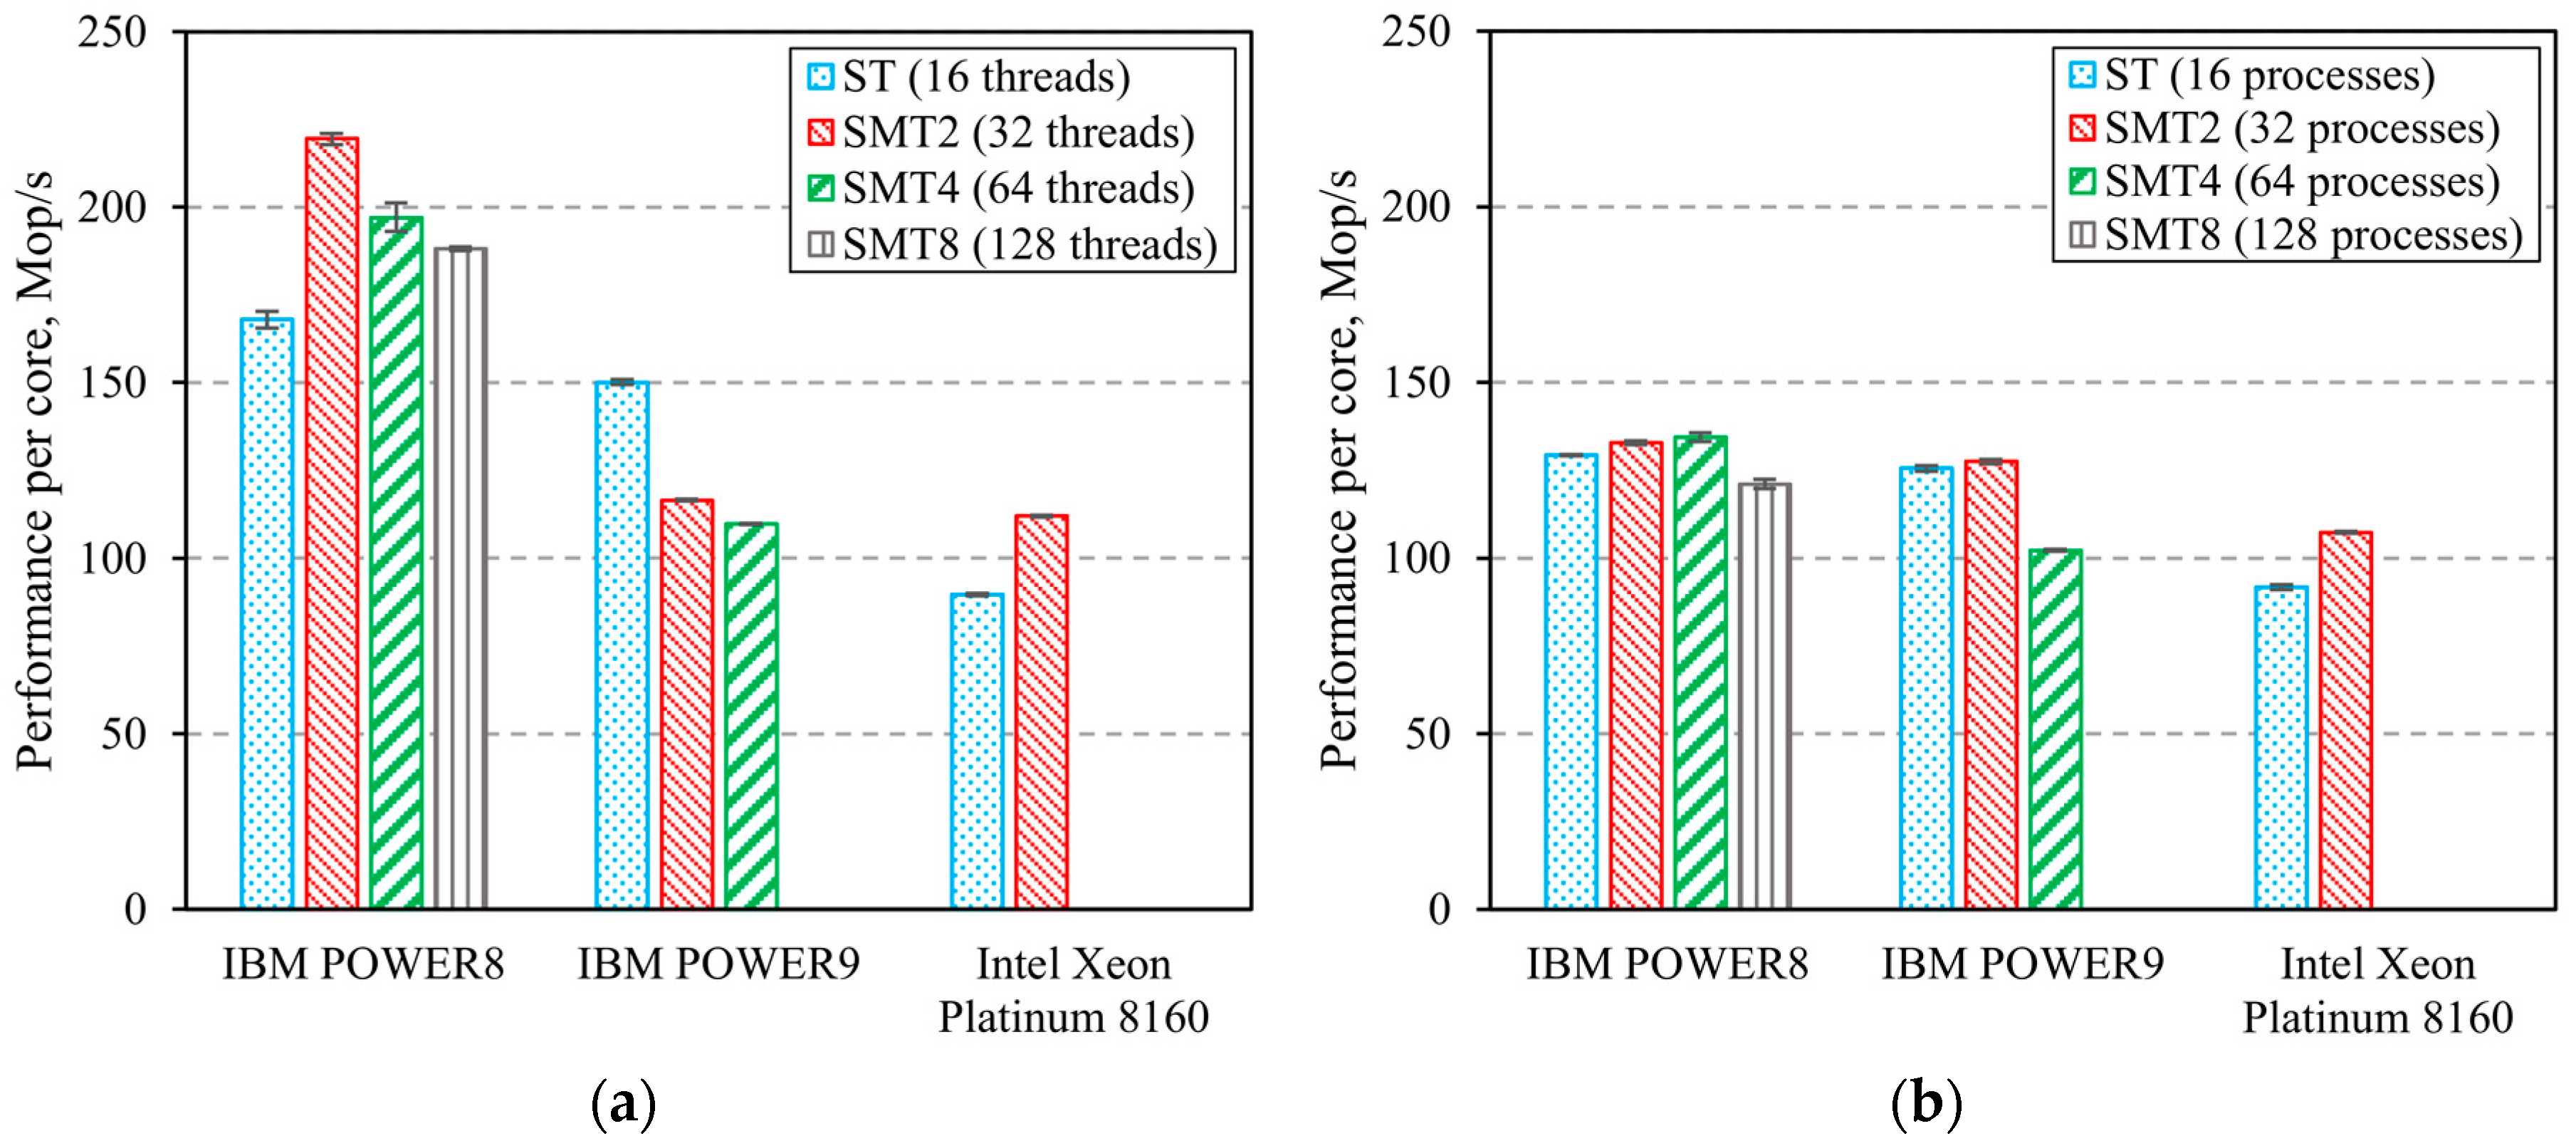
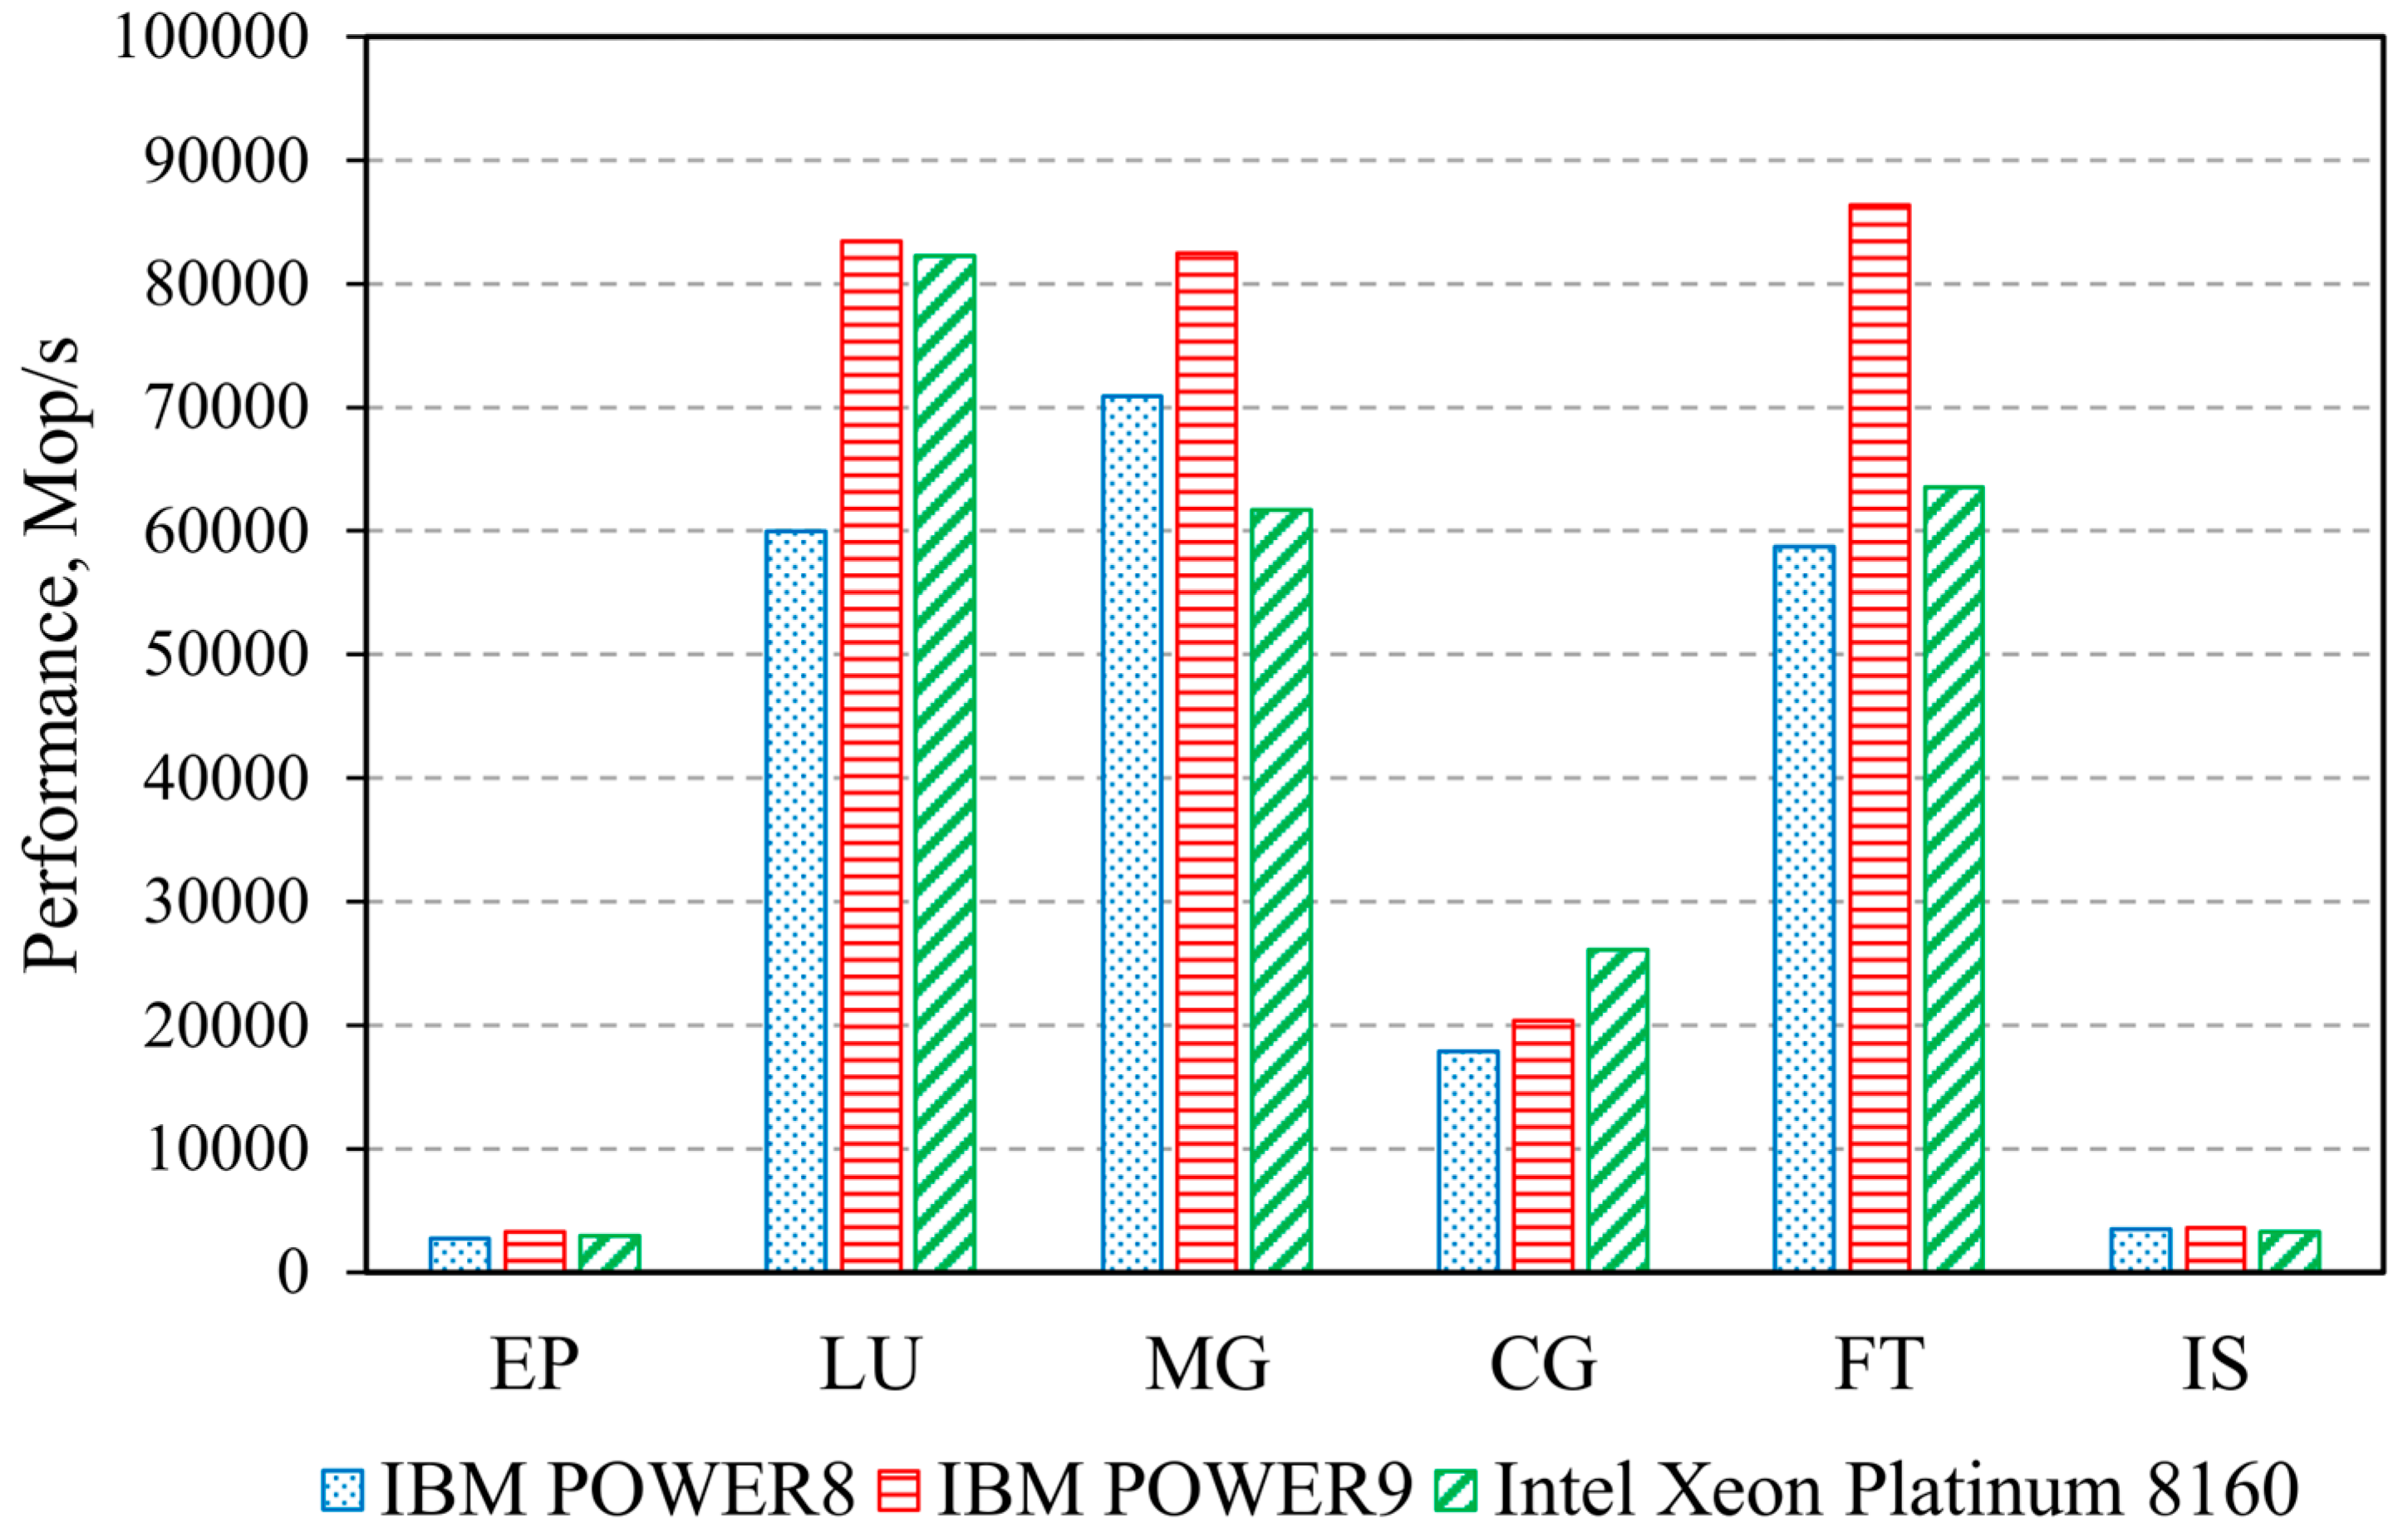
3.2. Computing Systems’ Parallel Benchmarks

A study of individual CPU cores running in various SMT modes during parallel computing using OpenMP and MPI technologies was carried out with EP, LU, MG, FT, IS (problem class C), and CG (problem classes C and D) benchmarks from the NPB suite.
Calculations were performed on 16 CPU cores of each system. During that, ST, SMT2, SMT4, and SMT8 modes were used for the IBM POWER8 system; ST, SMT2, and SMT4 modes for the IBM POWER9 system; and ST and SMT2 modes for the Intel Xeon Platinum 8160 system. PAMI (Parallel Active Messaging Interface) [15] was used for Spectrum MPI collective communication, and shm (Shared memory) [16] was used for Intel MPI. Below, the experiments’ results are presented in a sequence as per the level of load on the communication network [17]. Performance values were averaged over 10 benchmark runs.
The EP benchmark was used to evaluate the performance of floating-point calculations in the absence of noticeable inter-processor communication. This benchmark includes the generation of pseudorandom normally distributed numbers. The benchmark is CPU-bound. Figure 3 shows the performance achieved per CPU core; error bars represent standard deviation per 10 runs. The total number of computing threads (MPI processes) is indicated in parentheses. Hereinafter, performance is given in millions of operations per second (Mop/s).
The results shown in the figure show that, despite an almost double difference in operating frequency, IBM POWER8 and Intel Xeon Platinum 8160 processor cores demonstrate a similar performance in ST mode. The performance of IBM POWER9 processor cores is 9–36% lower than that of IBM POWER8 in the same mode, although the difference in operating frequency between them is 14%.
It should be noted that SMT technology significantly improves the EP benchmark results on all computing systems. SMT8 mode provides a 2.1–2.3 × performance boost for the IBM POWER8 processor compared to ST mode. SMT4 mode is optimal for IBM POWER9 and doubles its performance. The Intel Xeon Platinum 8160 processor reaches the maximum performance in SMT2 mode, with a performance increase of 35%.
The EP benchmark results showed that OpenMP technology provides a performance comparable to MPI on IBM POWER9 and Intel Xeon Platinum 8160 computing systems. MPI technology increased the performance of the IBM POWER8 computing system by 8–15%, with the greatest gain being observed in SMT4 and SMT8 modes.
LU decomposition is performed in the LU benchmark. Its performance is limited by the CPU speed. Figure 4 shows the benchmark results. It can be noted that per-core performance of the considered IBM CPUs is the same, despite the difference in operating frequency. However, Intel Xeon Platinum 8160 processor cores have, on average, a 17% lower performance.
SMT2 mode proves to be an optimal SMT mode for the Intel Xeon Platinum 8160 processor, while for IBM processors utilizing MPI technology, SMT4 is optimal. With OpenMP technology, SMT2 mode is preferred for IBM POWER8 processors, while SMT4 mode is preferred for IBM POWER9.
MG benchmark uses a multi-grid algorithm to find an approximate solution of a 3D Poisson equation with periodic boundary conditions. It features structured long-distance data communication [14]. Figure 5 shows the results of the experiments. They prove that SMT does not lead to a performance boost for any of the POWER CPUs. However, SMT does boost Intel Xeon Platinum 8160′s performance in the OpenMP implementation by 69%.
The MPI version of the test has a 20% greater performance than its OpenMP counterparts when running on IBM POWER8. On other computing systems, no difference between them is observed.
The CG benchmark implies solving random sparse linear systems by using the conjugate gradient method. It features irregular long-distance communication where reads operations prevail over writes [17]. The benchmark is memory-bound. Commutations in MPI implementation are made via non-blocking point-to-point operations. Figure 6 shows that IBM POWER8 and Intel Xeon Platinum 8160 processor cores show an identical maximum performance level for Problem Class C. IBM POWER9 processor cores have a 37% lower performance. The same performance of processor cores in Problem Class C can be explained by the small size of main program arrays that are loaded in the processor cache, which significantly reduces data-transfer overheads. This can be confirmed by the fact that additionally performed benchmarks using Problem Class D (Figure 7), which has a larger array size, showed a drop in performance for all computing systems. At the same time, performance levels began to correlate with the frequency of their CPUs in the MPI version of the test.
Note that increased performance is reached by adding threads up to the maximum permissible number for Class C of the CG benchmark. Problem Class D shows a reduced performance speedup with SMT technology. OpenMP and MPI technology are optimal parallel programming technologies for IBM processors in Problem Class C and Problem Class D of this benchmark, respectively, MPI technology is optimal for the Intel processor in Class C, and OpenMP is optimal for the same processor in Class D.
The FT benchmark implies solving discrete 3D fast Fourier transform. It features high-rate long-distance communication [14]. Benchmark performance is limited by the memory-access speed. Collective communication in the MPI benchmark version was carried out by using the following collective operations: MPI_Reduce, MPI_Barrier, MPI_Bcast, and MPI_Alltoall. The results given in Figure 8 show that OpenMP technology boosts performance up to 48% when compared to MPI technology. However, using SMT technology does not lead to any significant performance improvements for IBM processors. Using the SMT2 mode improves performance by 14% for the Intel processor.
The performance of the analyzed computing systems in this benchmark correlates well with the operation frequency of their CPUs.
The IS benchmark implies parallel sorting of a massive array of integers (see Figure 9). It is used to evaluate the performance of integer calculations in the presence of intensive interthread interaction [14]. The benchmark is memory-bound. Collective communication in the MPI benchmark version is done by means of MPI_Alltoall and MPI_Allreduce operations. Experimental results show that MPI technology provides lower performance than OpenMP, and the optimal operating mode for the IBM POWER8 and Intel Xeon Platinum 8160 processors is SMT2. The IBM POWER9 processor demonstrates the highest performance at a single thread per core. The maximum performance of processor cores correlates well with their operating frequency.
To evaluate the maximum performance of the studied computing systems performing parallel calculations on IBM POWER9 and Intel Xeon Platinum 8160 systems, benchmarks similar to those presented above were performed, using 32 processor cores. This is because the number of computational threads started by most NPB benchmarks should be a power of two. After that, the maximum achieved performance values were taken from the obtained results, which are shown in Figure 10, together with the maximum values for the IBM POWER8 system as shown in Figure 3, Figure 4, Figure 5, Figure 6, Figure 7, Figure 8 and Figure 9, multiplied by the number of threads. Thus, 80% of the cores of computing systems based on IBM processors and 67% of the cores of the Intel computing system CPUs were involved to obtain these results.
The results given in Figure 10 show that the IBM POWER9 processor has the highest performance in most benchmarks. The Intel Xeon Platinum 8160 processor exceeds IBM POWER9 in performance only in the CG benchmark. At the same time, the POWER8 processor exceeds Intel Xeon Platinum 8160 in performance in the MG and IS benchmarks.

4. Discussion

An assessment of the results obtained during experimental calculations shows that the IBM POWER8 and Xeon Platinum 8160 processors have almost the same maximum memory bandwidth, but require different numbers of threads for its efficient utilization. The IBM POWER9 system has the highest maximum bandwidth, which can be attributed to the large number of memory channels per socket.
Despite the lower memory frequency, the IBM POWER8 system shows the highest real bandwidth among all of the studied CPUs for the number of threads below 10. This is due to Centaur chips, which improve memory-access efficiency. Thus, computing systems with a similar architecture allow for improvements in the performance of applications with a low degree of parallelism and high memory-bandwidth requirements.
SMT technology improves the utilization of CPU cores when executing non-optimized applications, whose performance is limited by the speed of computing operations (e.g., EP benchmark). If the application performance is limited by memory bandwidth, then performance degradation may occur due to increased cache conflicts when using SMT technology. The best per-core performance among the tested processors is shown by the IBM POWER8 processor due to its higher operating frequency and support for up to eight hardware threads per core. In most benchmarks, except for CG, the IBM POWER9 processor has a better overall performance compared to Intel Xeon Platinum 8160.
The Intel Xeon Platinum 8160 processor had the worst performance when running non-optimized applications. Though almost three times the peak performance of the IBM POWER9 processor, which is attributable to 512-byte vector instructions (AVX-512), the actual Intel Xeon Platinum 8160 performance in the NPB was similar (IBM POWER8 and POWER9 processors have 128-byte vector instructions—VSX-2 and VSX-3 respectively). This is related to the fact that optimized software supporting the vectorization of calculations should be developed to ensure the maximum utilization of such vector execution units.
The conducted experiments allowed us to partially evaluate the effectiveness of memory cache subsystems’ organization for the studied CPUs. Thus, a larger amount of individual L2 cache per each core of the Intel Xeon Platinum 8160 CPUs allows for more efficient execution of applications that are sensitive to data locality, such as LU benchmark [18]. Furthermore, its high associativity allows for the reduction of cache misses and an increase in the performance of applications using the irregular memory access (for example, CG benchmark). On the other hand, IBM POWER CPUs with large L3 caches allow for the achievement of a better performance of caches’ size-sensitive memory-bound applications, such as FT and IS benchmarks [18]. It is worth noting that the benchmarking technique used in this study provides only general conclusions about the relationship between the performance of various application classes and the cache and memory subsystem architecture. Dedicated studies are required to analyze this relationship.
Due to the fact that MPI technology usually does not use shared memory and all interaction between computational processes is carried out by message passing, MPI-based parallel applications show better data locality than their OpenMP counterparts [18]. This results in greater MPI performance on CPUs with large cache; it also boosts the performance of SMT (EP, MG, and LU Class C and CG Class D benchmarks on IBM POWER systems) due to less cache conflicts at a greater number of processes. On the other hand, applications developed using OpenMP and MPI technologies demonstrate similar performance in most cases when running on systems with a relatively small cache (Intel Xeon Platinum 8160). OpenMP performance improvement can only be observed when intensive interaction between threads is required (FT and IS benchmarks).

5. Conclusions

This paper presents the results of a comprehensive benchmark comparison of computing systems based on IBM POWER8, IBM POWER9, and Intel Xeon Platinum 8160 CPUs. Analysis of the obtained data allows for the following main conclusions:
  • Generally, all three of the considered CPUs and computer systems based on these CPUs can be deemed as balanced in terms of overall performance. However, CPU performance differences related to program code status should be noted, as well as differences related to utilization in multipurpose hybrid computing platforms.
  • IBM processors are more efficient than Intel processors when executing a non-optimized code. This is due to their higher operating frequency, as well as the ability to start more threads per core, which improves the utilization of CPU execution units. On the other hand, systems based on Intel processors supporting vector instructions four times longer than IBM processors will have higher performance when executing similar operations in applications with optimized code (vectorized calculations; using optimized libraries, e.g., Intel MKL).
  • The POWER architecture seems to be the more preferable solution as an optimal choice for creating multipurpose hybrid computing platforms aimed at utilizing the resources of both CPUs and GPUs. IBM-based systems have a high-speed NVLink GPU interconnection bus. In particular, this solves the problem of a low GPU data transfer rate. At the same time, their high per-core performance allows for the efficient use of CPU resources to run hybrid applications, the majority of which require only one computational process per GPU. Nevertheless, the issue of overall performance evaluation of the considered hybrid computing systems requires additional research.
The research results lead to a conclusion that the age of universal computational solutions is over. This puts greater emphasis on expertise in choosing CPUs for state-of-the-art computational facilities. This choice should be based on performance analysis of an application running on a specific architecture and taking the existence of specific development tools into account to achieve the best performance for the objective. The RAM bandwidth remains a bottleneck and will be ever more important as CPU performance improvement slows down in the future.
The experimental calculations and their analysis presented could provide a possible basis for further research into IBM POWER and Intel Xeon processors’ performance and will help to optimize the configurations of high-performance computing systems based on them.

Author Contributions

Conceptualization, A.S. and S.M.; methodology, S.M., A.S. and A.Z.; resources, K.V.; software, G.T. and K.V.; validation, S.M. and G.T.; visualization, S.M. All authors discussed the results and contributed to the final manuscript. All authors have read and agreed to the published version of the manuscript.

Funding

This research was partly funded by the Russian Foundation for Basic Research (RFBR), project number 18-29-03196.

Acknowledgments

This study used the computing resources and systems of the Shared Services Center “Data Center of FEB RAS” (Khabarovsk) [19] and the Informatics Center of the Federal Research Center “Informatics and Management of the Russian Academy of Sciences” core facility (Moscow) [20].

Conflicts of Interest

The authors declare that there are no conflict of interest.

References

  1. Martel, E.; Lazcano, R.; López, J.; Madroñal, D.; Salvador, R.; López, S.; Juarez, E.; Guerra, R.; Sanz, C.; Sarmiento, R. Implementation of the Principal Component Analysis onto High-Performance Computer Facilities for Hyperspectral Dimensionality Reduction: Results and Comparisons. Remote Sens. 2018, 10, 864. [Google Scholar] [CrossRef] [Green Version]
  2. Li, T.; Narayana, V.K.; El-Ghazawi, T. Exploring Graphics Processing Unit (GPU) Resource Sharing Efficiency for High Performance Computing. Computers 2013, 2, 176–214. [Google Scholar] [CrossRef] [Green Version]
  3. Mahmoudi, S.A.; Belarbi, M.A.; Dadi, E.W.; Mahmoudi, S.; Benjelloun, M. Cloud-Based Image Retrieval Using GPU Platforms. Computers 2019, 8, 48. [Google Scholar] [CrossRef] [Green Version]
  4. Mal’kovskii, S.I.; Sorokin, A.A.; Korolev, S.P.; Zatsarinnyi, A.A.; Tsoi, G.I. Performance Evaluation of a Hybrid Computer Cluster Built on IBM POWER8 Microprocessors. Program. Comput. Softw. 2019, 45, 324–332. [Google Scholar] [CrossRef]
  5. Eggers, S.J.; Emer, J.S.; Levy, H.M.; Lo, J.L.; Stamm, R.L.; Tullsen, D.M. Simultaneous Multithreading: A Platform for Next-generation Processors. IEEE Micro 1997, 17, 12–19. [Google Scholar] [CrossRef] [Green Version]
  6. Sinharoy, B.; Van Norstrand, J.A.; Eickemeyer, R.J.; Le, H.Q.; Leenstra, J.; Nguyen, D.Q.; Konigsburg, B.; Ward, K.; Brown, M.D.; Moreira, J.E.; et al. IBM POWER8 Processor Core Microarchitecture. IBM J. Res. Dev. 2015, 59, 2:1–2:21. [Google Scholar] [CrossRef]
  7. Starke, W.J.; Stuecheli, J.; Daly, D.M.; Dodson, J.S.; Auernhammer, F.; Sagmeister, P.M.; Guthrie, G.L.; Marino, C.F.; Siegel, M.; Blaner, B. The Cache and Memory Subsystems of the IBM POWER8 Processor. IBM J. Res. Dev. 2015, 59, 1–13. [Google Scholar] [CrossRef]
  8. Sadasivam, S.K.; Thompto, B.W.; Kalla, R.; Starke, W.J. IBM Power9 Processor Architecture. IEEE Micro 2017, 37, 40–51. [Google Scholar] [CrossRef]
  9. Starke, W.J.; Dodson, J.S.; Stuecheli, J.; Retter, E.; Michael, B.W.; Powell, S.J.; Marcella, J.A. IBM POWER9 memory architectures for optimized systems. IBM J. Res. Dev. 2018, 62, 1–13. [Google Scholar] [CrossRef]
  10. Intel Xeon Processor Scalable Family Technical Overview. Available online: https://software.intel.com/content/www/us/en/develop/articles/intel-xeon-processor-scalable-family-technical-overview.html (accessed on 7 May 2020).
  11. Gorobets, A.V.; Neiman-Zade, M.I.; Okunev, S.K.; Kalyakin, A.A.; Soukov, S.A. Performance of Elbrus-8C Processor in Supercomputer CFD Simulations. Math. Models Comput. Simul. 2019, 11, 914–923. [Google Scholar] [CrossRef]
  12. Malkovsky, S.I.; Peresvetov, V.V. Performance Evaluation of the Computing Cluster on Quad-core Processors. In Proceedings of the Interregional Scientific-practical Conference Information and Communication Technologies in Education and Scientific Activity, Khabarovsk, Russia, 21–23 September 2009; pp. 261–268. [Google Scholar]
  13. McCalpin, J.D. Memory Bandwidth and Machine Balance in Current High Performance Computers. IEEE Comput. Soc. Tech. Committee Comput. Archit. (TCCA) Newsl. 1995, 59, 19–25. [Google Scholar]
  14. Bailey, D.; Barszcz, E.; Barton, J.; Browning, D.; Carter, R.; Dagum, L.; Fatoohi, R.; Fineberg, S.; Frederickson, P.; Lasinski, T.; et al. The NAS Parallel Benchmarks. RNR Technical Report RNR 94-007. March 1994. Available online: https://www.davidhbailey.com/dhbpapers/npb.pdf (accessed on 7 May 2020).
  15. Kumar, S.; Mamidala, A.R.; Faraj, D.A.; Smith, B.; Blocksome, M.; Cernohous, B.; Miller, D.; Parker, J.; Ratterman, J.; Heidelberger, P.; et al. PAMI: A Parallel Active Message Interface for the Blue Gene/Q Supercomputer. In Proceedings of the 2012 IEEE 26th International Parallel and Distributed Processing Symposium, Shanghai, China, 21–25 May 2012; pp. 763–773. [Google Scholar]
  16. Supalov, A.; Semin, A.; Dahnken, C.; Klemm, M. Optimizing HPC Applications with Intel Cluster Tools; Apress: New York City, NY, USA, 2014; p. 291. [Google Scholar]
  17. Takouna, I.; Dawoud, W.; Meinel, C. Analysis and Simulation of HPC Applications in Virtualized Data Centers. In Proceedings of the 2012 IEEE International Conference on Green Computing and Communications, Besancon, France, 20–23 November 2012; pp. 498–507. [Google Scholar]
  18. Ibrahim, K.; Williams, S.; Oliker, L. Roofline Scaling Trajectories: A Method for Parallel Application and Architectural Performance Analysis. In Proceedings of the 2018 International Conference on High Performance Computing & Simulation, Orléans, France, 16–20 July 2018; pp. 350–358. [Google Scholar]
  19. Sorokin, A.A.; Makogonov, S.V.; Korolev, S.P. The Information Infrastructure for Collective Scientific Work in the Far East of Russia. Sci. Tech. Inf. Process. 2017, 4, 302–304. [Google Scholar] [CrossRef]
  20. Informatics Core Facility Statute. Available online: http://www.frccsc.ru/ckp (accessed on 22 January 2020).
Figure 1. Benchmark results for Copy (a) and Scale (b) kernel.
Electronics 09 01035 g001
Figure 2. Benchmark results for Add (a) and Triad (b) kernel.
Electronics 09 01035 g002
Figure 3. EP benchmark results: OpenMP version (a) and MPI version (b).
Electronics 09 01035 g003
Figure 4. LU benchmark results: OpenMP version (a) and MPI version (b).
Electronics 09 01035 g004
Figure 5. MG benchmark results: OpenMP version (a) and MPI version (b).
Electronics 09 01035 g005
Figure 6. CG Class C benchmark results: OpenMP version (a) and MPI version (b).
Electronics 09 01035 g006
Figure 7. CG Class D benchmark results: OpenMP version (a) and MPI version (b).
Electronics 09 01035 g007
Figure 8. FT benchmark results: OpenMP version (a) and MPI version (b).
Electronics 09 01035 g008
Figure 9. IS benchmark results: OpenMP version (a) and MPI version (b).
Electronics 09 01035 g009
Figure 10. Maximum performance of computing systems in the NPB (Problem Class C).
Electronics 09 01035 g010
Table 1. Key characteristics of computing systems’ CPUs.
CharacteristicIBM POWER8IBM POWER9Intel Xeon Platinum 8160
Lithography22 nm14 nm14 nm
Operating frequency4.023 GHz3.5 GHz2.1 GHz
Cores102024
Command set extensionsVMX, VSX-2VMX, VSX-3SSE4.2, AVX, AVX2, AVX-512
Hardware threads80 (SMT8)80 (SMT4)48 (SMT2)
Peak performance (double-precision)0.32 TFLOPS (0.032 TFLOPS per core)0.56 TFLOPS (0.028 TFLOPS per core)1.54 TFLOPS (0.064 TFLOPS per core)
L1I/L1D Cache (per core) capacity/associativity32/64 KB, 8-way32/32 KB, 8-way32/32 KB, 8-way
L2 cache (per core) capacity/associativity512 KB, 8-way256 KB, 8-way1024 KB, 16-way
L3 cache (per chip) capacity/associativity80 MB, 8-way100 MB, 20-way33 MB, 11-way
L4 Cache (per chip) capacity/associativity120 MB, 16-way (Centaur)--
Memory channels486
Memory typeDDR4-2400DDR4-2666DDR4-2666
GPU busNVLink 1.0NVLink 2.0PCIe 3.0
Table 2. Computing systems’ software.
Software TypeIBM POWER8 SystemIBM POWER9 SystemIntel Xeon Platinum 8160 System
Operating SystemCentOS 7.6RedHat 7.6CentOS 7.6
CompilerIBM XL C/C++, Fortran 16.1.1IBM XL C/C++, Fortran 16.1.1Intel C/C++, Fortran 19.0.5
MPI LibraryIBM Spectrum MPI 10.3IBM Spectrum MPI 10.3Intel MPI Library 2019 Update 5
Table 3. List of used benchmarks.
Tested MetricsBenchmark NameSoftware Version
Memory bandwidth benchmarkSTREAM [13]5.10
Benchmark for computing systems running parallel applicationsNAS Parallel Benchmarks (NPB) [14]3.4
Table 4. STREAM benchmark computational kernels.
NameOperationByte per IterationFLOPS per Iteration
Copya(i) = b(i)160
Scalea(i) = q × b(i)161
Adda(i) = b(i) + c(i)241
Triada(i) = b(i) + q × c(i)242
Table 5. Memory bandwidth (per socket).
Description/ProcessorIBM POWER8IBM POWER9Intel Xeon Platinum 8160
Memory channels486
Bandwidth per channel (GB/s)28.821.2521.33
Total bandwidth (GB/s)115.2170128
Table 6. Optimization flags.
BenchmarkIBM POWER8 SystemIBM POWER9 SystemIntel Xeon Platinum 8160 System
STREAM (C)-O0 -qsmp=omp -fno-builtin
-qtune=pwr8 -mcpu=pwr8
-qarch=pwr8
-O0 -qsmp=omp -fno-builtin
-qtune=pwr9 -mcpu=pwr9
-qarch=pwr9
-O3 -qopenmp
-qopt-zmm-usage=high
-mcmodel=medium
NPB (C)-O3 -qsmp=omp
-qarch=pwr8
-mcpu=pwr8 -qtune=pwr8
-qunroll=yes -qhot
-O3 -qsmp=omp
-qarch=pwr9
-mcpu=pwr9 -qtune=pwr9
-qunroll=yes -qhot
-O3 -qopenmp
-mcmodel=medium
-shared-intel
NPB (FORTRAN)-O3 -qsmp=omp
-qarch=pwr8
-qtune=pwr8 -qunroll=yes
-qhot -qnosave
-O3 -qsmp=omp
-qarch=pwr9
-qtune=pwr9 -qunroll=yes
-qhot -qnosave
-O3 -qopenmp

