1. Introduction
Modern urbanization has significantly changed people’s living arrangements, making public transportation, particularly taxi services, a convenient and affordable means of travel for most people, especially when owning a car and paying parking fees is exorbitant. In New York city, 80% of the residents do not own a car [
1]. This leads to an explosive growth of the taxi fleet size (e.g., regular yellow taxis in New York city), and ride-hailing service demand, which results in increasing congestion and inefficient exploitation of the resources. For regular taxi services, like yellow taxis in New York city, the taxi drivers do not know the exact locations of potential customers, while for the ride-hailing taxi services, such as Uber, Lyft, and Didi, customers send requests with their locations to nearby ride-hailing vehicles. In both taxi services, and independently of the level of knowledge about the customers’ demand, users experience long waiting time periods before getting a ride. At the same time, taxi drivers are engaged in a tedious customer hunting search, traveling long distances. Indeed, even with the ride-hailing service, customers may find out that the nearest available vehicle needs a long time to pick them up. Therefore, there is a pressing need to improve the utilization of such a means of transportation and enhance the efficiency of both services for the benefits of both customers and drivers.
In regular taxi services, traditional ways for taxi drivers to find potential customers include driving around the city and waiting at some ’hot spots’, e.g., taxicab stands. For the first option, taxi drivers usually follow an intuition-based trajectory hoping to find customers as soon as possible, while for the second option, most of the drivers will target the same hot spots since based on their personnel experience, they know when and where customers will be gathered. In the latter case, regular taxi drivers may be subject to an unfair competition since the number of taxis is higher than the demand or vice versa. Hence, traditional solutions for customer hunting are usually exhaustive and inaccurate. On the other hand, for the ride-hailing taxi services, although a central server is dedicated to manage the requests of customers and allocate them to drivers, similar problems that face regular taxi services still exist. Customers’ requests might still be raised far away from drivers’ locations and high vacant distances are accumulated, resulting in huge and redundant fuel consumption. In Portland, the average waiting times are estimated to be around six and ten minutes for regular and ride-hailing taxi services, respectively, according KGW News [
2]. Therefore, it is recommended to enhance the efficiency of such transportation services by tackling the offer/demand problem in both taxi categories.
Thanks to the spread of on-board and infrastructure-based sensors [
3], collecting and sharing data have become very common, especially in urban areas, where several novel data-driven applications exist, including Google Navigation, Waze, and parking localization service. This is additionally boosted by the emerging concept of vehicular social network (VSN), which effectively exploits the data availability in transportation networks [
4,
5]. With the installation and spread of on-board sensors, the data sharing ability has dramatically increased [
3]. Mobile apps like Google Navigation and Waze utilize the historical traffic data and human-report accidents to improve the navigation services. The emerging concept of vehicular social network (VSN) has been proposed to better exploit the data availability among road users and transportation networks. A variety of applications and use cases have been discussed in [
4,
5,
6,
7]. VSN enables interactions between different participants, including human-to-vehicle and vehicle-to-vehicle interactions [
8,
9]. As an example, the connected vehicle technology in NYC is developed to leverage the safety of road users. It relies on vehicle-to-vehicle (V2V), vehicle-to-infrastructure (V2I) and infrastructure-to-pedestrian (IVP) to share information among them and better assess the transportation network (
https://www.cvp.nyc/). Hence applied to our context, VSN can be utilized for improving the communication among taxi drivers and exploit their information to revamp the operation of taxi drivers by enabling efficient and real-time identification and sharing of their locations, as well as knowledge about customers such as pick up time, pick up places, drop off time, and drop off paces, as well as accurate and relevant data about the traffic situation. Such real-time data sharing can provide a clearer vision about the current customers’ requests and help continuously predict the future demand at different regions of the navigation map [
10,
11]. This technological advance significantly contributes to designing novel taxi recommendation solutions for customer hunting [
12] or involving highly connected autonomous taxis [
13].
In this paper, we propose a combination of data-driven solutions that jointly improve the taxi service efficiency by recommending the operation of both regular taxicabs and ride-hailing taxis [
14]. The proposed recommendation systems consists of three phases: (i) a demand prediction phase, (ii) a taxi-to-region matching phase, and (iii) a route planning phase. The proposed system divides the geographical urban area into several sub-regions and predicts the future demand during the next time periods for each region. Afterwards, it assigns taxis to this region based on the predicted demand. The number of taxis associated to each region is determined such that redundant taxi travel is avoided/reduced. This is performed by taking into account the current locations of the taxis and the predicted demand of each region. The problem is modeled as a bipartite graph which is designed such that the total expected traveled distance for taxis during the transition phase (i.e., taxis moving to their assigned locations) is minimized. Finally, the taxi recommendation system employed for realistic maps provide to drivers optimized trajectories to follow given real-time traffic data. The realistic map is converted into a graph and the Dijkstra’s algorithm is applied to determine the fastest paths for each member of the taxi fleet when needed. Three key principal performance indicators, namely total number of pick-ups, total customer waiting time, and total traveled distance for vacant taxis, are evaluated for both regular and ride-hailing taxi services and employed to compare our proposed system versus traditional solutions using realistic data of the area of Manhattan, Borough of New York city.
The main contributions of this paper are summarized as follows:
We develop demand prediction models to precisely estimate the future demands in each region of the area of interest. One is online learning time series and the other is Long Short Term Memory model (LSTM). Their accuracies are validated using realistic data.
We convert the taxi-to-region matching problem into a bipartite perfect matching graph, where we evenly assign taxis to different regions based on their future demands and the current locations of the taxis.
We optimize the routing of each taxi by minimizing the expected time spent from its current location to the guided destination using the Dijkstra’s algorithm by considering the real-time traffic data and geodesic distances of the road network.
We develop a real-time simulated taxi operation based on the recommendation system using realistic maps, which provides evidence that significant performance gains can be achieved as compared to the traditional case.
The rest of the paper is organized as follows.
Section 2 provides a literature review.
Section 3 presents the system model and the adopted methodology.
Section 4 develops the taxi recommendation system.
Section 5 describes the proposed simulated taxi operation.
Section 6 presents and discusses selected simulation results. Finally, concluding remarks and future directions are drawn in
Section 7.
2. Related Work
Over the last few years, researchers have focused on designing solutions to support taxi drivers in enhancing their services. One of the main research directions is the identification of hot spot areas and the prediction of the demand, e.g., using Gaussian process regression [
15] or reinforcement learning [
16]. The objective is to identify regions with high likelihood of finding potential customers by predicting the spatial distribution of taxi passengers for a short-term time horizon [
17,
18]. The recommendation system assigns hot spot areas to vacant taxi drivers in order to shorten the waiting time for customers [
19]. In [
20], the authors proposed a mutual recommendation system that assigns hot spots for both taxi and passengers based on the trajectory of taxis. In [
21], the authors developed a route recommendation engine to minimize vacant traveled distance through Monte Carlo tree search algorithm. These studies mainly focus on a single taxi and do not consider the situations where some hot spot areas are attracting a number of taxis larger than the needed demands or the opposite case. Some researchers focused on designing algorithms for ride-sharing services while addressing different research questions including taxi-to-customers assignment, demand and pricing, competition impacts, etc. [
22]. In [
23,
24], the authors proposed Integer Linear Programs (ILP) that can match large groups of riders to a fleet of shared vehicles in real-time with certain capacity size. The algorithms are designed to address the current situation without considering future demands. Moreover, their computational complexity remains high. The adopted routing methods are based on the shortest path algorithm which does not consider traffic data and congestion level.
Spatial-demand prediction was one of the essential topics that are investigated in the context of taxi recommendation systems. In [
25], the authors proposed Multi-View Spatial-Temporal Network (DMVST-Net) approach to predict the taxi demand. It is shown that the proposed method achieves a Mean Absolute Percentage Error (MAPE) of
. However, the predicted results are daily instead of hourly, which is not suitable for assisting drivers. Moreover, the running time to generate hourly results is also high. In [
26], the authors predicted the short-term supply–demand gap of taxis by partitioning the city area into various regular Hexagon lattices-based Convolutional Neural Networks (H-CNN). However, the proposed model is also computationally expensive compared to traditional methods while achieving slightly better performance. More importantly, it is not necessarily true that cities have uniform partitioning of their area, such as the case of Manhattan, NYC. Therefore, in this study, we use the cities’ own region partition to predict the future demand using a faster algorithm in a real-time manner.
Recently, taxi recommendation studies consider more generalized scenarios and are not limited to a specific task. For instance, in [
27], the authors developed a recommendation system for taxis by jointly considering the benefits of both drivers and passengers. The driver’s utility includes expected revenue, searching time for next passenger, traveled distance, while the passenger’s utility includes the waiting time. The authors grouped pick-up locations into clusters and defined them as the hot spot areas, to which it assigns taxis according to their scores. The recommendation system efficiently works for selected hot sport areas but ignores other areas with lower demand. Also, the speed of the vacant taxis is assumed to be constant which is not very practical. In [
28], the authors presented a receding horizon control framework to dispatch taxis, with the demand prediction based on the estimated demand distribution. The system is evaluated on a square region without practical road network. In [
29], the authors analyzed the dynamic spatial equilibrium of taxis and provided efficient regulation for taxi services in different regions. In [
30], the authors presented a two-stage stochastic optimization formulation to consider expected future demand to solve the spatio-temporal matching problem, i.e., taxi matching. Generally, most of the studies discussed earlier do not consider the real-time locations of the taxis.
Furthermore, some other researchers focused on the cruising and matching for the taxi drivers. In [
31], the authors provided a data-driven simulation framework for ride-sharing taxis simulated in a simplistic grid map. The proposed approach provides a path for a taxi while optimizing a certain cost function, such as traveled distance or gasoline consumption. In [
32], the authors found out that driver’s cruising choice is learned from his/her previous experience and his/her interactions with other drivers. In [
33], the authors proposed pCruise system to reduce the taxi’s cruising miles by providing the shortest cruising route with at least one expected available passengers for this route. In [
34], the authors developed efficient algorithms for non-myopic adaptive routing to minimize the collective travel time of all vehicles in the system. In [
35], the authors proposed solutions to reduce the number of cruising miles while increasing the number of live miles of taxis by suggesting profitable locations to taxicab drivers. Other research directions have investigated dynamic models to arrange ride-sharing vehicles with discrete simulation environment [
36,
37]. The authors of [
38,
39] have proposed data-driven vehicle re-balancing across regions but lack future demands prediction. Some researchers provided a graph partitioning methodology to partition the bipartite graph with lower computational complexity and implemented it in the one-to-one ride-matching problems [
40]. Another study has modeled the matching problem as a competition strategy between different ride-hailing companies [
41]. Despite the previous studies providing solutions for taxi cruising and matching problem, most of the methods are built in simplistic maps without convincing evidence to show the practicality of their methods. Moreover, they did not take the demand prediction, taxi dispatch, and route selection together into consideration. To the best of our knowledge, the recommendation system that we propose is the first one which jointly takes into account the prediction of future demands, taxi dispatch, and cruising routes selection for both regular and ride-hailing taxi services and is validated using realistic data and map.
3. System Model and Methodology
We propose to design a novel recommendation system for taxis cruising on a large geographical area. The latter is sub-divided into multiple regions for which we aim to predict the demand based on their respective historical data. The demand in the area of interest is estimated and updated in every time period
T. In this paper, we focus on both the regular and ride-hailing taxi services. The difference is that regular taxi drivers are supposed to not know the exact locations of the customers as the ride-hailing vehicles, which are informed by the exact locations once they receive the request. Hence, we assume that for regular taxis, the pick-up happens when a taxi driver sees a customer waving his/her hand (e.g., when the distance between the customer and taxi is less than 100 m). In
Table 1, we present the summary of the different taxi services managed by the proposed recommendation system.
Note that the regular taxi services can be split into two categories: the traditional regular taxi services without VSN and the smart regular taxi services with VSN. In both services, taxi drivers are not aware of the locations of customers, but with the smart regular taxi services, when a pick-up happens, all other taxis via the recommendation system are aware about it. Hence, they are instantaneously updated about the changes in the area of interest. In other words, the system can adjust the hunting search locations for vacant taxis during the period T in a real-time manner instead of waiting until the end of the time period T, as it is the case with traditional services. For the ride-hailing taxi service, the taxis are aware of the locations of both users’ demand and taxis in real-time and hence, it continuously provides recommendations to vacant taxis.
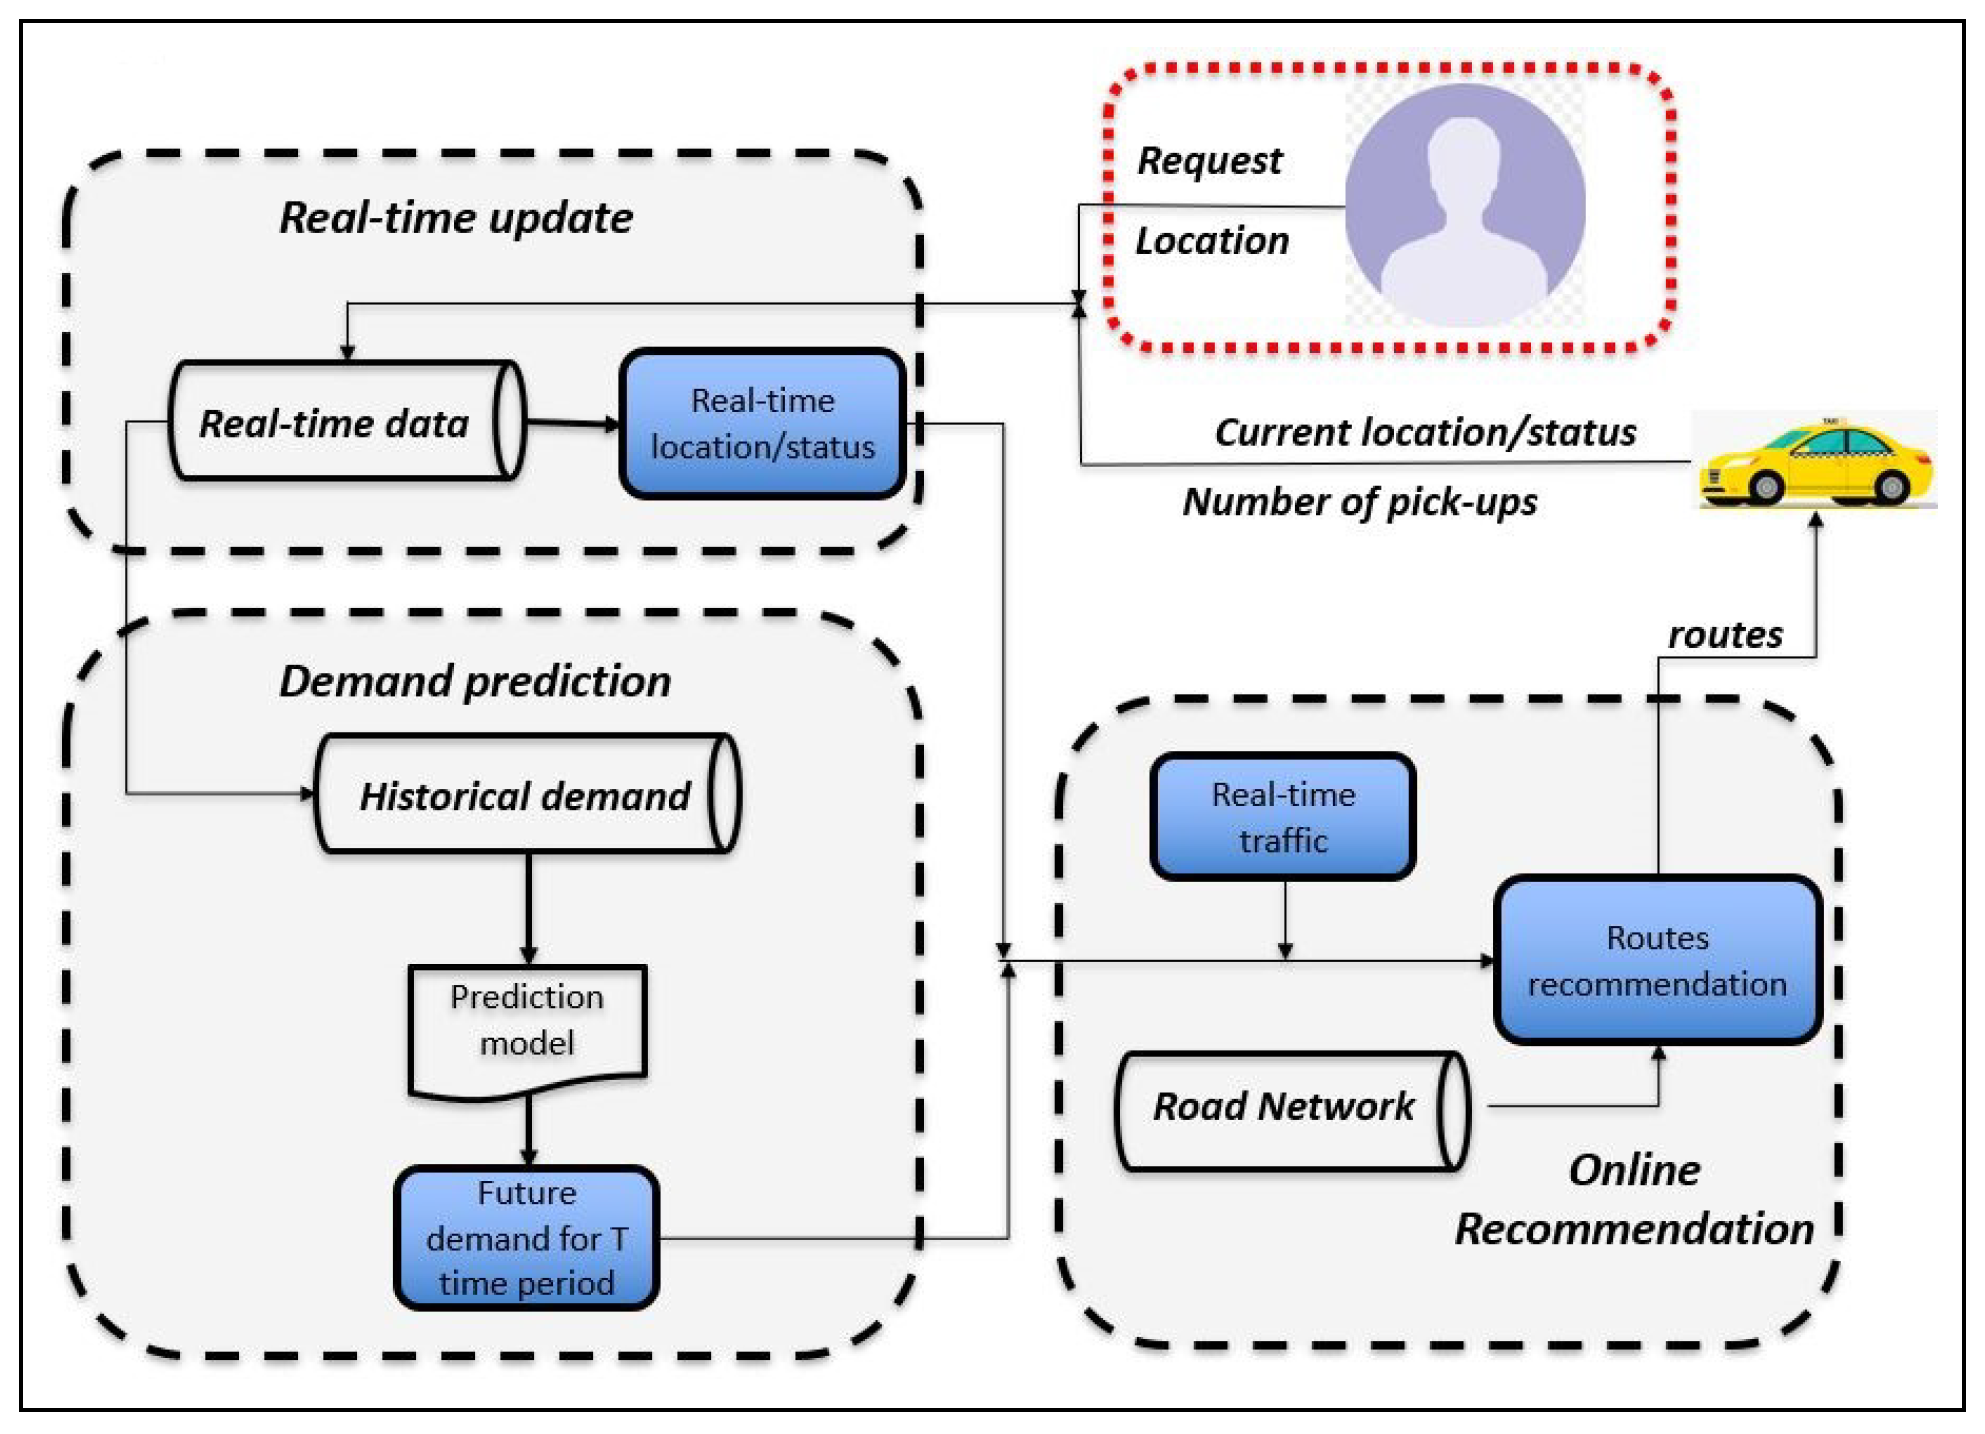
In
Figure 1, we present the overview of the proposed framework for regular and ride-hailing taxi services. There are three major phases: the first phase is the real-time data update phase where information is collected from customers and taxi drivers. The data includes the current locations of customers and taxis in addition to the statuses of taxis (vacant or occupied) and the number of pick-ups already done. The second phase is the demand prediction phase that is executed every period
T. In this phase, the historical data is used to predict the demand of the area of interest. Note that for every
T time period, the system would predict the demand only once, set at the beginning of that time period
T. Then, the demand would be updated by considering the number of pick-ups happening during the entire time period
T. The third phase encompasses the process of taxi-to-region matching and taxi routing. For the taxi-to-region matching, the recommendation system assigns vacant taxis to the different regions based on their locations and the potential future demand on that region, e.g., if the system recommends several taxis to some regions, it will only send them to the nearby ones. For the route selection, the system determines the routes for all taxis to reach their destinations by minimizing the expected time spent on their trips by considering the collected real-time traffic data.
4. Proposed Taxi Recommendation System
In this section, we introduce the different components and steps of the proposed taxi recommendation system: (1) the taxi demand predictor, (2) the taxi-to-region matching component, and (3) the taxi routing optimizer.
4.1. Taxi Demand Predictor
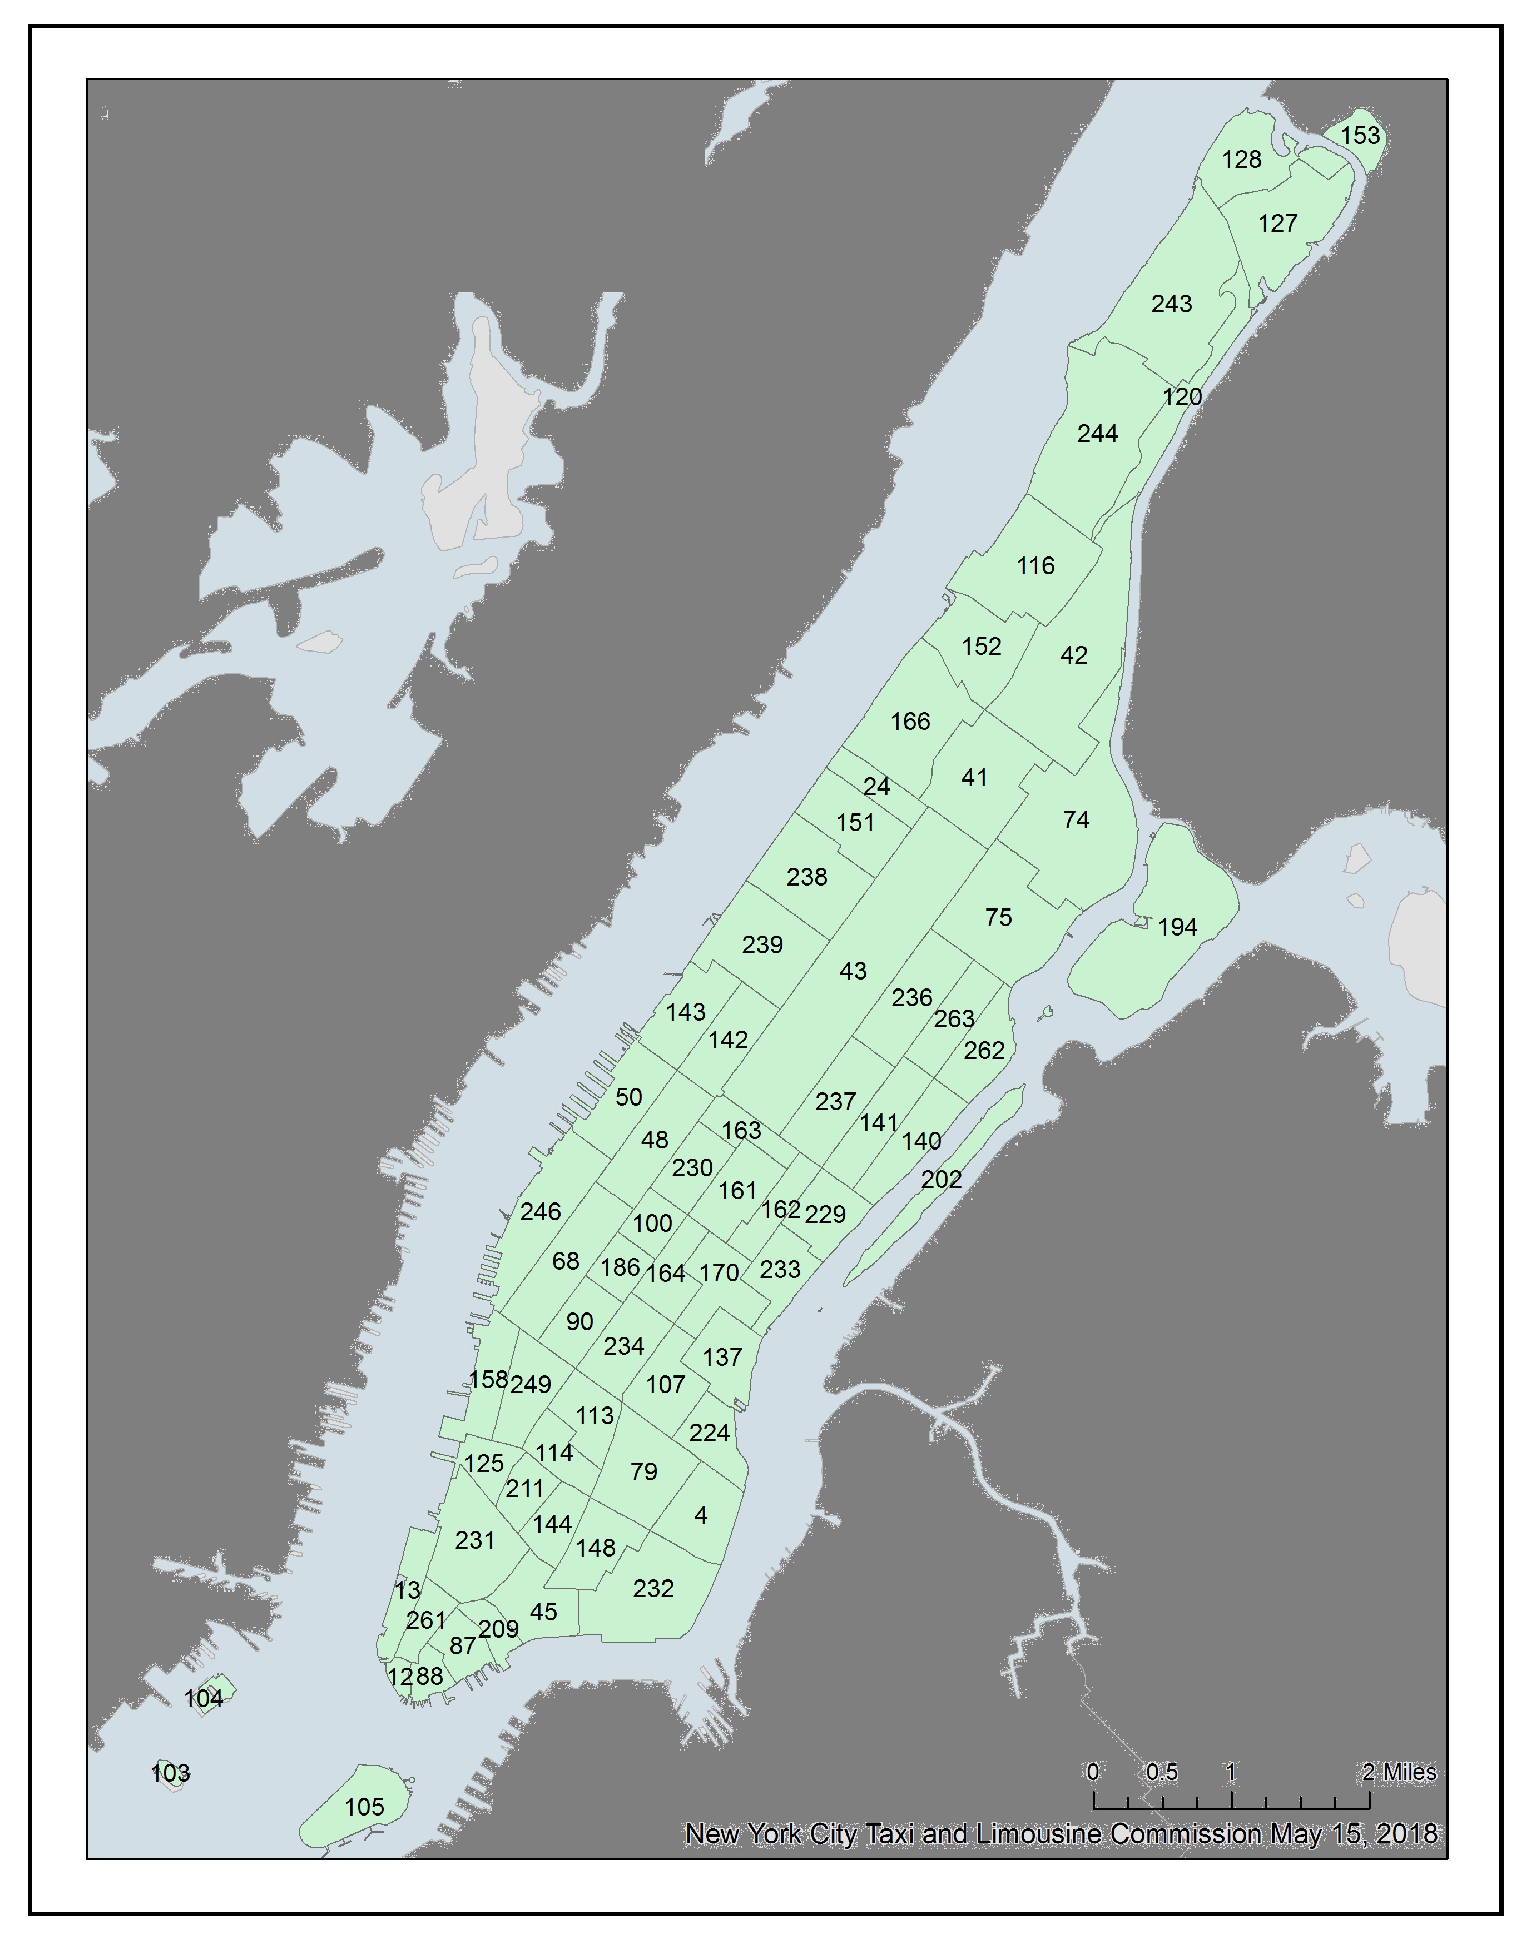
The first step is to predict the customer demand in the area of interest. We introduce and compare two models that fit the scope of this task. One is Long Short Term Memory (LSTM) model and the other is Autoregressive integrated moving average (ARIMA) model. To illustrate their accuracy, we collect the data about the operation of yellow taxis from the Taxi Limousine Commission (TLC) (
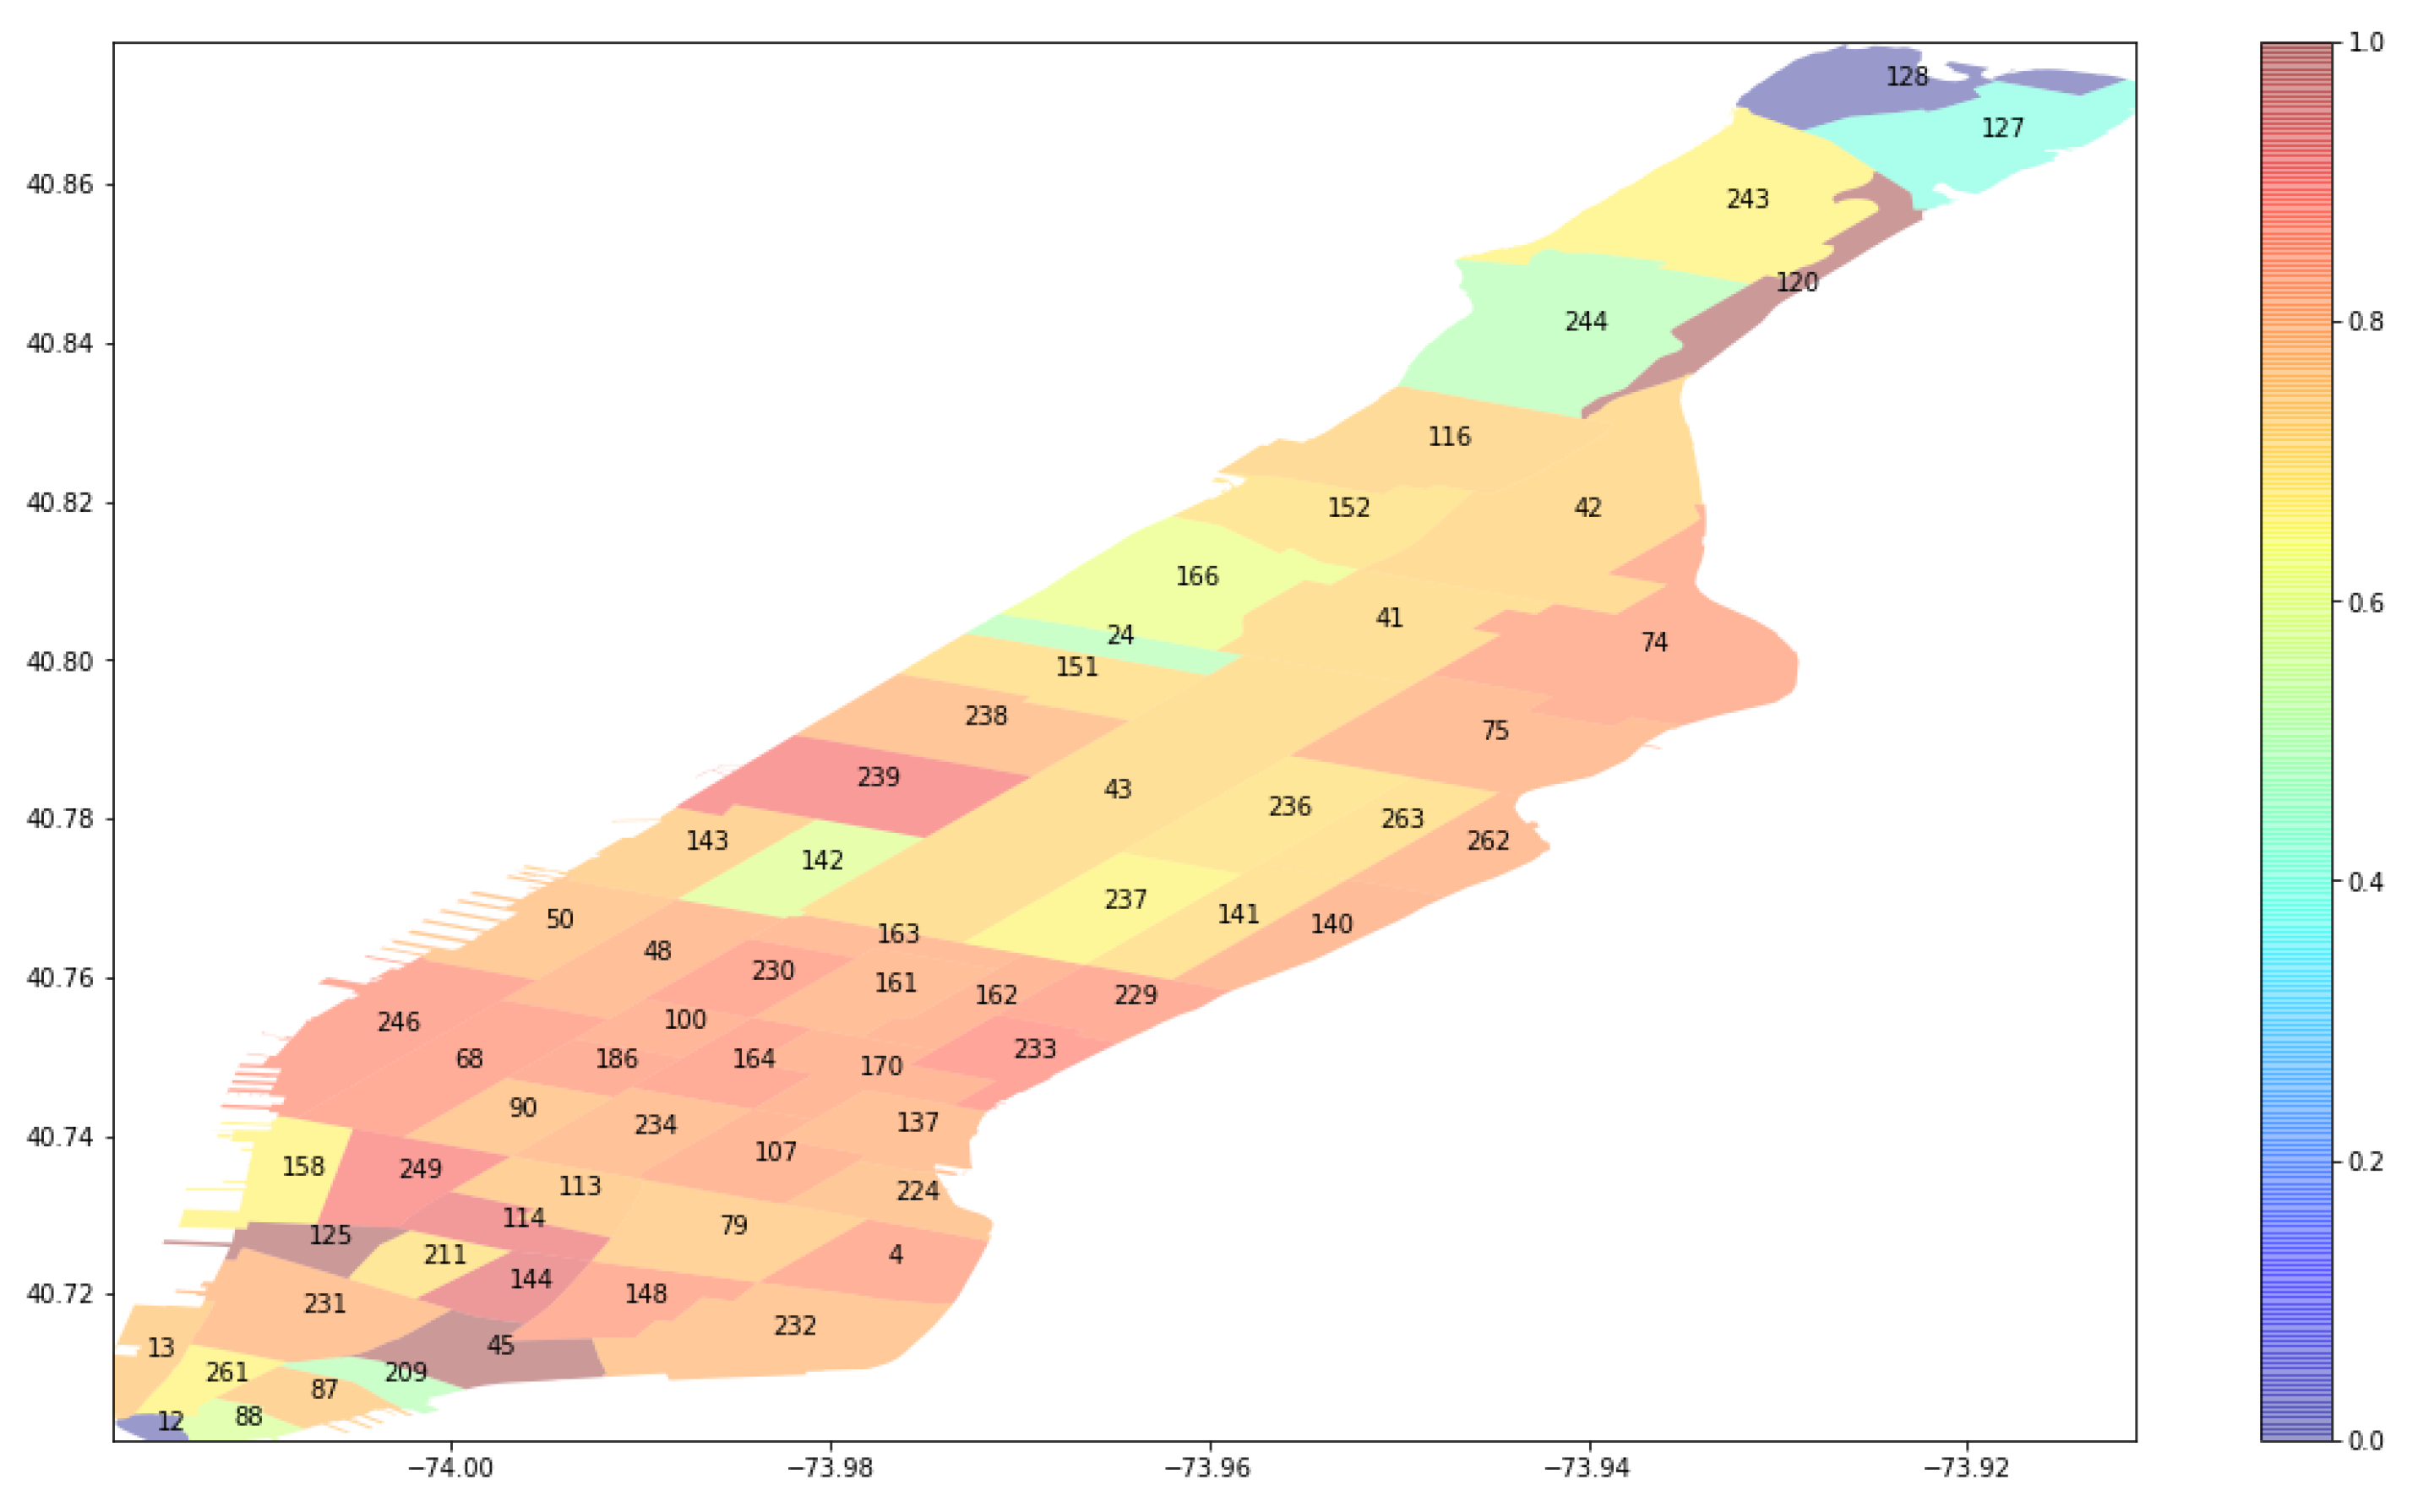
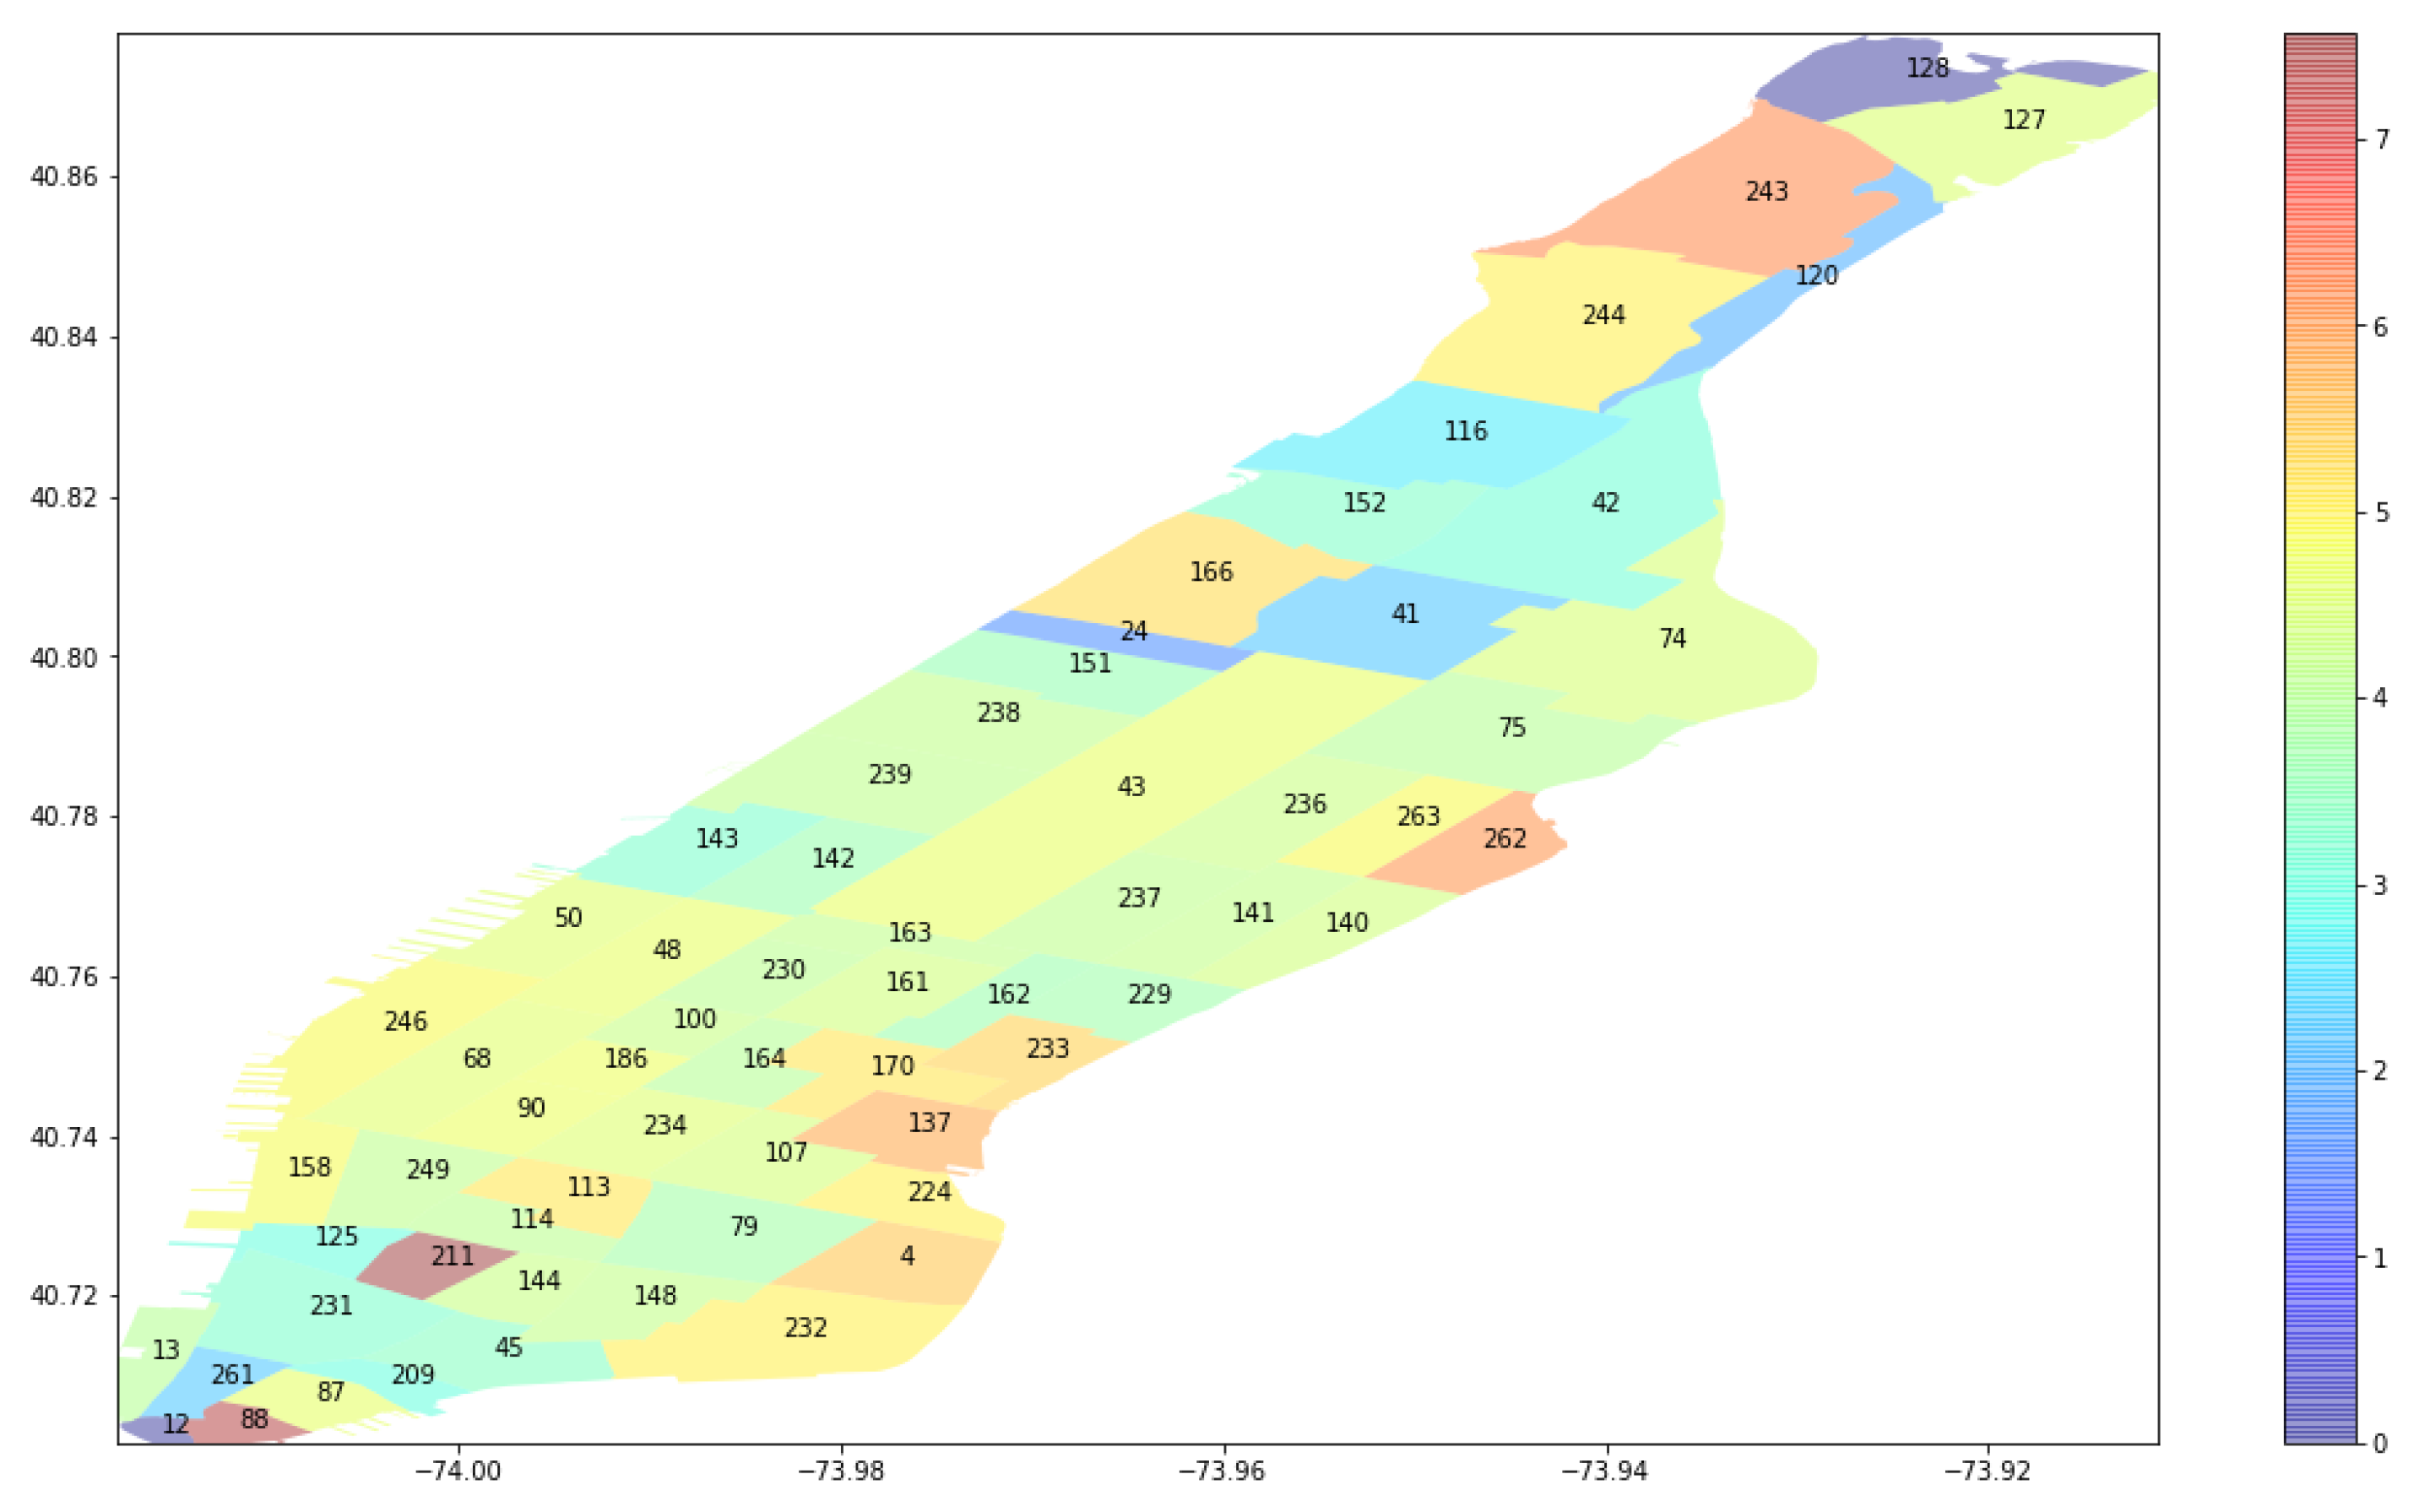
https://www1.nyc.gov/site/tlc/about/tlc-trip-record-data.page), which contains the taxi operation information in New York City including the pick-up instants, pick-up locations, drop-off time, drop-off region, trip fare, and trip distance. We then explore the historical demands on the borough of Manhattan which is split into 69 regions as shown in
Figure 2. Before feeding the data into our models, we normalize the demands over
T (
min in this case) at first.
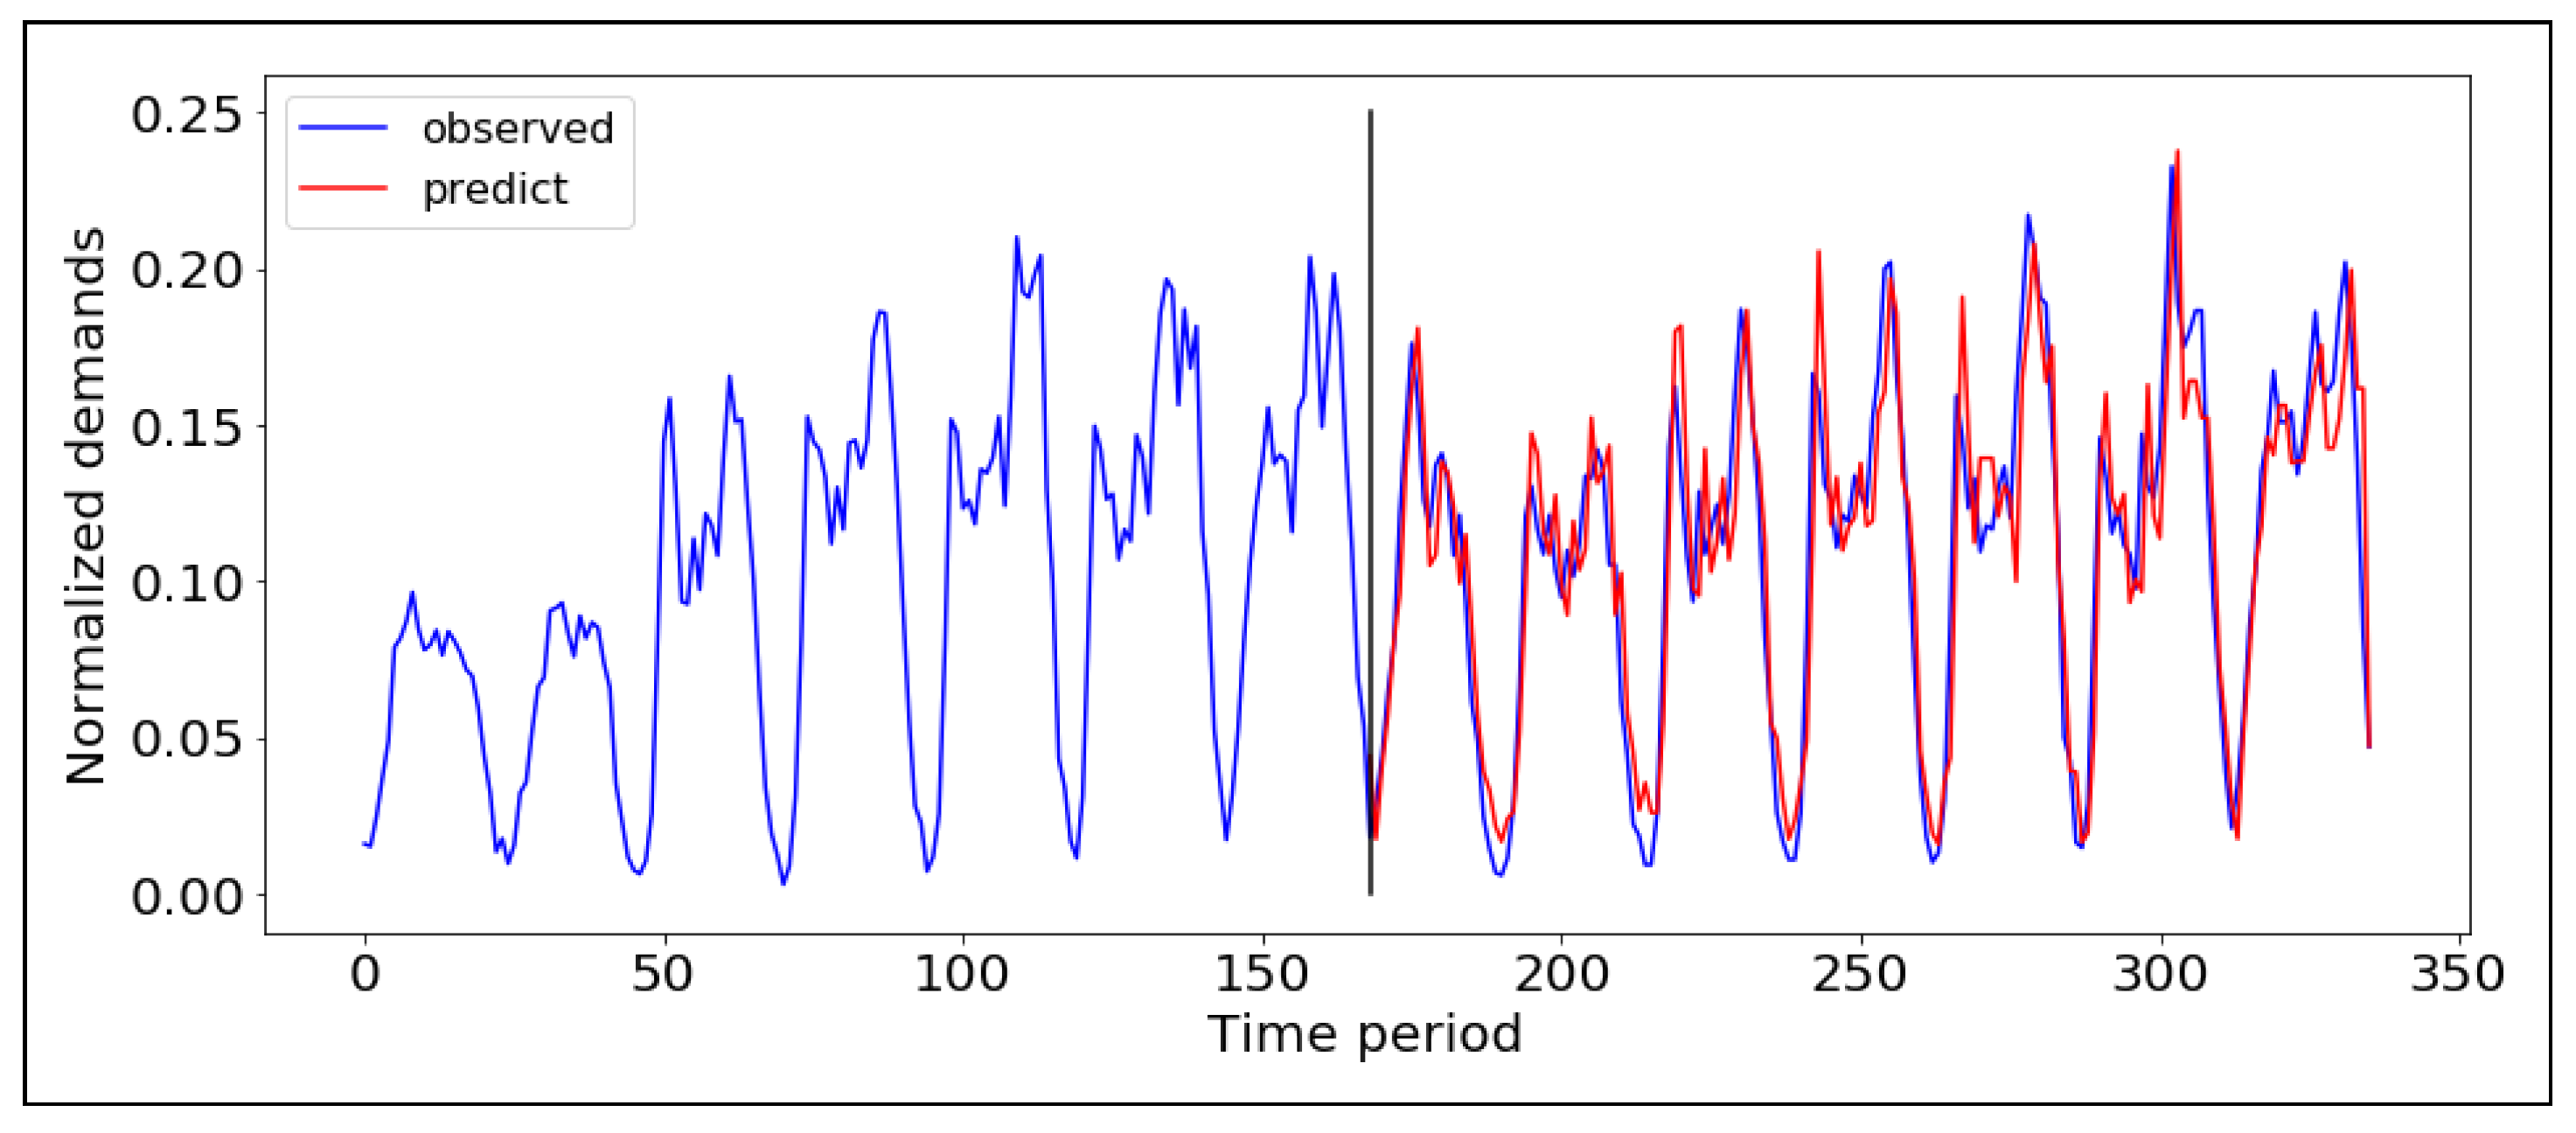
The next step is to predict the future demand for the next period T on each region with ARIMA. In our case, we are using the demand of the previous 168 h to predict the demand of the next hour. In other words, we are using historical data for the previous week to predict the demands in the next hour, which automatically takes into account the weekday and weekends by assessing the trend of its consecutive features (the model could figure out if the date of prediction is a weekend or weekday). To prevent inputting extra information as weekday or weekends, we proceed by predicting the next hour of demands based on previous one-week data inputs. That is, using 168 previous inputs, we predict the next time period’s demand, which would take the holidays, weekends, and weekdays into consideration by assessing the trend of its consecutive features. The choice of the demand prediction period is not arbitrary. It considers the objective of the next phase of the proposed recommendation system. Indeed, every hour, the taxi-to-region matching is provided after precisely predicting the hourly demand. Hence, choosing longer values of T may be unadapted with the demand variation in the region and may lead to taxi operation delay. Selecting lower values of T will increase the frequency of executing the taxi-to-region matching algorithm, which may lead to either an excessive re-assignment of taxis, which is not practical, redundant results similar to the ones of the previous time period, as well as extra computational complexity. More importantly, when predicting the traffic demand over the time period T, we aim to estimate the demand of each region at each instant of that period and not only a constant demand. With the help of VSN, the traffic and demand information are shared among the fleet instantaneously. For instance, the predicted remaining customers during the time period are estimated while considering the number of already picked customers.
We set the ARIMA parameter
d to zero. In order to find the best model, we test different ARIMA models with different parameter combinations
where we pick the parameters with the lowest Akaike information critera (AIC) value in the end. We find out that ARIMA with
provides the lowest AIC where
. The ARIMA model fitting is based on the latest updated 168 data time periods before predicting the next time period. In this case, the predicting process is converted into an online learning where the model parameters are updated continuously. The prediction result from the ARIMA model is shown in
Figure 3 where the red and blue series correspond to the predicted and actual values, respectively. The resulting mean square error (MSE) is
. Hence, we can conclude that the online ARIMA model can provide accurate prediction of the future demand, which can be effectively used to provide precise prediction for the taxi recommendation system.
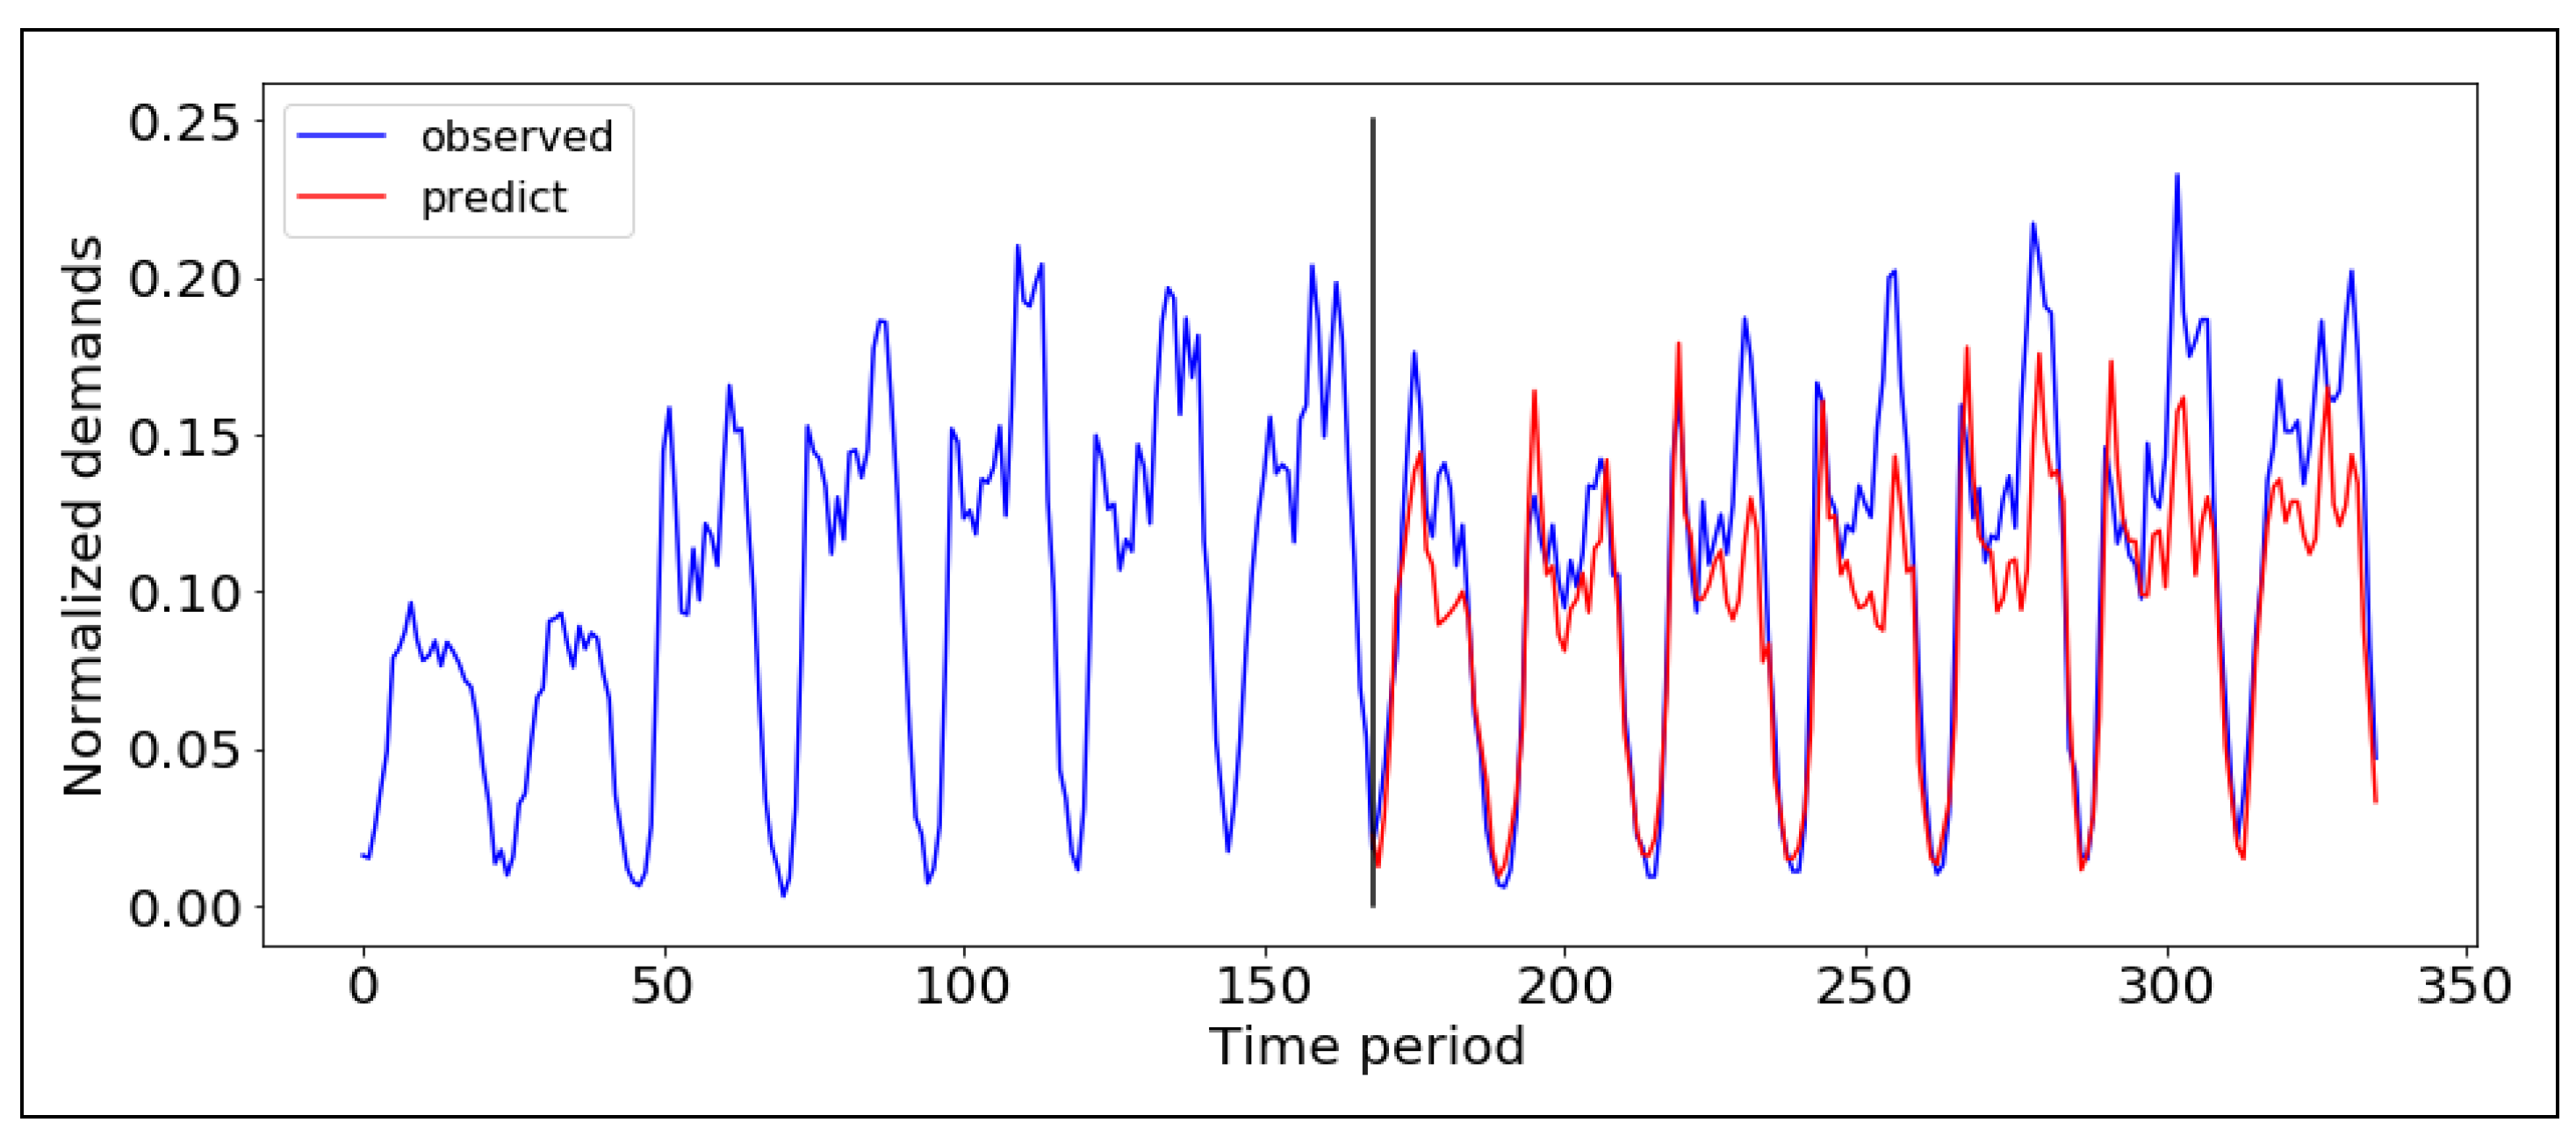
We have compared the performance of the ARIMA model to the LTSM one, which is trained on the historical data first and then employed to predict the future taxi demand. The LSTM model contains two hidden layers and one output neuron. The input shape is 168, which contains previous one-week hourly demand data. It achieves an MSE equal to
as illustrated in
Figure 4. Unlike the ARIMA model, the LTSM is not trained in an incremental/online manner, which requires a more important amount of data compared to ARIMA. From the comparison results, we find out that the online ARIMA model is more accurate, hence we adopt it in our system.
4.2. Taxi-to-Region Matching Component
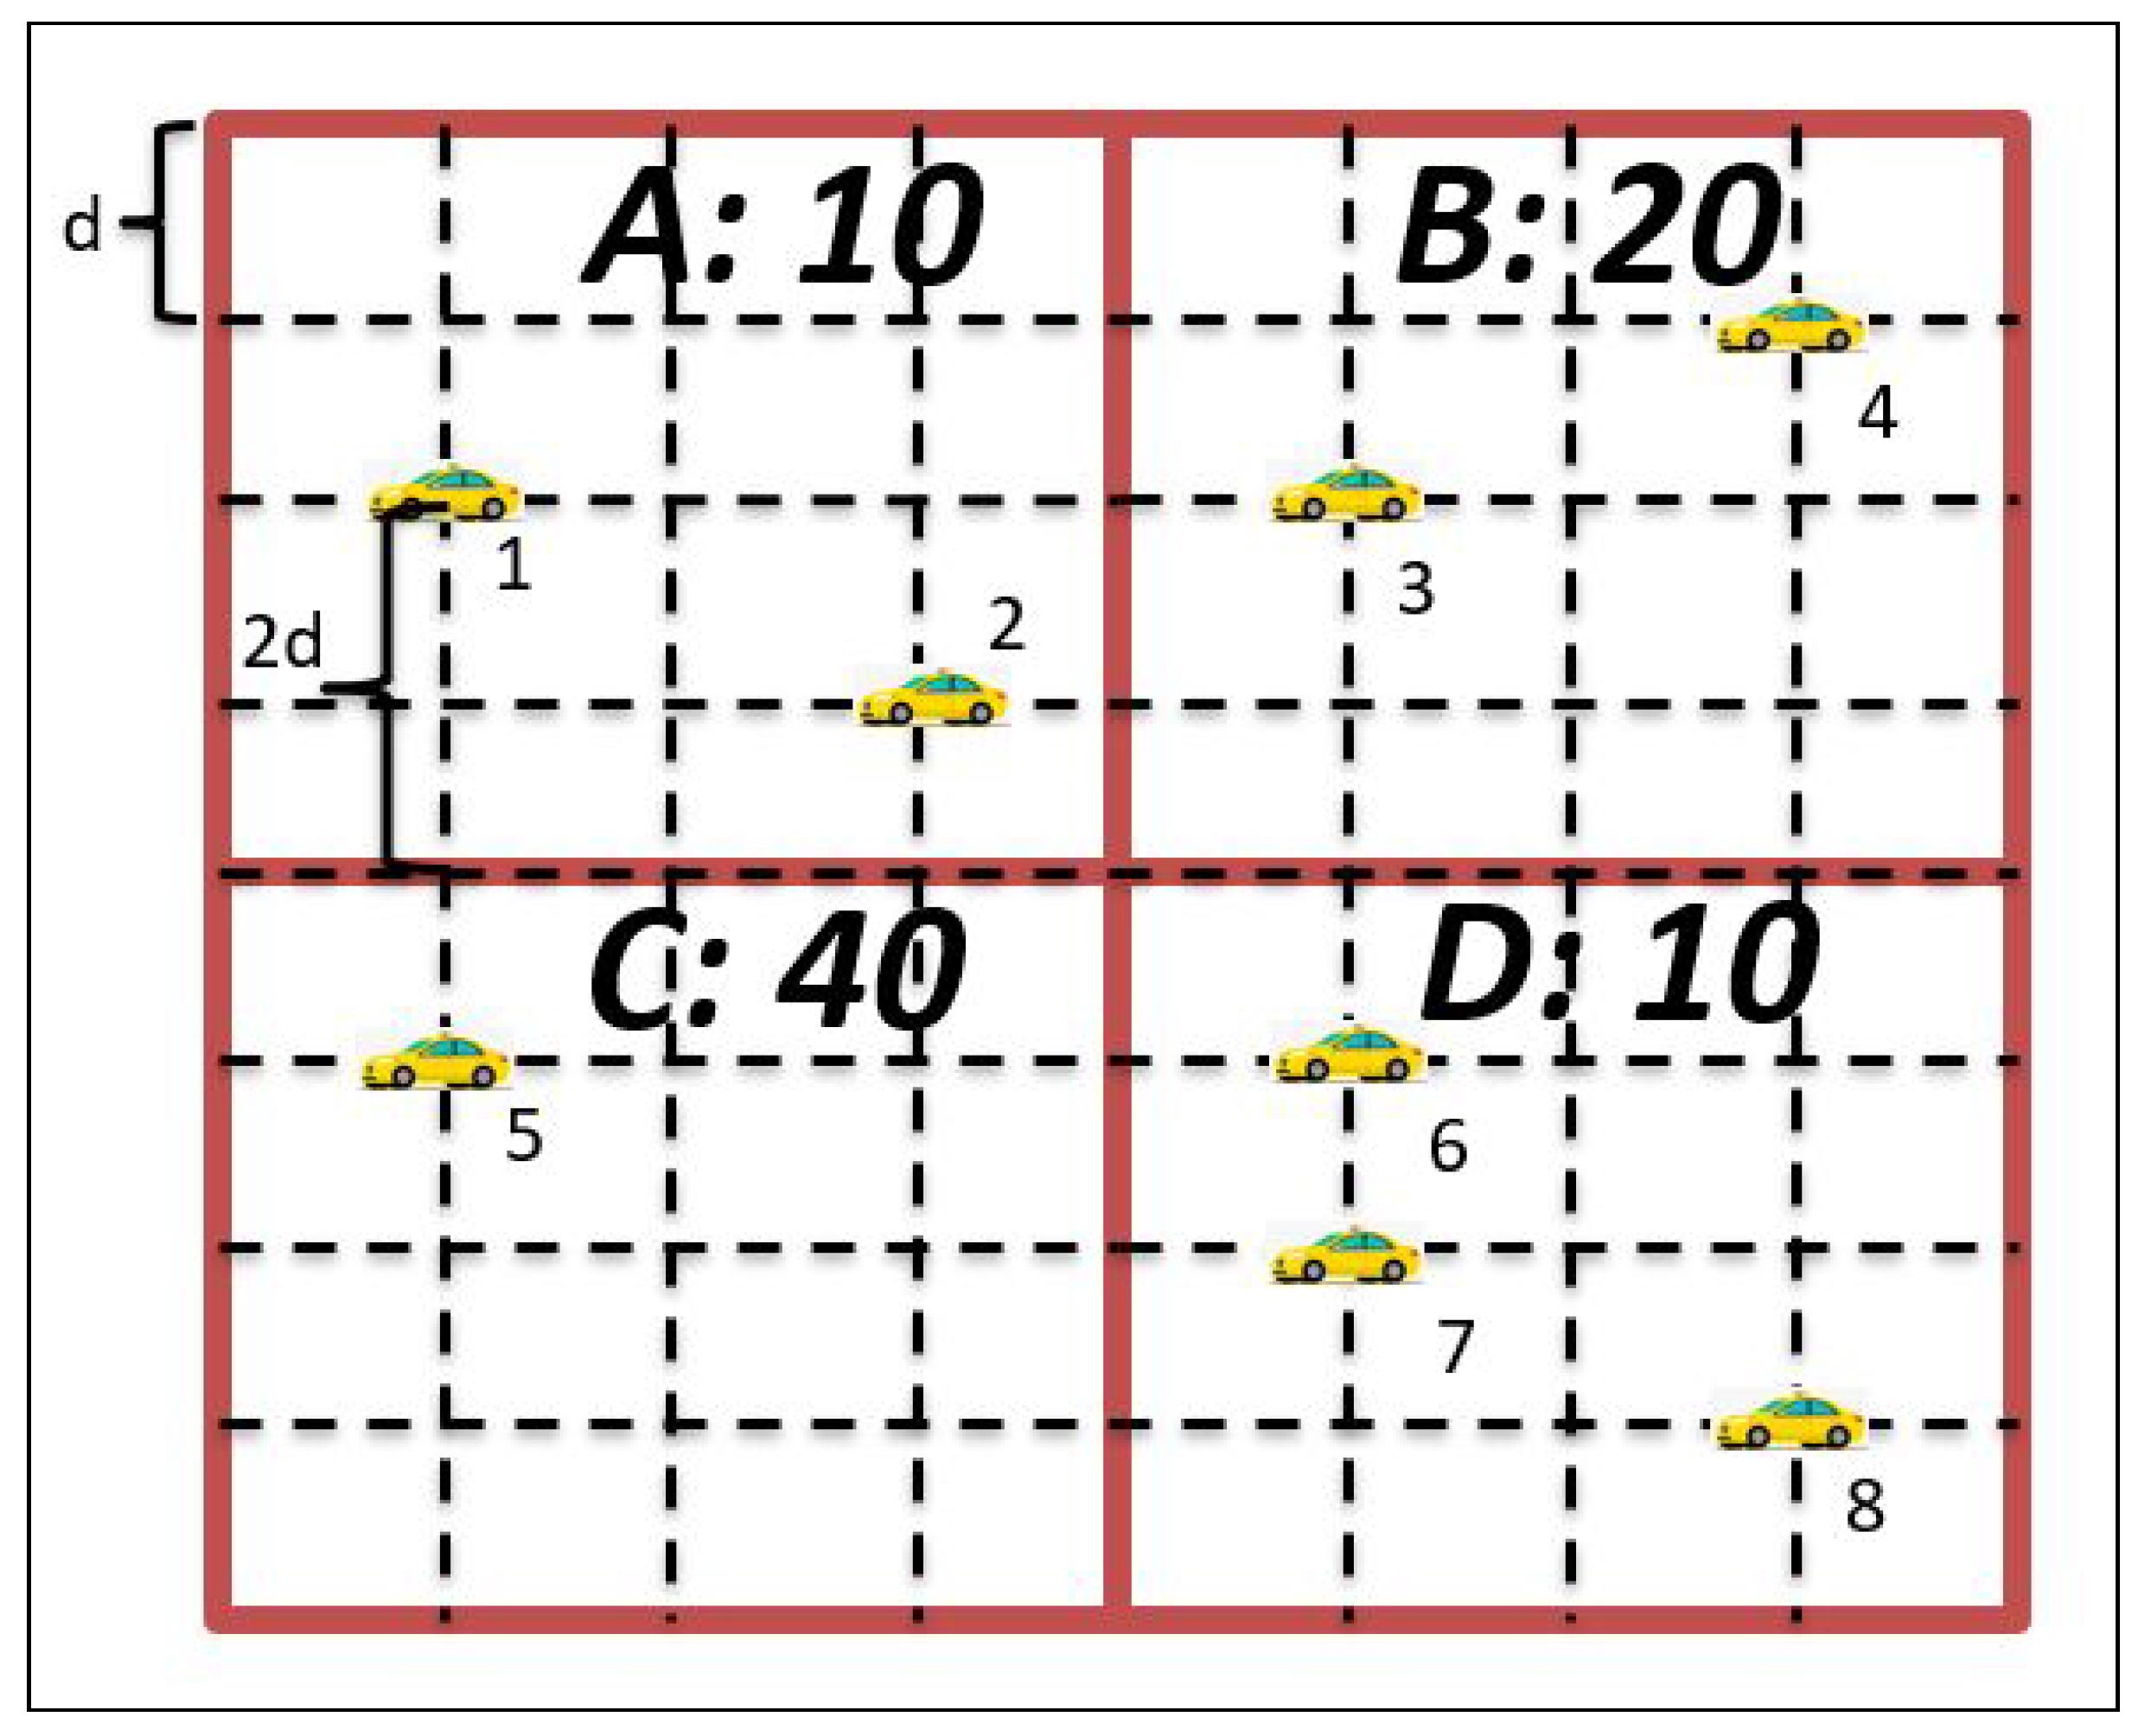
Once accurate future taxi demand is determined for each region, we proceed by assigning vacant taxis to these regions according to the region demands and the taxi current locations. The first metric is used to ensure that the taxi assignment is made proportionally to the demand. In this way, when the expected demand is high, more taxis will be sent to that region and vice versa. The second metric (taxi current locations) is considered in order to minimize the transition phase during which vacant taxis need to reach their assigned regions. This helps in reducing the waiting time of the customers looking for rides at the beginning of the time period. An example is shown in
Figure 5 where four regions and eight taxis exist. Obviously, given the demand, we should assign one taxi to region A, two taxis to region B, four taxis to region C, and one taxi to region D based on their respective demand ratios (10, 20, 40, 10).
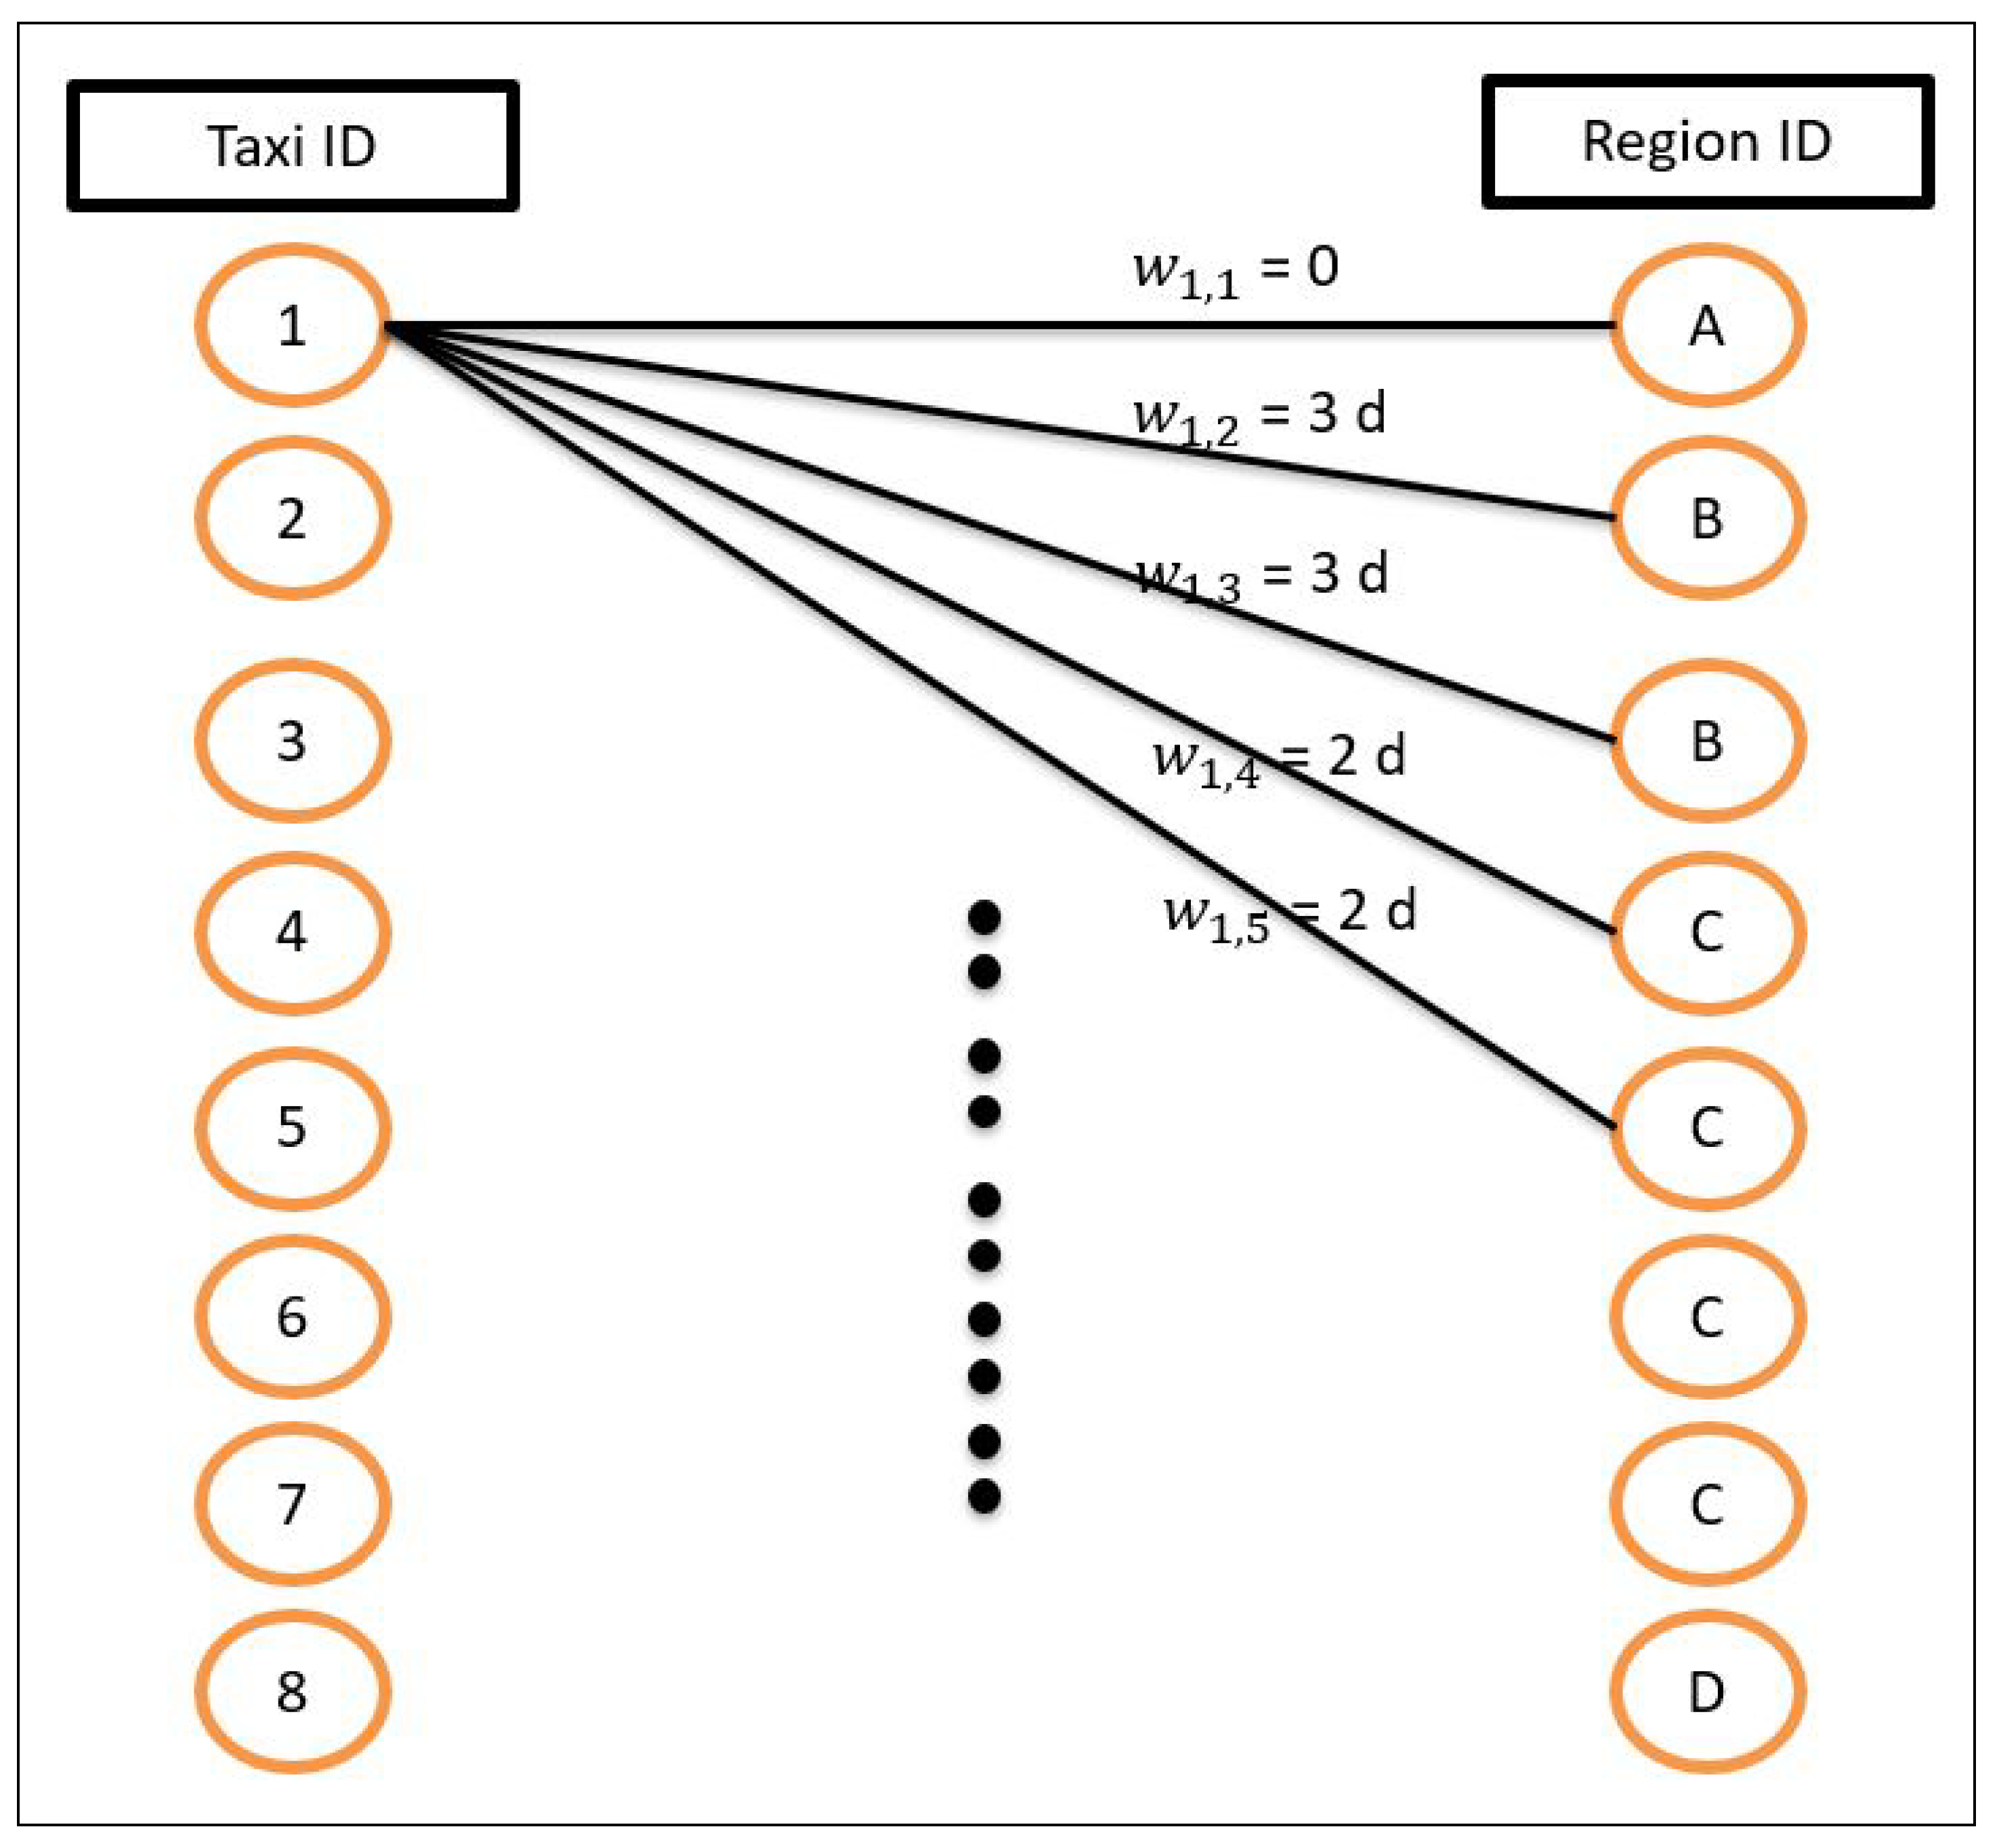
To ensure an efficient taxi-to-region matching for large-scale problems, we propose to model it by a bipartite weighted graph presented in
Figure 6. The weights associated to the graph edges are computed based on the shortest distance needed by the taxi to reach the closest border of the region. To reflect the demand of each region in the graph, we duplicate the ones having higher demand multiple times according to their normalized demand levels with respect to the total number of taxis and total demand in the Borough of Manhattan during that time period. Consequently, the objective of the taxi-to-region matching component is to minimize the sum of the weights while maintaining the perfect matching. In other words, each taxi is assigned to one region. Note that, in practice, the number of taxis is usually higher than the number of regions. We refer to the taxi ID by the index
i and the region ID after duplication by the index
j. Hence, as shown in
Figure 6,
and
refer to the same region
B.
The aforementioned matching procedure can be optimized using an ILP problem formulated as follows:
where
represents the weights of the edges linking the taxis and the regions while
is a decision variable indicating whether a taxi
i is assigned to region
j or not. It is equal to 1 if this is the case. In (P), constraints (2) ensure the perfect matching, which forces a taxi to be assigned to only one region.
The matching problem can be also solved optimally using the heuristic minimum weight perfect matching algorithm: the Hungarian method. This algorithm solves the problem in a polynomial time , much faster than the NP-complete ILP-based solution that adopts the branch-and-bound algorithm, where N is the number of taxis.
4.3. Taxi Routing Optimizer
The road network can be constructed in many ways, such as simple search techniques and complex fuzzy logic theory [
42,
43]. In this paper, we transform the traffic network of the area of interest into a complex graph composed of intersections and roads. Each road
r, where
connecting at most two intersections, is divided into multiple small segments with the same length
. The graph then has as vertices the connections of different segments and as edges the segments themselves. We define the current location of taxi
i as
and its destination as
, here
and
represent the ID of the streets and
represent the ID of their segments. In [
44], we propose an optimal solution for route planning problem that takes the real-time traffic into consideration. Integer linear programs are formulated to determine the fastest route given the current locations of vacant taxis and their assigned regions. The fastest paths can then be determined as the real-time traffic feed-back is obtained by the system. With the recurrent updates, ILP is solved regularly to determine the best routes according to the recent data, in other words, the route keeps updated as the new data is received. In order to reduce the complexity of the routing optimizer, we employ the recurrent Dijkstra’s algorithm using the metrics evaluating the traffic level at each segment defined in [
44,
45]. In our approach, routes might be updated every 1 min. The detailed process is provided in Procedure 1. Note that the same routing approach is adopted to determine the trips of occupied taxis after pick-ups.
| Procedure 1 Routing Optimizer for Taxi i |
- 1:
Inputs = , time instant t. - 2:
while vehicle does not reach the destination do - 3:
Obtain the latest update traffic data based on the collected information. - 4:
Update the weights of the road network graph. - 5:
Run Dijkstra’s algorithm to find the fastest route from to . - 6:
Vehicle follows the proposed route for one minute. - 7:
Update . - 8:
end while
|
5. Simulated Taxi Operation and Validation
In this section, we introduce our framework to simulate the operation of taxis in the area of interest. Then, we validate the proposed model with realistic data to ensure that our simulations after determining routes are close to real-world situations.
5.1. Simulation Model
In our simulations, we consider the area of Manhattan, New York city, which is divided into 69 regions. We assume there are N taxis circulating in the area of interest. If it is vacant, we assume that the taxi picks up a customer when the distance separating them is less than 100 m. In the traditional system, where data exchange and knowledge about the customers’ demand are absent, we consider that the N taxis move randomly in the whole area when they are vacant, while with the recommendation system, the taxis are always assigned to different regions at the beginning of the time period and will move randomly only within that region. Once a pick-up is made, the status of the taxi is changed to occupied until the customer is dropped off.
For the taxi routing optimization, we extract the parameters of the off-line map from Open Street Map [
46]. In total, there are 9070 roads and 4146 intersections in the area of interest. We split each road into segments having length at maximum 100 m. Thus, we obtain a graph of 11,760 edges and 6393 nodes.
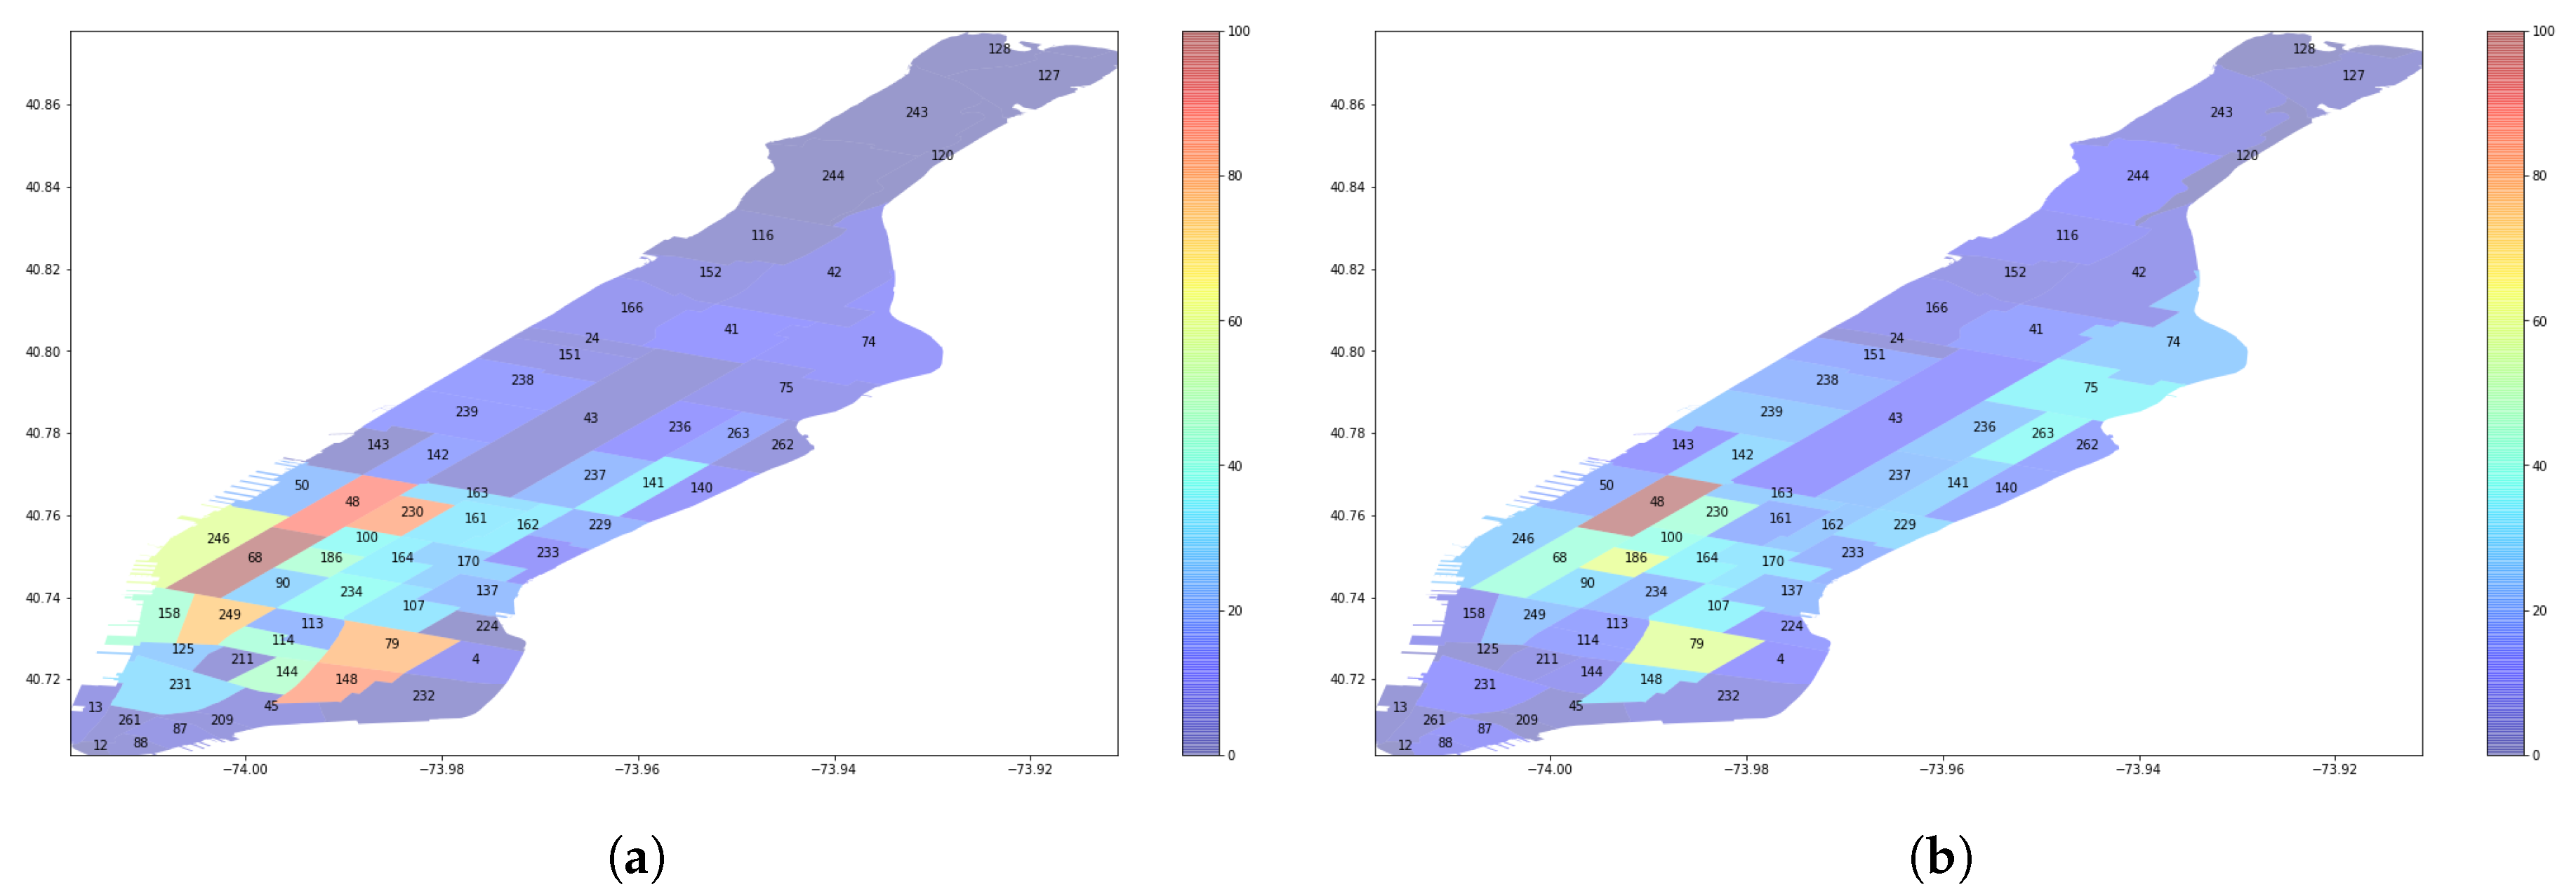
Two scenarios are provided to strengthen the persuasive of the model. We consider the one hour demand information on 1 June 2018 from 3 am to 4 am that contains 1813 pick-ups in total (time instants and GPS locations) as the first scenario while the demand information on 1 January 2018 from 5 am to 6 am that contains 2027 pick-ups as the second scenario. We choose these two periods instead of rush hours for tractability and clarity reasons. Indeed, over rush hours, the number of pick-ups is huge and it will be difficult to visualize the results. This also impacts the simulation time, which is expected to be very expensive. Although we have developed low complexity algorithms for both the taxi-to-region matching component and the taxi routing optimizer, simulating the instantaneous operation of a huge number of taxis remains time consuming. It is worth noting that in our simulation results (
Section 6) where we compare the different scenarios after simulating the taxi operations, we have investigated the same time periods where identical traffic conditions are experimented with. Since the customer arrival time and waiting time are missing in the dataset, without loss of generality, we assume that their arrival instants are the taxi pick-up times. Three key performance indicators are evaluated in our simulations: (1) the total number of pick-ups, (2) the waiting time of each customer corresponding to the difference between its pick-up time and its arrival time instants, and (3) the vacant traveled distance where no passengers are in the taxis. Precisely, the waiting time of customers corresponds to the period starting from the time instant when the customer arrives on the road for regular taxis or requests the service for ride-hailing taxis. The deadheading or idle distance of drivers is defined as the distance travelled by a taxi without serving any customers either before finding or after dropping a customer. All of these metrics are measured after simulating the taxi operation, as indicated in
Section 5. The demands on 69 regions for both scenarios are presented in
Figure 7. We notice that the demands mainly exist in mid and lower Manhattan. Although the two scenarios have similar total requests, their distributions in the regions are different. Customers in Scenario 2 are mainly located in regions 48, 68, 246, 230, 249, 79, 148, unlike Scenario 1 where most of them are gathered in regions 48, 186 and 79.
The detailed algorithm to perform the simulations for regular taxi services without VSN is provided in Algorithm 1. Note that the recommendation occurs at the beginning of every time period T where h. Hence, the regions assigned to different taxis remain unchanged during this hour. For the next time period, the recommendation system updates its matching procedure for the vacant taxis according to their latest locations and the new demand.
The detailed algorithm to perform the simulations for regular taxi services with VSN is provided in Algorithm 2, where the recommendation occurs on the fly during the time period whenever a pickup is reported to the system. Here,
represents the number of vacant taxis at time instant
t. In this algorithm, the system continuously provides recommendation during the time period
T as the number of pick-ups changes over time. Every
minutes, the system sends the vacant vehicles to different regions considering the distance as well as the potential demand for the rest of the time period
T. Note that within
T the demand in the current step is highly correlated with the one of the next step. Hence, very few re-assignments will occur for vacant taxis.
| Algorithm 1 Simulated Taxi Operation for Regular Taxi Services Without VSN |
- 1:
Inputs = . - 2:
Determine the best assignment of taxi-to-region using the Hungarian method. - 3:
Send vacant taxis to recommended regions using the Routing Optimizer given in Procedure 1. - 4:
. - 5:
whiledo - 6:
for each Taxi do - 7:
if Taxi i is vacant then - 8:
Taxi i circulates towards or within the assigned region during this minute. - 9:
Calculate the shortest distance between taxi i and potential nearby customers k’s. - 10:
if then - 11:
Taxi i notices customer k waiving his/her hand and then heads to him/her. - 12:
Record the waiting time of customer k. - 13:
Change the status of taxi i to occupied. - 14:
end if - 15:
else - 16:
Taxi i drives towards its destination as per customer request using the Routing Optimizer given in Procedure 1. - 17:
end if - 18:
Update . - 19:
end for - 20:
. - 21:
end while
|
| Algorithm 2 Simulated Taxi Operation for Regular Taxi Services With VSN |
- 1:
Inputs = . - 2:
. - 3:
whiledo - 4:
if then - 5:
Update the demand by subtracting the pick-ups happened already. - 6:
Find the vacant taxis at t. - 7:
Determine the best assignment of taxi-to-region using the Hungarian method. - 8:
Send vacant taxis to recommended regions the Routing Optimizer given in Procedure 1. - 9:
end if - 10:
for each Taxi do - 11:
if Taxi i is vacant then - 12:
Taxi i circulates towards or within the assigned region during this minute. - 13:
Calculate the shortest distance between taxi i and potential nearby customers k’s. - 14:
if then - 15:
Taxi i notices customer k waiving his/her hand and then heads to him/her. - 16:
Record the waiting time of customer k. - 17:
Change the status of taxi i to occupied. - 18:
end if - 19:
else - 20:
Taxi i drives towards its destination as per customer request using the Routing Optimizer given in Procedure 1. - 21:
end if - 22:
Update . - 23:
end for - 24:
. - 25:
end while
|
Unlike the regular taxi services, the system for ride-hailing taxi services is aware of the locations for both taxis and customers’ requests. Once a customer sends the request to the system, one of the nearby vacant taxis would head to him/her directly. Note that only the vacant vehicles that are within the search range
receive the request. In our simulation, we set the minimum search range
to 2 km. The detailed algorithm to perform the simulations is provided in Algorithm 3. Here, similar to the regular service with VSN, the system assigns the regions to vacant taxis every
minutes as the demand for the rest of
T is changing. However, taxis in ride-hailing services do not need to find customers waiving their hands on the street, in other words, the search range of taxis in ride-hailing service
is much larger than the regular taxi services. In our algorithm, we collect the location information of every customer and calculate their distance to all vacant vehicles within the search range. The closest available vehicle within that search region will be assigned to the customer. In our simulation, we set
min.
| Algorithm 3 Simulated Taxi Operation for Ride-Hailing Taxi Services |
- 1:
Inputs = . - 2:
. - 3:
whiledo - 4:
if then - 5:
Update the demand by subtracting the pick-ups happened already. - 6:
Find the vacant taxis at t. - 7:
Determine the best assignment of taxi-to-region using the Hungarian method. - 8:
Send vacant taxis to recommended regions using the Routing Optimizer given in Procedure 1. - 9:
end if - 10:
for each Customer who shows up before t do - 11:
Customer k sends its request and its location to the system. - 12:
Calculate the shortest distance for customer k with all nearby taxis . - 13:
Find the closest taxi and the shortest distance . - 14:
if then - 15:
Taxi heads to the customer k to pick him/her up. - 16:
end if - 17:
Record the waiting time of customer k. - 18:
Change the status of taxi to occupied. - 19:
end for - 20:
for each Taxi do - 21:
if Taxi i is vacant then - 22:
Taxi i cruises towards or within the assigned region during this minutes. - 23:
else - 24:
Taxi i drives towards its destination as per customer request using the Routing Optimizer given in Procedure 1. - 25:
end if - 26:
Update . - 27:
end for - 28:
. - 29:
end while
|
5.2. Model Validation
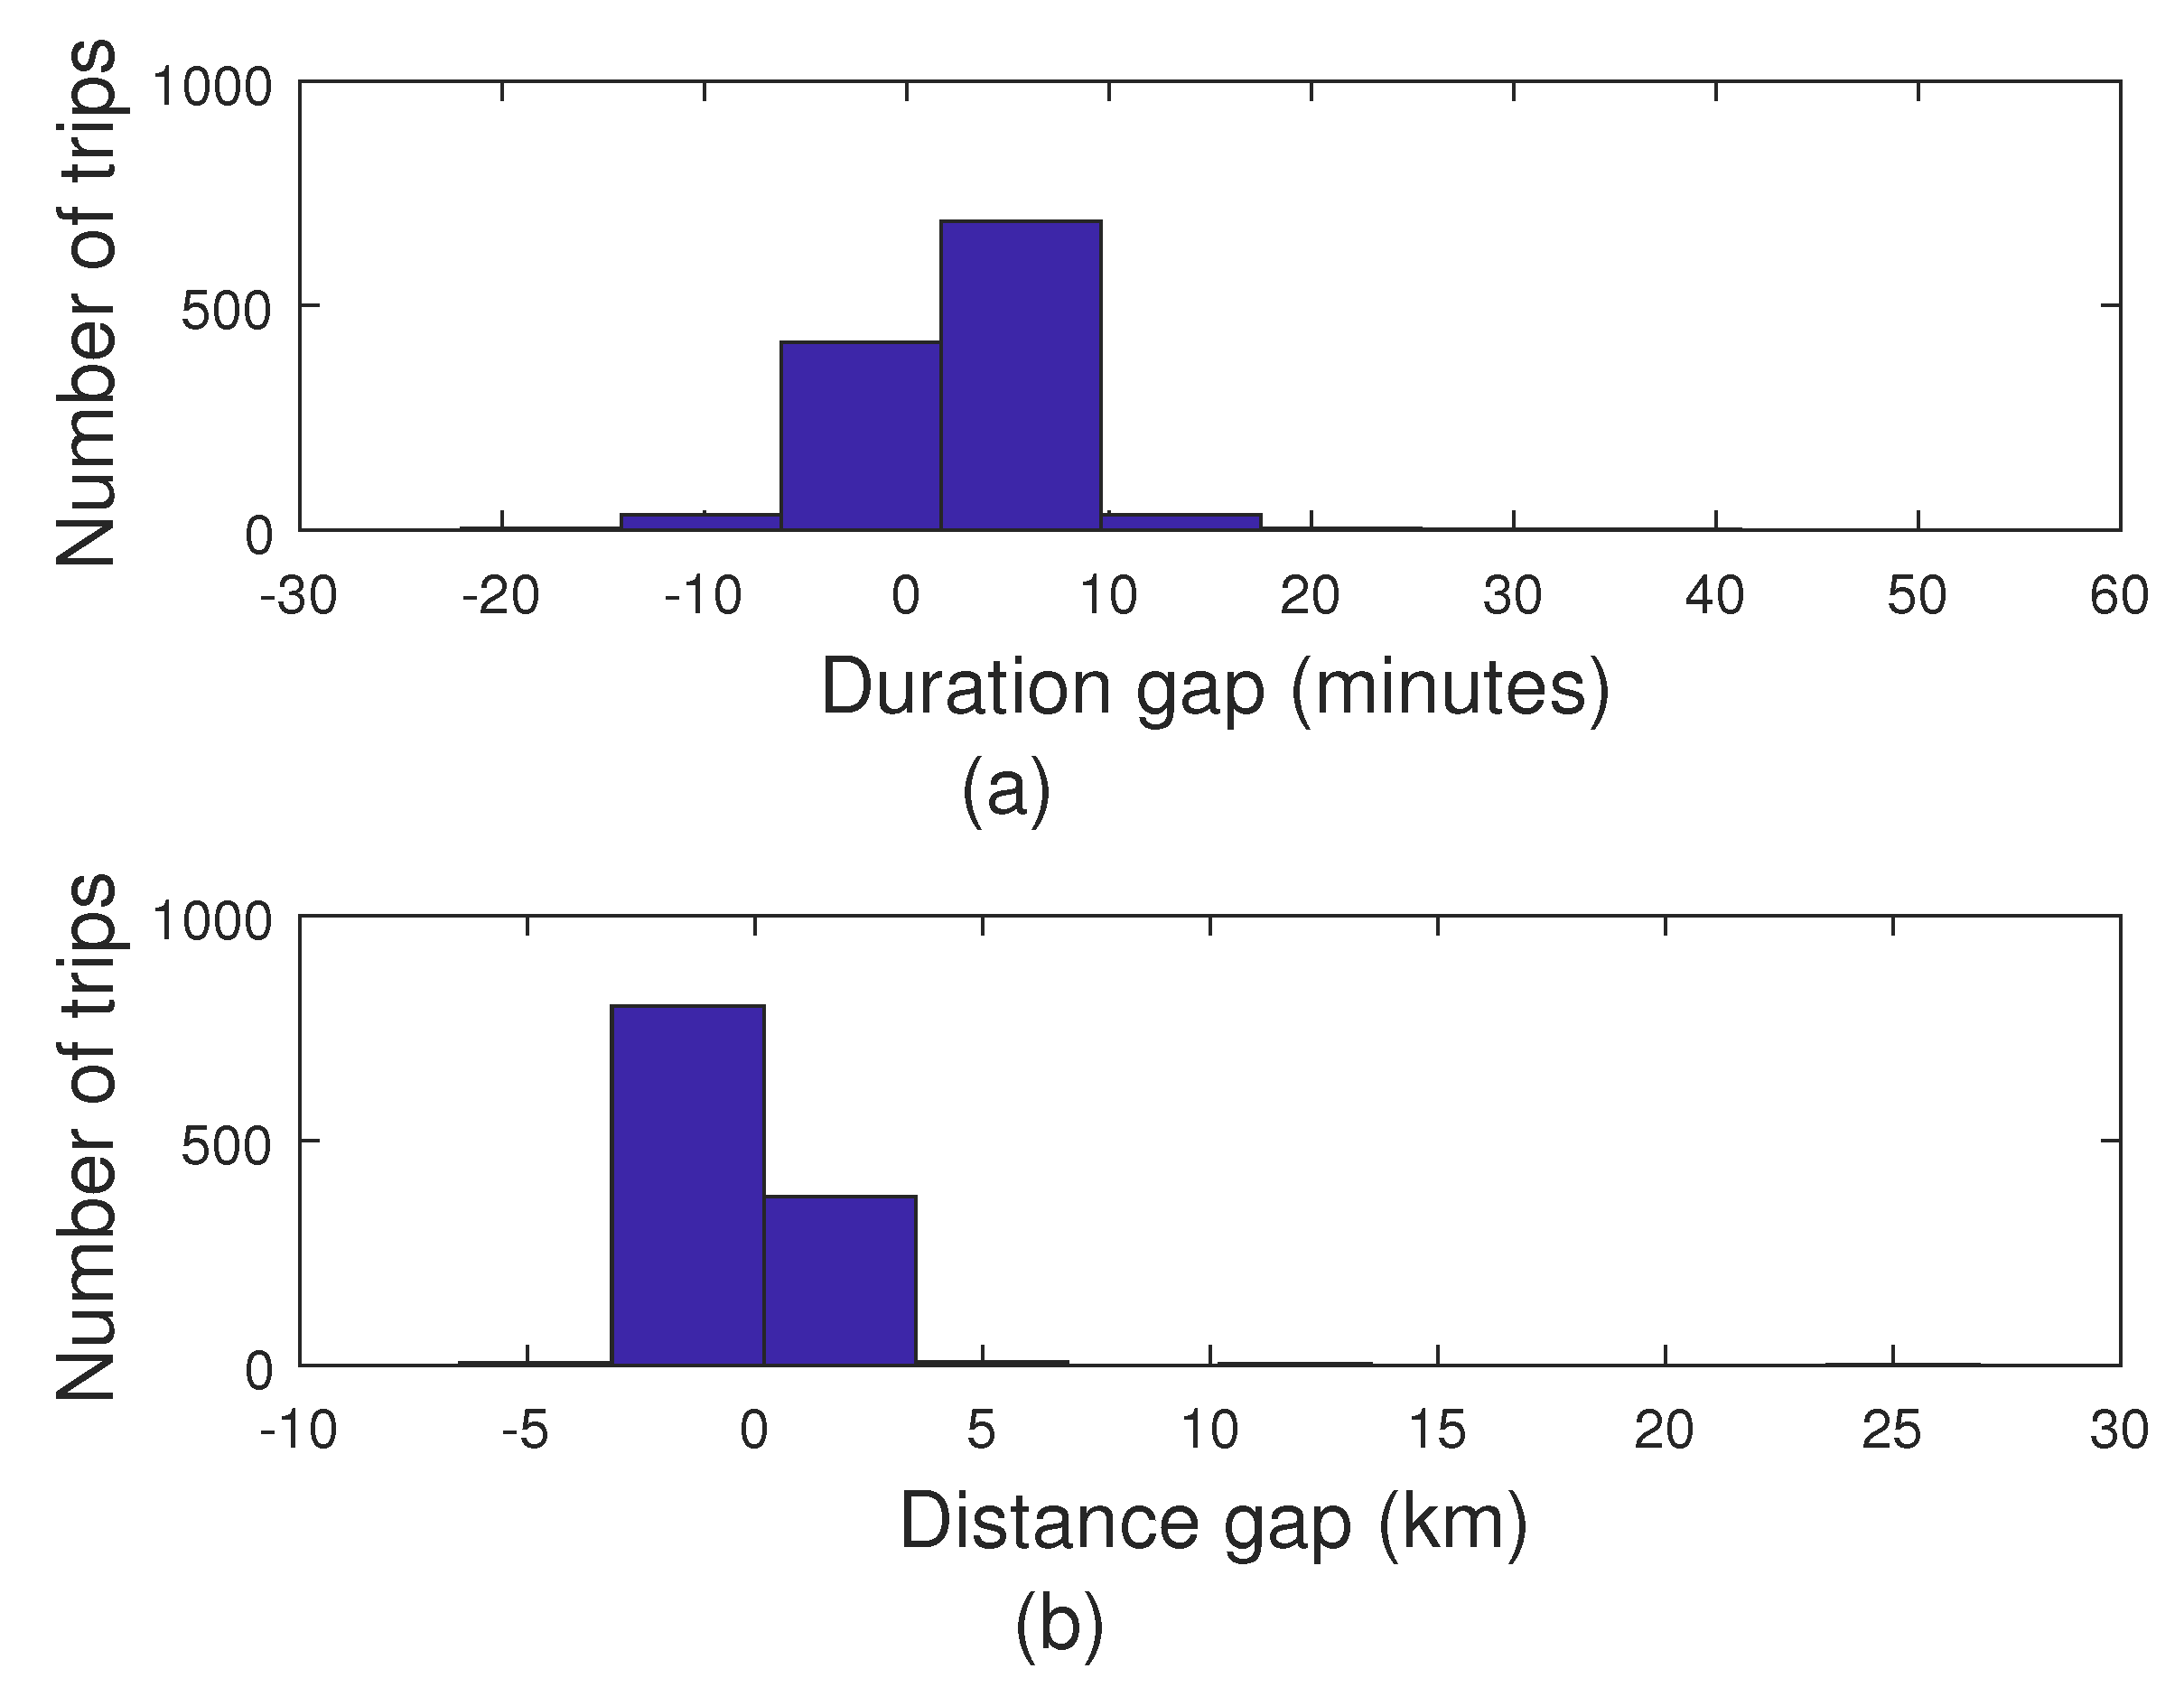
Figure 8, we propose to compare the simulation results with the current data to prove the efficiency of the model with respect to real-world scenarios. In the figure, we provide two histograms comparing the gap in terms of trip duration and traveled distance between actual data and simulated data for the different trips. From
Figure 8a, we find that the majority of the simulated trips have duration close to the real data with a difference ranging from −3 to 5 min. This is due to the difference between the true traffic status and the simulated one, as well as different drivers’ routing preferences, that do not necessarily follow the obtained paths using the approach presented in
Section 4. The difference is not huge since the average is close to 0. Moreover, from
Figure 8b, we find out that distance differences of the majority of trips are plus or minus 2.5 km from the realistic data since the available dataset only contains the pick-up and drop-off region ID without specifying the exact geographical points. In
Figure 8 shows that the simulated model is very close to the real-world case and validates the system model and routing optimization algorithms that we developed.
6. Performance Evaluation of the Proposed Recommendation System
In this section, we evaluate the performance of our proposed recommendation system and compare it to the traditional case where taxi drivers work individually and based on their own experience for both regular and ride-hailing taxi services. To sum-up, in our simulations, we compare five cases: Two traditional taxi services without recommendations (Regular Trad. and Ride-hailing Trad.) and three taxi services based on our proposed recommendation system (Regular Recom. (w/o VSN), Regular Recom. (VSN), and Ride-hailing Recom.). We start by providing a detailed analysis of the key performance metrics for Scenario 1, followed by a short discussion about Scenario 2.
6.1. Taxi Operation Visualization (Scenario 1)
In
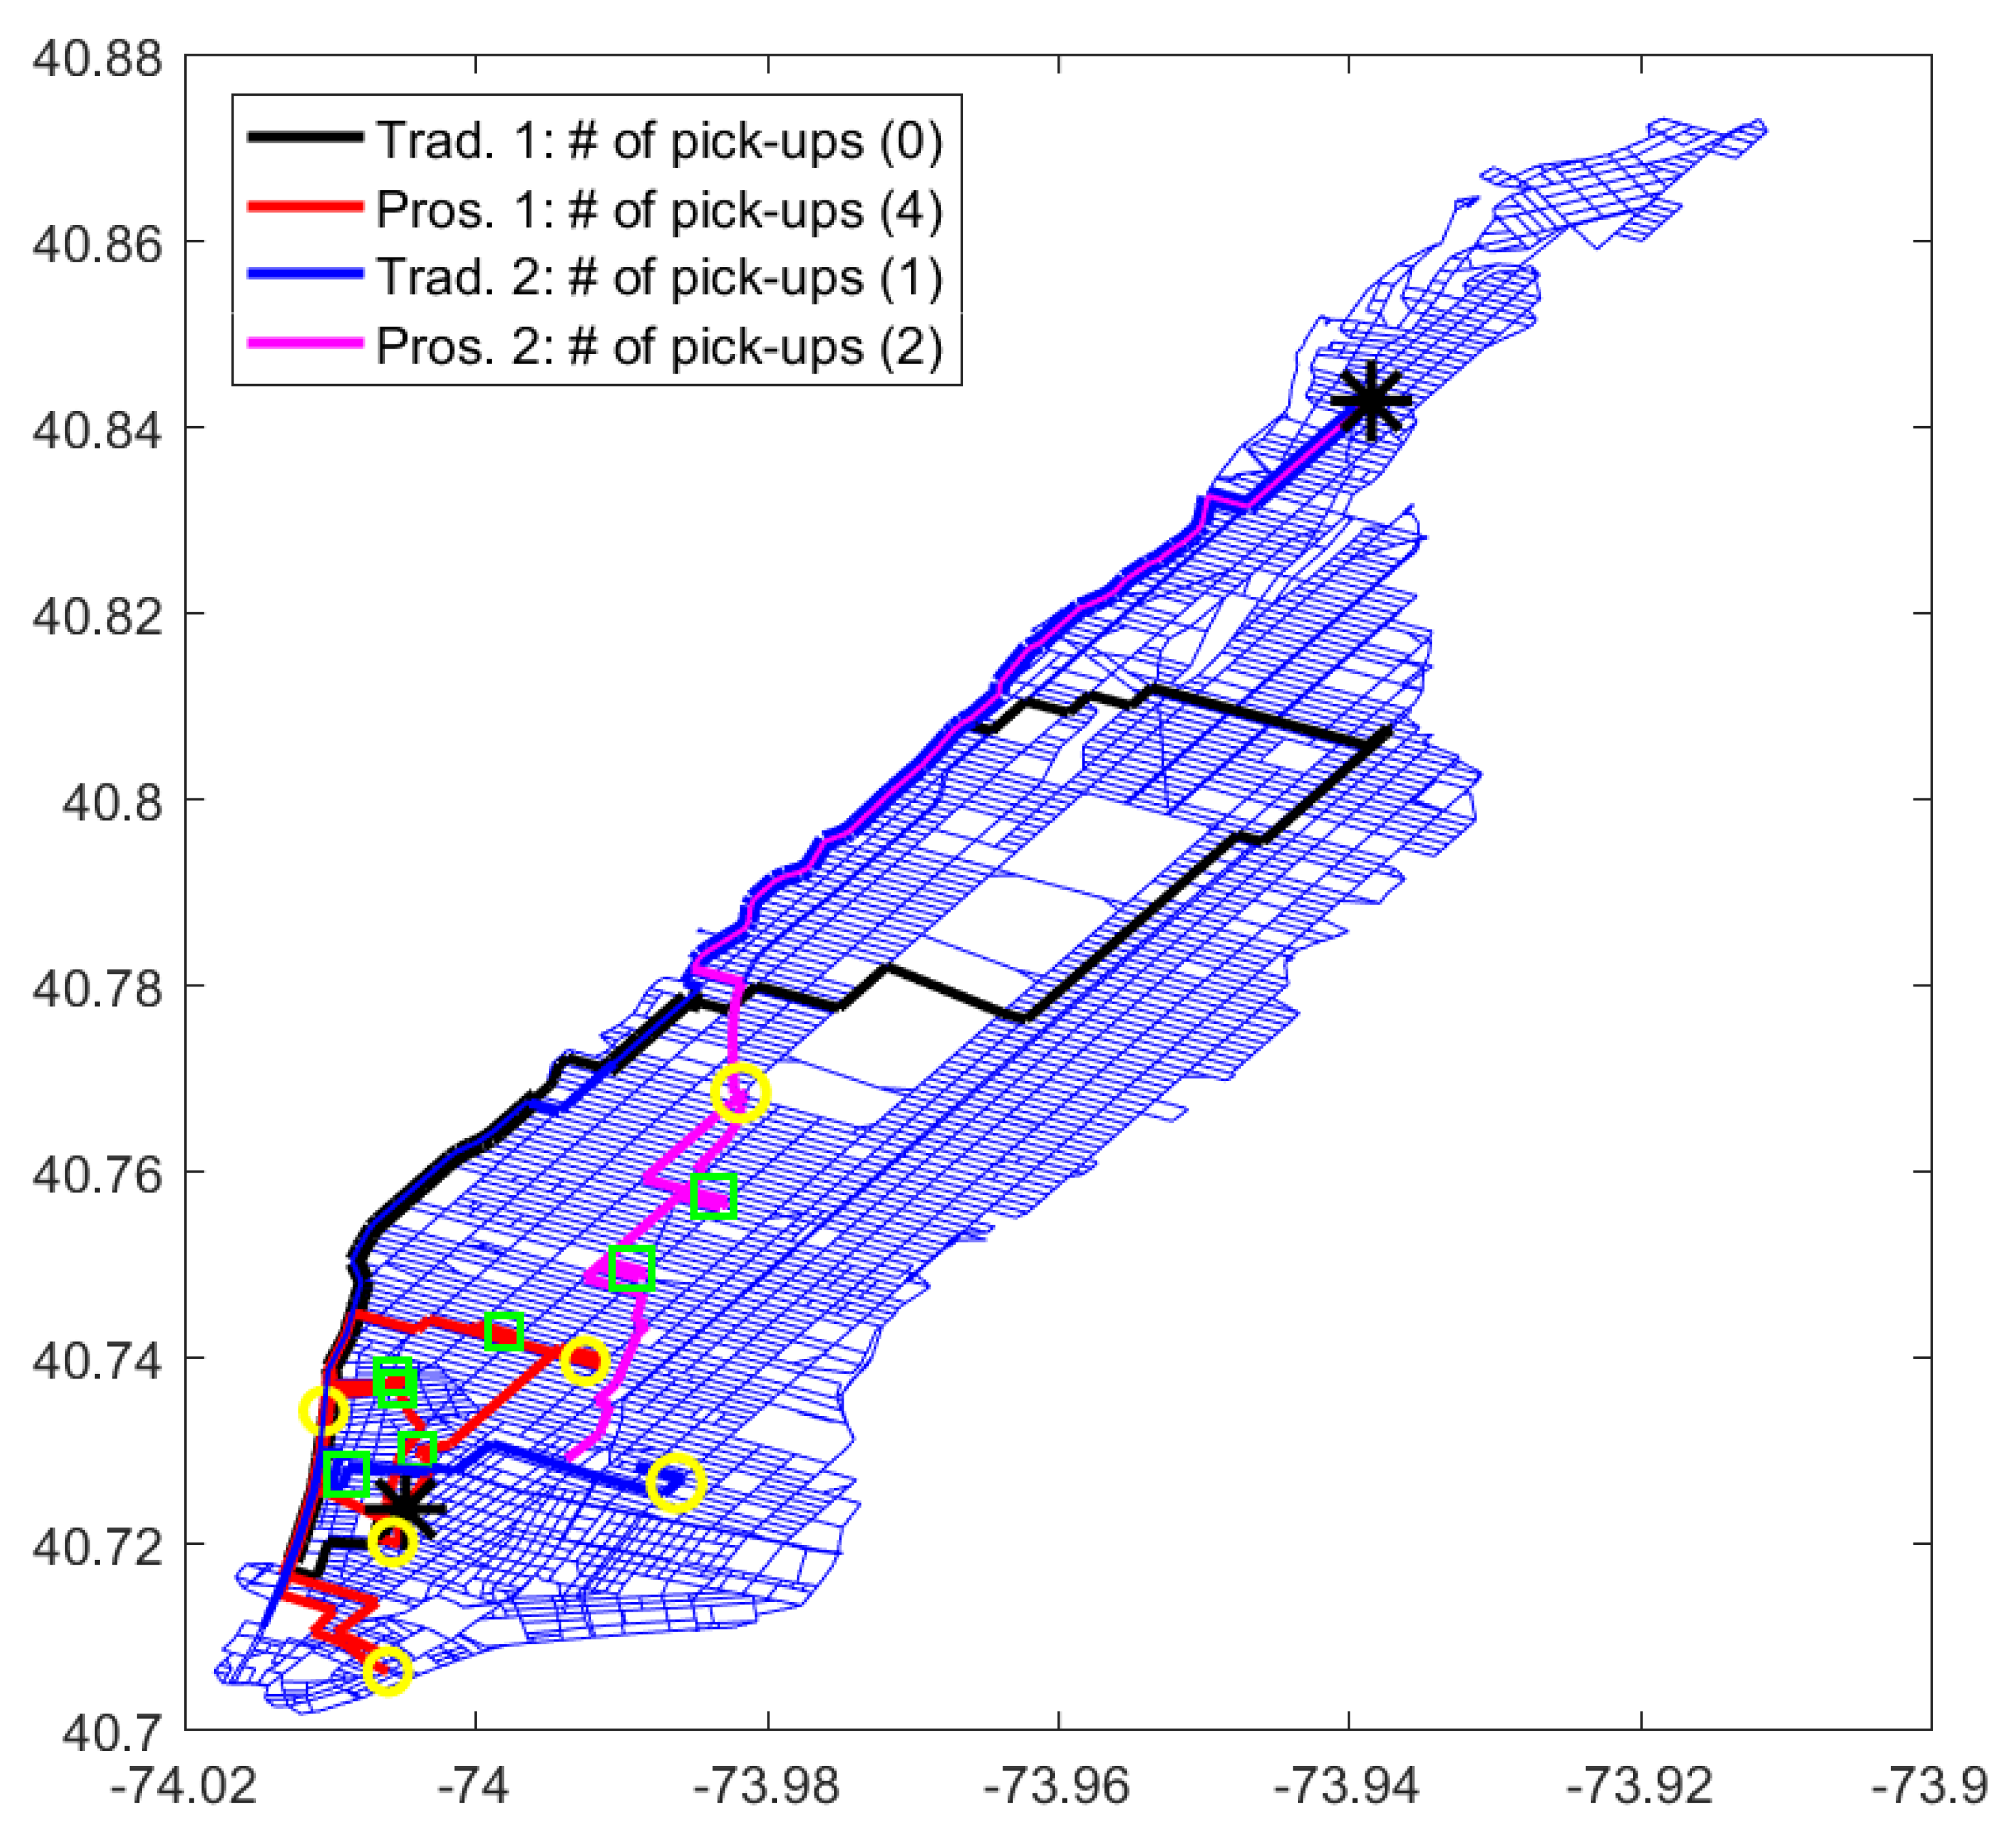
Figure 9, we illustrate an example of two selected taxis circulating in the area of interest while considering Scenario 1 (
Figure 7a) for regular taxi services without VSN. Two of them, i.e., black and blue trajectories, are moving randomly looking for customers based on their own experience while two other taxis, colored in red and pink, follow the recommendations of the proposed system using Algorithm 1. The starting positions of the black and red taxis as well as the blue and pink taxis are the same, and by comparing the number of pick-ups between those two groups of taxis, we find out that the number of pick-ups increases when the recommendation system is applied. On the other hand, we can notice that the red vehicle spends most of its time cruising within the same region compared to the black vehicle and thus has a greater chance to find customers with lower vacant traveled distance. The starting position of the pink vehicle has lower number of potential customers so it is assigned to other regions that have higher probability to find customers.
In the sequel, we evaluate the performances of the proposed taxi recommendation systems for both regular and ride-hailing taxi services and compare them to the ones of the traditional cases.
6.2. Number of Pick-Ups (Scenario 1)
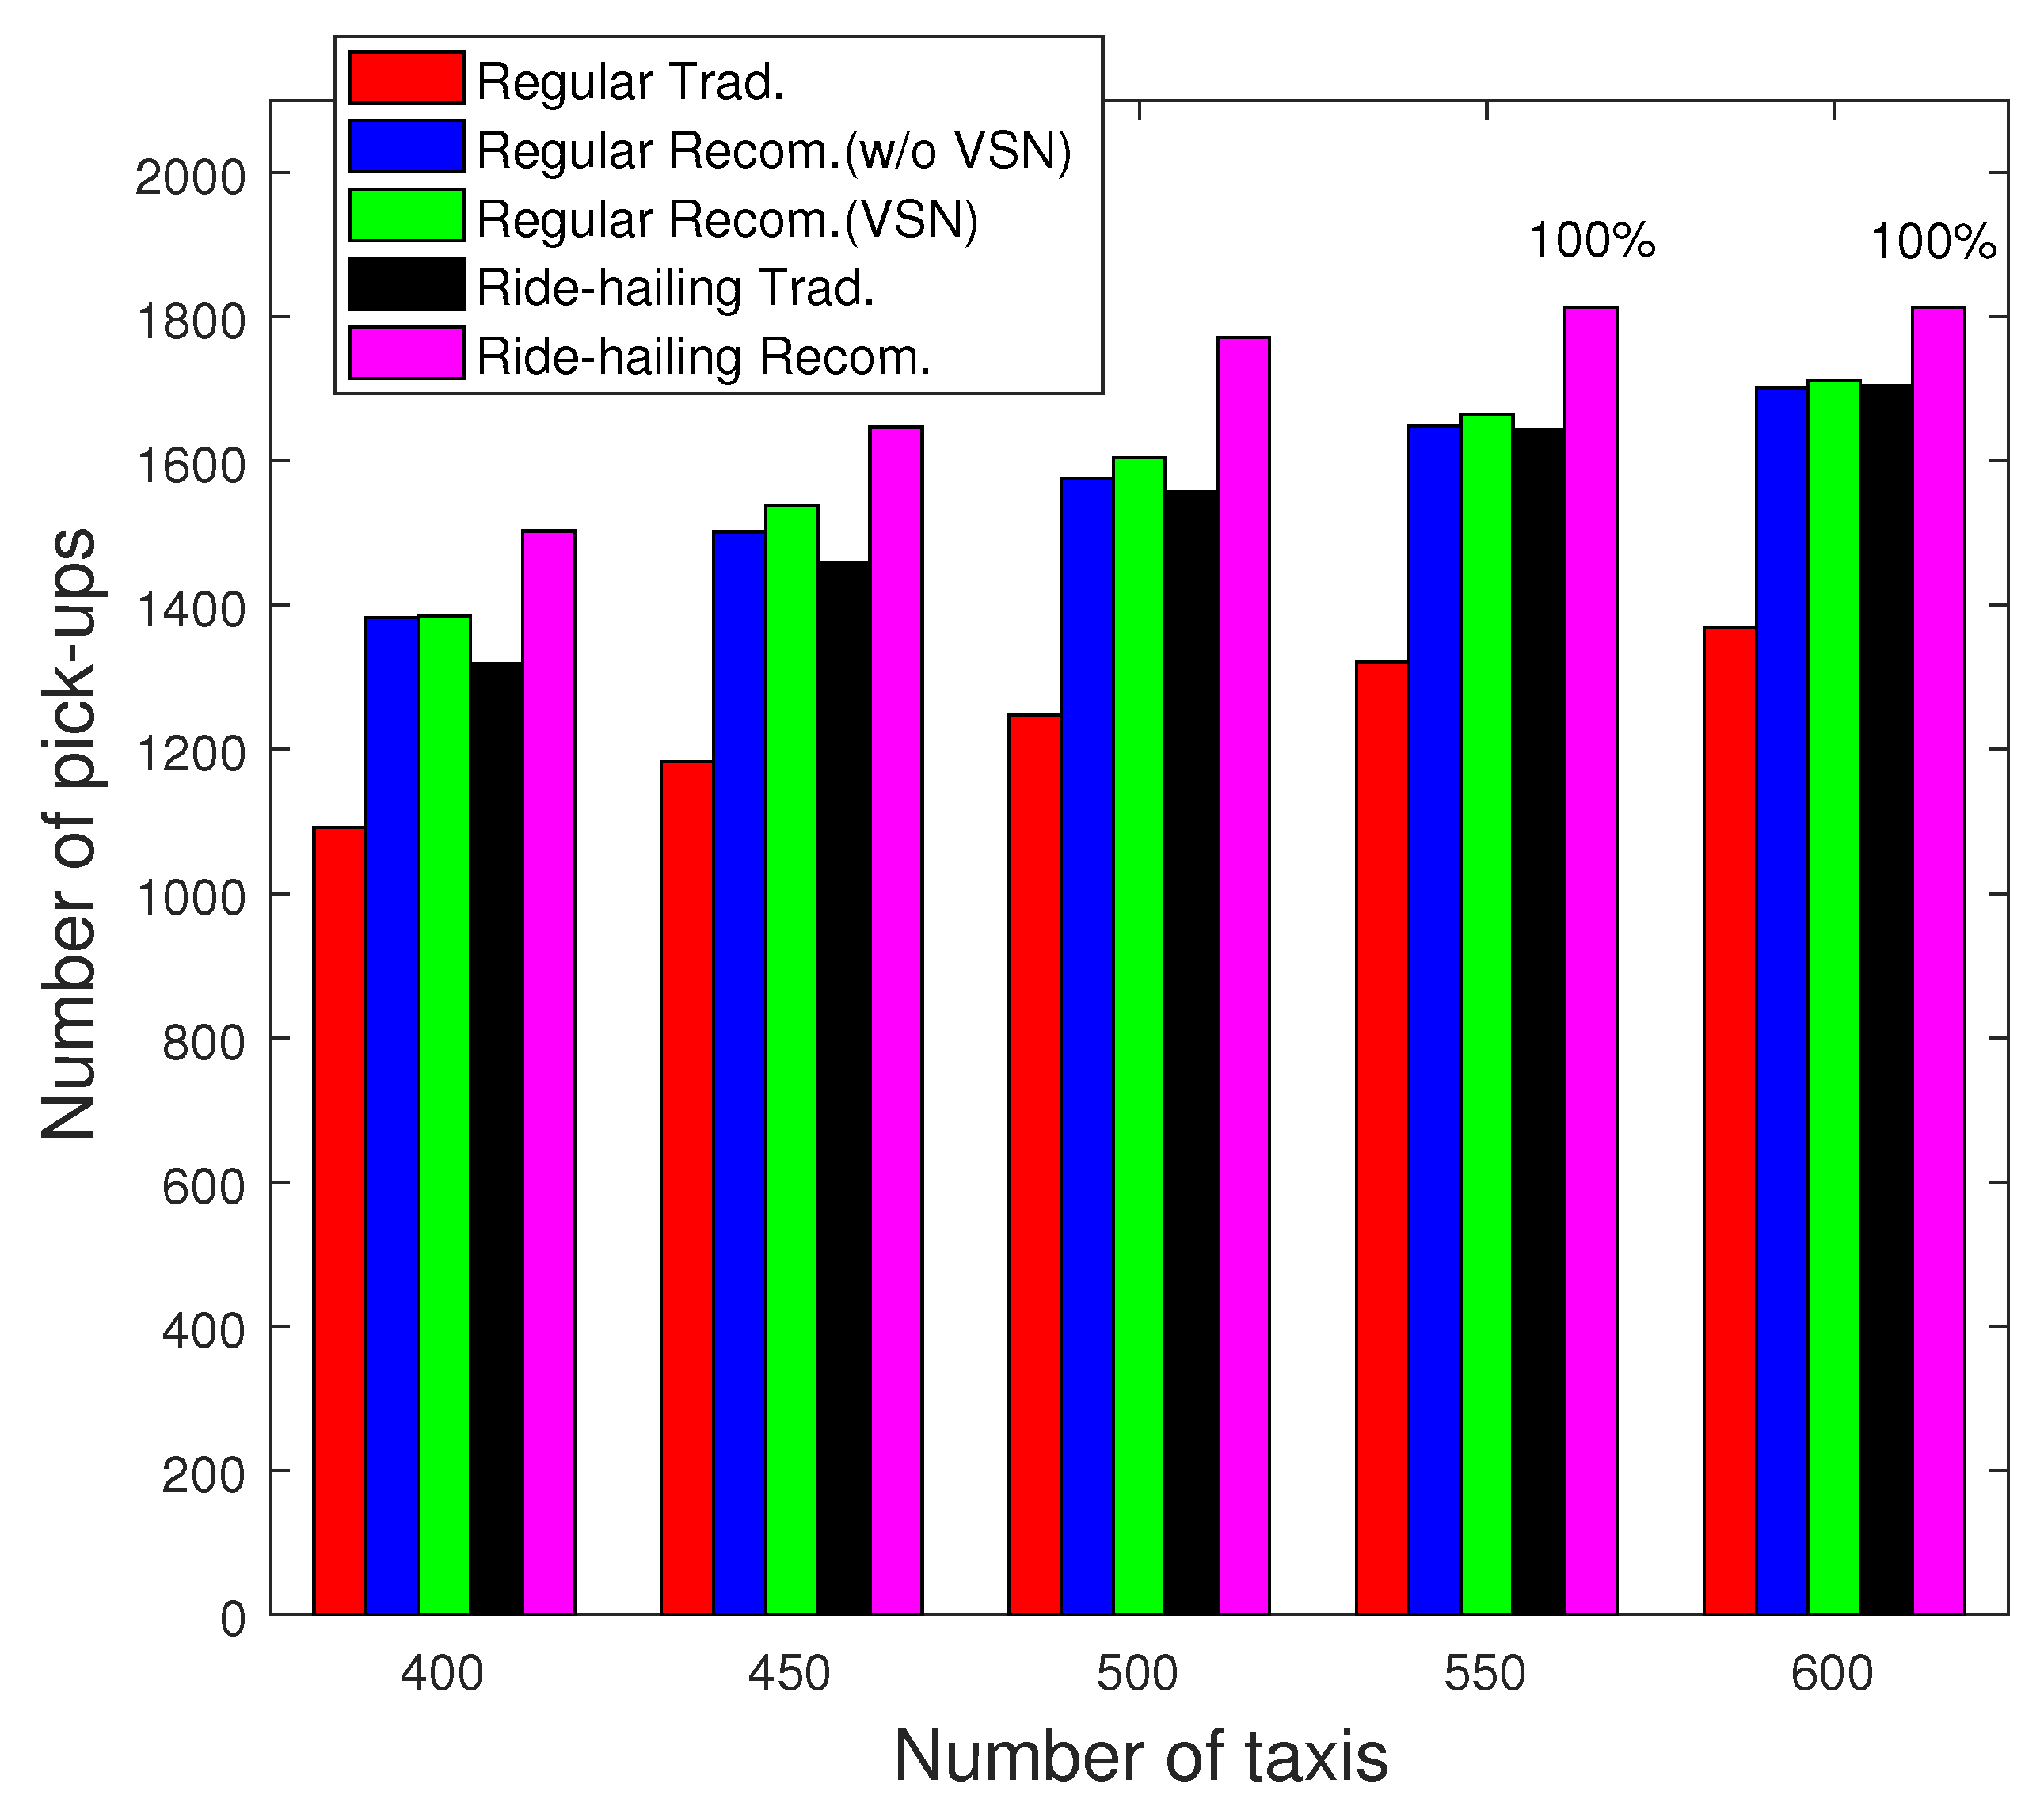
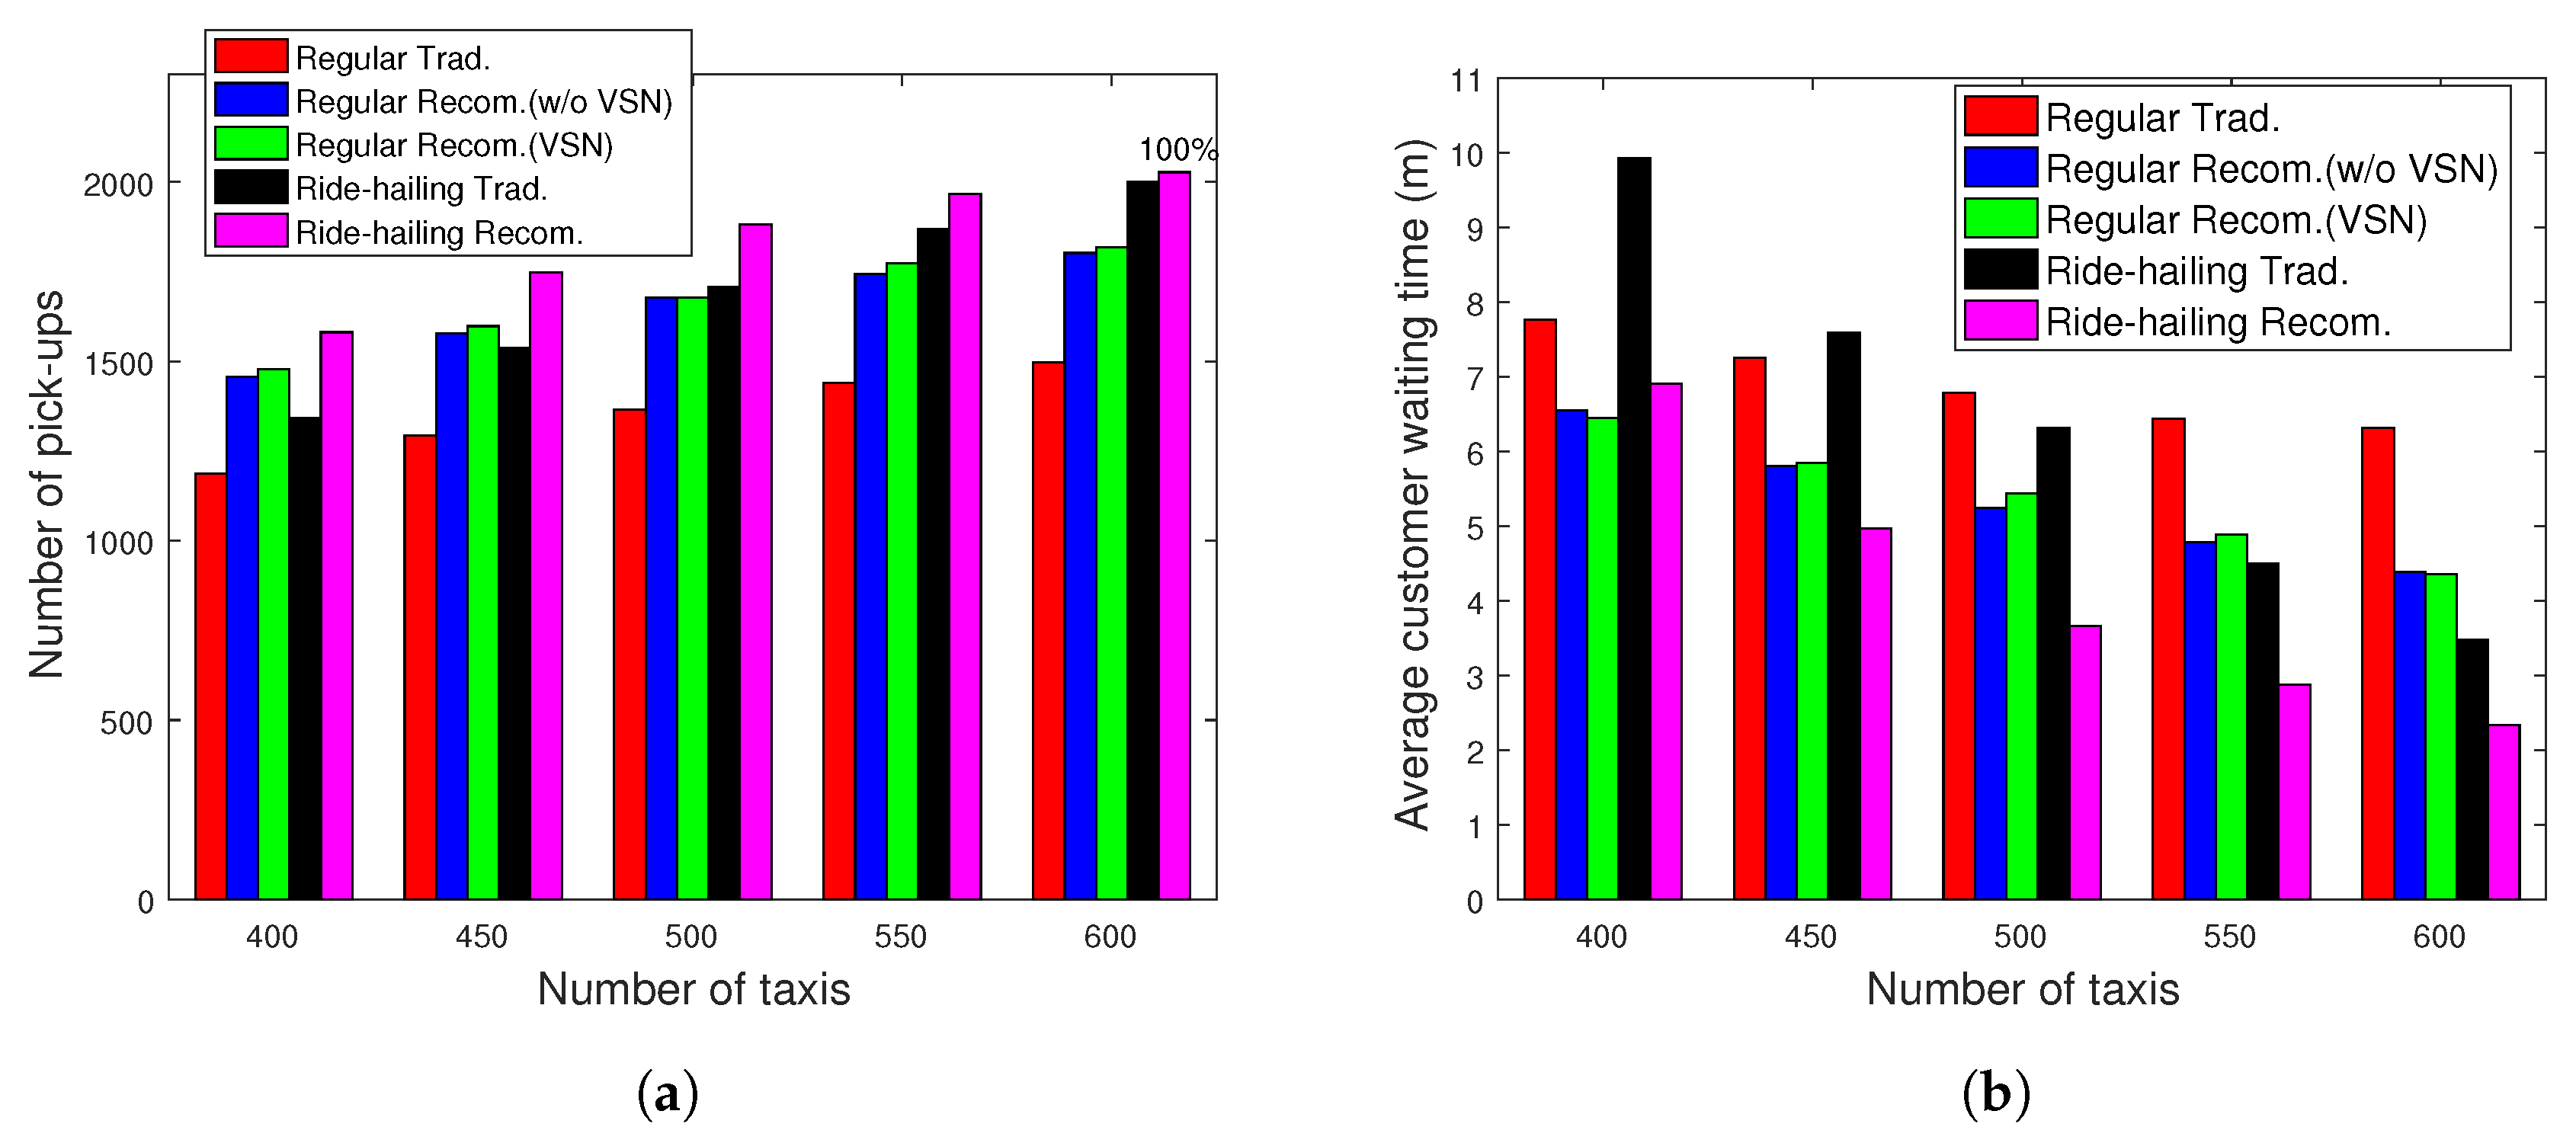
In
Figure 10, we depict the number of pick-ups achieved by recommendation system in regular (without and with VSN) and ride-hailing taxi services (blue, green, pink) and compare them to the traditional cases of both services (red, black) with different taxi fleet sizes (
) for Scenario 1. We can clearly notice that higher performance are achieved with the recommendation system regardless of the taxi fleet size.
For instance, the number of pick-ups with regular taxis increases by around 20% with a fleet size . Adding VSN option also helps in slightly improving the performance. On the other hand, the number of pick-ups in ride-hailing service is higher than those of regular service. For instance, when , with the recommendation system, 100% of the customers have been picked up using ride-hailing taxi service while 95% of the customers have been picked up using regular taxi service. Also, we notice that when and , the ride-hailing taxis are able to pick up all the customers. In other words, an excess supply is obtained with a taxi fleet of , which corresponds to an unnecessary wasting of fuel and may cause redundant congestion.
In order to deeply visualize the number of pick-ups for each region, we plot, in
Figure 11, the ratio of number of pick-ups to the total customer’s requests with
. We notice that the ratio of pick-ups is small in the upper Manhattan since the customers’ demands are mainly located in the lower Manhattan. Although we evenly assign the vehicles to different regions according to the expected customers’ requests, there is a high probability that a vehicle heading to upper Manhattan from lower Manhattan ends up finding customers on the route before arriving.
6.3. Customer Waiting Time (Scenario 1)
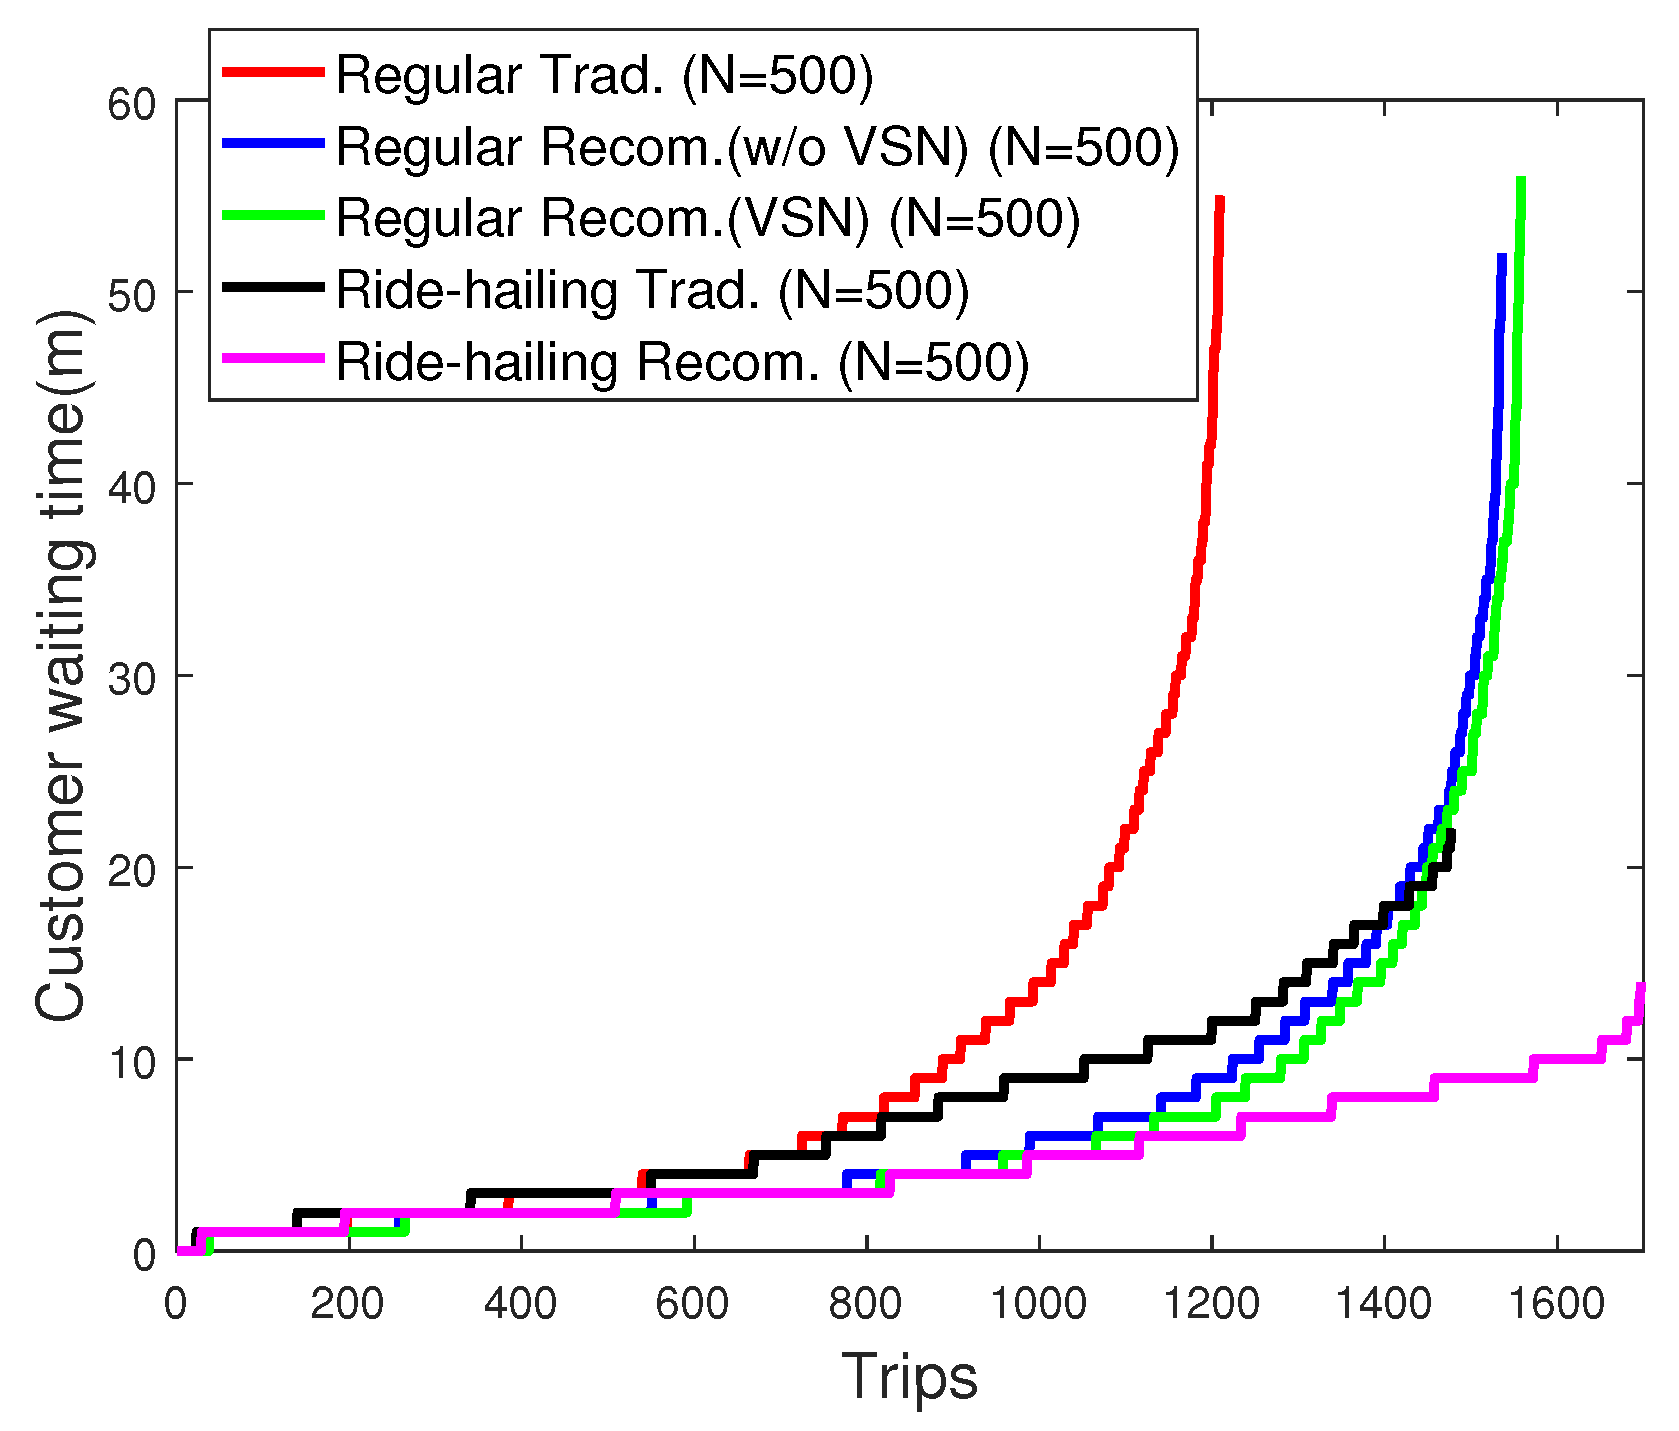
In
Figure 12, we evaluate the satisfaction of customers (waiting time) for all the recorded trips during the time period
T with
for Scenario 1. We notice that, with the same fleet size of taxis cruising throughout the map, customers wait much less time with the recommendation system. With VSN, the performance of the recommendation system in regular taxi service is improved slightly. It is worth noting that 98% of the customers wait less than 10 min before finding a vacant ride-hailing taxi thanks to the proposed recommendation system compared to 70% with the traditional case. We also notice that without recommendation system, the ride-hailing service provides customers with shorter average waiting time compared to the regular taxi services, which is true in practice. If we apply the recommendation system for both services, then the average waiting time in ride-hailing is much lower than the one obtained with regular taxis.
In addition, we present the average customer waiting time per region with
for Scenario 1, as shown in
Figure 13. We find out the average waiting time in upper Manhattan is lower than that in lower Manhattan, since the customers are gathered in lower Manhattan and there is competition among customers to find available taxis.
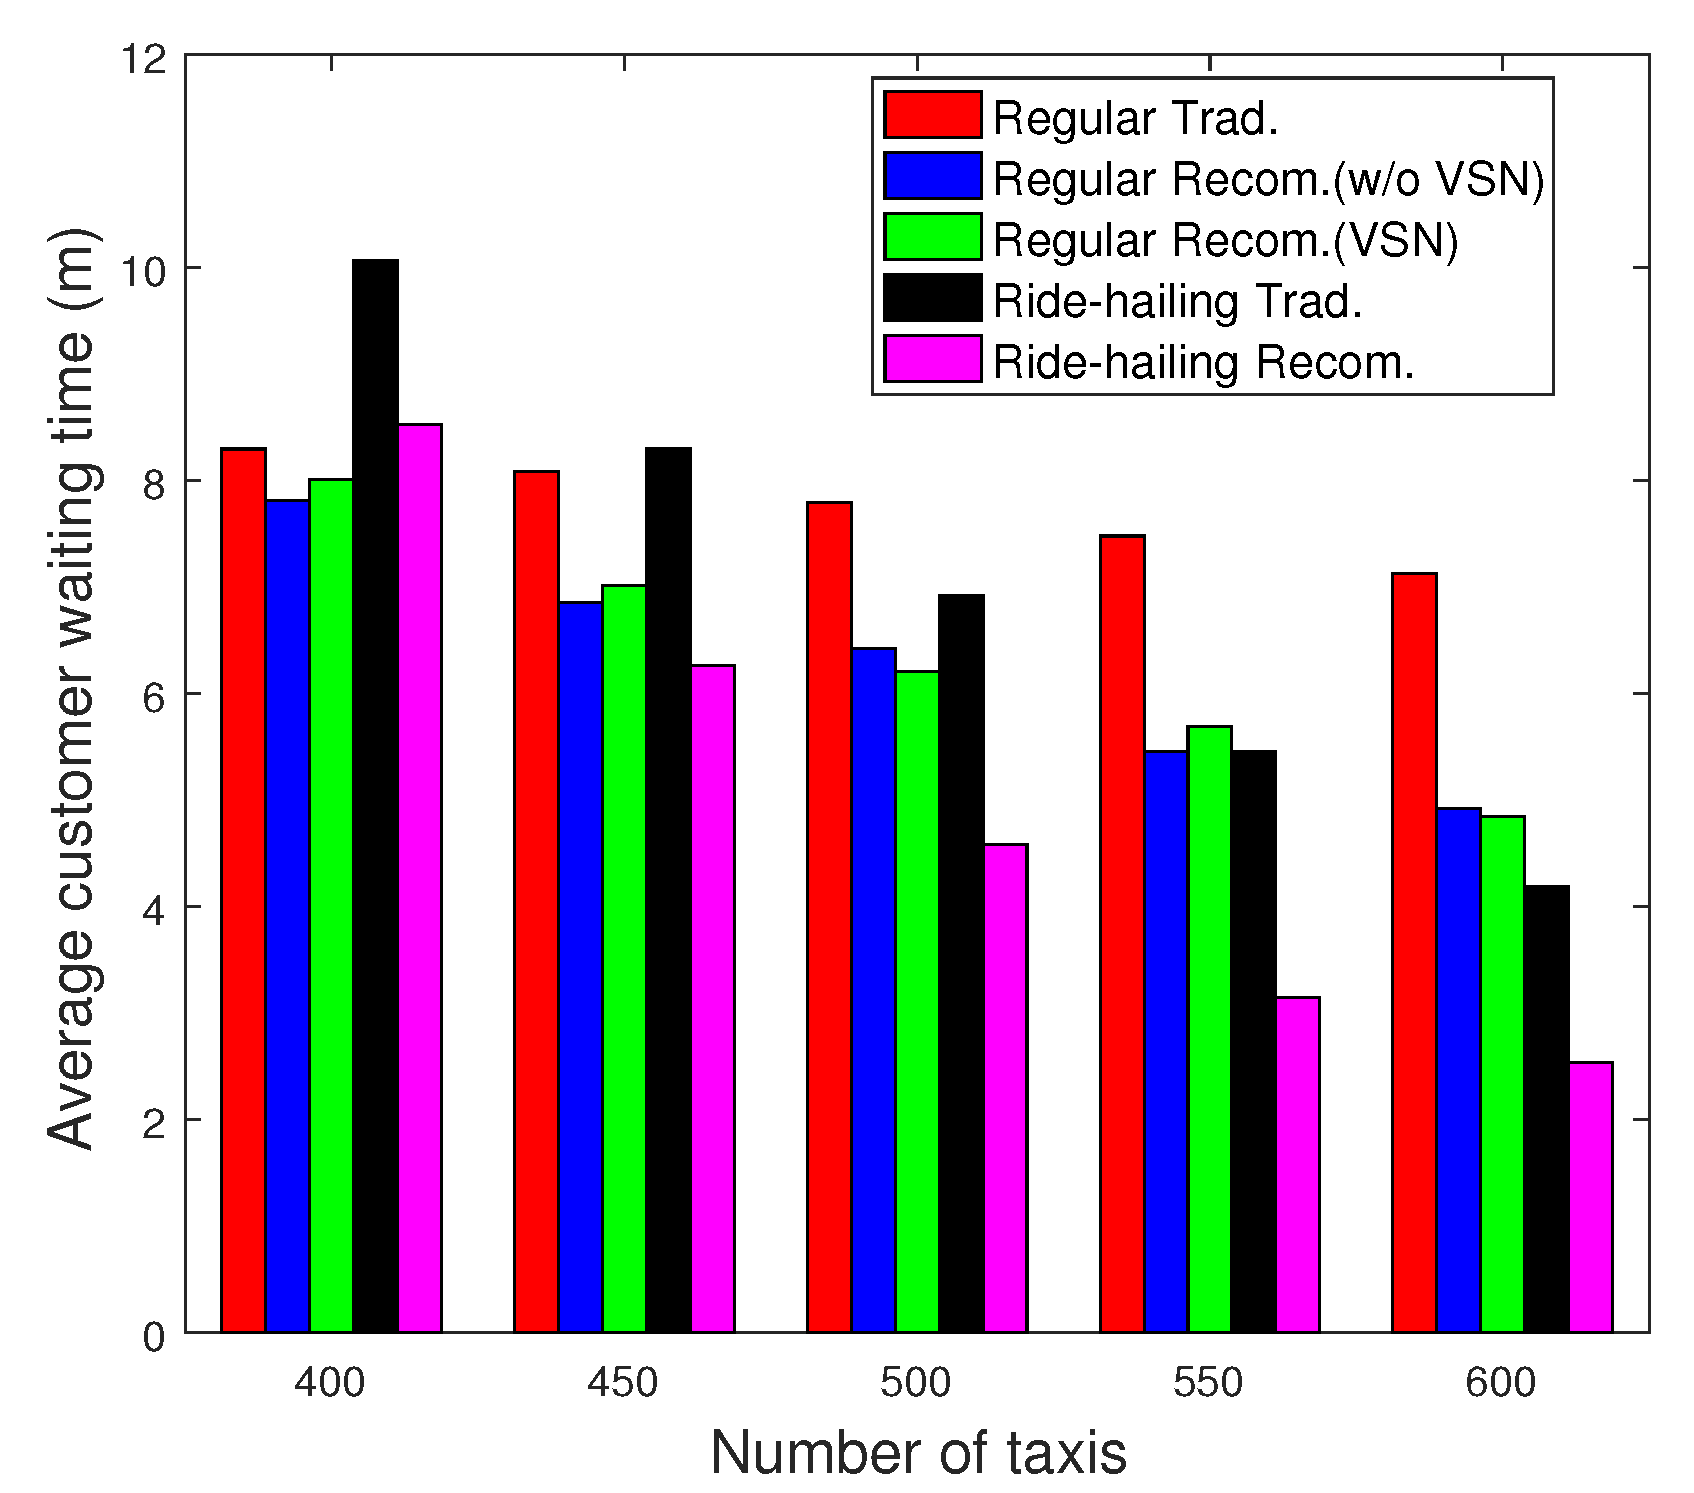
Finally, in
Figure 14, we depict the average customer waiting time including recommendation system in regular and ride-hailing taxi services (blue, green, pink) and traditional case using both services (red, black) with different taxi fleet size (
) for Scenario 1. We notice that higher performance is achieved with the recommendation system regardless of the taxi fleet size. For instance, when
, on average, with the recommendation system, customers wait 1.66 min lower compared to the traditional case in ride-hailing taxi service and 2.28 min lower for regular taxi service.
6.4. Vacant Traveled Distance (Scenario 1)
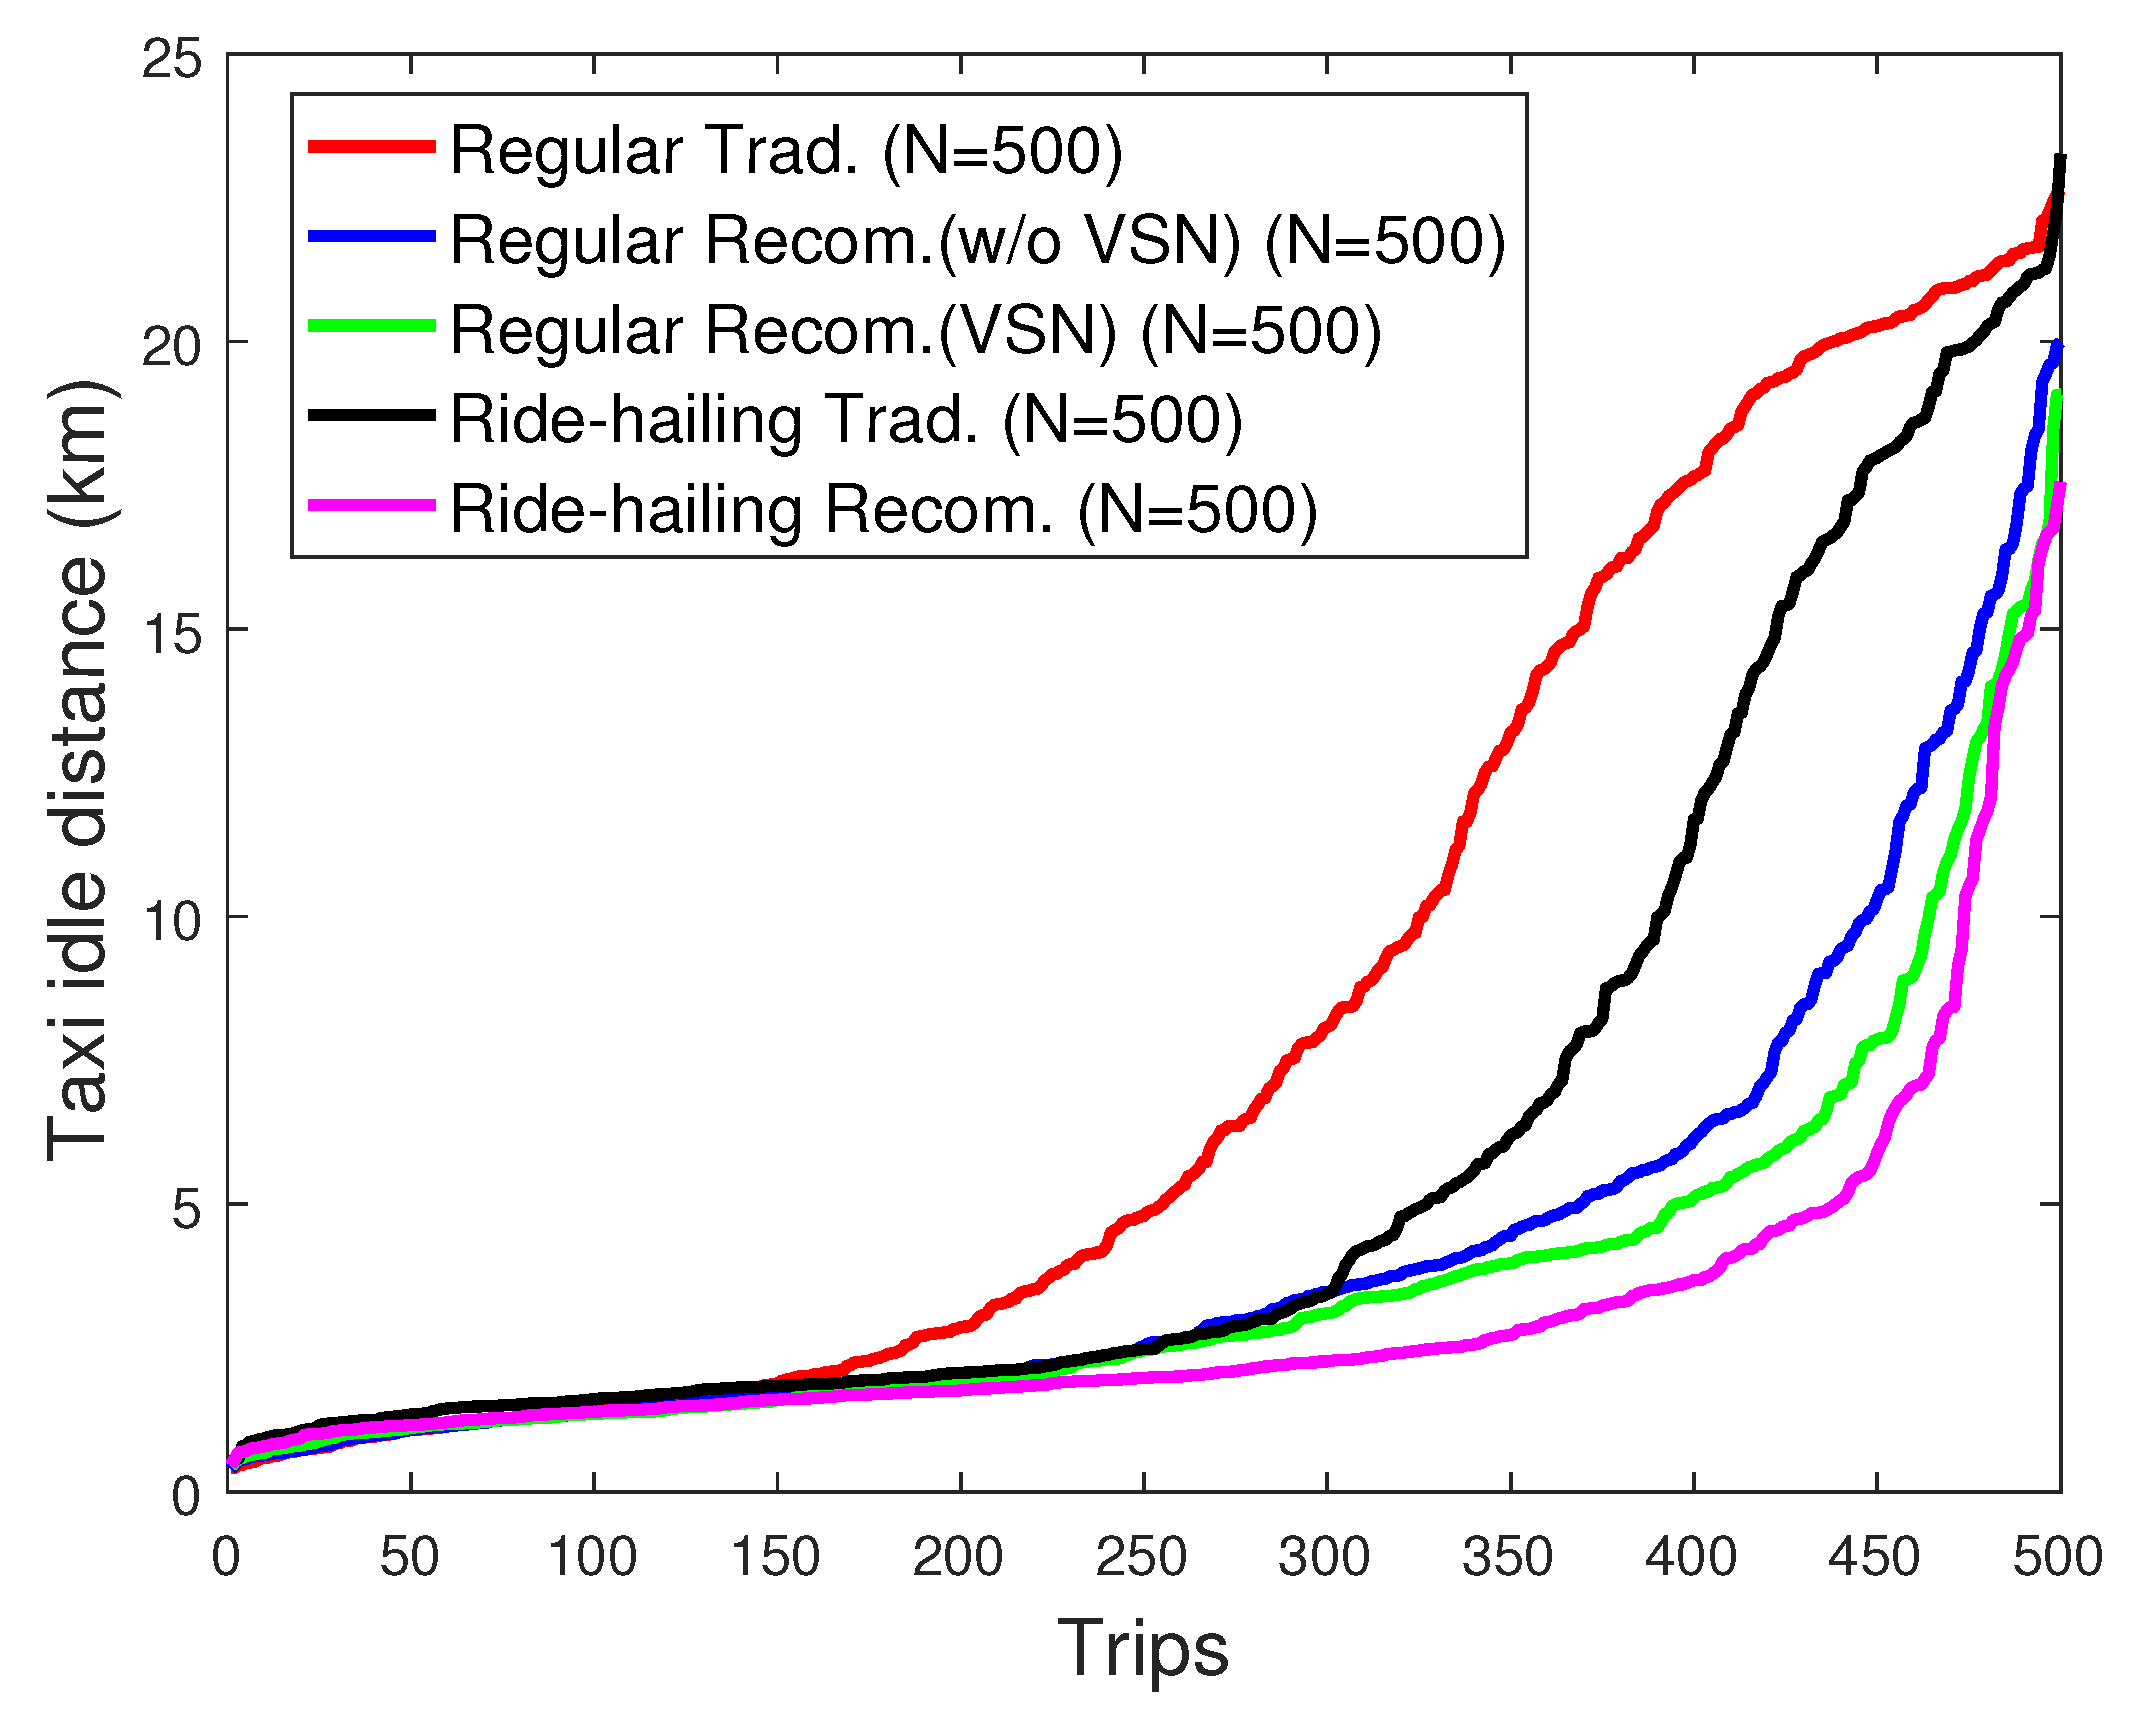
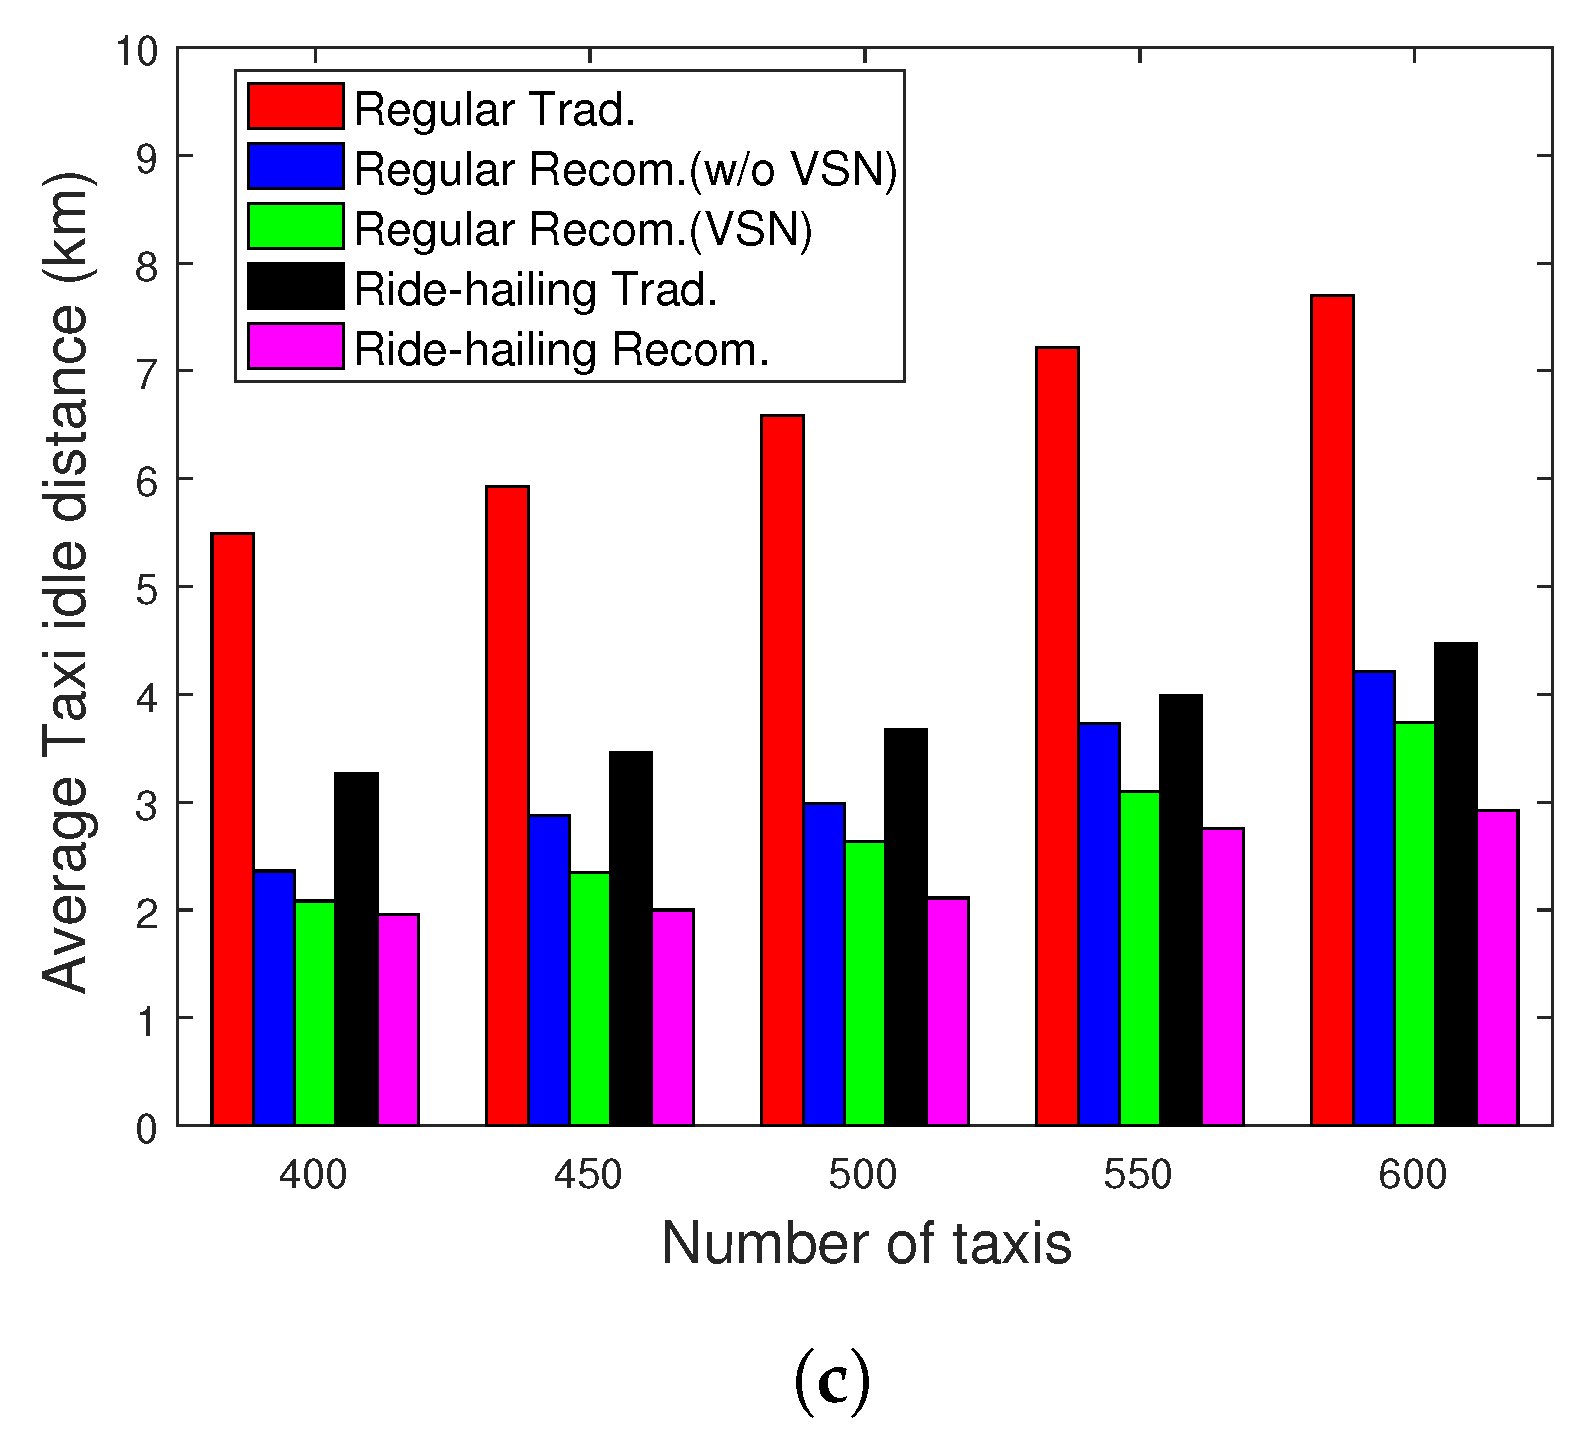
Similarly, in
Figure 15, we evaluate the satisfaction of taxi drivers represented by their idle traveled distance. We notice that with the proposed recommendation system, the taxi drivers have less idle traveled distance, and as expected, drivers in ride-hailing service have less idle traveled distance than those of the regular taxi service. We also notice that with VSN, the performance slightly increases in regular taxi services. It is worth noting that 92% of the taxis idly travel for less than 10 km during one hour when
thanks to the proposed recommendation system. However, with the traditional techniques, only 78% of the fleet achieves a similar result.
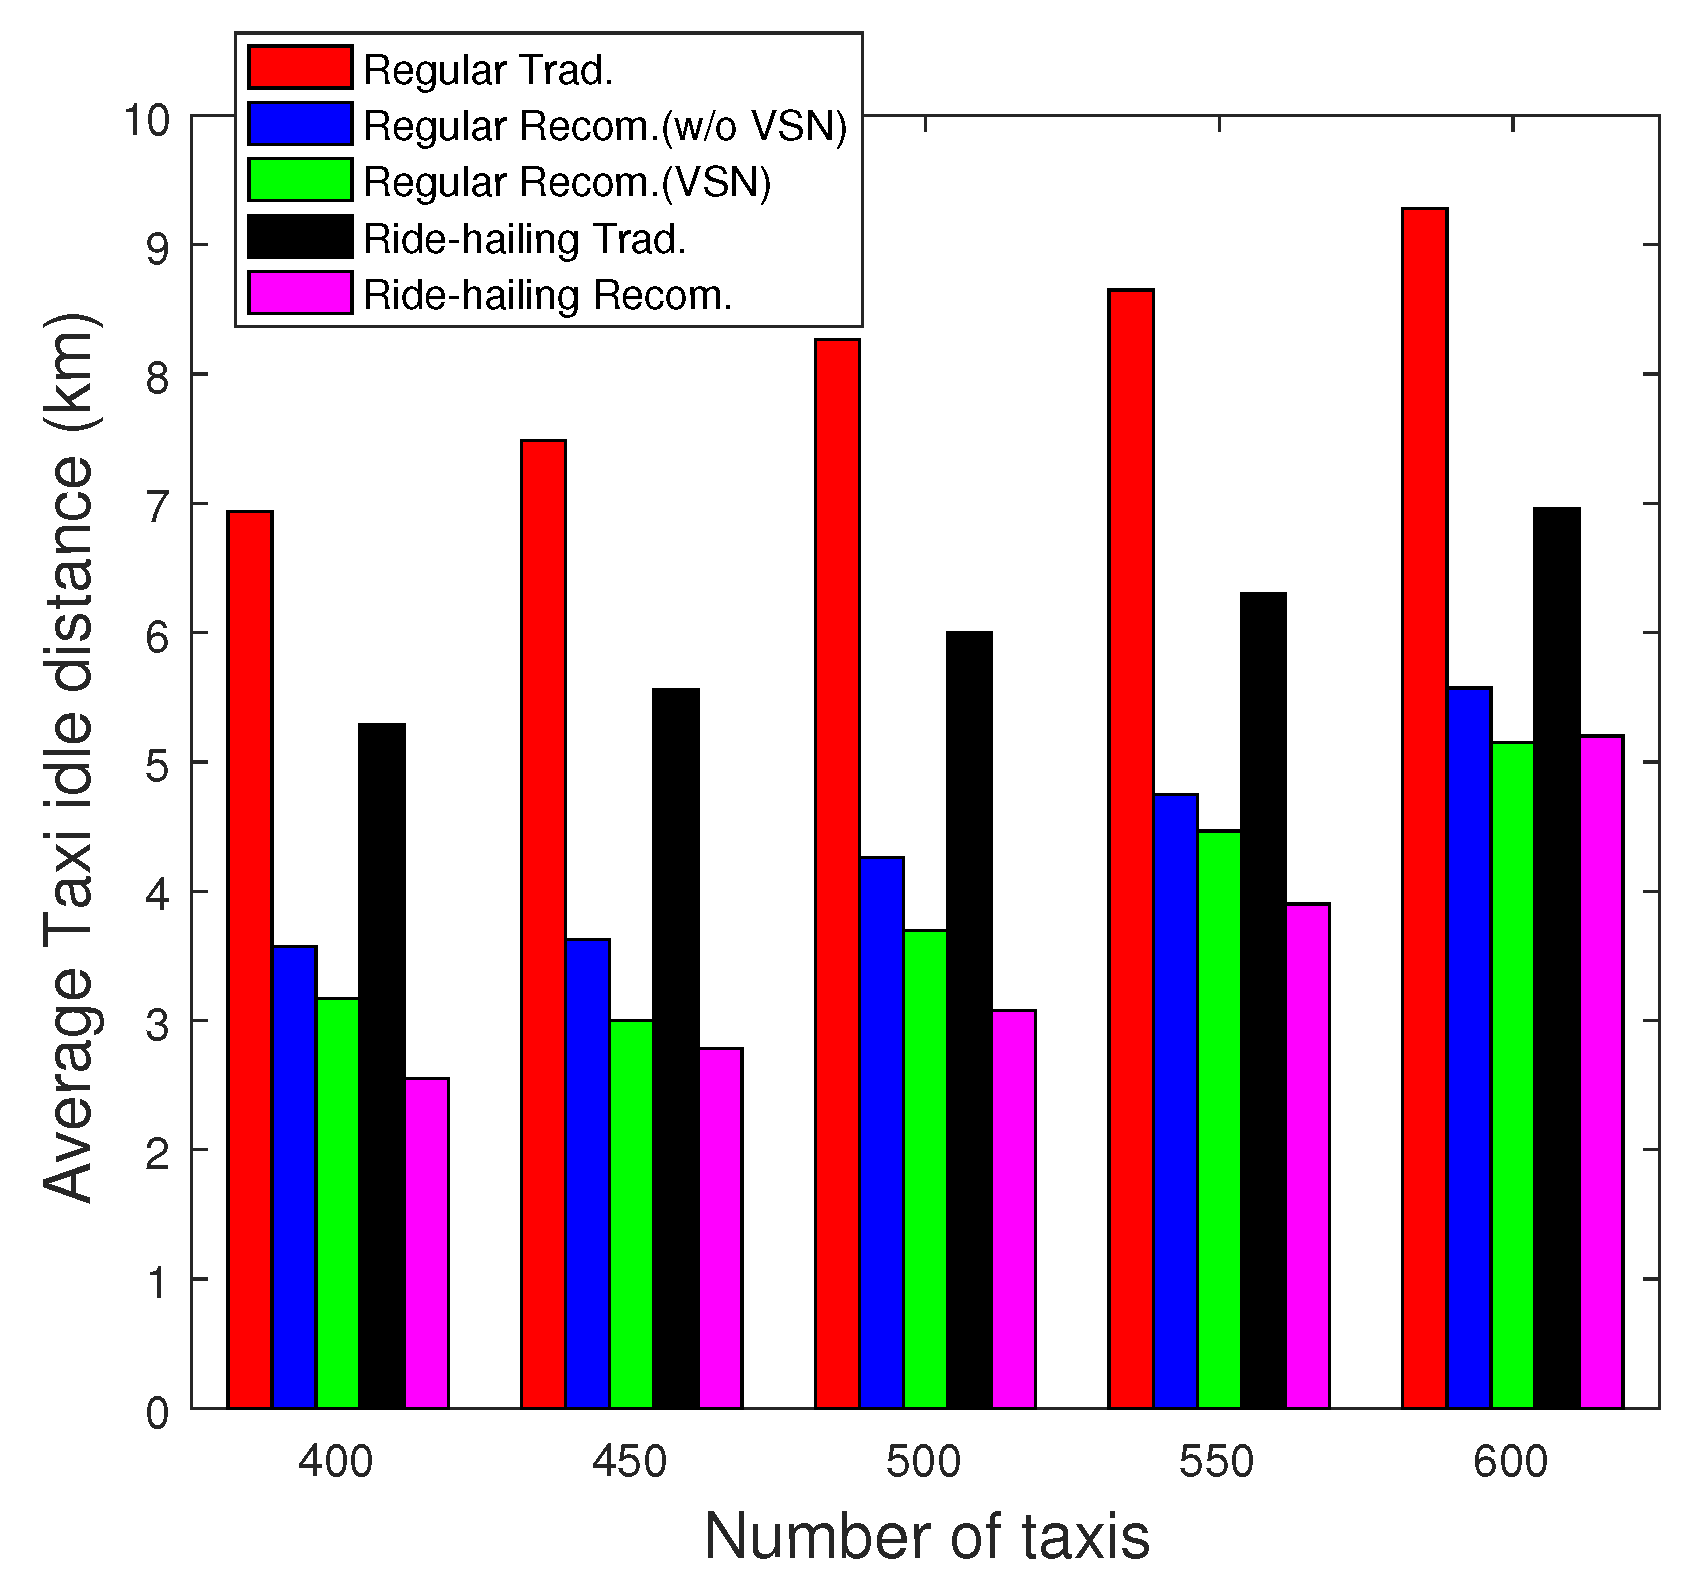
In addition, we present, in
Figure 16, the average idle traveled distance using the recommendation system for regular and ride-hailing taxi services, as well as the traditional cases for Scenario 1. Again, higher performances are achieved with the recommendation system regardless of the taxi fleet size. For instance, when
, with the recommendation system, taxis travel 1.7 km less in vacant status compared to the traditional case in ride-hailing taxi service and 4.1 km less compared to the traditional case in regular taxi service. Close performances are achieved with the other fleet sizes.
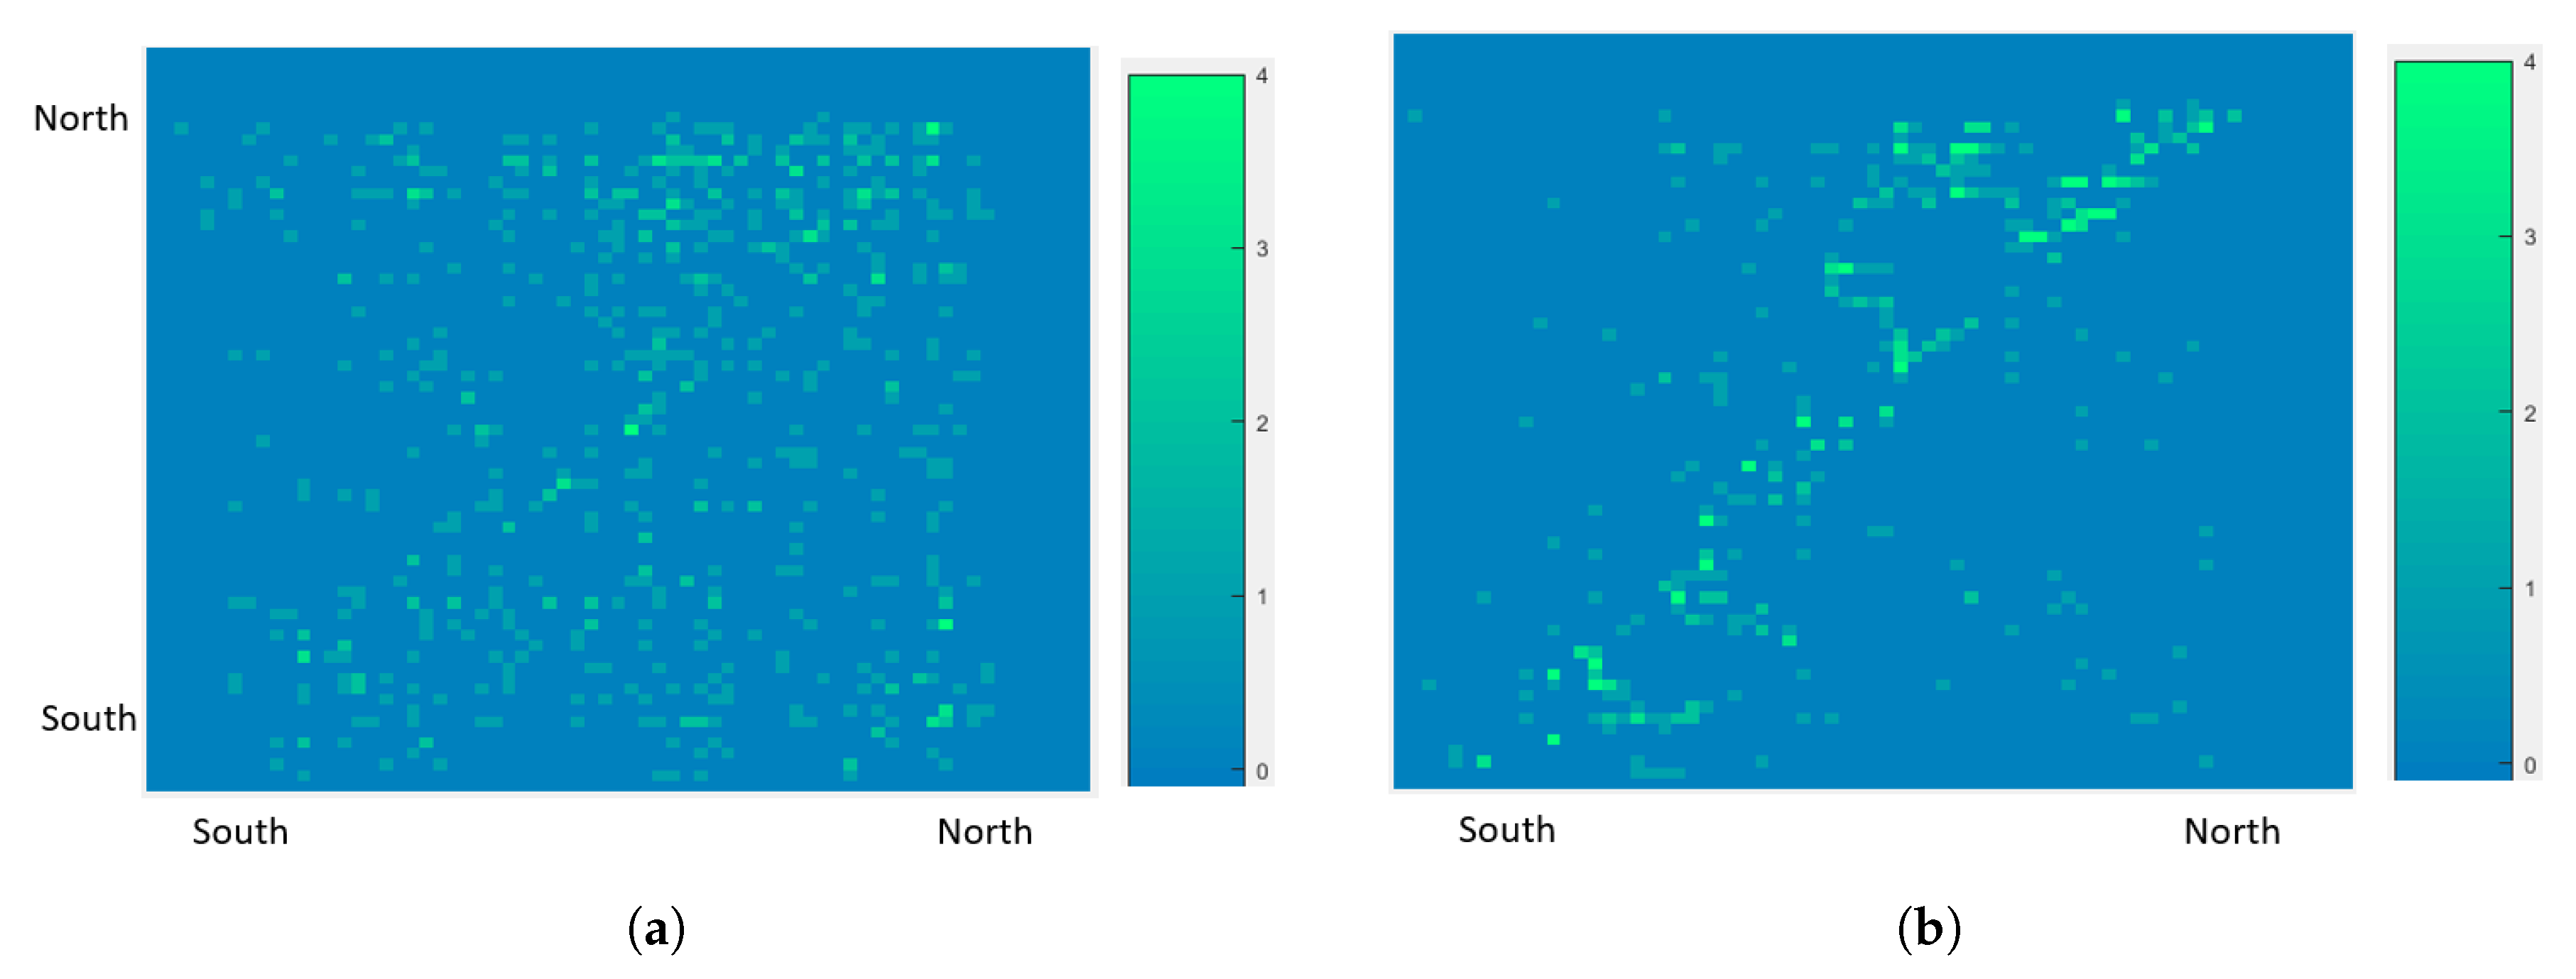
In
Figure 17, we provide heatmaps for both traditional and proposed schemes illustrating the regions crossed by
regular taxicabs during idle periods when looking for customers. In this figure, we sort the regions according to their geographical locations and place the regions next to each other in both axes where the horizontal axis is the origin region (last dropoff region) and the vertical axis is the destination region (the region where the next customer is found). The figure shows that the taxis in the traditional case are moving from a region to another in a near-uniform pattern where taxi drivers search for customers following their own intuition, while thanks to the recommendation system, taxi drivers are able to reduce their travelling idle distance by searching for customers within the same or nearby regions as it is corroborated by the diagonal pattern given in
Figure 17b. In this way, the hunting time is minimized, which allows taxi drivers to save additional time and fuel.
6.5. Taxi Re-Assignment Frequency (Scenario 1)
We have shown that our recommendation system could achieve outstanding progress for the different key metrics. We then explore whether the system (with VSN) provides excessive re-assignments to taxis during time period
T or not and, hence, check the practicality of the system. In other words, we need to pay attention to the number of re-assignments since taxi drivers do not prefer such recommendations in practice. In
Table 2, we provide the average number of re-assignments for Scenario 1 based on our simulations. On average, the number of re-assignments is lower than 2 during one hour for vacant taxis. On the other hand, ride-hailing taxis have less re-assignments compared to the those of regular taxi services since the locations of customers are known in ride-hailing taxi services. Also, we notice that when the number of taxis increase, taxi drivers are more likely re-assigned before finding customers since the supply is exceeding the demand.
6.6. Summary and Discussion for Scenario 2
Finally, a comprehensive summary of the results for Scenario 2 is shown in
Figure 18, which presents similar performance to Scenario 1. For instance, when
, customers wait 1.62 min lower compared to the traditional case in ride-hailing taxi service and 2.79 min lower for regular taxi service. Also, with the recommendation system, taxis travel 1.8 km less in vacant status compared to the traditional case in ride-hailing taxi service and 3.9 km less compared to the traditional case in regular taxi service. On the other hand, by comparing the performance between ride-hailing and regular taxi services, we find out the average customer waiting time and the idle traveled distance of drivers are improved when customers’ locations are sent to the system. Furthermore, it is worth noting that when the number of taxis increases, the customers’ waiting time decreases while the idle traveled distance of taxi drivers increase. It is important to determine the appropriate size of taxi fleet for each time period of the day so that both customer and taxi drivers are satisfied without overloading the region with redundant taxis.


