Article

Price Based Demand Response for Optimal Frequency Stabilization in ORC Solar Thermal Based Isolated Hybrid Microgrid under Salp Swarm Technique

1
Electrical Engineering Department, National Institute of Technology Silchar, Silchar 788005, Assam, India
2
Department of Computer Science, School of Computing, National University of Singapore, Singapore 637551, Singapore
3
Fukushima Renewable Energy Institute, AIST (FREA), National Institute of Advanced Industrial Science and Technology (AIST), Koriyama 963-0298, Japan
*
Authors to whom correspondence should be addressed.
Electronics 2020, 9(12), 2209; https://doi.org/10.3390/electronics9122209
Submission received: 24 November 2020 / Revised: 18 December 2020 / Accepted: 18 December 2020 / Published: 21 December 2020
(This article belongs to the Section Power Electronics)

Abstract

:
Smart grid technology enables active participation of the consumers to reschedule their energy consumption through demand response (DR). The price-based program in demand response indirectly induces consumers to dynamically vary their energy use patterns following different electricity prices. In this paper, a real-time price (RTP)-based demand response scheme is proposed for thermostatically controllable loads (TCLs) that contribute to a large portion of residential loads, such as air conditioners, refrigerators and heaters. Wind turbine generator (WTG) systems, solar thermal power systems (STPSs), diesel engine generators (DEGs), fuel cells (FCs) and aqua electrolyzers (AEs) are employed in a hybrid microgrid system to investigate the contribution of price-based demand response (PBDR) in frequency control. Simulation results show that the load frequency control scheme with dynamic PBDR improves the system’s stability and encourages economic operation of the system at both the consumer and generation level. Performance comparison of the genetic algorithm (GA) and salp swarm algorithm (SSA)-based controllers (proportional-integral (PI) or proportional integral derivative (PID)) is performed, and the hybrid energy system model with demand response shows the supremacy of SSA in terms of minimization of peak load and enhanced frequency stabilization of the system.

1. Introduction

The demand for electricity consumption is growing day by day, in line with consumer activities. The expansion of generation capacity with traditional energy sources leads to negative effects on the environment and, subsequently, increases the operational cost. Therefore, the introduction of smart microgrid technologies, such as renewable energy sources (RESs) and demand response management (DSM), enables environmentally friendly solutions.
Smart microgrids with digital technological strategies and the utilization of generation of power from RESs, such as wind turbine generators (WTGs) and solar power, are able to generate and distribute [1] electricity as optimally, echo-friendly and user-friendly in a smart manner. Since wind power generation (WTG) is fluctuating in nature, the diesel and wind energy combination [2,3] is utilized in hybrid systems. The integration of a solar thermal power system (STPS) as a non-conventional energy source reduces the depletion of conventional energy-based power generation. In order to overcome the frequency fluctuation due to uncertain energy sources, such as WTG and STPS [4,5], some energy storage units have been introduced to the hybrid energy system model, such as hydrogen aqua electrolyzers (AEs) and fuel cells (FCs), which are capable of reducing these fluctuations.
The smart grid concept has the ambition to achieve the most economical and reliable operation by considering demand response (DR) [6,7] for smoothing the demanded load curve. The incentive-based and price-based [8,9] programs are the two main programs corresponding to demand response. A price-based program [10,11] or smart pricing provides consumers with dynamic electricity prices. Among all the smart pricing schemes, real-time pricing (RTP) [12] is the most efficient to enhance the supply and demand balance by altering electricity pricing in response to the generation–demand balance.
Residential load represents a larger portion of energy consumption and load modeling in distribution networks [13,14]. Thermostatically controllable appliances like air conditioners (ACs), water heater (WHs) and refrigerators (REZs) hold a major portion of the non-sensitive residential loads [15,16]. The control strategy for thermostatic loads to reduce the demand in peak hours by load by changing the thermostat set point setting [17,18] has been studied by considering the system frequency and real-time pricing (RTP) [19,20].
DR with pricing indicators on residential load control, such as thermostatically controllable loads (TCLs) [21,22,23,24], can be modeled with various optimization techniques such as the genetic algorithm (GA)- [25] and salp swarm algorithm (SSA)-based controllers (PI and PID) [26]. In fact, the smartness of the power network lies in the gains and other parameters of the controllers. Hence, in recent times, several example from the literature have leveraged different optimization approaches such as firefly (FF) [27], the particle swarm technique (PSO) [28], the cuckoo search approach (CSA) [29] and the ant lion approach (ALO) [30] under conventional and microgrid power networks. In the line above, the application of SSA is a maiden one which has never been leveraged for frequency regulation of an isolated hybrid microgrid system in the presence of price-based DR (PBDR). Like other techniques, the requirement of a higher number of evaluations with larger computational time [31] is the major drawback of GA, as was considered in the targeted assignment. However, the employment of an adaptive mechanism in the SSA is the main factor to getting faster convergence characteristics with less computational time. The motivation is the minimization of the peak load for better frequency regulation and for better improvement of the stability and reliability of the hybrid-isolated power network. The main objectives of the current research work are listed below:
  • The application of electricity pricing-based demand response (PBDR) for TCLs for the optimal management of energy utilization by the users;
  • Comparison of the dynamic responses of various PI and PID controllers in the hybrid isolated microgrid system with and without PBDR;
  • The optimization of (PI and PID) controller gains by applying the genetic algorithm (GA) and SSA in the developed model.
The rest of this work is organized as follows. Section 2 illustrates the system’s frequency response modeling of the proposed renewable hybrid microgrid. Section 3 describes the application of a real-time pricing scheme on TCLs. Details of the salp swarm algorithm (SSA) are given in Section 4. Section 5 assesses simulation results under various scenarios and compares their frequency stabilization performances. Section 6 draws the conclusions.

2. Dynamic Modeling of Hybrid Energy System

The microgrid system model mentioned in the proposed work consists of organic Rankine cycle (ORC) low-temperature STPSs, wind turbine generators (WTGs), diesel engine generators (DEGs), fuel cells (FCs) and hydrogen aqua electrolyzers (AEs) as energy storage elements. The schematic block diagram of the proposed microgrid network, as well as its transfer function modeling, are displayed in Figure 1a,b, respectively [2]. The system parameters are tabulated in Table 1.

2.1. Wind Turbine Generator (WTG)

The captured energy of blowing wind converts mechanical energy to electrical energy with the help of a WTG. As the volatile nature of wind is very much unpredictable, so too does the extractable power of a WTG depend on the velocity of the wind at that moment. It usually includes a gearbox, and some wind turbines use blade pitch system controllers to control the total amount of transformed power. The electrical generator transforms mechanical energy into electrical energy. The linearized transfer function model [2] of a WTG is illustrated by the following equation:
G W T G = K W T G 1 s T W T G + 1

2.2. ORC Solar Thermal Power System (STPS)

Recently, concentric solar thermal collectors are used by the steam Rankine and Stirling engine technologies. Organic Rankine cycle (ORC)-based STPSs with suitably selected working fluids are typically selected for the use of generation of power in lower temperatures. A trough solar power plant with parabolic trough collectors focuses the sunlight to heat the working fluid in the pipes to some definite temperature (3930 °C). A heat transfer fluid, heated by a solar thermal power system, generates a high temperature (up to 5600 °C). The steam generated by this process is used to drive the steam turbine for the generation of electricity. The transfer function [2] modeling of an ORC solar thermal power system is shown below:
G S T P S = K S s T S + 1 K T s T T + 1

2.3. Diesel Engine Generator (DEG)

A DEG, the combination of a diesel engine and an electrical generator, is used to support backup power generation and has fast dynamic characteristics. The transfer function model of the DEG is given below [2]:
G D G = K D G 1 s T D G + 1

2.4. Fuel Cell (FC)

Considering the electrochemical reaction, an FC produces direct current power and converts that power into alternating current power by enabling an inverter. A fuel cell generator has the non-linearity characteristic, and the linearized transfer function Equation (2) of the FC could be depicted as
G F C = K F C 1 s T F C + 1

2.5. Aqua Electrolyzer (AE)

Due to the randomly variable power output from solar thermal and wind turbine generators, AEs are used to absorb the variable or changeable power. The transfer function modeling of an AE is shown below [2]:
G A E = K A E 1 s T A E + 1
In order to maintain efficiency, stability and reliability, it is also necessary to keep the scheduled frequency under normal operating conditions, which can be achieved by maintaining the supply and demand in a balanced condition. The change in electrical power (ΔPe) is calculated as the distinction between the total power generation (Ps) and the demanded load (Pl):
Δ P e = P s P l
where
P s = P W T G + P S T P S + P D E G + P F C P A E P l = P L C + P U C
The system frequency varies with the change in total power variation. As such, the frequency deviation can be calculated by
Δ f = Δ P e 1 K s y s + D
Due to the presence of a delay in time between the net power distinction and the frequency deviation, the linearized transfer function modeling for the system frequency variation can be expressed as [2]
Δ G s y s = Δ f Δ P e = 1 s M + D

3. Real-Time Pricing for Smart TCLs

Thermostatically controllable loads (TCLs), like air conditioners, water heater and refrigerators, were considered for residential load control. To supervise the energy utilization of the customer, the ON and OFF rotation of the thermostatic appliances could be controlled to maintain the temperature within an acceptable and limited range.
The RTP is the deviation of electricity pricing in real time for the improvement of the supply–demand balance. In fact, the basic principle of RTP [32] is that, when it comes to the overloading condition, the system frequency falls, and the electricity price increases to decrease the load from the consumer side. On the other hand, during the light load periods, the system frequency rises, and the electricity price decreases to increase the load, or the utility gives an opportunity to consume more power to the consumer in these periods. Therefore, it is possible to reschedule power consumption by introducing electricity pricing in demand response determined by RTP.
The key objective of this proposed assignment is to control the frequency of an autonomous hybrid power system using the electricity pricing-based demand response (PBDR) for thermostatically controllable loads. TCLs are rated by their coefficient of performance (COP), and the change in the set point of thermostat results in the deviation in power consumption, calculated by the given equations [33]:
C O P = W o r k   d o n e   ( Q ) E l e c t r i c   p o w e r   i n p u t ( P i n p u t )
The work done (Q) by the thermostatic controllable loads is given by
Q = m × C P × T o u t T i n
where m is the mass of the coolant, Cp is the specific heat capacity of the coolant, Tout is the outside temperature and Tin is the inside temperature.
The change in work done (ΔQ) for a change in the thermostat set point (ΔTst), calculated by assuming the thermostat set point is the same as the inside temperature, is
Δ Q = m × C P × Δ T s t
The change in work done (ΔQ) results in a change in electric power consumption (ΔPinput). Thus, from Equation (9), we can express the power consumption as
Δ P i n p u t = Δ Q C O P = m × C P × Δ T s t C O P
Equation (12) establishes a linear relation between the change in the thermostat set point and the change in power consumed by the TCL unit. The consumers contracted for demand response can adjust the set point temperature of their thermostatic loads so as to ensure optimal use of their power consumption.
With the variation in frequency (∆f), the change in electricity price (∆ρ) can be expressed as [33]
Δ ρ = k × Δ f
where k is taken as 0.5 rupees per hertz (Rs./Hz), according to availability based tariff (ABT).
Therefore, the energy price increases when the frequency deviation becomes negative and vice versa. Now, the variation in the thermostat set point with the variation in frequency (∆f) can be expressed by [14]
Δ T s t = k 0.5 × Δ f d t
where k represents the gain factor.
As such, by adjusting the energy consumption of the thermostatic loads, as per the price of the electricity, we can improve the load management by consumers [3]. Controllers are equipped to adjust the thermostatic power, in addition to other generating units. The parameters of these controllers are optimized by using algorithms such as GA and SSA.
In the PID controller design, the integral square error (ISE), given by Equation (15), is selected as the objective function in this optimization problem, while t is the simulation time and ∆f is the change in frequency:
J = 0 T Δ f 2 d t
This is subject to the following:
K p min K p K p max K i min K i K i max K d min K d K d max
The minimum values of the objective function (J) are implemented to regulate the optimum parameters of PI and PID controllers. The block diagram and necessary program were developed in MATLAB/SIMULINK.

4. Salp Swarm Technique (SSA)

SSA is a global optimization technique used for obtaining the best solution, assuming that the salps are searching the food source by creating a salp chain. In this salp chain model, the salps are separated into two sets: leader and followers. The leading salp moves toward the food source and also guides the other followers, and the followers follow the leading salp. In the optimization problem, the best solution is presumed to be the food source, and to reach that search space is the target of the salp swarms [26]. The flow diagram of the SSA is presented in Figure 2, whereas the parameters of considered techniques are illustrated in Table 2.
The computational steps of the SSA are given below:
  • Initiation of the salp population with random positions for the solution of the parameters (Kp, Ki, Kd);
  • Calculating the fitness value of each salp, and assigning the salp with the best ability to lead to the food source. Here, the objective function in Equation (15) is considered as a fitness function;
  • Updating the salp positions. For every dimension, the position of the leading and following salps are updated, keeping all the salps in the frontiers of the search space. This updating salp position gives a solution to the problem;
  • Repeating all the above steps except Step 1 until the termination criterion or the best solution is reached.

5. Frequency Response Simulation Results

In Section 4, the dynamic responses of the proposed renewable microgrid systems are observed to evaluate the performance of several PI and PID controllers to contain the system frequency. The response of different case studies under various operating conditions and the optimum gain values of GA- and SSA-tuned controllers (PI and PID) are presented. However, the overview of each case is tabulated in Table 3.

5.1. Case 1: Under Step Vitiation

With the step changes in the power output from wind, solar thermal and uncontrollable loads, as plotted in Figure 3a, the varied power outputs of the DEG, FC and AE are as plotted in Figure 3c,d, where the frequency deviation (Δf) is depicted in Figure 3b. The controller gain parameters (with and without price-based demand response (PBDR)) were obtained through a GA optimization technique, which is given in Table 4. When the load demand was lesser than the total power generation, the aqua electrolyzer (by using the controller) absorbed some power and, for the remaining period, the input power to the AE was considered to be zero, as is shown in Figure 3e.
The controllable thermostatic loads (e.g., air conditioner, water heater) play an important role in the reduction of system frequency error, as they are considered a major portion of the residential loads of the system. Figure 4a,b shows the thermostatically controllable load power consumption and change in electricity pricing (with and without PBDR) due to a change in frequency. It has been observed that the deviation in frequency could be reduced better, while the thermostatic load consumption was minimized using the PBDR strategy with GA-based controller gain. Furthermore, for the PID controllers, thermostatic controllable loads (TCLs) and the frequency deviation were minimized much better than with the PI controllers.

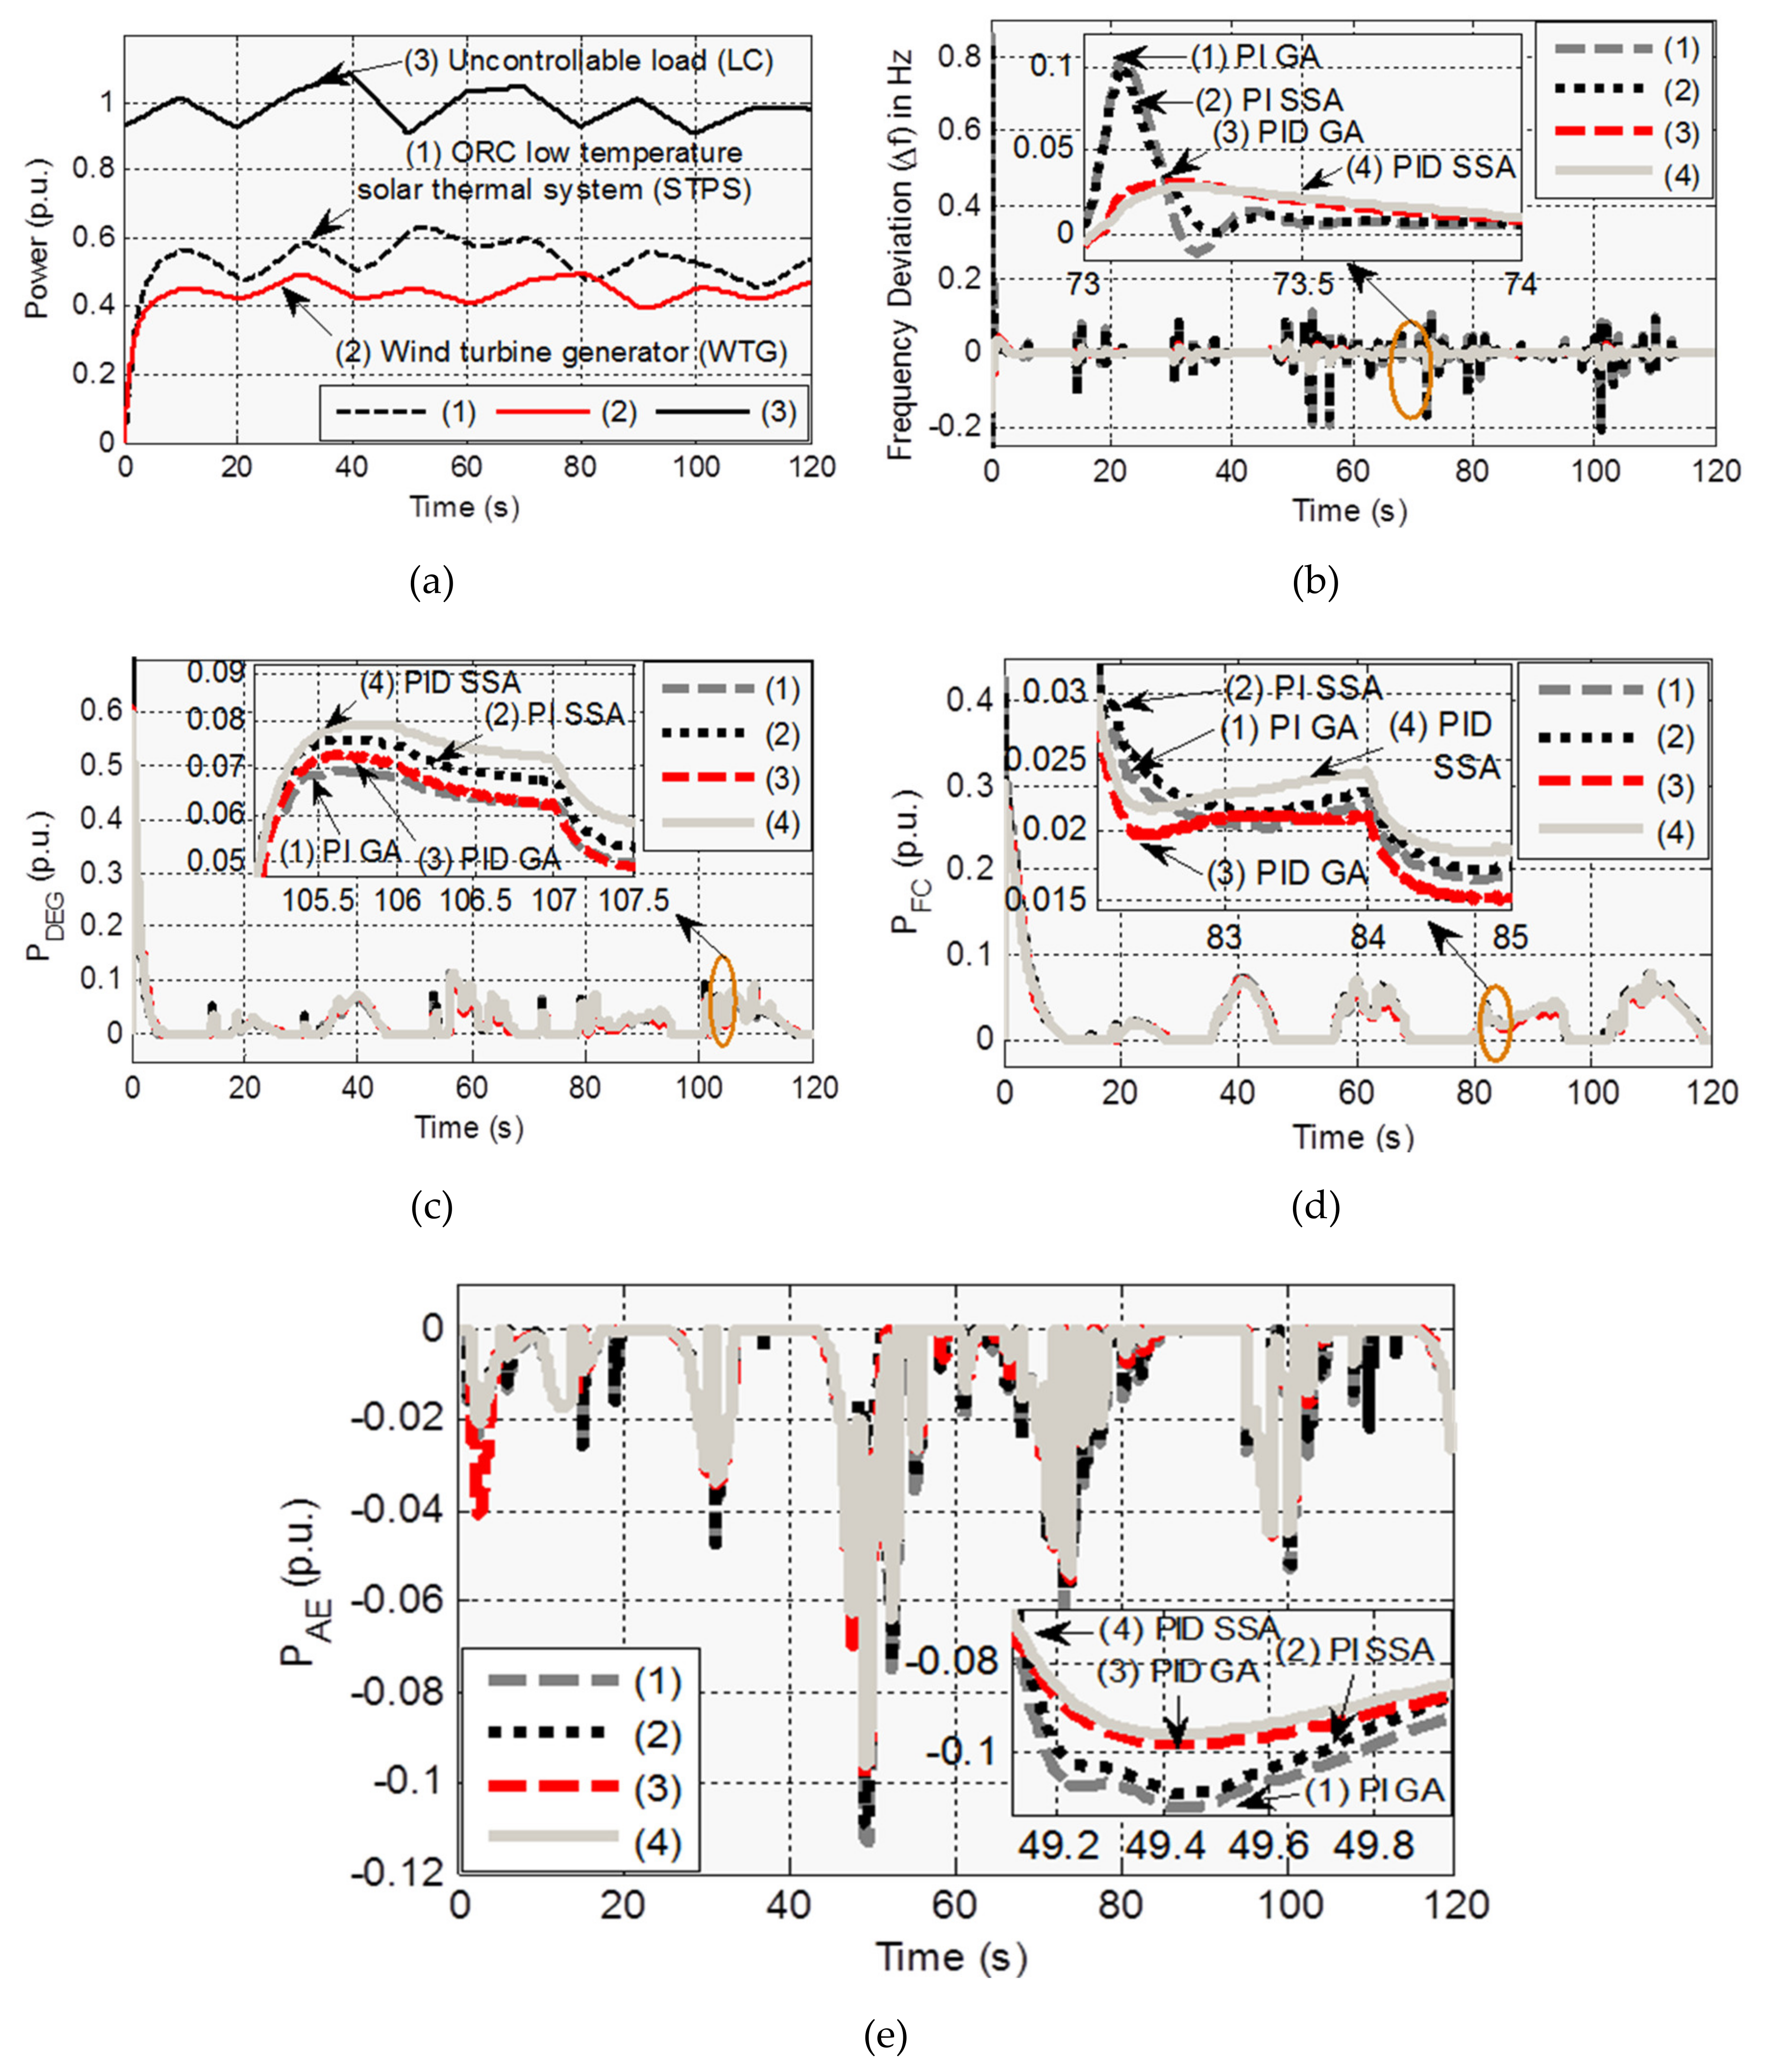
5.2. Case 2: Under Random Disturbances

In this study, randomly variable power generation from the WTG, STPS and load models, as leveraged in Figure 5a, were considered for the dynamic responses of the hybrid microgrid system to analyze the effects of a concurrent change in power. The net generated power for this scenario could be expressed as
Ps = PDEG + PWTG + PSTPS + PFC − PAE
In order to minimize the deviation in the total generated power and demanded load, the output powers of the DEG, FC and AE were automatically adjusted to various values through various controllers, shown in Figure 5b,c–e, which plots the comparison between the frequency deviations for pricing-based demand response (PBDR) using the GA and SSA optimization techniques. Figure 6a,b frames the thermostatically controllable load power consumption and the change in electricity pricing due to the change in frequency. In the case of pricing-based demand response, thermostatic load consumption was minimized by using the GA- and SSA-based controller gain. For the PID controller, thermostatically controllable loads (TCL) reduced the frequency deviation much better than the PI controller. Table 5 depicts the optimized gain values of the PI and PID controllers obtained from the GA and SSA. The rigorous observation tells us that the performances of all SSA-based controller gain values were better than the GA-optimized values. Overall, the SSA-based PID controller gave the better performance compared with the GA-tuned PI, PID and SSA-tuned PI controller.

6. Conclusions

In this paper, a real-time price (RTP)-based demand response (DR) program in an autonomous hybrid energy system is proposed. Such a program reduces the total energy consumption and shifts the loads from high price periods to low price periods. The DR program introduces RTP to control the thermostat set point of thermostat loads (e.g., air conditioner). When the energy rescheduling technique with PBDR is applied, the thermostat set point changes linearly with the price. The modeling of the wind turbine generator, solar thermal power system and load are selected properly for various case studies to illustrate the dynamic performance of the proposed hybrid system model.
To minimize the fluctuations in frequency, the output power from the sources and power consumption by the TCL loads (using electricity pricing-based DR) are controlled by PI and PID controllers. By using GA and SSA optimization techniques, the gains of these controllers are optimized. Extensive performance simulations are performed to compare and contrast the operation with different controller and optimization combinations. It was observed from the dynamic response results that the PID controller gave a better performance than the PI controller, in terms of the peak overshoot and settling time. It was also observed that the dynamic performance of all SSA-optimized controllers was better than using GA-optimized controllers to enable automatic generation control in the proposed hybrid energy system.
These results are valuable in understanding frequency fluctuations in isolated hybrid microgrids and designing optimal controllers and DR schemes for economic operation.

Author Contributions

Conceptualization, A.L.; methodology, M.P.; validation, A.L., M.P. and S.M.S.H.; supervision, D.C.D. and T.S.U.; funding acquisition, T.S.U. All authors have read and agreed to the published version of the manuscript.

Funding

This research received no external funding.

Conflicts of Interest

The authors declare no conflict of interest.

Nomenclature

∆fSystem frequency fluctuation
KsysOverall constant frequency characteristic
Gsys(s)Overall transfer function of proposed system
PDEGExtractable power of diesel generator
GDEG(s)Transfer function of DEG
KDEGDEG’s gain
TDEGConstant time of DEG
PFCExtractable power of FC
KFCFC’s gain
TFCFC’s constant time value
GFC(s)Transfer function of FC
PSTPSDispatchable power of organic Rankine cycle-based STPS
GSTPS(s)Overall transfer function of organic Rankine cycle STPS
TsSolar receiver’s constant time value
TTConstant charge time of the turbine
KSSolar receiver’s gain
KTTurbine’s gain
GAE(s)Overall transfer function of AE
PAEExtractable power hydrogen aqua electrolyzer
KAEHydrogen aqua electrolyzer’s gain
TAEHydrogen aqua electrolyzer’s fixed time
PSTotal generated output power
PlDemanded load power
∆PeMismatch between generated power and demand
MOverall proposed system inertia
DOverall proposed system damping coefficient
PWTGDispatchable power WTG
GWTG(s)Overall transfer function of WTG
KWTGWTG’s gain
TWTGWTG’s time constant
∆QChange in work done by thermostatic loads
∆ρChange in electricity pricing
∆TSTChange in thermostat set point
KGain factor of smart thermostat
PLCPower consumption by controllable loads
PUCPower consumption by uncontrollable loads

References

  1. Lu, N.; Katipamula, S. Control strategies of thermostatically controlled appliances in a competitive electricity market. In Proceedings of the IEEE Power Engineering Society General Meeting, San Francisco, CA, USA, 16 June 2005; pp. 202–207. [Google Scholar]
  2. Das, D.C.; Sinha, N.; Roy, A.K. Automatic Generation Control of an Organic Rankine Cycle Solar-Thermal/Wind-Diesel Hybrid Energy System. Energy Technol. 2014, 2, 721–731. [Google Scholar]
  3. Jiang, L.; Low, S. Real-time demand response with uncertain renewable energy in smart grid. In Proceedings of the 49th Annual Allerton Conference on Communication, Control, and Computing (Allerton), Monticello, IL, USA, 28–30 September 2011; pp. 1334–1341. [Google Scholar]
  4. Nguyen, H.K.; Bin, S.J.; Han, Z. Distributed Demand Side Management with Energy Storage in Smart Grid. IEEE Trans. Parallel Distrib. Syst. 2015, 26, 3346–3357. [Google Scholar]
  5. Ranjan, S.; Das, D.C.; Latif, A.; Sinha, N. LFC for Autonomous Hybrid Micro Grid System of 3 Unequal Renewable Areas using Mine Blast Algorithm. Int. J. Renew. Energy Res. (IJRER) 2018, 8, 1297–1308. [Google Scholar]
  6. Gao, J.; Xiao, Y.; Liu, J.; Liang, W.; Chen, C.L.P. A survey of communication/networking in Smart Grids. Futur. Gener. Comput. Syst. 2012, 28, 391–404. [Google Scholar]
  7. Vardakas, J.S.; Zorba, N.; Verikoukis, C.V. A survey on demand response programs in smart grids: Pricing methods and optimization algorithms. IEEE Commun. Surv. Tutor. 2015, 17, 152–178. [Google Scholar]
  8. Saele, H.; Grande, O.S. Demand response from household customers: Experiences from a pilot study in Norway. IEEE Trans. Smart Grid 2011, 2, 102–109. [Google Scholar]
  9. Imamura, A.; Yamamoto, S.; Tazoe, T.; Onda, H.; Takeshita, H.; Okamoto, S.; Yamanaka, N. Distributed demand scheduling method to reduce energy cost in smart grid. In Proceedings of the 2013 IEEE Region 10 Humanitarian Technology Conference, Sendai, Japan, 26–29 August 2013; pp. 148–153. [Google Scholar]
  10. Li, D.; Jayaweera, S.K. Uncertainty Modeling and Price-Based Demand Response Scheme Design in Smart Grid. IEEE Syst. J. 2017, 11, 1743–1754. [Google Scholar]
  11. Kenna, K.M.; Keane, A. Residential Load Modelling of Price-Based Demand Response for Network Impact Studies. IEEE Trans. Smart Grid 2016, 7, 2285–2294. [Google Scholar]
  12. Rahimi, F.; Ipakchi, A. Demand Response as a Market Resource under the Smart Grid Paradigm. IEEE Trans. Smart Grid 2010, 1, 82–88. [Google Scholar]
  13. Chanana, S.; Kumar, A. Demand response by dynamic demand control using frequency linked real time prices. Int. J. Energy Sect. Manag. 2010, 4, 1. [Google Scholar]
  14. Du, P.; Lu, N. Appliance commitment for household load scheduling. IEEE Trans. Smart Grid 2011, 2, 411–419. [Google Scholar]
  15. Datchanamoorthy, S.; Senthilkumar, D.; Ozturk, Y.; Lee, G.K. Optimal time-of-use pricing for residential load control. In Proceedings of the 2011 IEEE International Conference on Smart Grid Communications (SmartGridComm), Brussels, Belgium, 17–20 October 2011; pp. 375–380. [Google Scholar]
  16. Latif, A.; Das, D.C.; Biswas, K.; Kumar, K.; Kumar, R.; Hussain, S.I. Non-critical demands managed load frequency stabilization of dish-stirling-biodiesel based islanded microgrid system using FF optimized controller. Intell. Tech. Appl. Sci. Technol. 2020, 12, 188–196. [Google Scholar]
  17. Kishore, S.; Snyder, L.V. Control mechanisms for residential electricity demand in Smart Grids. In Proceedings of the 2010 First IEEE International Conference on Smart Grid Communications, Gaithersburg, MD, USA, 4–6 October 2010; pp. 443–448. [Google Scholar]
  18. Al-Badi, A.H.; El-Saadany, E. A summary of demand response in electricity markets. Electr. Power Syst. Res. 2008, 78, 1989–1996. [Google Scholar]
  19. Ravindran, P.; Das, K.R.; Mohan, A.S. Flexible demand response in smart grid based Automatic Generation Control. In Proceedings of the 2014 International Conference on Green Computing Communication and Electrical Engineering (ICGCCEE), Coimbatore, India, 6–8 March 2014; pp. 1–6. [Google Scholar]
  20. Chanana, S.; Arora, M. Demand response for residential air conditioning load using a programmable communication thermostat. Int. J. Electr. Electron. Sci. Eng. 2013, 7, 12. [Google Scholar]
  21. Babahajiani, P.; Shafiee, Q.; Bevrani, H. Intelligent Demand Response Contribution in Frequency Control of Multi-Area Power Systems. IEEE Trans. Smart Grid 2018, 9, 1282–1291. [Google Scholar]
  22. Latif, A.; Das, D.C.; Barik, A.K.; Ranjan, S. Illustration of demand response supported co-ordinated system performance evaluation of YSGA optimized dual stage PIFOD-(1+ PI) controller employed with wind-tidal-biodiesel based independent two-area interconnected microgrid system. IET Renew. Power Gener. 2020, 14, 1074–1086. [Google Scholar]
  23. Latif, A.; Hussain, S.M.S.; Das, D.C.; Ustun, T.S. Optimum Synthesis of a BOA optimized novel dual-stage PI-(1+ID) controller for frequency response of a microgrid. Energies 2020, 13, 3446. [Google Scholar]
  24. Latif, A.; Hussain, S.M.S.; Das, D.C.; Ustun, T.S. State-of-the-art of Controllers and Soft Computing Techniques for Regulated Load Frequency Management of Single/Multi-Area Traditional and Renewable Energy based Power Systems. Appl. Energy 2020, 266, 114858. [Google Scholar]
  25. Shivakumar, R.; Lakshmipathi, R. Implementation of an innovative bio inspired GA and PSO algorithm for controller design considering steam GT dynamics”. IJCSI Int. J. Comput. Sci. Issues 2010, 7, 18–28. [Google Scholar]
  26. Mirjalili, S. Salp Swarm Algorithm: A bio-inspired optimizer for engineering design problems. Adv. in Eng. Softw. 2017, 114, 163–191. [Google Scholar]
  27. Abd-Elazim, S.M.; Ali, E. Load frequency controller design of a two-area system composing of PV grid and thermal generator via firefly algorithm. Neural Comput. Appl. 2016, 30, 607–616. [Google Scholar] [CrossRef]
  28. Das, D.C.; Roy, A.; Sinha, N. GA based frequency controller for solar thermal–diesel–wind hybrid energy generation/energy storage system. Int. J. Electr. Power Energy Syst. 2012, 43, 262–279. [Google Scholar] [CrossRef]
  29. Latif, A.; Pramanik, A.; Das, D.C.; Hussain, I.; Ranjan, S. Plug in hybrid vehicle-wind-diesel autonomous hybrid power system: Frequency control using FA and CSA optimized controller. Int. J. Syst. Assur. Eng. Manag. 2018, 9, 1147–1158. [Google Scholar] [CrossRef]
  30. Charan, P.N.; Kumar, S.B.; Prasad, B.D.; Pranati, D.; Kumar, D.M. A novel application of ALO -based fractional order fuzzy PID controller for AGC of power system with diverse sources of generation. Int. J. Electr. Eng. 2019, 56, 1–23. [Google Scholar]
  31. Abdulbaset, E.H.; Dong, S.Z.; Meysam, K. A comparative study on recently-introduced nature-based global optimization methods in complex mechanical system design. Algorithms 2017, 10, 120. [Google Scholar]
  32. Mohsenian-Rad, A.-H.; Leon-Garcia, A. Optimal Residential Load Control with Price Prediction in Real-Time Electricity Pricing Environments. IEEE Trans. Smart Grid 2010, 1, 120–133. [Google Scholar] [CrossRef]
  33. Jay, D.; Swarup, K.S. Price based demand response of aggregated thermostatically controlled loads for load frequency control. In Proceedings of the National Power Systems Conference (NPSC), Varanasi, Uttar Pradesh, India, 12–14 December 2012. [Google Scholar]
Figure 1. Topology of the proposed microgrid ((a) the top) and the transfer function diagram of the proposed model ((b) the bottom).
Electronics 09 02209 g001
Figure 2. Flow diagram of the salp swarm algorithm (SSA).
Electronics 09 02209 g002
Figure 3. (a) Extractable power of the the wind turbine generator (WTG), solar thermal power system (STPS) and thermostatically controllable load. (b) Comparison of the frequency deviation, without and with price-based demand response (PBDR). The power extraction of (c) a diesel engine generator (DEG), (d) a fuel cell (FC) and (e) an aqua electrolyzer (AE) without and with PBDR is also shown.
Electronics 09 02209 g003aElectronics 09 02209 g003b
Figure 4. (a) Controllable thermostatic loads, without and with PBDR. (b) Change in electricity pricing, without and with PBDR.
Electronics 09 02209 g004
Figure 5. (a) Output power of the WTG, STPS and TCL. (b) GA- vs. SSA-optimized comparative frequency deviation with PBDR. (ce) Comparative output power of the DEG, FC and AE with PBDR.
Electronics 09 02209 g005
Figure 6. (a) Controllable thermostatic loads with PBDR. (b) Change in electricity pricing with the change in frequency, GA- vs. SSA-optimized with PBDR.
Electronics 09 02209 g006
Table 1. Proposed hybrid energy model parameters [2].
Generating UnitsGainsConstant Values (s)
ORC-STPSKs = 1.8
KT = 1
TS = 1.8
TT = 0.3
DEGKDG = 1/300TDG = 2
FCKFC = 1/100TFC = 4
AEKAE = −1/500TAE = 0.5
WTGKWTG = 1TWTG = 1.5
Table 2. Considered parameters of the SSA and GA.
DescriptionValue
Number of Salp population20
Maximum number of iterations100
Number of search agents20
Probability of crossover0.8
Probability of mutation0.01
Maximum number of iterations100
Table 3. Different simulated cases studies.
CaseSubcomponentsResponse Time (s)Operating Conditions
1.WTG, ORC low-temperature STPS, DEG, FC, AE and Load120 sPWTG = 0.5 p.u at 0 < t < 80 s
= 0.3 p.u at t > 80 s
PSTPS = 0.2 p.u at 0 < t < 40 s
= 0.4 p.u at t > 40 s
Pl = 0.8 p.u at 0 < t < 40 s
= 1.1 p.u at 40 s < t < 90 s
= 0.95 p.u at t > 90 s
2.WTG, ORC low-temperature STPS, DEG, FC, AE and Load12 sConcurrent random changes in WTG, ORC-STPS and Load
Table 4. PI and PID controller gains for Case 1.
Controller Gain
Case 1
GA Values
Without PBDRWith PBDR
PI Controllers
KpDEG1.4501.690
KiDEG1.03331.31401
KpFC−1.280−1.1634
KiFC−1.380−1.650
KpAE−1.0084−1.482
KiAE−1.2177−1.5316
KpLOAD01.980
KiLOAD01.490
PID Controllers
KpDEG1.4501.690
KiDEG1.2301.850
KdDEG0.4900.490
KpFC−0.970−1.150
KiFC−1.380−1.650
KdFC−0.72196−0.7271
KpAE−0.99567−1.250
KiAE−1.06374−1.375
KdAE−0.750−0.750
KpLOAD01.980
KiLOAD01.2665
KdLOAD00.650
Table 5. GA- and SSA-optimized controller gain values for Case 2.
Controller Gain
Case 2
With PBDR
GA-OptimizedSSA-Optimized
PI Controllers
KpDEG1.9801.9558
KiDEG1.76901.5255
KpFC−1.270−1.4183
KiFC−1.950−1.9325
KpAE−1.3801−1.6188
KiAE−1.325−1.4049
KpLOAD2.1001.7953
KiLOAD1.569481.6175
PID Controllers
KpDEG1.9801.7348
KiDEG1.8501.6828
KdDEG0.4900.5263
KpFC−1.270−1.4189
KiFC−1.950−1.906
KdFC−0.725−0.6976
KpAE−1.350−1.6316
KiAE−1.478−1.5043
KdAE−0.750−0.6865
KpLOAD2.0311.9147
KiLOAD1.8601.5507
KdLOAD0.84730.8175
Publisher’s Note: MDPI stays neutral with regard to jurisdictional claims in published maps and institutional affiliations.

