1. Introduction
Recent years have witnessed the expansion of Internet of things (IoTs) applications into healthcare services, mining, transportation, and many other industrial areas [
1,
2]. Many studies have focused on IoT applications. For example, Hina Magsi et al. combined 5G technology with the IoT and used it to improve the quality and efficiency of wearable healthcare devices [
3]. Ali H. S. et al. proposed a joint transmission power control and duty-cycle approach for body sensor networks (BSNs) to achieve energy saving [
4]. Moreover, to improve time efficiency and achieve a trade-off between medical data security and resource consumption of sensor nodes in wireless body sensor networks (WBSNs), a biometric random binary sequence (RBS) generation technique was implemented on the basis of inter-pulse intervals of heartbeats [
5]. However, compared with traditional wireless systems, wireless communication for IoT applications has stringent performance requirements. The media access control (MAC) protocol is the key to successful data collection with low energy consumption. Carrier-sense multiple access with collision avoidance (CSMA/CA) is the most widely used protocol in wireless networks such as wireless local area networks (WLANs), wireless sensor networks (WSNs), and ad hoc networks. Although certain technologies, such as restricted access window, are used to mitigate the hidden node problem in 802.11ah [
6], large outdoor networks in IoT applications create additional hidden nodes because the path loss between stations is greater than that between a station and an access point (AP). The polling-based scheduling MAC protocol is regarded as an effective alternative to CSMA, as it can ensure fair and collision-free data forwarding from all nodes and thus reduce energy loss [
7]. The AP schedules stations by using a polling protocol such as centralized Time division multiple access (TDMA). Further, it maintains a polling list to determine which stations are eligible to access the network, so that it can provide high-quality services [
8].
Although numerous studies have investigated the centralized control IoT MAC protocol, such as PCF (Point Coordination Function), HCCA (Hybrid Coordination Function Controlled Channel Access) [
9], only a few literatures have investigated analytical methods for accurate evaluation of the network performance. A number of polling models are employed to exclusively calculate the performance imposed by the centralized MAC protocols [
10], but these models seldom take the resource occupied by the downlink data into account, i.e., there is no downlink queue at the sever-side, which is inconsistent with the actual scenario. Therefore, it is in strong demand to investigate the performance of polling models with bidirectional queues.
Based on the classical gated polling model, we propose a theoretical model for the hybrid service bidirectional polling (HBPOLL) access protocol, that involves separate uplink and downlink data access processes with a power management scheme. For accurate analysis of the delay, throughput, and energy efficiency performance of this protocol, an equivalent two-queue polling system is used to simplify the analytical process, and a Markov chain and generating function method is used to derive a closed-form expression of the mean access delay for the uplink and downlink data.
Nearly all of the previously studied polling models focused on single-directional communication and they rarely involved downlink transmission. Therefore, compared with previous studies, our study has two main distinguishing aspects. First, the HBPOLL MAC protocol, a polling-based MAC protocol, is specifically designed for a half-duplex access network. It is more consistent with actual communication and shows better performance in terms of energy saving compared to the classical cycle-duty polling pattern in IEEE 802.11. Second, we use a Markov chain and generating function to derive the closed-form expression of the mean access delay for data links.
The designs and implementation of HBPOLL are guided by the following objectives:
Unbalance bidirectional outdoor transmission: Large outdoor networks in IoT applications create additional hidden nodes. Thus, a centralized scheduling MAC protocol is required in the network.
Energy consumption saving: There are numerous nodes in the IoT. Energy consumption due to idle listening in the polling-based MAC protocol will increase with the network scale. An energy saving mechanism should be implemented.
Theoretical analyses: A scalable and general theoretical analysis model is required to develop a mechanism for rapid network performance assessment.
The primary contributions of this study are as follows:
Proposal of a hybrid service bidirectional MAC based on a polling mechanism with low power consumption.
Modeling of a bidirectional data access network as a two-queue asymmetric polling system for packet queuing formulation.
Modeling of uplink and downlink data flow as two M/G/1 queues with gated service.
Use of a Markov chain and generating function to derive the closed-form expression of the mean access delay for the data links in both directions.
Validation of the proposed mechanism and analysis model via simulation.
2. Related work
Polling-based MAC protocols have attracted considerable attention in recent years. Dawson et al. extended the adaptive polling access control mechanism to optical wireless networks (OWNs), which are visible-light communication (VLC) networks [
11]. To overcome the problems of poor scalability and large overhead under low traffic load, many studies have investigated the application and analysis of the polling system as well as optimization of the system model from the perspectives of arrival process, service strategy, and query path [
12,
13,
14,
15,
16,
17]. Yuichi et al. used a genetic algorithm to control the transmission time of all polling-based communication in IoT applications [
18]. Further, a localized polling (LocP) protocol was proposed [
19] to collect information from a desired subset of interrogated tags in large-scale radio-frequency identification (RFID) systems. Among the extensive literature available on the IoT MAC protocol, only a few studies have investigated analytical methods for accurately evaluating the network performance. Fan et al. derived an analytical model to evaluate the throughput of the IEEE 802.11 distributed coordination function (DCF) in a simulcast radio over fiber—distributed antenna system (RoF-DAS) with fiber links of different lengths [
20]. However, in terms of the polling-based MAC protocol, most of these studies have only provided approximations or focused on pseudo-conservation laws [
21,
22,
23].
Most mathematical analysis methods for polling models are tedious and complex. Li et al. used the classic M/G/1 vacation model to analyze the delay performance of the point coordination function (PCF) in a straightforward forward manner [
24]; however, it is restricted to polling systems with limit-1 service. Hongwei et al. implemented a multiple priority polling model and implemented it using a field-programmable gate array (FPGA) [
10]. For most existing analysis models, consumption of the system resources on the server side and its impact on system performance have not attracted much attention, and the service process of the server queue has not been discussed extensively. However, in applications such as environment and health monitoring, actual networks have both uplink and downlink data communication, and the channel resources will be consumed in the process of bidirectional data transmission. Therefore, the process of system modeling analysis for server queues corresponding to downlink data transmission should not be ignored. Yang et al. proposed a two-level polling service model consisting of a central queue (server queue) and N common queues to calculate the mean waiting time with the PCF mechanism [
25]; the server queue interrupts after each station queue during the contention-free period (CFP), thereby ensuring high priority of the server queue. As downlink transmission occurs during the total CFP, stations have to remain active to listen to the channel, which leads to high power consumption.
4. Mathematical Model
The arriving and transmission of data frame at both uplink queues and downlink queue are independent, and so we could seem the downlink data flow as an extra independent data queue follow the last uplink queue.
First, this protocol is modeled as an N+1 hybrid service polling system. However, it is difficult to calculate the second moment of an N-queue asymmetric polling model (queues has different parameters with each other), especially with hybrid service scheme. In order to get the close form expression of the mean delay, we should simplify this system. Then, the HBPOLL is equivalent to a two-queue polling system. At last, we derive the analytic expressions of the mean queue length at the polling epoch and the mean waiting for each queue by the Markov chain and generating function method.
4.1. HBPOLL Mathematical Model
A single-server polling system with N+1 queues is set up to model the upper access mechanism. Here, is a set of stations with an uplink buffer queue in each station, , and the AP has a downlink buffer queue . We use a Markov chain to analyze the queueing process in this system. The time axis is divided into time slots, and a random variable is defined to indicate the number of uplink data packets in when the AP polls the station at time . Further, the variable represents the number of downlink data packets in at time . Then, the state variable for the number of system queues at time is . After completes the data packet transmission according to the specified service mode, the AP polls at time , and the system state variable is . After sends the data packets according to the specified service policy, the AP begins to send the downlink data in its buffer at time . At this time, the system state variable is .
The system satisfies the following assumptions.
Data arrival process: In any time slot, the uplink data arrives at station i according to mutually independent Poisson processes, with a probability generating function , mean , and variance ; The downlink data also arrives at the AP according to mutually independent Poisson processes, with a probability generating function , mean , and variance ;
The service process needs to be restricted as follows. The service time for each uplink packet sent is subject to an independent uniform distribution, with a probability generating function , mean , and variance . The service time for sending a downlink data packet is also subject to an independent uniform distribution, with a probability generating function , mean , and variance .
Query conversion process: the inter-station query conversion times are independent of each other, with a probability generating function , mean , and variance .
STAi has traffic load , and the total system load is . When and , the system has symmetry. Then, .
4.2. Equivalent Analysis Model
To simplify the analysis process, we make the above-mentioned N+1 queue hybrid service polling control system equivalent to a two-queue gated service polling system. The station adopts a semi-gated service mode, i.e., the current CFP starting time is taken as the gated decision time of the uplink queue. Therefore, when the uplink queues
of the N stations are grouped into one total uplink queue
,
, at this time,
satisfies the gated service criterion, i.e., after accepting the query, only the data arriving before the
query time is sent. The data arriving in the current CFP will be sent in the next polling cycle, and the downlink queue
.
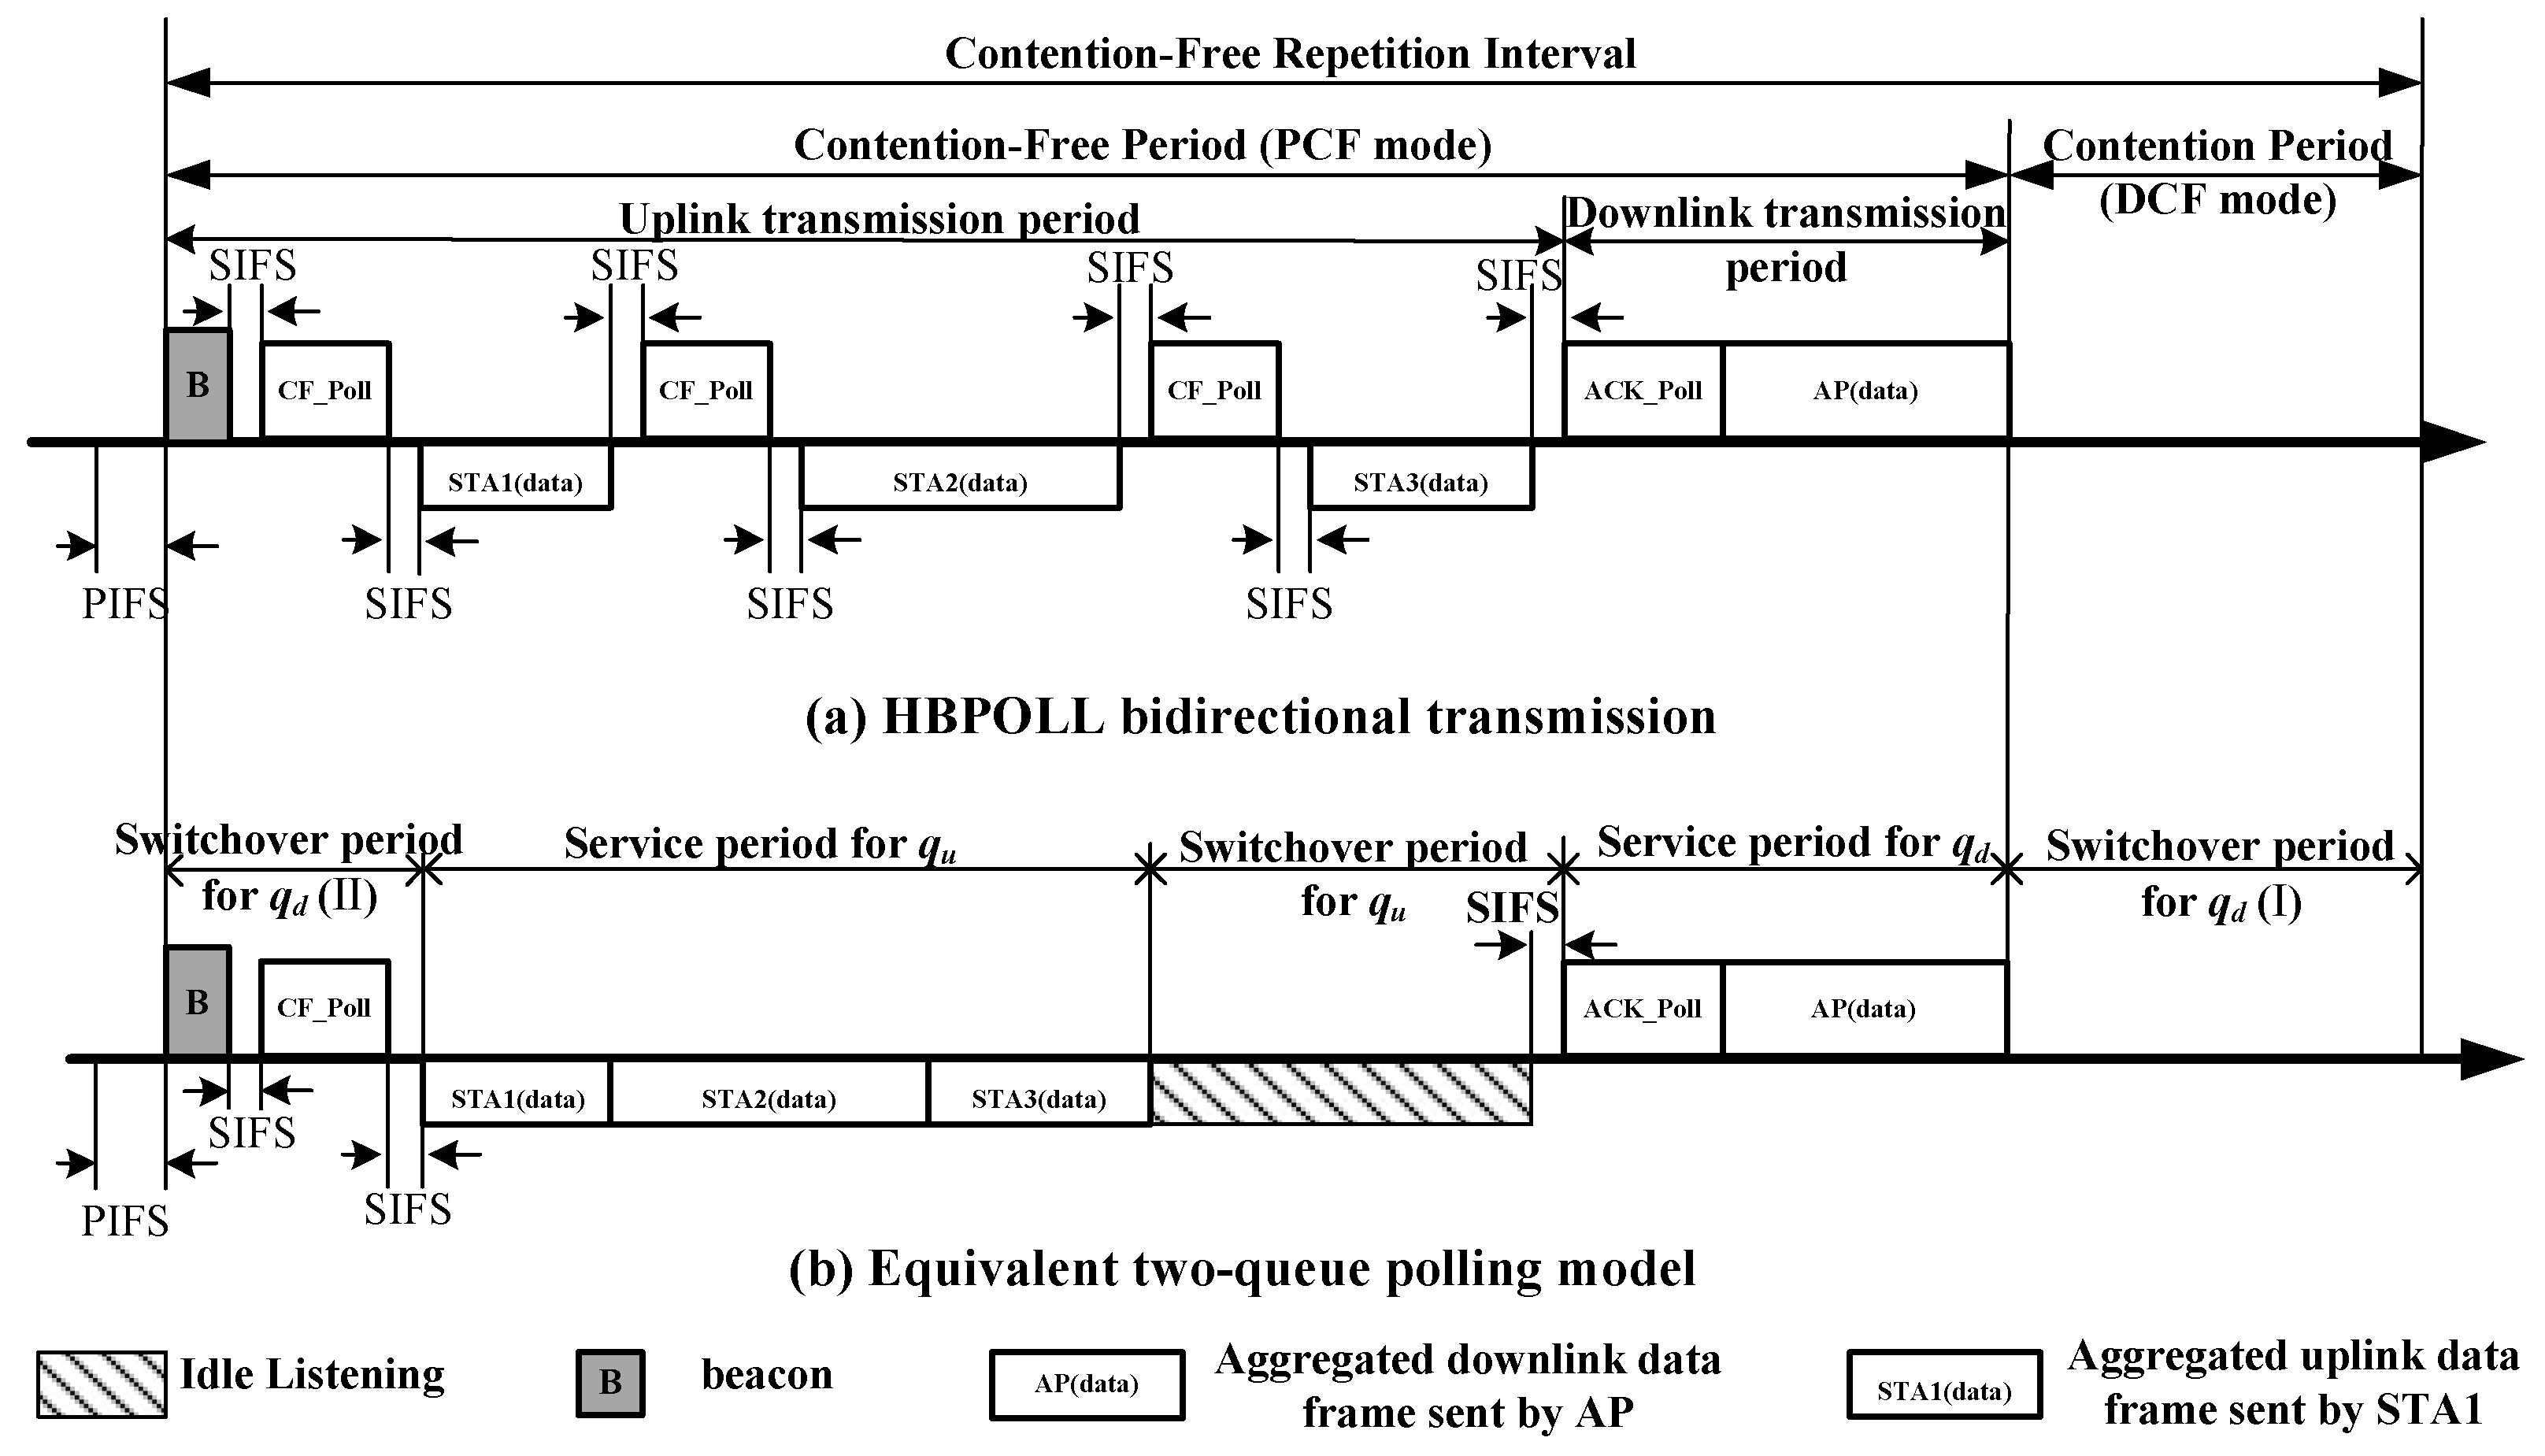
Figure 1 shows a schematic diagram with an example of bidirectional transmission in the PCF mode and an equivalent dual queue polling access mode when N = 3.
In summary, the N+1 queue hybrid service system is equivalent to a dual queue gated service system, and the random variable is defined to indicate the number of data packets in when the AP accesses at time . When represents the number of downlink data packets in at time , then the state variable of the number of system queues at time is {, }. After sends the data packet according to the gated service policy, the AP uses the gated service mode to start transmitting the downlink data at time . At this time, the system state variable is {,}. The system satisfies the following assumptions.
Data arrival process: The uplink data arrives at according to an independent Poisson process, with a probability generating function , mean , and variance . The downlink data also arrives at the AP according to an independent Poisson process, with a probability generating function , mean , and variance .
The service process satisfies the independent uniform distribution of the service time for uplink packets sent, with a probability generating function , mean , and variance . The downlink data service time is also subject to an independent uniform distribution, with a probabilistic generating function , mean , and variance .
The query conversion times between queues are independent of each other. The to conversion time has a probability generating function , mean , and variance . The to conversion time has a probability generating function , mean , and variance .
In homogeneous-traffic environments, each queue i has the same data arrival rate λi = λs = λ, and each data frame has the same transmission time βi = βs = β and same switchover time γi = γs = γ. The uplink parameters are reduced to , , and .
4.3. Probability Generating Function of System Queuing State at Query Time
According to the equivalent dual queue gated service polling system model described in
Section 4.2, the downlink queue starts to transmit data at time
. In our proposed Markov chain, considering the state transfer of the reliable system, we present the queue length at the polling epoch of
as follows:
where
represents the number of data packets arriving in the downlink queue
memory during the uplink queue
service process, and
represents the number of data packets arriving in the downlink queue
during the conversion process in which the uplink queue
completes transmission and the downlink queue
starts transmission.
The system is in a stable working state when the condition
G < 1 is satisfied [
26]. Then, the number of queuing data packets at each station in the system has steady state probability distributions
and
at the query time of the uplink and downlink queues, respectively.
According to the definition of the probability generating function, the system state probability generating function at the query time of the uplink queue is
Similarly, the system state probability generating function at the query time of the downlink queue is
Substituting the state variable relationship given by Equation (1) into Equation (4) gives
6. Simulation Experiments and Numerical Analysis
Based on the theoretical analysis presented above, the hybrid service bidirectional polling control access system is simulated and analyzed. We consider an ideal communication in MATLAB 2018a. In the simulation experiment, it is assumed that the channel is an ideal channel and all data packets are successfully transmitted. The duration of one time slot is 100 μs, and time is measured in slots. All the nodes transmit data at a rate of 36 Mbps. The uplink and downlink data packets are generated through a Poisson arrival process, and queued in an infinite buffer with rates of λ
i and λ
s (packet/slot) at the stations and server, respectively. The mean service times β
i and β
s (slot/packet) and mean switchover times γ
i and γ
s (slot) are normalized in the theoretical analysis, corresponding to the system parameters listed in
Table 1.
We investigate the impacts of different network configurations on the delay and power consumption in
Figure 3,
Figure 4,
Figure 5,
Figure 6,
Figure 7,
Figure 8 and
Figure 9 for a small network, e.g., N = 3. The theoretical curves are plotted by Equations (7) and (8) and Equations (18) and (19), respectively. We verify our theoretical analysis model in
Figure 3,
Figure 4 and
Figure 5. The default parameter values listed in
Table 1 are in accordance with IEEE 802.11n. According to the channel parameters listed in
Table 1, both the AP and each node take the normalized parameter settings listed in
Table 2.
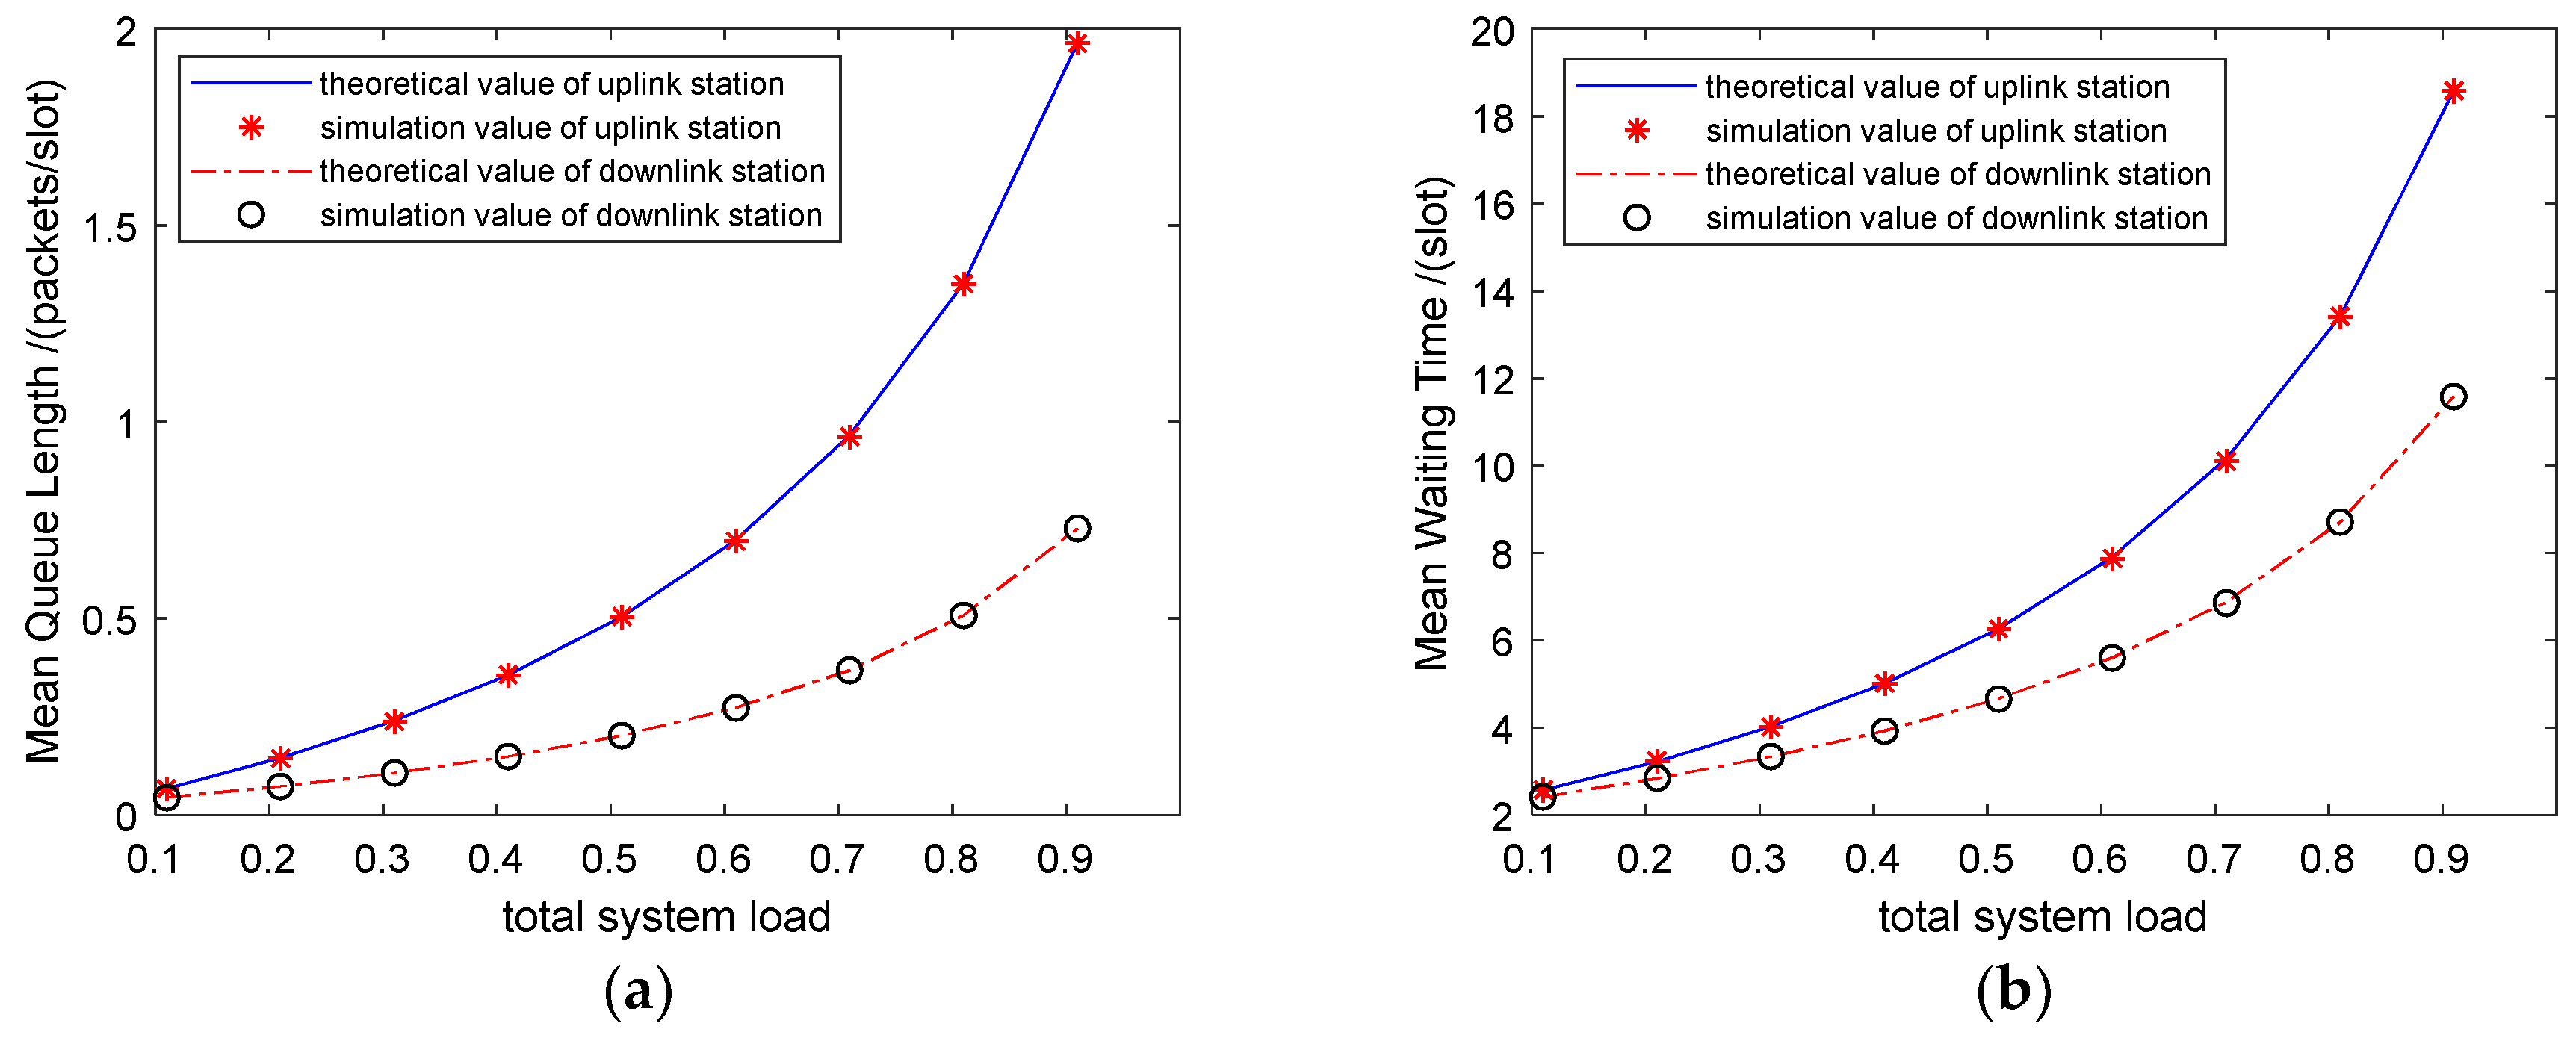
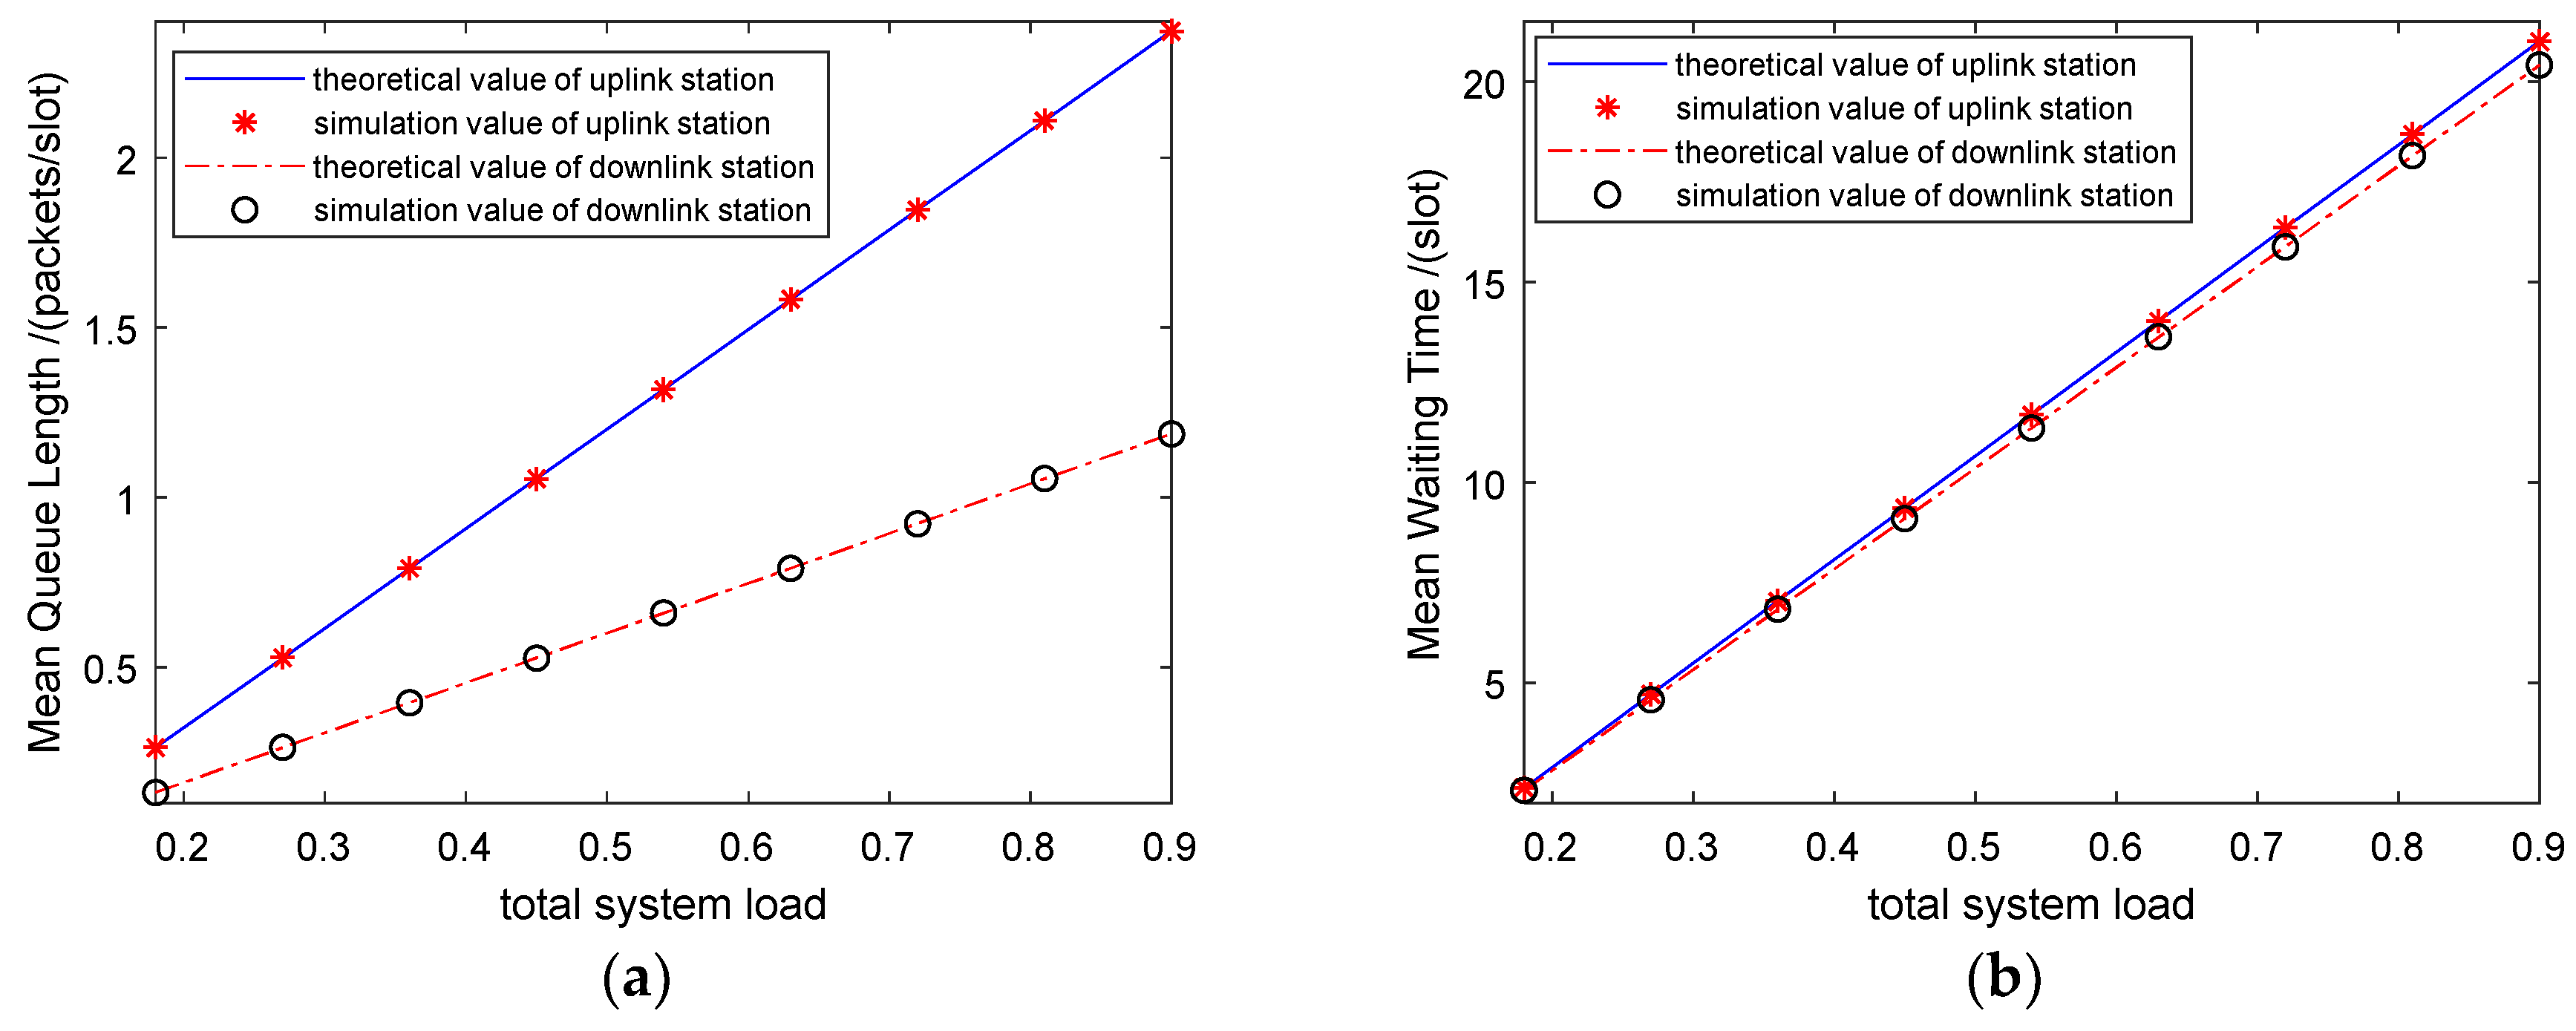
In the first experiment, we consider heterogeneous traffic, where the uplink and downlink queues have different data frame lengths and data frame arrival rates.
Figure 3 plots the mean queue length and the mean waiting time of both uplink and downlink data flows versus the data frame arrival rate. In this experiment, three nodes are polled by the AP, where nodes 1 to 3 transmit media data traffic and the AP transmits system control or emergency data traffic at the same rate of 36 Mbps. We use 1500 bytes of payload (a common payload size in IEEE 802.11n) for each uplink packet and 300 bytes of payload (network statement information, broadcast system information) for each downlink packet. The abscissa represents the increase in the traffic load from low levels to saturation. The good agreement between the theoretical curves and the corresponding simulation curves indicates that our theoretical results are highly accurate for heterogeneous traffic.
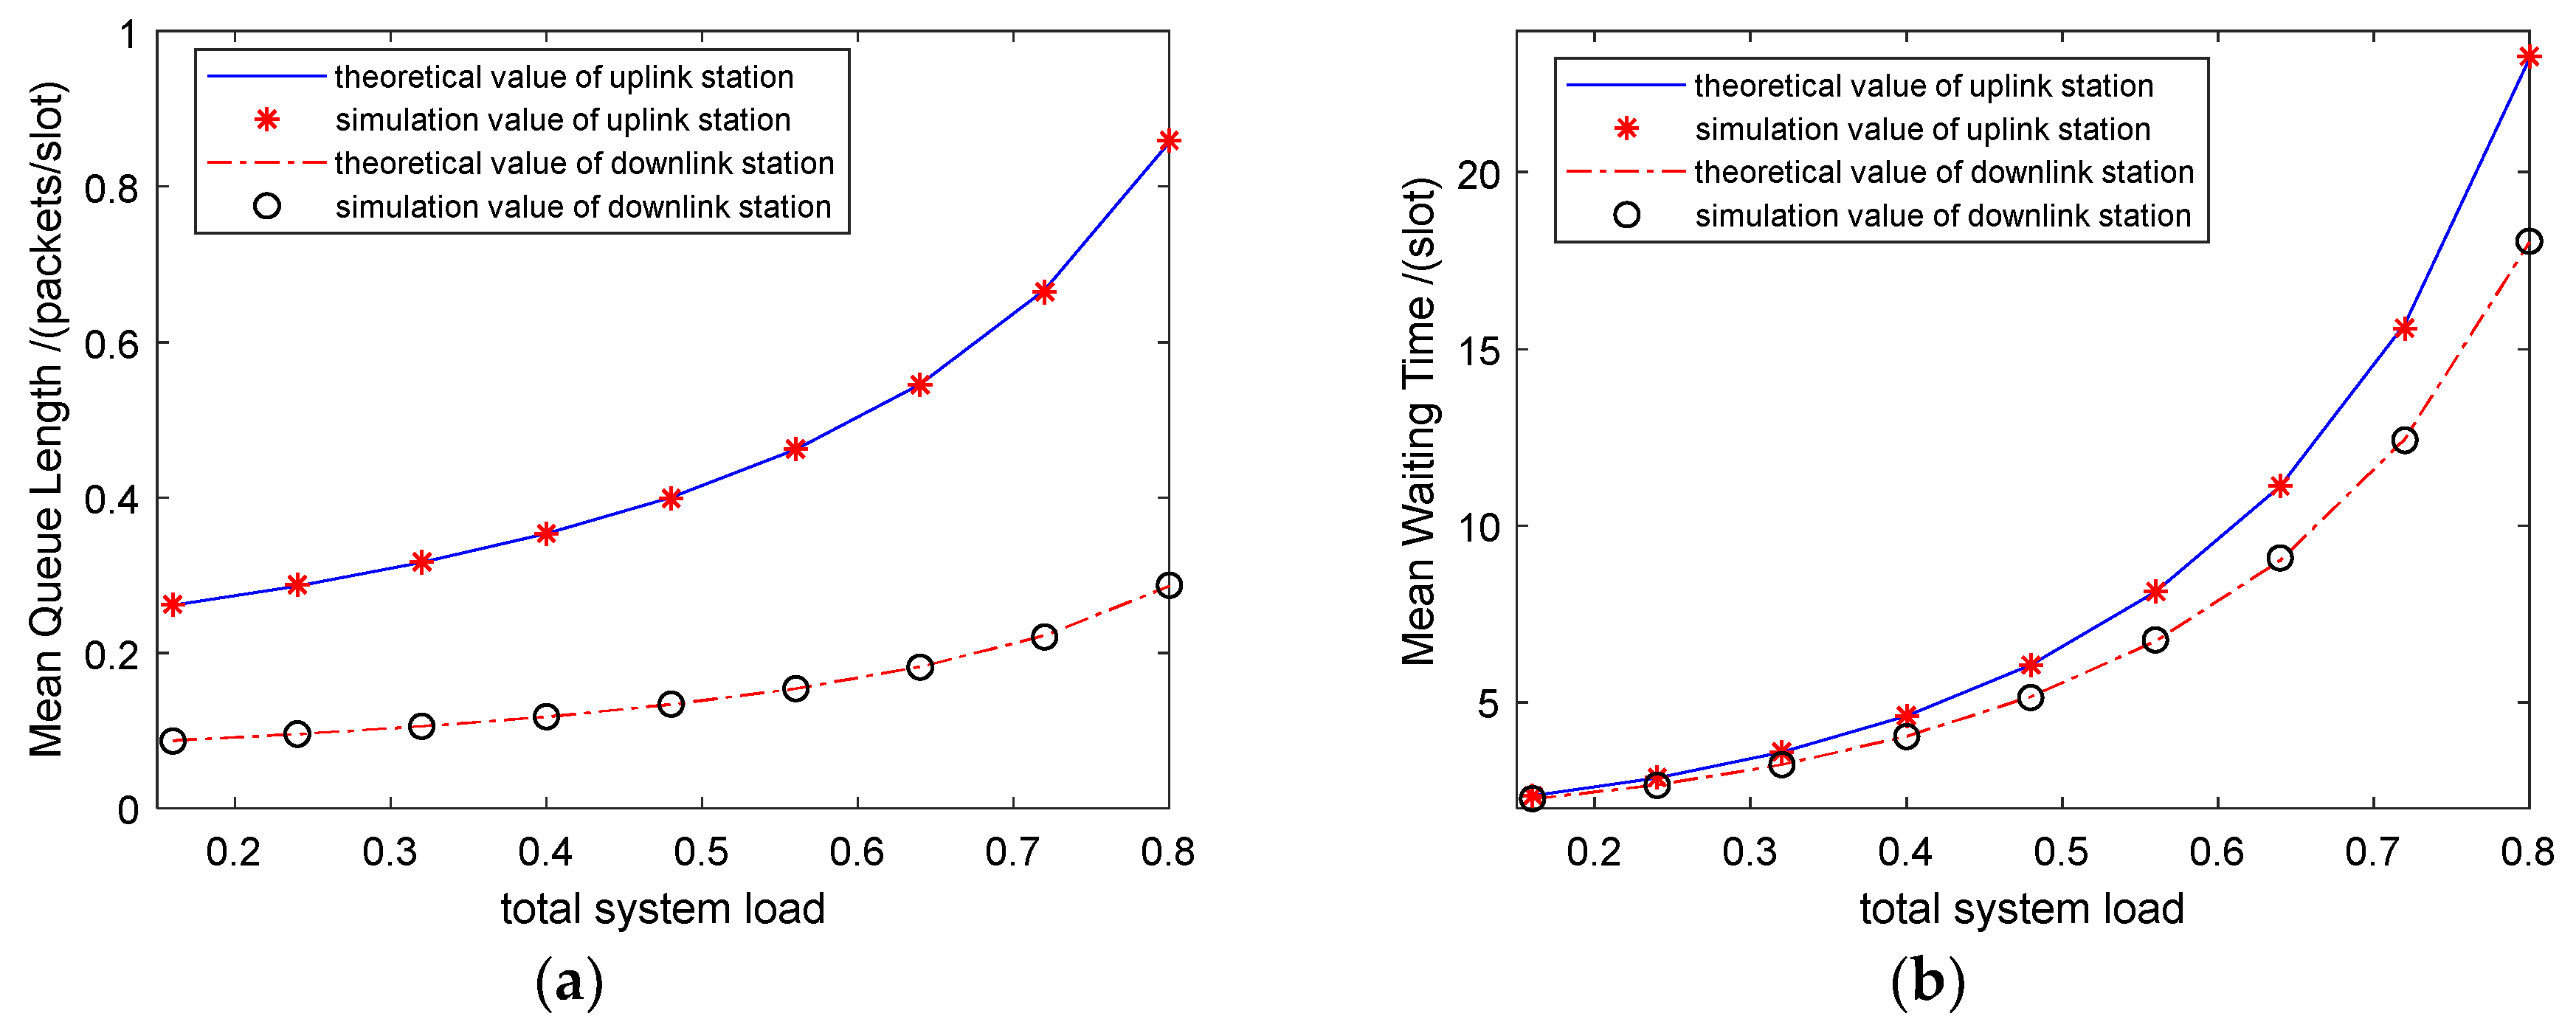
In the second experiment, we consider homogeneous traffic, where each node has the same data frame arrival rate.
Figure 4 plots the mean queue length and the mean waiting time of both uplink and downlink data flow versus the data frame length. As all the data frames transmit data at the same rate, we convert the increase in data frame length into the mean service time. The abscissa shows the increase in the traffic load with the service time. The curves are in good agreement with the simulation curves.
Figure 5 plots the mean queue length and the mean waiting time of both uplink and downlink data flow versus the switchover time.
In the third experiment, the stations and server generate homogeneous date traffic with the same packet length at the same rate. Both uplink and downlink payloads are added with the switchover time, which is related to the distance from the AP to the stations, ACK manner, etc., up to saturation. The theoretical calculations are consistent with the simulation results.
The aggregative data transmission in HBPOLL makes it possible for stations to sleep after they complete the uplink data transmission, and they can remain in the sleep state until the downlink begins to broadcast. The delay and energy consumption performance are compared against those of the two-level polling system proposed in Reference [
25], where the downlink queue is assigned a high priority to occupy the channel immediately after each uplink queue. The simulation and theoretical analysis parameters are identical, as shown in
Table 3.
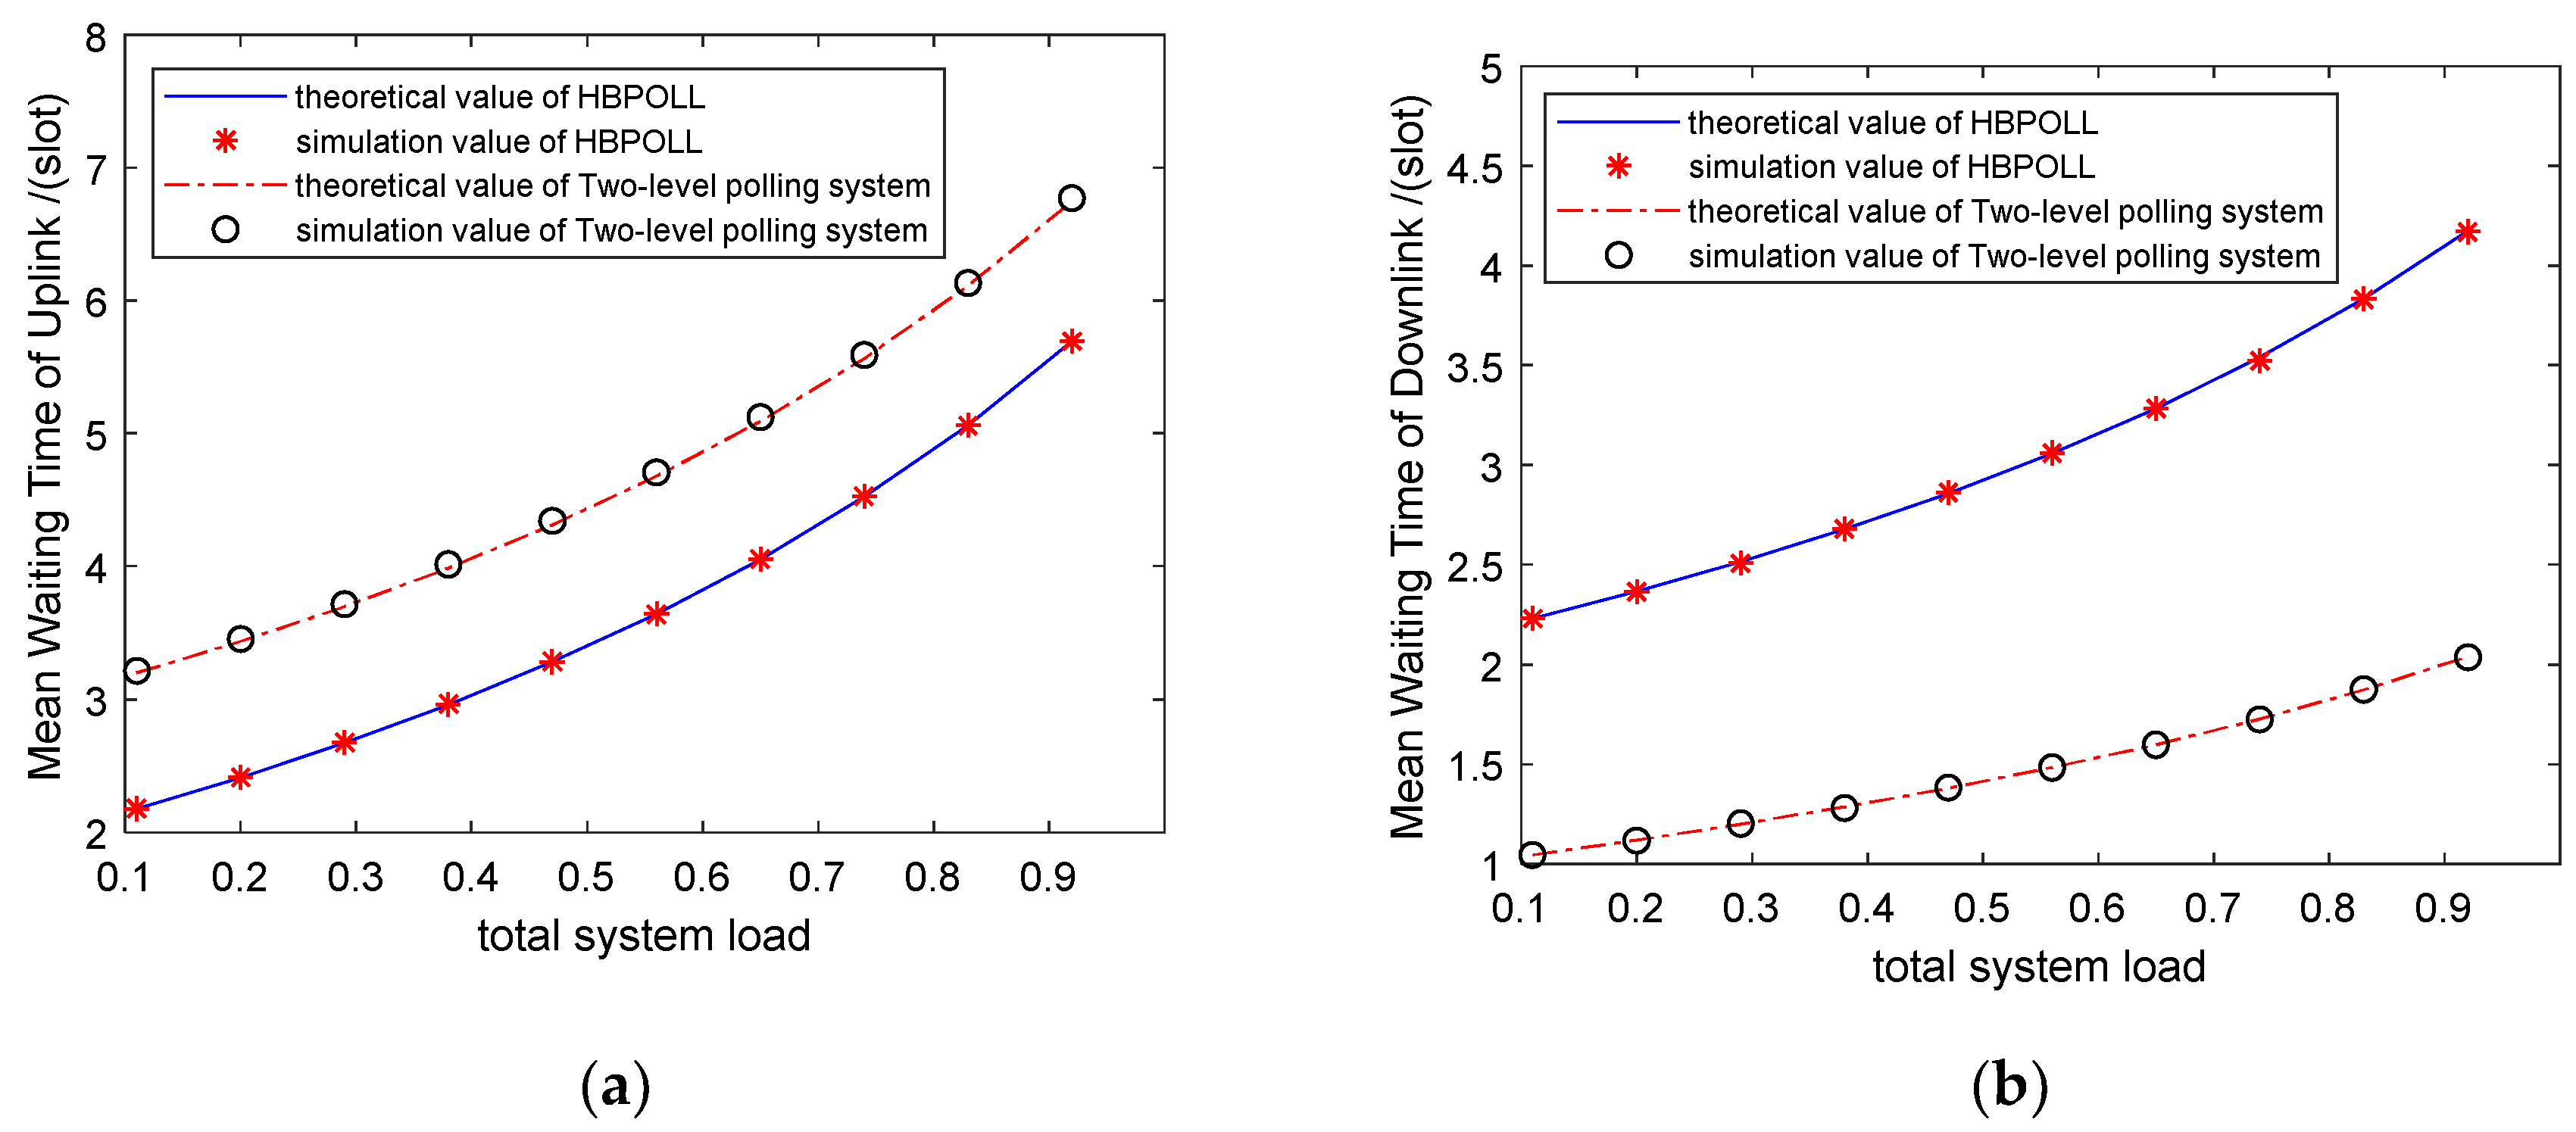
First, the mean waiting time for the uplink and downlink data frames are compared on the basis of the theoretical analysis results and simulation results. We evaluate the mean waiting time of uplink and downlink data frames using Equations (18) and (19) for HBPOLL, as well as the analytical expressions in Reference [
25].
Figure 6 shows the delay performance versus the data arrival rate in a small-scale network with three stations. The mean waiting time of the uplink queue in HBPOLL is shorter than that in the two-level polling service system, while mean waiting time of the downlink queue is longer.
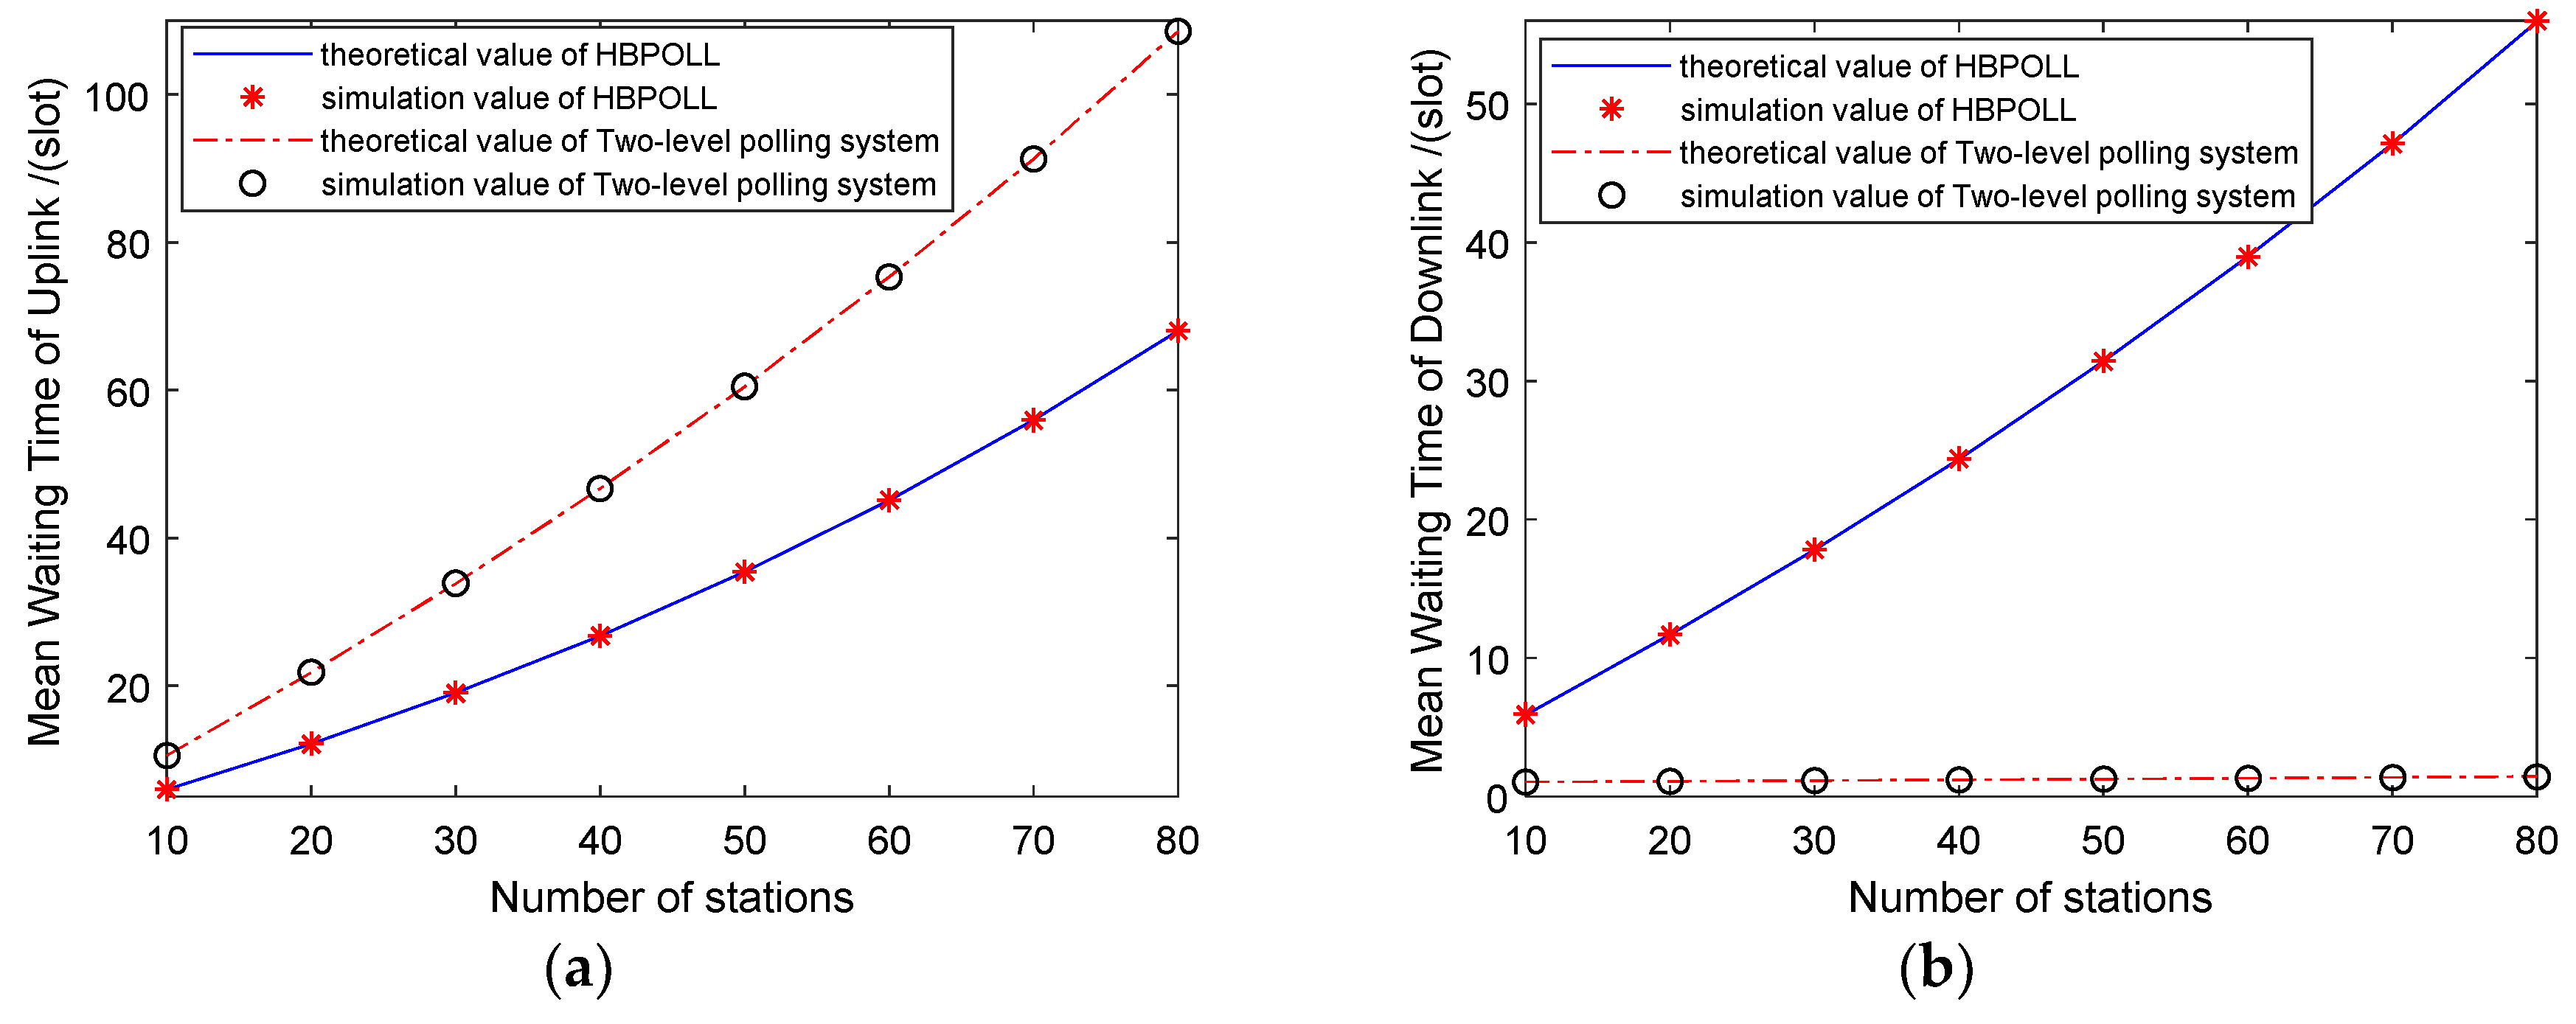
Figure 7 plots the delay performance versus the network scale. The mean waiting time between both curves increases with the number of stations, and HBPOLL outperforms the two-level polling service system in the uplink case, whereas the results are reversed in the downlink case. This is because, under HBPOLL, all the uplink packets to be serviced go to the downlink station; therefore, for HBPOLL, the number of data packets stored in the downlink queue is greater than that for the two-level polling system. As a result, the mean waiting time of the downlink is longer than that for the two-level polling system. Hence, HBPOLL is suitable for uplink delay-constrained applications, while it has some drawbacks in terms of downlink delay performance.
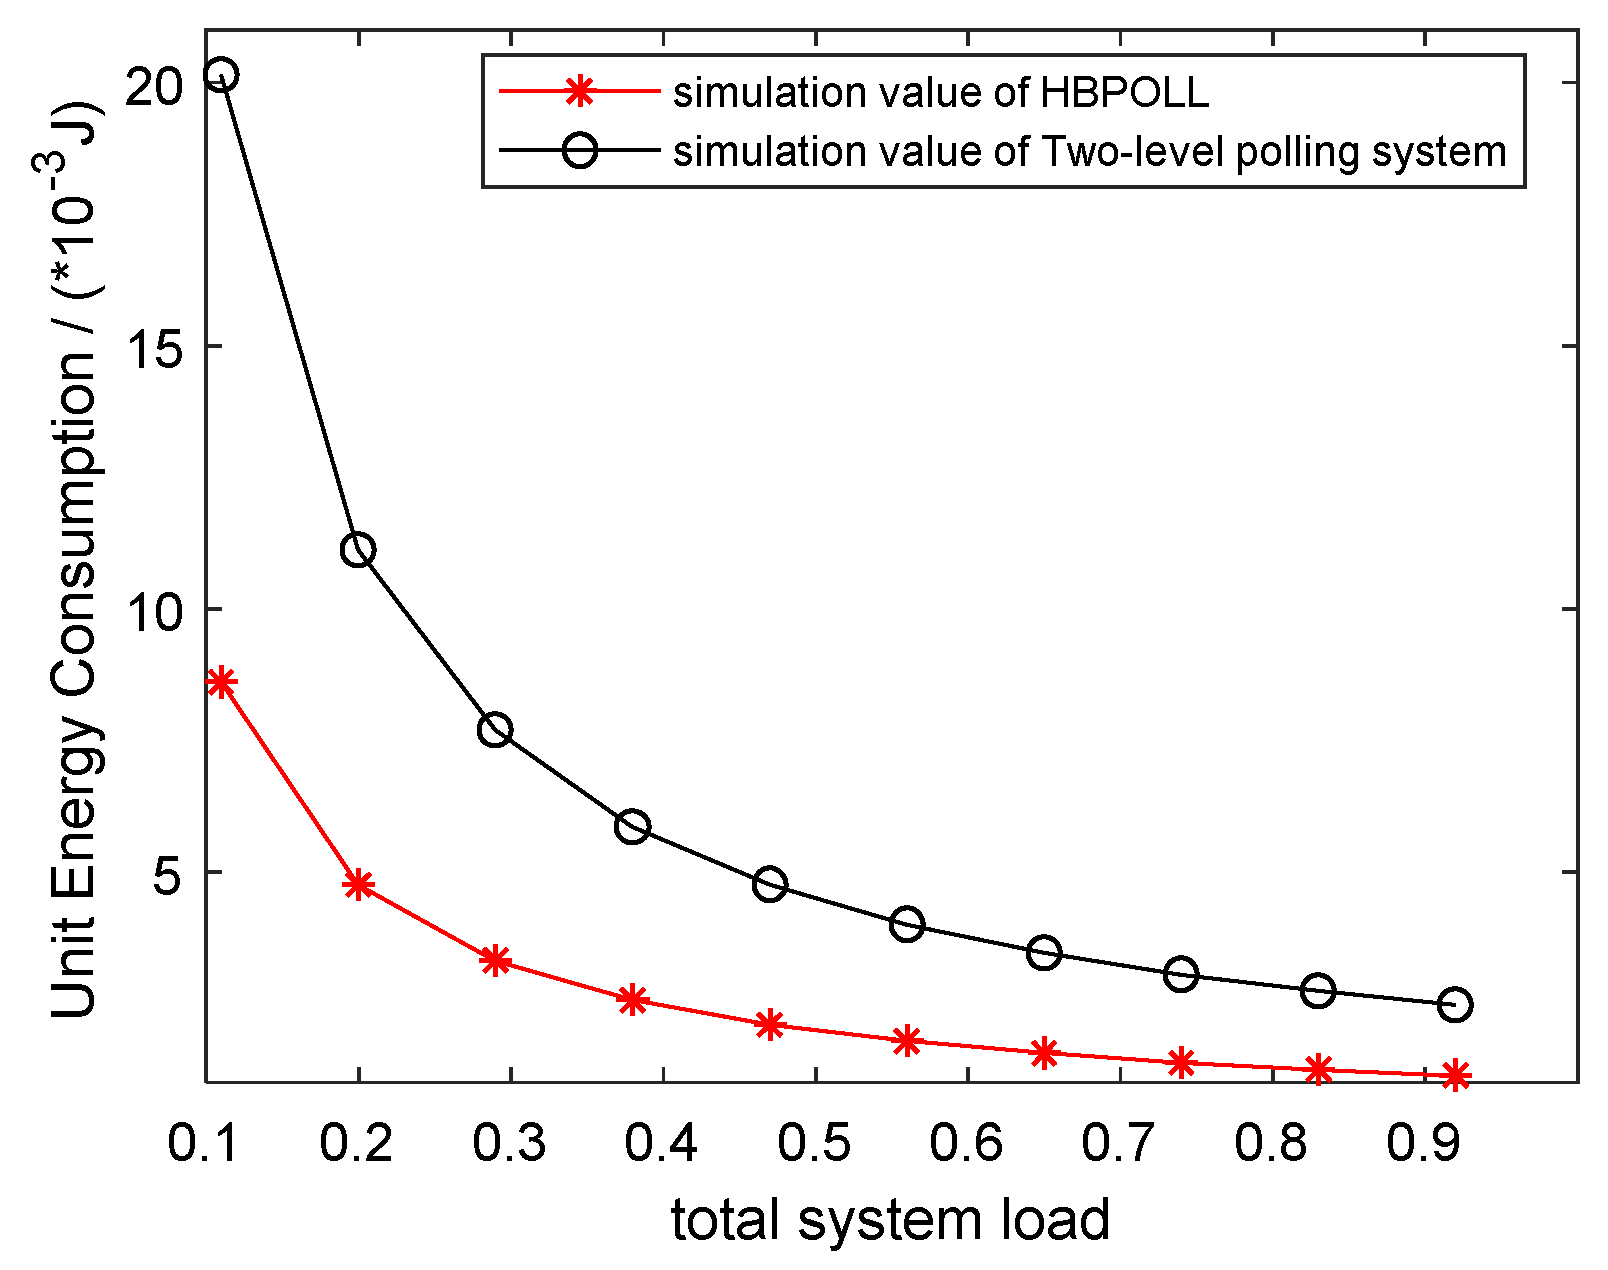
Then, the energy consumption performances are compared on the basis of the simulation results. As the energy performances have not been discussed in Reference [
25], the unit energy consumption is used to evaluate the energy efficiency, i.e., the ratio of the total energy consumption to the total number of data frames in one polling cycle. The energy consumption is calculated using Equation (21), whereas in Reference [
25], only
Et and
Er are considered as the stations keep listening to the channel during the entire transmission process.
Figure 8 compares the unit energy consumption of HBPOLL and the two-level polling service system. It shows that the unit energy consumption decreases with the arrival rate of the uplink station. The difference in unit energy consumption between the curves decreases with the arrival rate, down to 54% at an arrival rate of 1.4 (packet/slot), as fewer data packets are required for transmission.
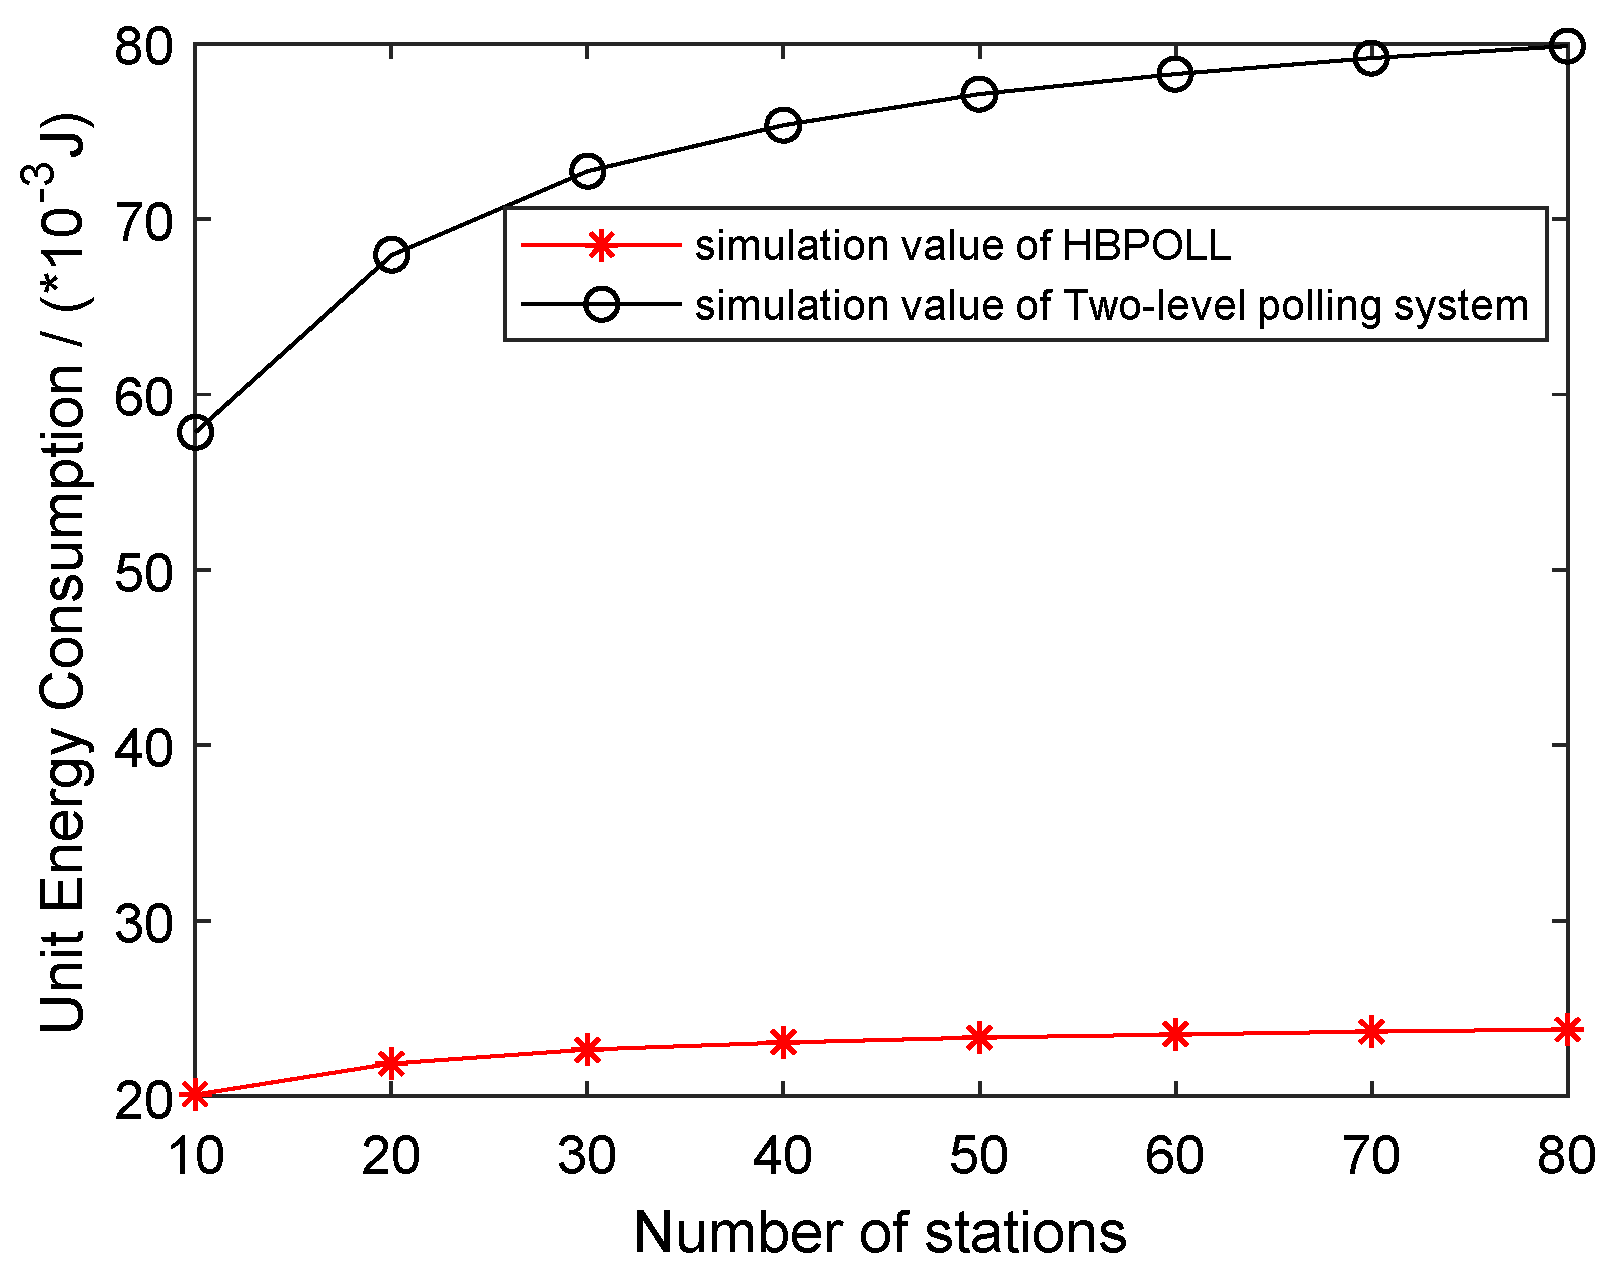
Figure 9 shows the unit energy consumption of the system for HBPOLL and a two-level polling system. The figure shows that the unit energy consumption increases with the number of stations and the proposed HBPOLL model can successfully reduce the unit energy consumption of the system, with an average reduction to 69%. The maximum reduction to 70% is recorded for the case of 80 stations.
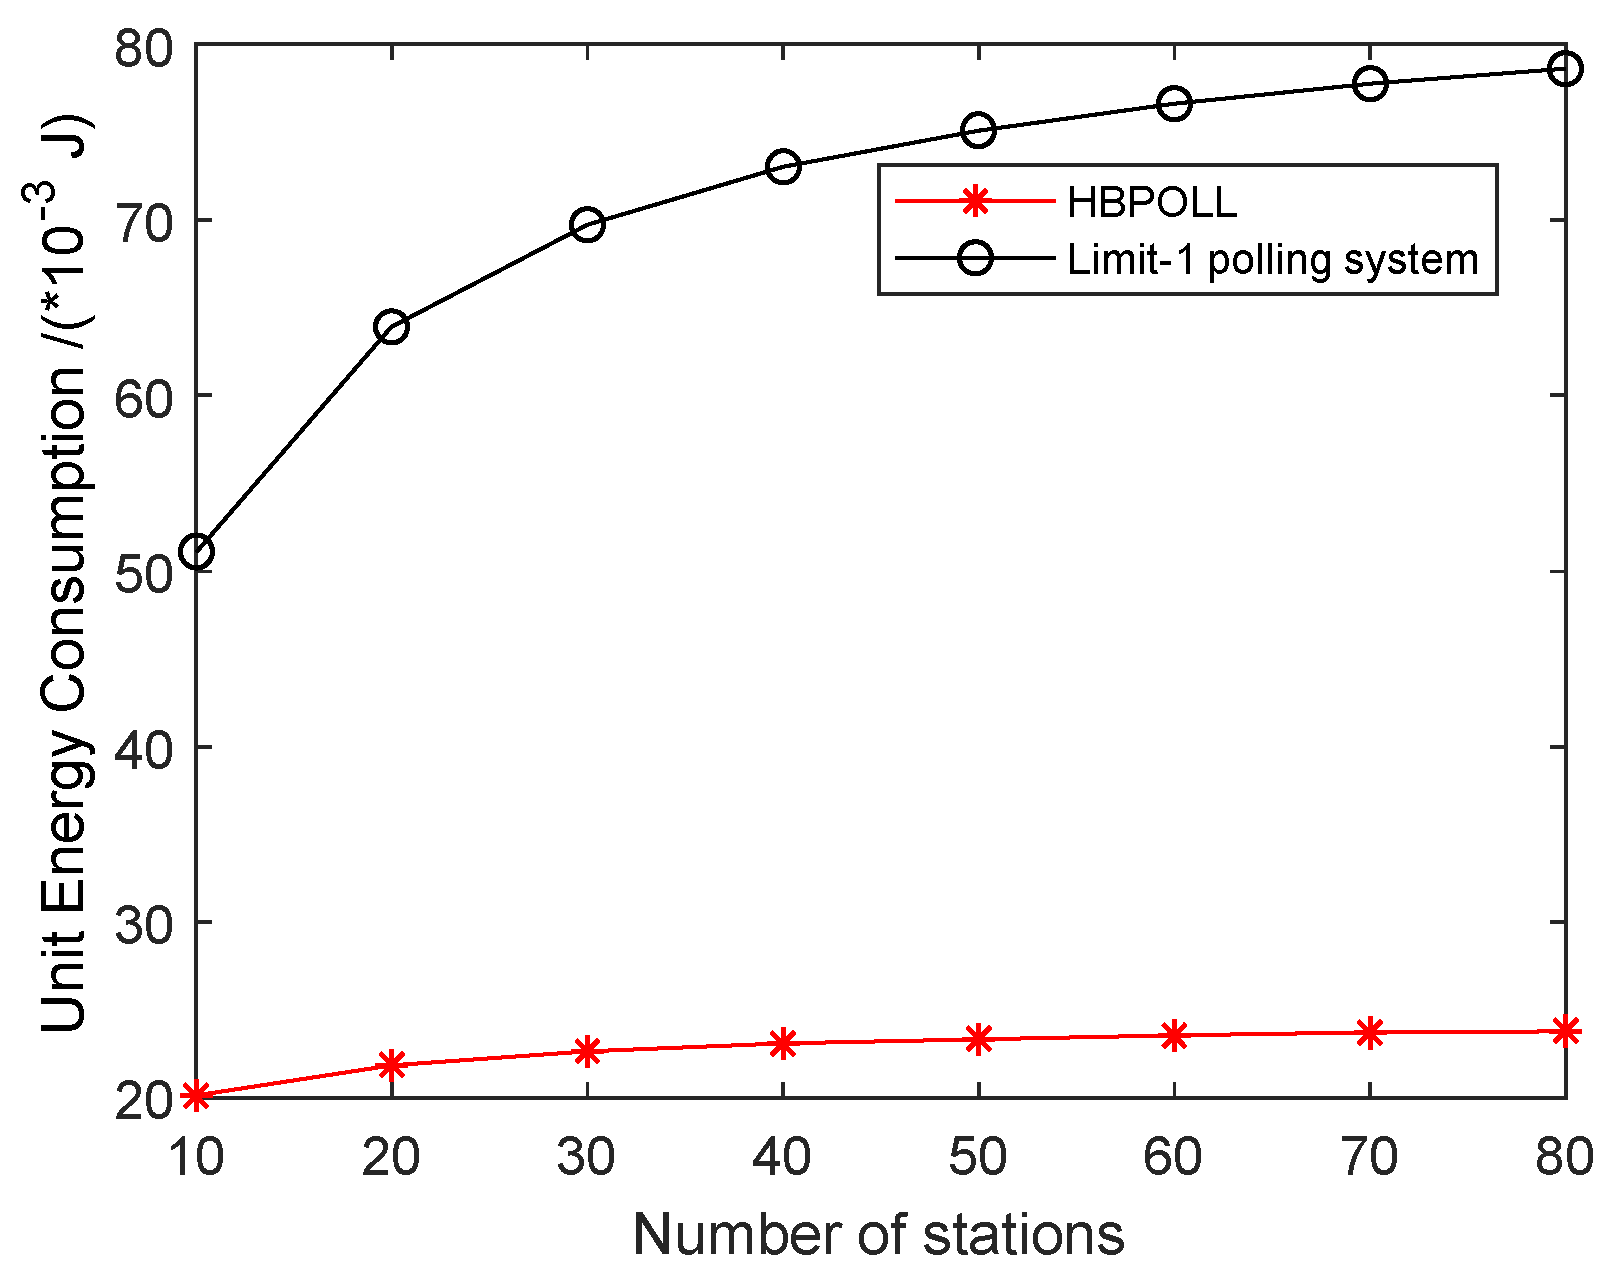
The limited-1 service mechanism is generally applied in IEEE 802.11a PCF channel access mechanism. Therefore, we also compare our method with the limit-1 polling system.
Table 4 summarizes the simulation parameters.
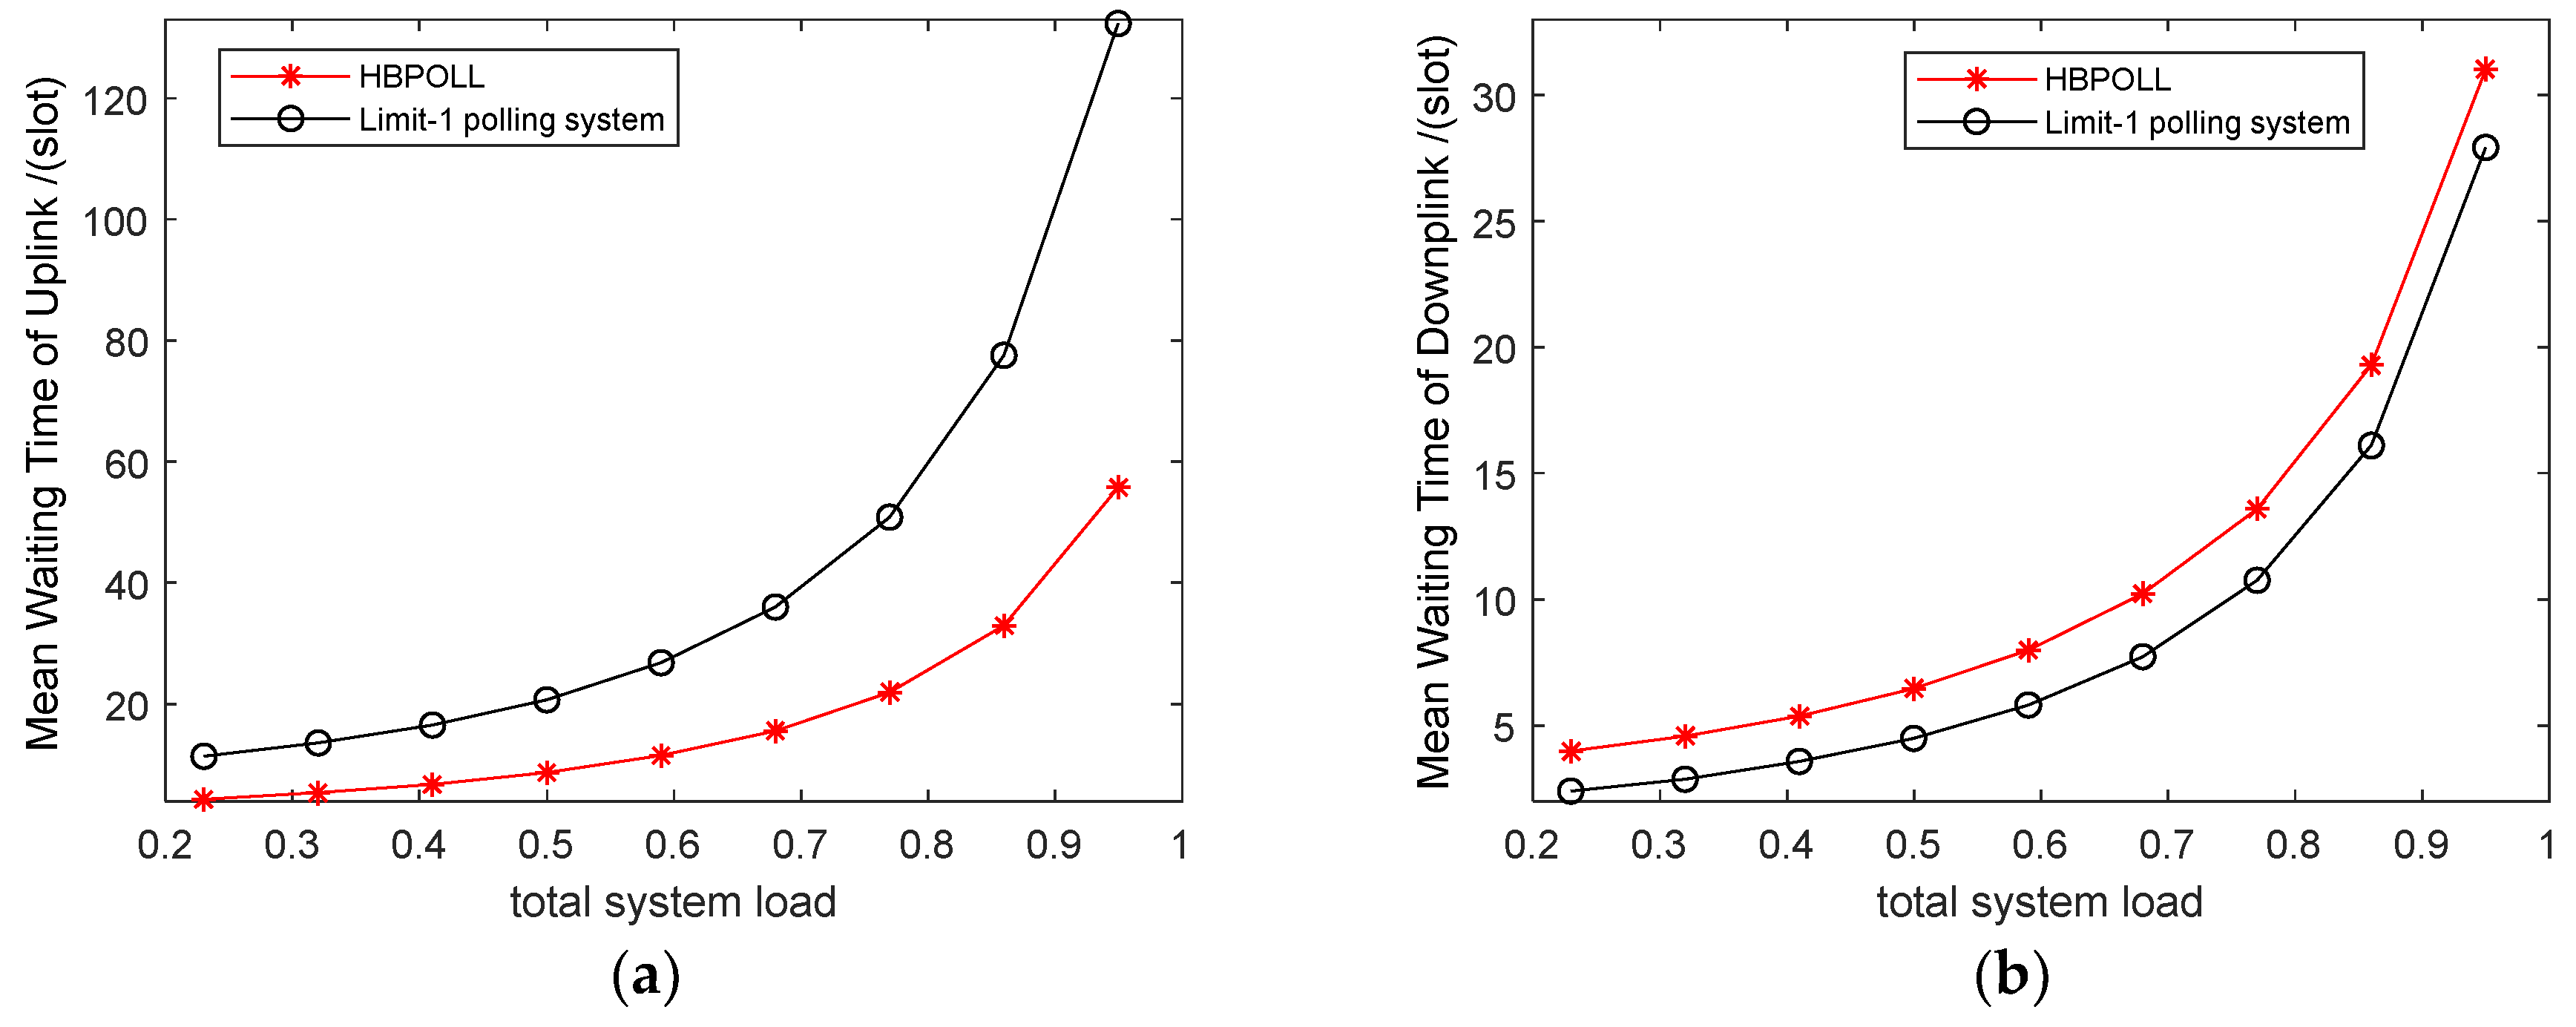
Figure 10 plots the delay performance versus the data frame service time in a small-scale network with three stations. Compared to the limit-1 polling system, HBPOLL can effectively reduce the mean waiting time of uplink data, with an average reduction to 58%, while the mean waiting time of the downlink queue is longer.
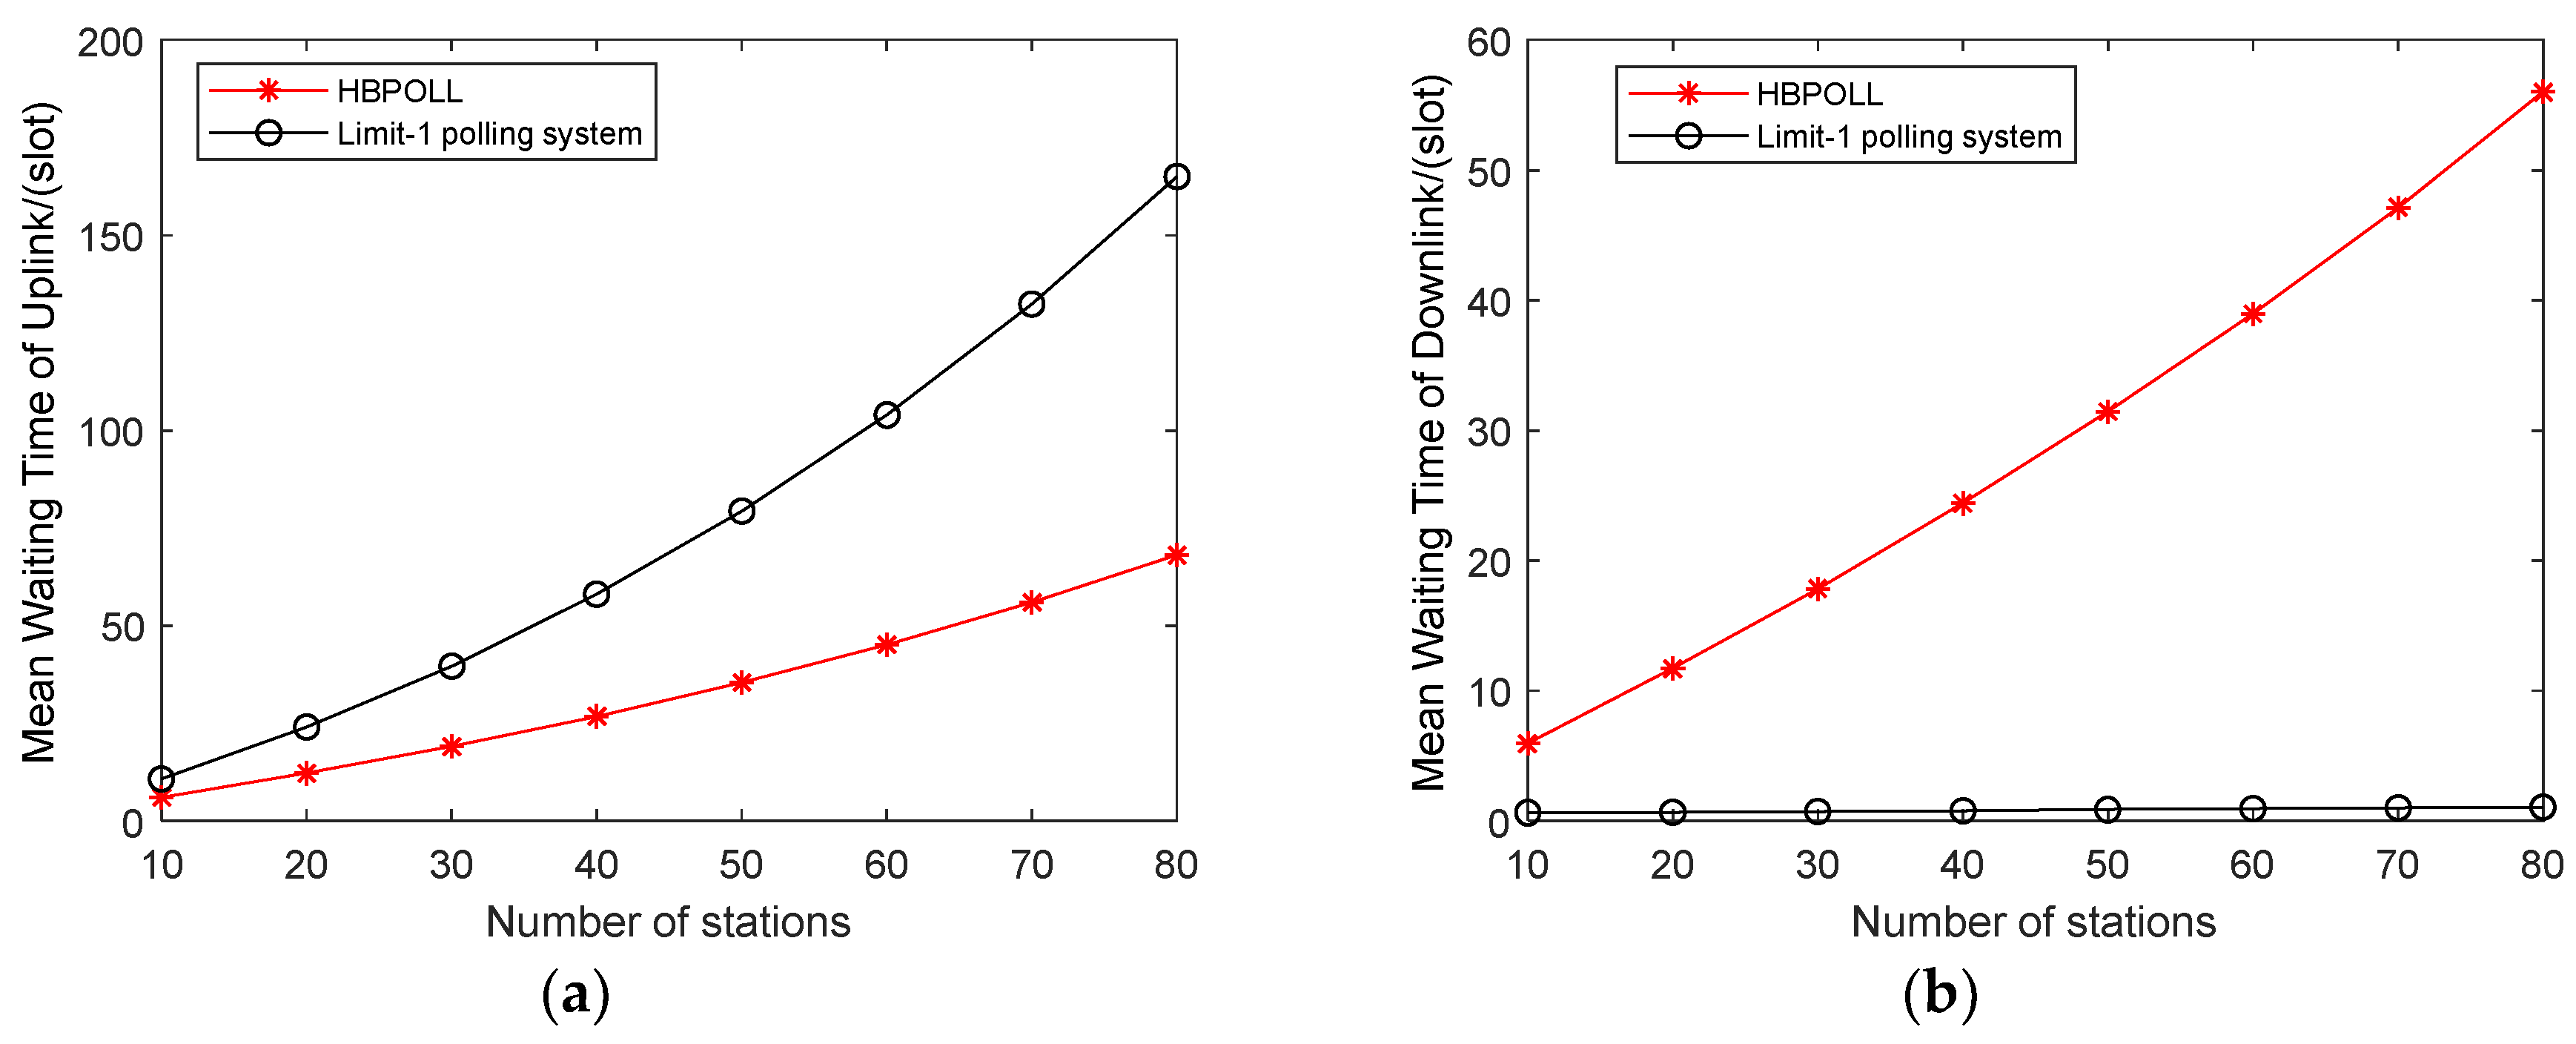
Figure 11 plots the delay performance versus the network scale. Obviously, HBPOLL outperforms the limit-1 polling system even in scenarios with heavy traffic conditions; it shows an average reduction to 56%, but the difference in downlink between both curves increases with the number of stations, as more time is required for data transmission.
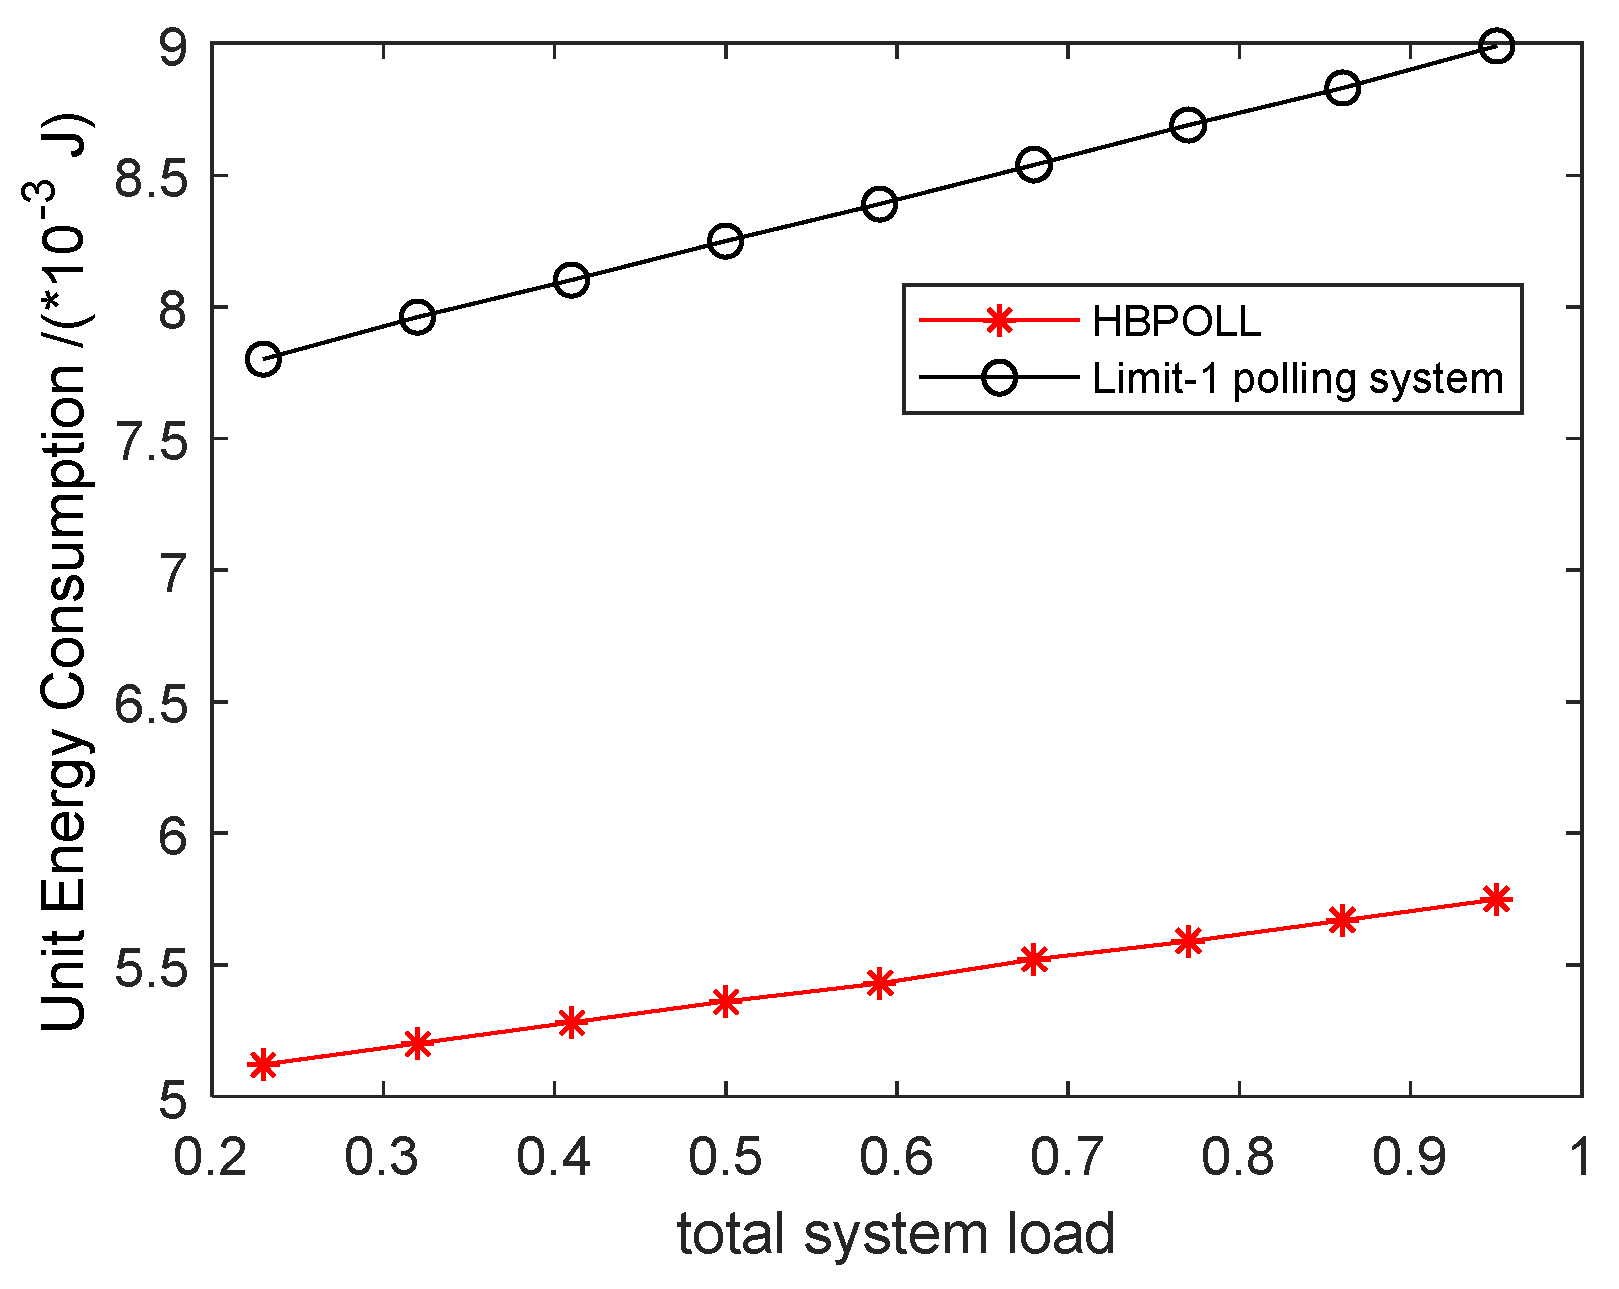
Figure 12 shows the unit energy consumption of the system for HBPOLL and the limit-1 polling system in a small-scale network with three stations. The unit energy consumption increases with the service time of uplink data, but it is significantly reduced for the HBPOLL model by an average of 35%.
Figure 13 shows the unit energy consumption of HBPOLL with respect to the limit-1 polling system. Intuitively, the unit energy consumption increases with the number of stations; however, although the unit energy consumption of HBPOLL increases, energy saving is also achieved. The average unit energy consumption is reduced to 68% and the maximum reduced to 70% for 80 stations.
7. Conclusions
This study proposed a hybrid service bidirectional polling model for half-duplex antenna communication. In this model, the server queue is added after all the station queues at the end of the polling cycle to realize bidirectional communication. The server queue is serviced in a gated scheme, while the station queues are serviced in a semi-gated scheme. These schemes are advantageous in terms of the stations’ energy savings, and they are suitable for uplink delay-constrained applications. Furthermore, by making HBPOLL equivalent to a two-queue polling system with a gated service scheme, this study discussed the uplink and downlink access performance separately in a contention-free period. The results can serve as a foundation for analyzing variants of the PCF-based full-duplex MAC protocol in future work.
Summarily, there are some aspects need to improve in the future. In service strategy: The improvement on the delay of uplink transmission and energy reduction on stations is at the cost of the downlink resource occupation. So, it is more suitable for the networks where the uplink traffic is heavier than the downlink, or the downlink service should be shared among stations. Future work should also focus on the fairness problem.
In theoretical analyses: We focus on the gated scheme under the ideal communication channel in the present analyses model. A future performance evaluation of the HBPOLL protocol will consider the general retrial to quantify its robustness against channel variations and its efficiency under different service scheme.


