Article

One Shot Crowd Counting with Deep Scale Adaptive Neural Network

1
School of Computer Science and Technology, Tianjin University, Tianjin 300072, China
2
College of Information Engineering, Dalian Ocean University, Dalian 116023, China
3
School of Information Science and Technology, Dalian Maritime University, Dalian 116023, China
*
Author to whom correspondence should be addressed.
Electronics 2019, 8(6), 701; https://doi.org/10.3390/electronics8060701
Submission received: 16 May 2019 / Revised: 18 June 2019 / Accepted: 19 June 2019 / Published: 21 June 2019
(This article belongs to the Section Artificial Intelligence)

Abstract

:
This paper aims to utilize the deep learning architecture to break through the limitations of camera perspective, image background, uneven crowd density distribution and pedestrian occlusion to estimate crowd density accurately. In this paper, we proposed a new neural network called Deep Scale-Adaptive Convolutional Neural Network (DSA-CNN), which can convert a single crowd image to density map for crowd counting directly. For a crowd image with any size and resolution, our algorithm can output the density map of the crowd image by end-to-end method and finally estimate the number of the crowd in the image. The proposed DSA-CNN consists of two parts: the seven layers CNN network structure and DSA modules. In order to ensure the proposed method is robust to camera perspective effect, DSA-CNN has adopted different sizes of filters in the network and combines them ingeniously. In order to reduce the depth of the data to increase the speed of training, the proposed method utilized 1 × 1 filter in DSA module. To validate the effectiveness of the proposed model, we conducted comparative experiments on four popular public datasets (ShanghiTech dataset, UCF_CC_50 dataset, WorldExpo’10 dataset and UCSD dataset). We compare the proposed method with other well-known algorithms on the MAE and MSE indicators, such as MCNN, Switching-CNN, CSRNet, CP-CNN and Cascaded-MTL. Experimental results show that the proposed method has excellent performance. In addition, we found that the proposed model is easily trained, which further increases the usability of the proposed model.

1. Introduction

With the increasing speed of urbanization in the world in recent years, people’s participation in sports events, commercial performances, holiday trips and other public activities has increased dramatically. When the crowd reaches a certain density, it is prone to crisis events such as fighting and stamping; thus, people pay more and more attention to the management of dense crowds. Furthermore, it is necessary for the public safety department to monitor the crowd density and take corresponding measures when the crowd density reaches a certain level. In other application scenarios, we may want to know the number of people watching football matches in the stadium or the number of people in the mall [1]. In the past, although most public places have installed a large number of video surveillance equipment, yet the main function of these devices is to record data, and cannot analyze and alarm the changes of the crowd. With the continuous development of computer vision technology and machine learning, estimating crowd density with images or videos has become a reality [2].
Crowd density estimation is to analyze of the number or density of the crowd in images or videos [3]. The main scenes can be tourist attractions, sports events or cultural performances (Figure 1). Before the rise of deep learning, people mainly used traditional image processing methods to calculate the number of people in the scene. However, these methods cannot be applied to the monitoring of the crowd because the effect of crowd density estimation is not satisfactory. Because the crowds are very dense in some scenarios, quick and accurate estimation of crowd density is impossible for traditional computer vision algorithms. With the continuous improvement of deep learning technology and hardware, crowd density estimation has made breakthrough progress in recent years. The deep learning technology makes it possible to estimate crowd density in many complex scenarios [4,5]. However, crowd density estimation still faces some serious challenges.
Crowd estimation is easily affected by the perspective effect of the camera; the feature vector will change as the distance between the camera and the target changes for the same target. In the same image, pedestrians are difficult to locate accurately because of the different scales caused by perspective distortion.
The scene is often extremely crowded. It is unavoidable for people to shield from each other because of the dense crowds. Many people are obscured and only the head is displayed.
Crowd density distribution is extremely uneven due to perspective effects, viewpoint changes and crowd density changes. This makes it difficult for us to measure crowd density with one scale. However, the information we can get from a single image is quite limited, thus, the crowd density is difficult to be estimated accurately.
To address the aforementioned concerns, we propose a novel crowd counting framework based on convolutional neural network (CNN). The core of our work is to present a concept of deep scale adaptive convolutional neural network (DSA-CNN). For different perspective view, we use different size of filters to extract density maps based on the characteristics of their perspective effect. The proposed framework can accurately extract crowd density and crowd counting in any image scale in a single image. Moreover, our DSA-CNN takes into account the different perspective areas in the same image. Generally speaking, the main contributions of our work are as follows.
1. The perspective effect of camera has a great influence on crowd density estimation. DSA-CNN is dedicated to estimate crowd density with a single image, thus, there is no more information to correct the perspective effect. In order to reduce the influence of perspective effect on results, different sizes of filters for perspective view is proposed in this paper. DSA-CNN set up different neural convolution networks in different sizes of filters. Without complex foreground segmentation, region of interest extraction or other complex operations, DSA-CNN can improve the effect of crowd estimation with minimal time complexity.
2. DSA-CNN uses different filters to perform convolution operations in order to adapt to different head sizes. However, it is obvious that the depth of the data will make the training difficult. To solve the problem, we introduce deep scale adaptive module to reduce the number of channels of data, which is inspired by the inception algorithm [6]. This structure not only helps to reduce the amount of calculation of parameters, but also helps to improve the discriminative power of feature.
3. We propose a novel end to end convolutional neural network structure that combines different data channel for density map. The proposed network structure can further enhance the adaptability of the algorithm through the DS module. Experiments on public data sets show that our proposed structure can achieve good performance.
The rest of the article is organized like this: The second part of this paper mainly introduces the existing algorithms and well known open datasets. The deep scale adaptive convolutional neural network for crowd counting (DSA-CNN) will be introduced in the third part. The fourth part of the article will list the configuration of the algorithm. The performance of the algorithm on the public dataset will be shown on the fifth part. The sixth part will make some summary of the article and look forward to the future work.

2. Related Work

2.1. Related Algorithm for Crowd Density Estimation

In view of the importance of crowd density estimation, many experts and scholars have proposed many methods to solve this problem. In general, there are three popular methods for estimating crowd density.
(1). Crowd density estimation based on foreground detection. In fact, foreground detection is the first method used to detect the number of people in an image. The idea of these methods is simple and sliding windows are often used to detect people in images [7]. Finally, the number of detected people in the image is accumulated and used to count the number of people in the image. Therefore, the research focuses on how to detect people in images. In general, there are two methods to detect people in an image based on foreground detection. One method is based on the detection of the whole body and the other method is based on the detection of part of the body [8,9,10]. These methods train some classifiers to detect people in the images by using features such as wavelets [11], HOGs [12] and edges [13] extracted from the body. The selection of features affects the performance of the classifier directly. It is obvious that these methods are suitable for images with sparse crowds. The performance of such methods would become poor if there is occlusion between people in the images. To solve this problem, some methods based on part of body detection are used to deal with crowd counting problems [14,15,16]. These methods no longer detect the entire body of a person, but detect parts of the body, such as the shoulders or heads. Compared with the whole-body based methods, these methods can solve the problem of occlusion between people partially, but it still performs poorly when it comes to counting dense crowds (Figure 2).
In fact, the methods above focus on the detection the foreground, which utilize the sliding windows to detect the people in the images. In general, the methods based on foreground detection are suitable for low density crowd. For high density crowd, the performance of the algorithms will decline sharply. Although people use part-based methods to solve this problem, the effects are still not satisfactory. Because the occlusion problem in the crowd is very common in high density crowd images, it is very difficult to detect people or part of the body. Therefore, the performance of foreground detection is unsatisfactory, which would affect the results of crowd counting directly. The advantages of these methods are that the location information of pedestrians in the images can be obtained. In most cases, we are more concerned with the real density of the crowd in the images than the location information of pedestrians. Therefore, people are gradually aware of the shortcomings of the methods based on foreground detection, and try to use other methods to improve the accuracy of crowd counting.
(2). Crowd density estimation based on regression. For the estimation of dense crowd, it is difficult to get satisfactory performance based on the foreground detection methods. Therefore, regression-based methods are gradually used to solve the problem in crowd counting. The main idea of the regression-based approach is to learn the mapping of a feature to the number of people [17,18,19]. These methods are mainly accomplished in two steps. The first step is to extract low-level features such as foreground features, edge features, textures and gradient features; the second step is to learn a regression model such as linear regression [20], piecewise linear regression [21], ridge regression [19] and Gaussian process regression [22,23]. These regression models are used to fit the crowd density.
Generally speaking, the main task of these methods is to learn a mapping between features extracted from local image patches to their counts. By utilizing regression methods, these methods no longer use detectors to count people in the images. These methods are mainly composed of two parts: feature extraction and regression framework. Some low-level features, such as edge information, texture, color and gradient features have been extracted for regression. However, it is difficult to find a suitable feature to be applied in crowd counting in the face of low resolution, severe occlusion, perspective and other complex situations. Different features and regression model may be suitable for different types of crowd images. Therefore, the low-level feature extraction and model selection is a very difficult task. Different feature extraction and regression methods are proposed based on different datasets, but it is difficult to find a method that works for most datasets. Compared with methods based on foreground detection, the performance of these methods has been greatly improved in the processing of high density crowd images, but it is still unsatisfactory.
(3). Crowd density estimation based on deep learning. Since 2006, deep learning has been widely used in various fields of research (computer vision, natural language processing, etc.). Deep learning is also used by researchers in the study of crowd counting with its excellent feature learning ability.
Lempitsky proposed to learn the mapping relationship from regional features to density maps in the learning process [24] and treated the problem as a convex optimization task for finding the cutting plane. In this paper, the density map is introduced into crowd counting, which avoids the traditional method of foreground detection or regression. However, it is difficult to learn a good linear mapping by using this method. Additionally, the time complexity and space complexity of this algorithm are not very good, and the accuracy is not satisfactory. Wang [25] proposed to use an end-to-end CNN model to count the person in the scene; Fu et al. [26] used CNN to supervise the density level of the crowd in the picture. The two papers are the first ones to apply CNN in crowd counting. They utilized AlexNet network in their work to calculate density map for crowd counting. The performance of these two algorithms has been greatly improved, but the camera perspective effect is neglected. Zhang [27] proposed a multi-column framework with three scale filters; thus, it can handle multi-scale problems. The performance of the algorithm has been further improved. However, the algorithm time complexity, and the network structure is too complicated.
Sam et al. [28] proposed a dynamically switchable model, which dynamically maps to the regional crowd density in the image. They selected an optimal regressor for the input patch with switching CNN. In this work, VGG-16 network is utilized to select optimal regressor. The performance of the algorithm is improved, but the training process of the network is not easy to implement. Shang et al. [29] used the features proposed by the GoogleNet and LSTM modules to estimate the number of local crowd, then used the fully connected layer to calculate the global crowd and utilized the context information by simultaneously optimizing the global count and local count functions. This method takes the entire images as input and output the final results directly. However, for different datasets, the performance of this algorithm varies greatly. The robustness of the algorithm is not very good.
In general, deep-learning based methods perform better than traditional methods in most datasets. Especially in high density crowd images, deep-learning based methods show great advantages. In most deep-learning based methods, scale-aware or context-aware models are adopted in network [28,29]. However, their handling of camera perspective effects is not very good. Thus, the robustness of these algorithms is not very good. Some CNN structures based on multi-columns also have achieved good results [27]. However, there are too many parameters in these structures, and we need lots of time to train the network. Therefore, taking into account the advantages and disadvantages of the above algorithms, we believe that better performance could be achieved by designing new network structures to further integrate scale and context information. Generating density maps with high quality and low error is also one of the key issues to improve the performance of the crowd counting.

2.2. The Open Dataset

With the extensive use of supervised or semi-supervised learning methods, the availability of sufficient data has become one of the factors affecting the performance of the algorithm. Different scenarios sometimes require different data preparation or modeling methods. The same model also needs to test its generalization and fitting ability from different scenarios. At present, many datasets in the field of density analysis and counting are publicly available. The main data sets are as follows.
(1). ShanghaiTech: The dataset has 1,198 labeled crowd images [27]. This dataset consists of two parts: Part A and Part ShanghaiTech B. Images in Part A mainly come from the Internet, and most of the images are dense crowd. Part B’s images are mostly from the streets of Shanghai.
(2). UCF-CC-50: This data set contains images of extremely dense crowd [30]. The images are collected mainly from the FLICKR. The dataset has a total of 50 images. This data set is characterized by a small number of images, but the number of people in the images varies greatly.
(3). Mall: The data was collected by the Chinese University of Hong Kong. The dataset include video frames in jpeg format, ground truth, perspective normalized features, and perspective normalization map. Over 60,000 pedestrians were labeled in 2000 video frames in this dataset [31].
(4). UCSD: The dataset contains 2000 frames of labeled pedestrian videos in which pedestrians move in opposite directions and crowd density changes from sparse to dense [32].
(5). WorldExpo’s: The dataset contains 3980 labeled images, in which 3380 are for training and the remaining images are for testing [33]. The testset consists of five different scenes, each with 120 images. The ROI is provided in each scenario, so the crowd counting is done in the ROI.

3. The Proposed Method

In general, there are two ways to estimate the number of people in an image by using deep learning. One is called direct method, which is to use deep learning to detect each people in the image, and then to count the number of people in the image [34,35]. Another is called the indirect method, which is used to obtain the crowd density map, and then the density map is used to estimate the number of people in the image [36]. Compared with the direct method, the indirect method has greater advantages in terms of time complexity and accuracy. Therefore, this paper adopts the indirect method to estimate the crowd density.

3.1. Converting to Maps of Crowd Density

The model in CNN needs to be trained on a large number of labeled samples. Therefore, the performance of the algorithm mainly depends on the model obtained through training. In this paper, the density map based on geometric adaptive kernel is used in crowd counting. In order to solve the occlusion problem in the crowd, we only annotate the each person’s head and save the coordinate information of the head position. Then, the image with the coordinate information will be converted into a crowd density map, which is the sample we need for model training. If there is a head at the point x i , we could express it as delta function δ ( x x i ) . Therefore, the image with N heads labeled can be represented as H(x), where N is the number of head position in the images [27]:
H ( x ) = i = 1 N δ ( x x i )
In order to get the crowd density map, we need to convolve the formula (1) with the Gaussian kernel G δ ( x ) . And then we could get density estimation function as follows:
F ( x ) = H ( x )   G σ ( x )
In which x is the sample of the ground crowd density in the three-dimensional (3D) scene, and the pixels associated with the different samples x correspond to different size regions in the scene. Therefore, in order to estimate the crowd density accurately, it is necessary to consider the perspective distortion between the ground plane and the image plane [37]. Assuming that the position of the person is replaced by the position of the head, the crowd is evenly distributed. A reasonable estimation of geometric distortion can be derived from the average distance between each person and its k neighborhood person, which could be shown as follows:
σ = β d ¯ i
d ¯ i = 1 k j = 1 k d j i
where k is the number of nearest people, the distance from the people x and the people j is expressed as { d 1 i , d 2 i , d 3 i , , d j i } . In our experiment, β = 0.3 and k = 3 .

3.2. The Processing of Camera Perspective

Due to the perspective effect of the camera, pedestrians in different depths of field have different shapes and sizes in the image plane. In crowd counting field, most algorithms annotate the human heads in the images to solve the occlusion problem. However, the size of the heads in different positions is different due to the perspective effect of the camera, which makes it difficult for us to use the convolution network for crowd counting (Figure 3). Therefore, eliminating the influence of the perspective effect of the image is a key step to improve the performance of the crowd counting algorithm. Since most of the data we get is single image, it is very difficult to make an accurate calculation for camera perspective. Thus, some algorithms utilize different filters with different sizes to generate density maps [27,38].
However, different filters do not work together well, so information blending between different density maps is insufficient. In this paper, Deep Scale-Adaptive Neural Network (DSA-CNN) is proposed to learn density map for crowd counting (Figure 4). In this structure, we no longer need to choose the size of the filter, but leave it to the neural network to learn. In the proposed network structure, we can clearly see that three different sizes of filters are used to process the image in the network. After repeated experiments, we selected 5 × 5, 7 × 7 and 9 × 9 three different filters for the neural network. Increasing the width and depth is a common way to increase the discriminative power of the network, thus we designed different depths for different filters. The filtered results with different filters are combined for DSA-CNN.

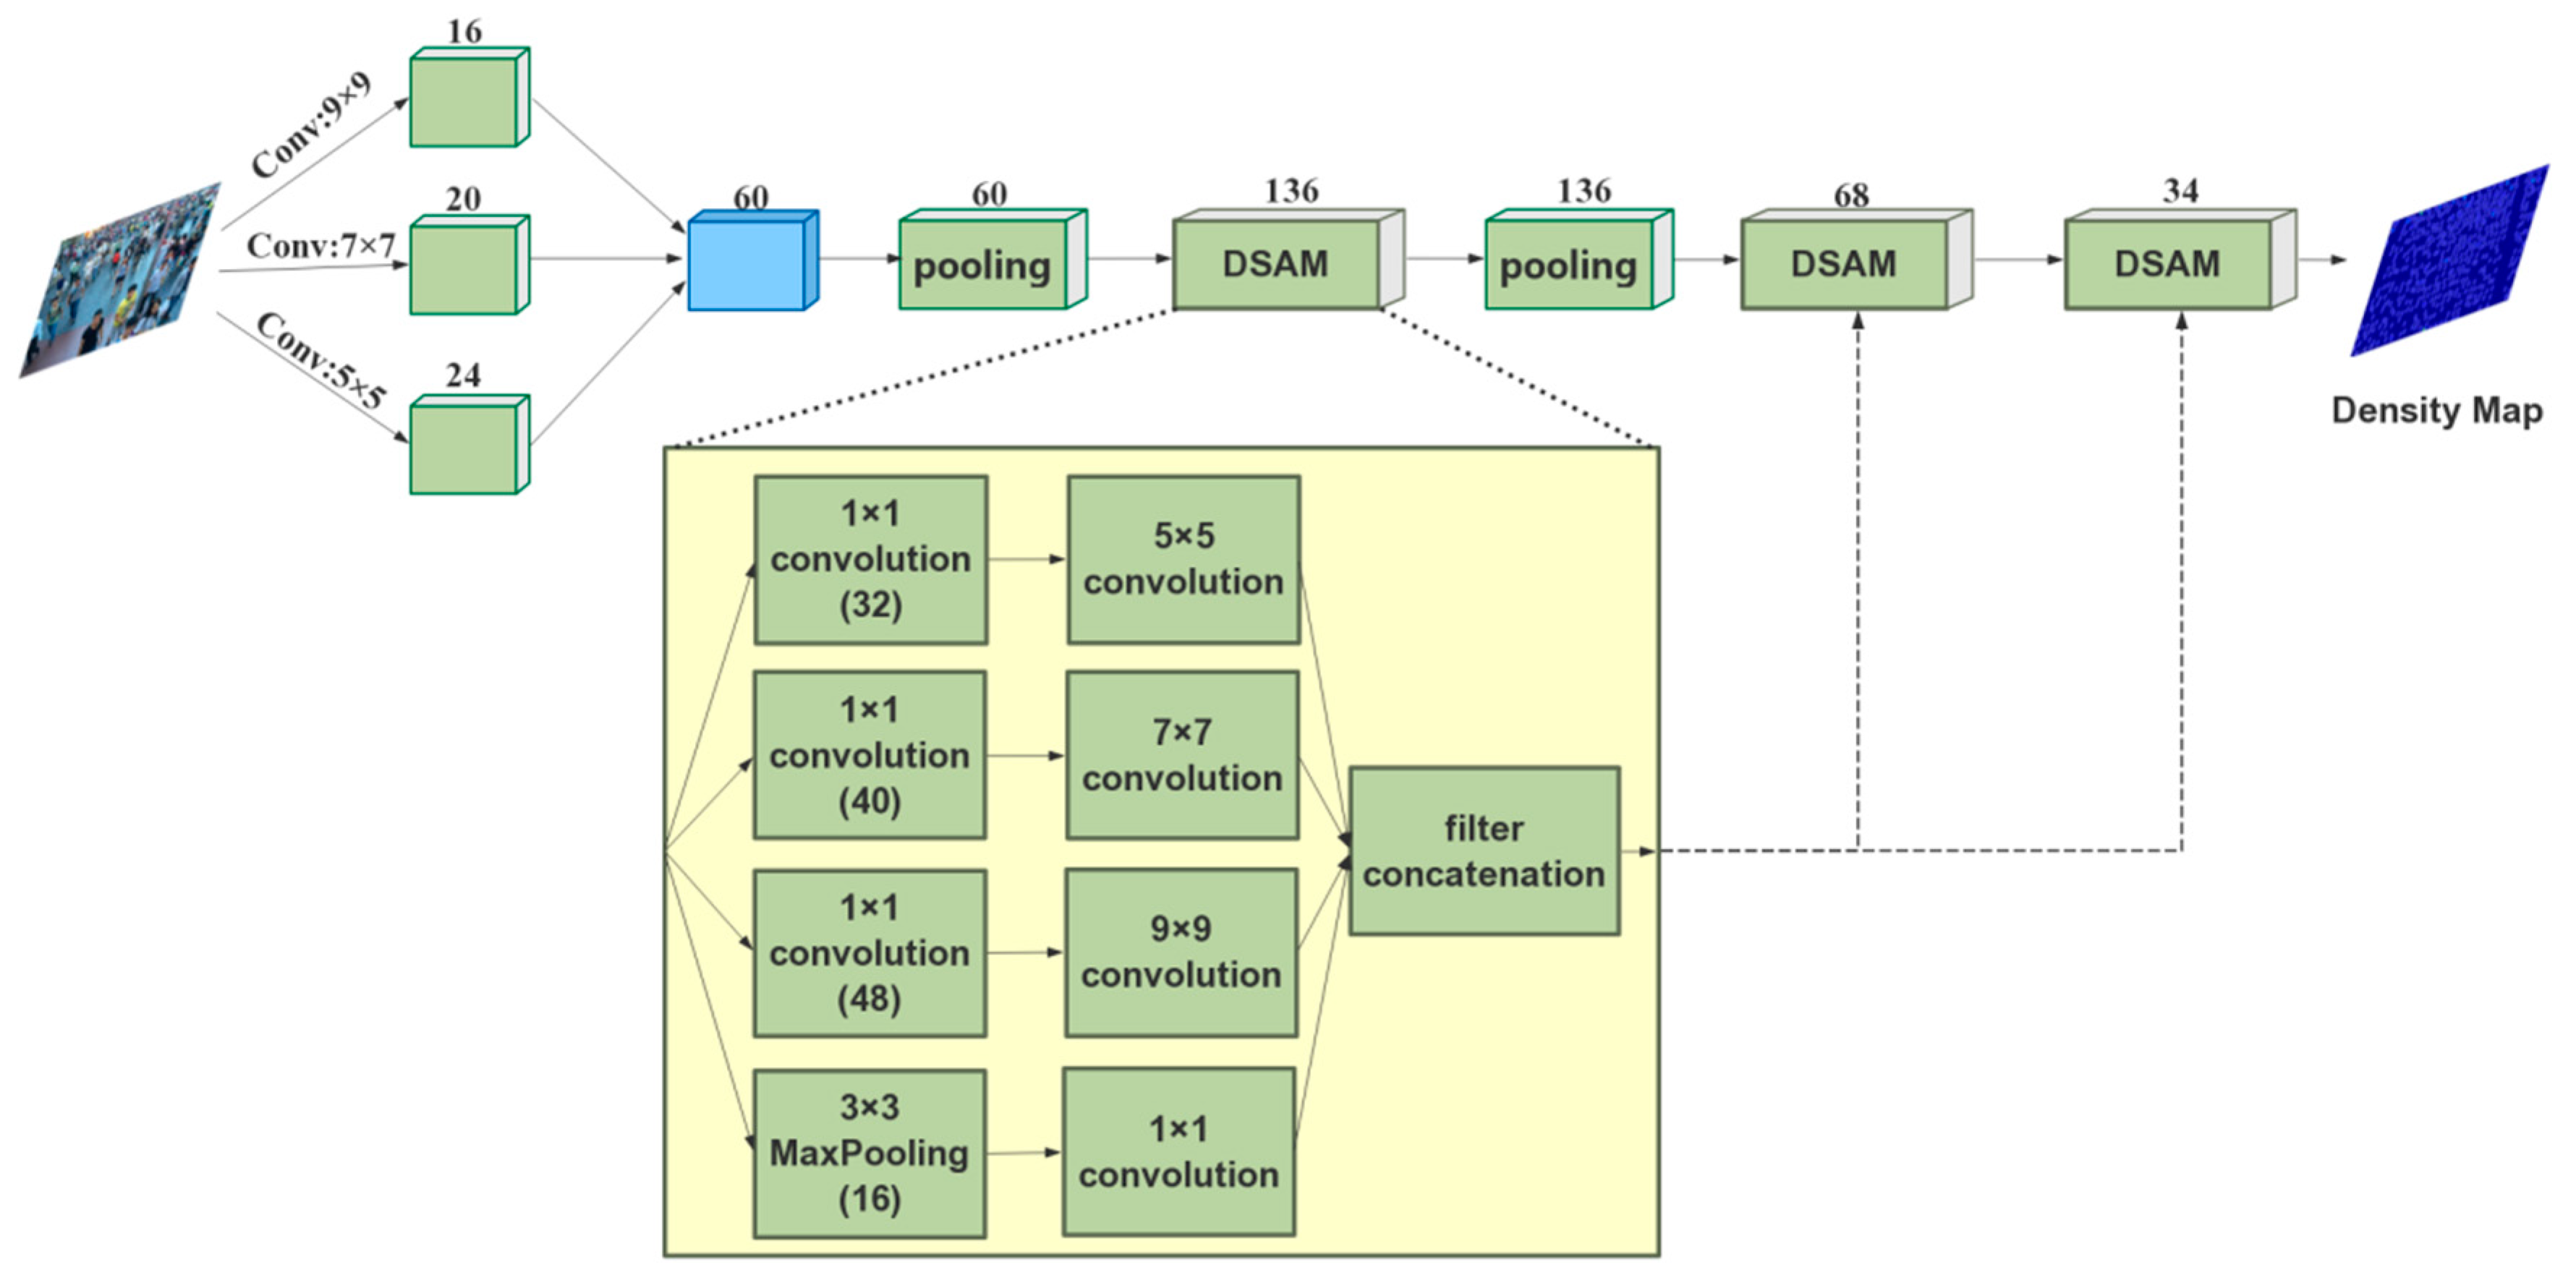
3.3. Deep Scale-Adaptive Module for Density Map

In deep learning networks, many experiments have shown that increasing the width and depth of the neural network is an effective way to improve network performance [1,2,6]. In the algorithm proposed in this paper, the depth of the data reaches 60 layers after fusion and pooling (Figure 4). In order to increase the robustness of the algorithm, we used three different sizes of filters to process the data. Inspired by the inception algorithm, we used the maximum pooling to increase the width of the structure and enhance the extraction of image features [1,39]. However, the increase of the model width means more parameters and computational resource consumption, and the model is easier to over-fit; thus, we should not increase the size of the model blindly. Therefore, we should deal with the network appropriately to solve this problem.
The proposed method turns the fully connection of the convolutional layer into a sparse connection, and use multiple filters of different sizes to extract features at multiple scales and then connected to a common output. Thus, the width of the network is increased without increasing the number of parameters. On the other hand, the adaptability of the network to multiple scales is also increased. In order to reduce the number of parameters, we do 1×1 filtering before doing 3 × 3, 5 × 5 and 7 × 7 filtering on the data. The proposed method can effectively reduce the dimension of the network with 1 × 1 filter and reduce the consumption of computing resources and the number of parameters, which can reduce the time complexity and space complexity required for neural network training. Moreover, the network can prevent over-fitting by calculating the ReLU function after each 1 × 1 convolution kernel. In the whole network, the proposed method utilizes three Deep Scale-Adaptive Modules (DASM) and two 2 × 2 pooling layers. Finally, we could get the density map for crowd counting (Figure 5). In order to show the entire process, the pseudo code is listed as follows:
Algorithm 1: The calculation of density map for crowd image
Input:I:test dataset
Output: density map
1: function GenerateDensity(I)
2: num←the number of image in I
3: for i ∈ [0,num] do
4: column1 = conv(image[i],5 × 5)
5: column2 = conv(image[i],7 × 7)
6: column3 = conv(image[i],9 × 9)
7: merge1 = Merge(a,b,c)
8: pooling1 = MaxPooling(merge1)
9: merge2 = DSAM(pooling1)
10: pooling2 = Merge(merge2)
11: merge3 = DSAM(pooling2)
12: merge4 = DSAM(merge3)
13: return(Generate(merge4))
14: end for
15: end function
16:
17: function DSAM(im)
18: column_11 = conv(im,1 × 1)
19: column_11 = conv(colmun_11,5 × 5)
20: column_12 = conv(im,1 × 1)
21: column_12 = conv(column_12,7 × 7)
22: column_13 = conv(im,1 × 1)
22: column_13 = conv(column_13,9 × 9)
23: column_14 = MaxPooling(im)
24: column_14 = conv(column_14,1 × 1)
25: return Merge(column_11,column_12,column_13,column_14)
26: end function

4. Some Configuration of Our Model

The configuration for the proposed method is listed in Table 1. The model inputs the images and extracts the features through a multi-layer convolution-pooling structure, and finally outputs a density map. This paper constructs 3 × 3, 5 × 5 and 7 × 7 filters to process images. In order to increase the width of the network and improve the discriminative of features, we have introduced a maxpooling of 3 × 3 in the network. A 2 × 2 region was used for the maxpooling layer. As for the activation function, the model utilize Rectified linear unit (ReLU), which is widely used by other models. The loss function is given as follow:
L ( Θ ) = 1 2 N i = 1 N | | F ( X i ; Θ ) F i | | 2 2
In which Θ is the parameters for DSA-CNN and N is the number of training image. F ( X i ; Θ ) is the density map for sample image X i with parameter Θ , F i is the ground truth result of the sample image X i . L ( Θ ) is the loss function between the estimated density map and the ground truth the proposed model.

5. Experiments

5.1. Evaluation Metrics

The numerical deviation evaluation is applied in the crowd counting. The purpose of this index is to evaluate the error between the estimated value and the real value, which could reflect the ability of the model. The performance evaluation methods used in this paper are as follows:
(1) Mean Absolute Error (MAE)
MAE is the average of the observed values and absolute values of the deviations of arithmetic mean values for all samples. Therefore, compared with the average error, the MAE is absolute valued, and there is no positive or negative phase cancellation. Therefore, the average absolute error can better reflect the actual situation of the predicted value error. The MAE could be calculated as Formula 6 Where p i is the real number of people in the image and p i ^ is the number of people in the image predicted by the model. N is the number of images in the test dataset. p i ^ can be calculated with Formula 6:
M A E = 1 N i = 1 N | p i p i ^ |
p i = l = 1 L W = 1 W z l , w
where L and W are the length and width of the density map generated by the model. z l , w is the pixel at the position (l,w).
(2) Mean Squared Error (MSE)
MAE is not sensitive enough to single sample with large deviations, thus, we need an indicator to evaluate the performance of the algorithm, which is more sensitive to outliers. MSE is the square root of the ratio of the sum of the observed and true deviations to the number of observations. It is sensitive to the occurrence of outliers. The calculation MSE is as follows:
M S E = 1 N i = 1 N | p i p i ^ | 2

5.2. A Brief Introduction to Comparison Algorithms

To illustrate the effectiveness of the proposed algorithm, the proposed algorithm is compared with the current main crowd counting algorithms. As described in Section 1, crowd counting algorithms can be divided into three types: foreground-based methods, regression-based methods and deep learning-based methods. Because the proposed algorithm utilized the framework of deep convolution neural network, so we compare our method with deep learning-based methods. We briefly introduce these algorithms as follows:
(1) Cross-scene Crowd Counting [33]: this algorithm proposes to use deep learning to complete cross-scene crowd counting. The algorithm is trained in multiple scenarios and tested in untrained scenarios. The algorithm also established a new dataset for crowd counting called WorldExpo’10 dataset
(2) MCNN [27]: the algorithm proposed a crowd counting method which could accurately estimates the crowd density from a single image. The paper proposes a simple and effective multi-column convolutional neural network structure to map images into their crowd density maps.
(3) Switching-CNN [28]: the algorithm proposed a switching convolution neural network to improve the accuracy of crowd counting. Several CNNs with different convolution kernel sizes are used as regression graphs for density map prediction.
(4) CP-CNN [34]: the algorithm proposes a crowd counting method called context pyramid neural network, which combines global context information and local context information to generate high quality crowd density map.
(5) Cascaded-MTL [40]: the algorithm proposed a novel end-to-end cascaded network of CNNs to jointly learn crowd count classification and density map estimation. The algorithm divides the crowd into different groups, which could be incorporated into the neural network for as prior information.

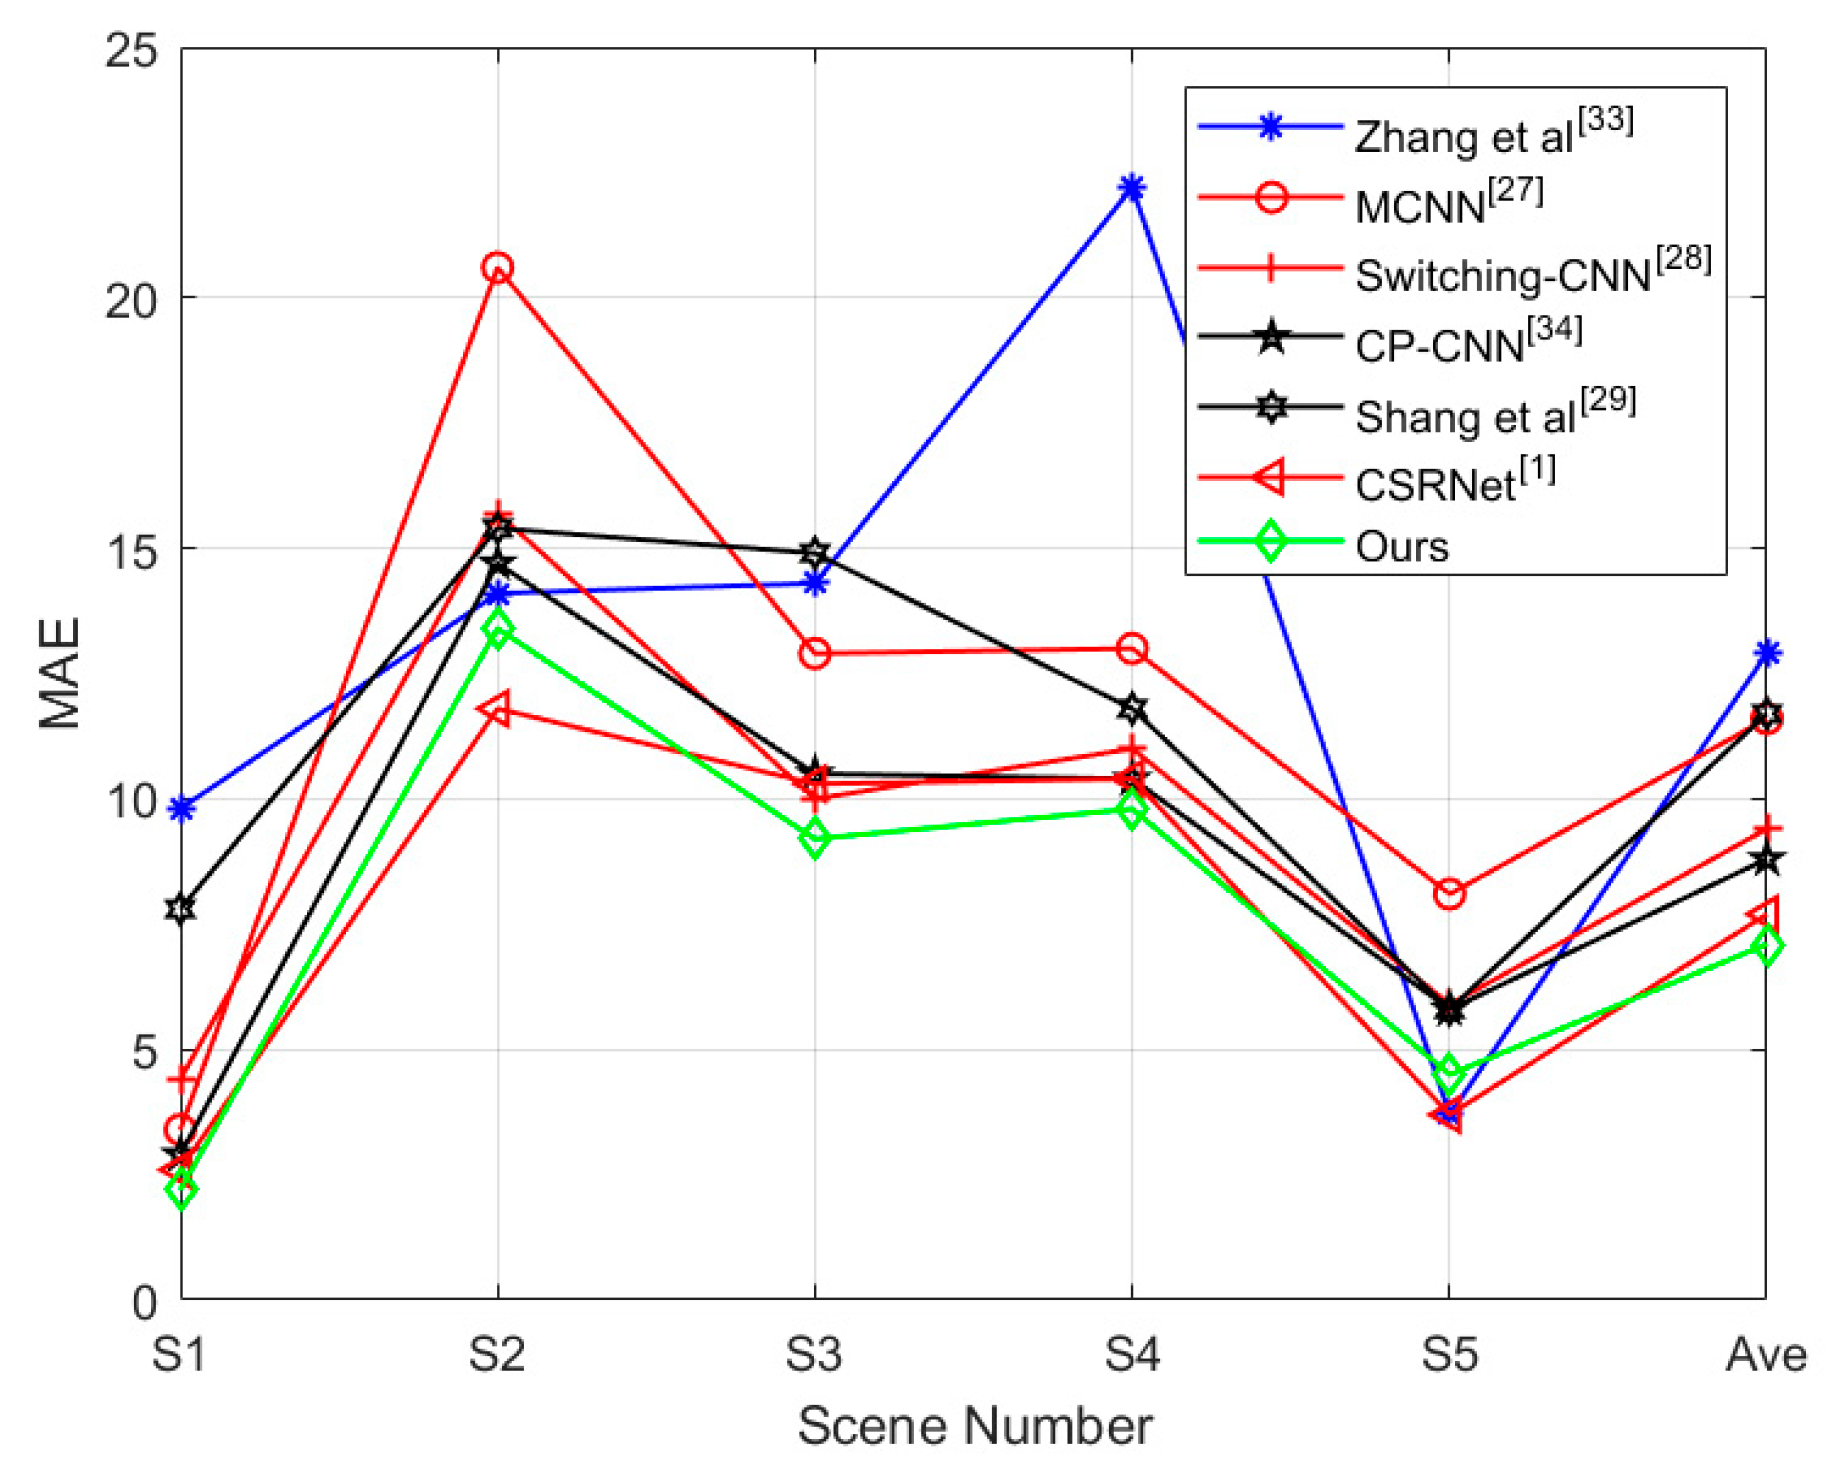
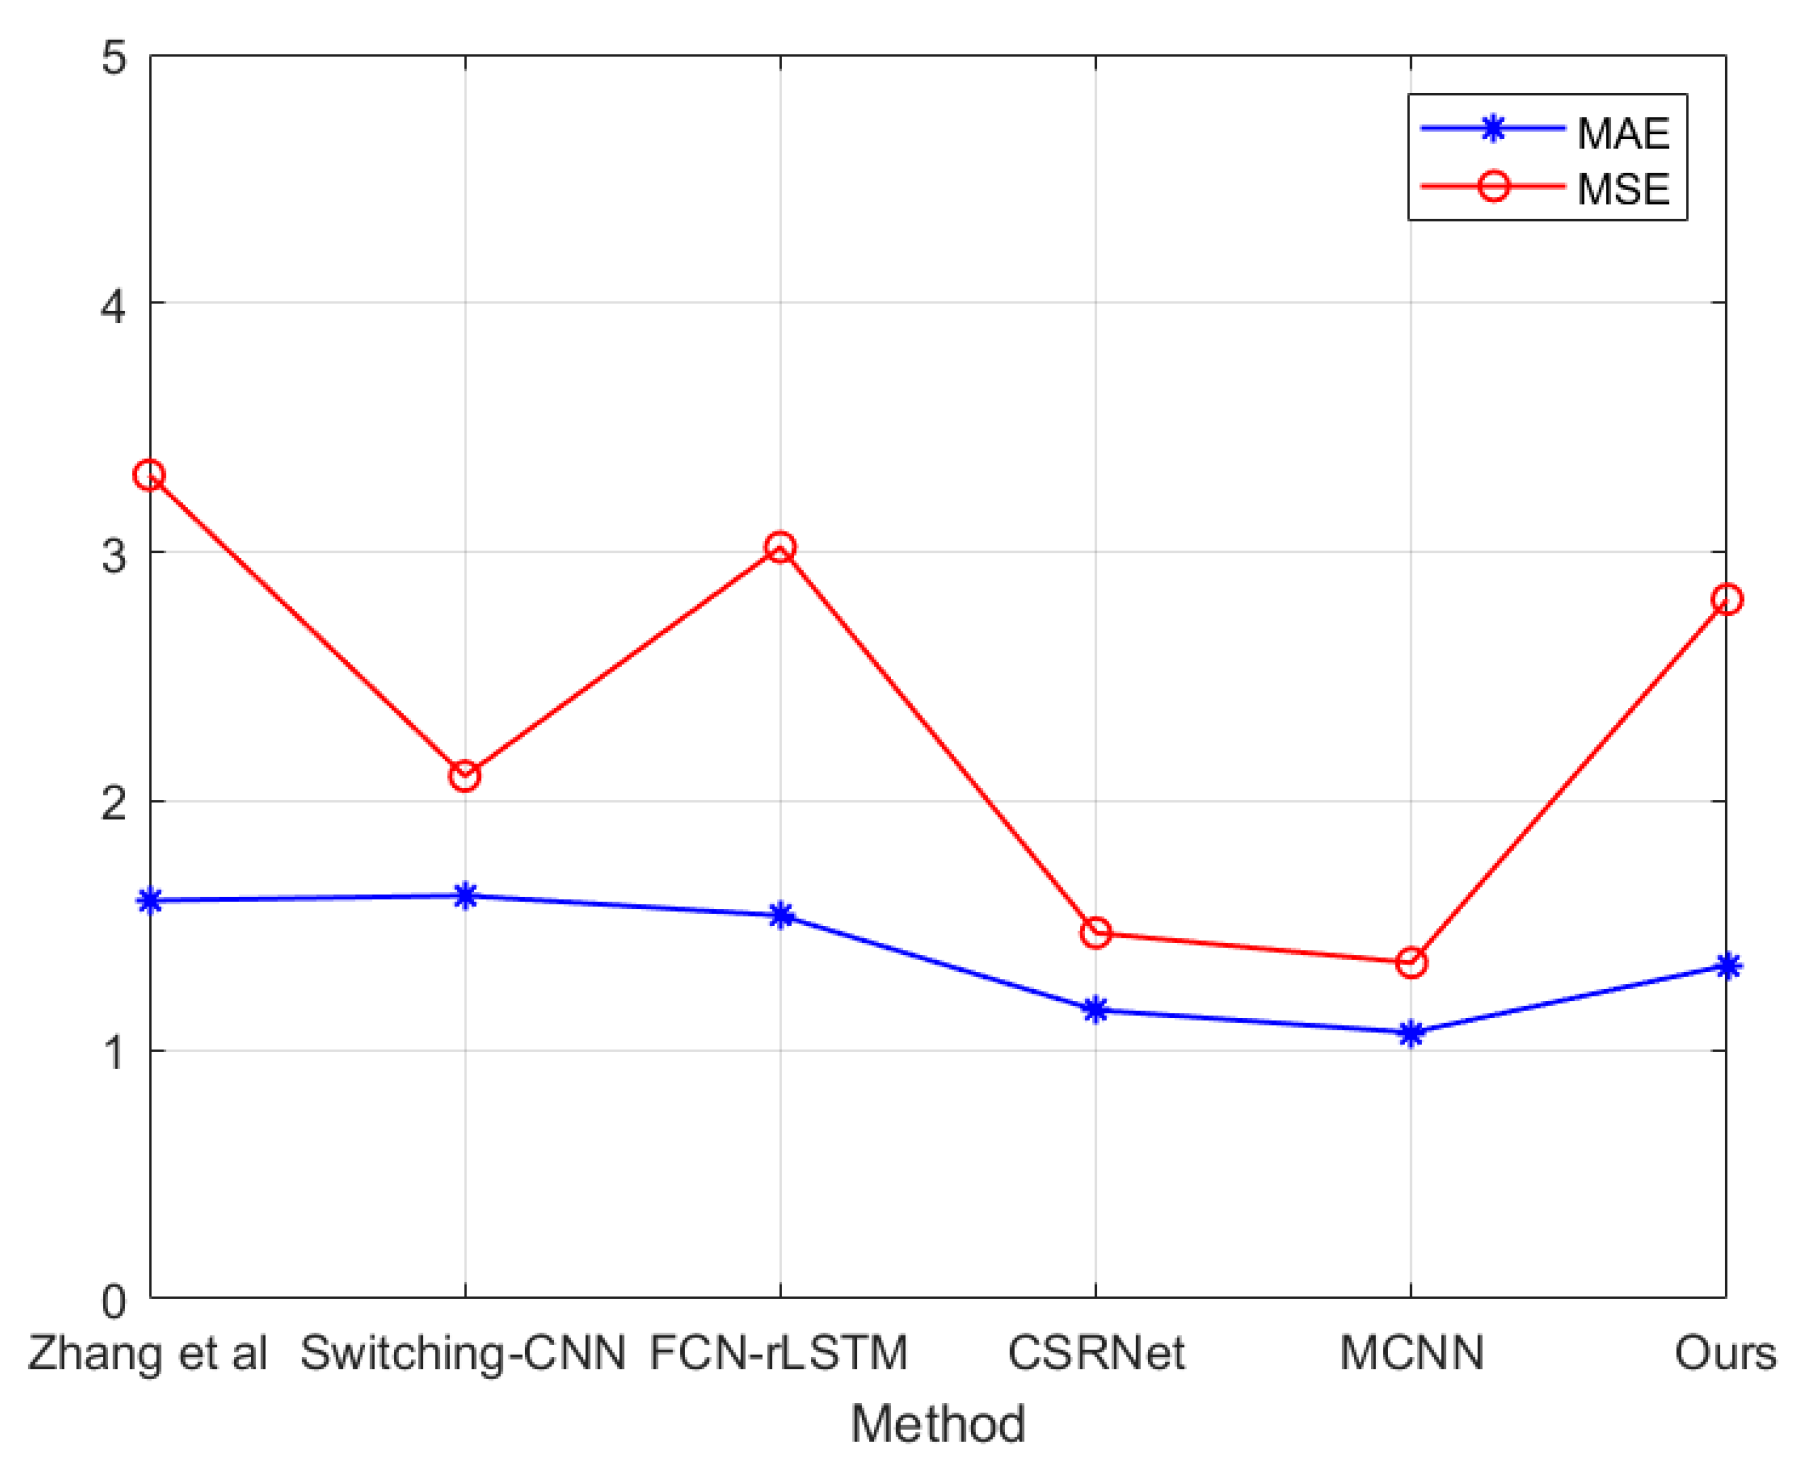
5.3. Evaluation and Comparison

(1) ShanghaiTech dataset
In order to evaluate the performance of our proposed algorithm, we compare the proposed algorithm with some well-known algorithms on ShanghaiTech dataset [27]. This dataset consists of two parts: Part_A and Part_B, which containd 1,198 images and where a total of 330,156 individual heads were annotated. Part_A and Part_B contain 482 and 716 images, respectively (Figure 6). From Figure 6, we can see that the crowd in the photo is extremely crowded; the perspective of the camera is also different. ShanghaiTech dataset can test the algorithm’s adaptability to camera perspective. The pictures in Part_A are mainly from the Internet, and the pictures in Part_B are mainly from the streets of Shanghai. Table 2 shows that the performance of our proposed algorithm has been significantly improved. In Part_A dataset, our algorithm gets the lowest MAE value, which is 7% lower than the CP-CNN algorithm. In Part_A dataset, our algorithm gets the lowest MAE value, which is 2% lower than the CP-CNN algorithm.
Due to the large number of samples on the ShanghaiTech Part_A dataset and the large distribution of the crowd density, it is possible to use the image quality evaluation indicators to evaluate the quality of the crowd density map. In this paper, Peak Signal to Noise Ratio (PSNR) and Structural Similarity (SSIM) is adopted to evaluate the quality of the image. PSNR is the most common and widely used image objective evaluation index, which is based on the error between corresponding pixels. SSIM is also a full-reference image quality evaluation index, which measures image similarity from three aspects of brightness, contrast and structure. In Table 3, we can see that there is a significant improvement in the quality of density maps. The image generated by DSA-CNN obtained the highest PSNR and SSIM. The comparison results in Table 2 and Table 3 demonstrate that DSA-CNN is effective.
(2) UCF_CC_50 dataset
The dataset has a total of 50 images [30]. This data set is characterized by a small number of images, but the number of people in the images varies greatly. The number of people in the image is between 94 and 4543. Figure 7 shows two images selected from UCF_CC_50 dataset randomly. Most of the crowds in the dataset are extremely crowded, thus, the occlusion problem is very serious. This dataset can test the robustness of the algorithm to different crowd density. The results of the comparison experiments are shown in Table 4. In the results we can see that the proposed algorithm obtains the lowest MAE value, which is 8% lower than the CP-CNN algorithm.
(3) WorldExpo’10 dataset
WorldExpo’10 dataset consists of a training dataset and test dataset, which include 3380 images and 600 images, respectively [33]. The dataset contains consists of five different scenes, each with 120 images. Figure 8 shows two images selected from WorldExpo’10 dataset randomly and their density map generated by DSA-CNN. Most of the images in the dataset are captured by the surveillance camera. The dispersion of the crowd in the image is uneven. The ROI is provided in each scene, thus the crowd counting is done in the ROI. Figure 9 shows the results of the comparisons of MAE with other six methods. In the five scenarios, the proposed method is better than the other six methods in four scenes. The performance of DSA-CNN in scenario 5 is not as good as that of Zhang [33] and CSRNet [1]. From the experimental results, we can see that the proposed algorithm obtains the lowest MAE value.
(4) The UCSD dataset
The UCSD Dataset was acquired with stationary cameras, which overlooked pedestrian walkways [32]. The crowd density in the walkways was variable, ranging from sparse to very crowded. In the normal setting, the video contains only pedestrians. There are approximately 2,000 images in the USCD dataset. Figure 10 shows two images selected from UCSD dataset randomly and their density map generated by DSA-CNN. Compared to other datasets, the crowd density in the UCSD dataset is relatively small. Each picture contains about 11 to 46 person. In the image, the region of interest is provided for the images in the dataset. The results on UCSD dataset is shown in Figure 10 and Figure 11. From Figure 11 we could see that the performance of t DSA-CNN is not the best. By observing the images, we can see that the crowd in USCD dataset set is sparser than the crowd in other data sets. This shows that the degree of crowd density in the image has a greater impact on the counting results. This shows that the performance of DSA-CNN in the dataset with sparse crowd needs to be improved. The experiment results also show that the robustness of DSA-CNN is not very good, which are needed to be improved in future work.

6. Conclusions

In this paper, we proposed a new convolution neural network called DSA-CNN to estimate density map for crowd counting. The purpose of the proposed algorithm is to count the number of people in the image accurately. In order to overcome the influence of camera perspective on crowd counting, the proposed method adopted different sizes of filters in the network and combines them ingeniously. However, the increase of number of filters also makes the structure of the network expand rapidly. To solve this problem, the proposed method develops deep scale-adaptive module to reduce the size of the data. To validate the effectiveness of the proposed method, we conducted comparative experiments on four popular public data sets. The experimental results prove that the proposed algorithm is effective. In future work, we will study how to reduce the size of the neural network for crowd counting. We will also study how to transplant crowd counting methods to other applications, such as fish counting, cell counting, etc.

Author Contributions

All the authors make contribution to this work. J.W. and W.Q. proposed the idea and wrote the paper; Z.L. conceived and designed the experiments; Y.Z. performed the experiments.

Funding

This work is supported by the Guangdong Province Key Laboratory of Popular High Performance Computers (SZU-GDPHPCL201805), Institute of Marine Industry Technology of Universities in Liaoning Province (2018-CY-34), National Natural Science Foundation of China (61701070, 61672379), Liaoning Doctoral Start-up Fund (20180540090), National Natural Science Foundation of NSFC and Guangdong Joint Fund (U1701263), and China Postdoctoral Science Foundation (2018M640239).

Conflicts of Interest

The authors declare no conflict of interest.

References

  1. Shi, M.; Yang, Z.; Xu, C.; Chen, Q. Revisiting Perspective Information for Efficient Crowd Counting. In Proceedings of the IEEE Conference on Computer Vision and Pattern Recognition, Long Beach, CA, USA, 15–21 June 2019. [Google Scholar]
  2. Sam, D.B.; Sajjan, N.N.; Maurya, H.; Babu, R.V. Almost Unsupervised Learning for Dense Crowd Counting. In Proceedings of the Thirty-Third AAAI Conference on Artificial Intelligence, Honolulu, HI, USA, 27 January–1 February 2019. [Google Scholar]
  3. Shang, C.; Haizhou, A.I.; Yang, Y. Crowd counting via learning perspective for multi-scale multi-view Web images. Front. Comput. Sci. 2019, 13, 579–587. [Google Scholar] [CrossRef]
  4. Shi, Z.; Le, Z.; Sun, Y.; Ye, Y. Multiscale Multitask Deep NetVLAD for Crowd Counting. IEEE Trans. Ind. Inform. 2018, 14, 4953–4962. [Google Scholar] [CrossRef]
  5. Maddah, H.; Ghazvini, M.; Ahmadi, M.H. Predicting the efficiency of CuO/water nanofluid in heat pipe heat exchanger using neural network. Int. Commun. Heat Mass Transf. 2019, 104, 33–40. [Google Scholar] [CrossRef]
  6. Szegedy, C.; Liu, W.; Jia, Y.; Sermanet, P.; Reed, S.; Anguelov, D.; Erhan, D.; Vanhoucke, V.; Rabinovich, A. Going deeper with convolutions. In Proceedings of the IEEE Conference on Computer Vision and Pattern Recognition, Boston, MA, USA, 7–12 June 2015. [Google Scholar]
  7. Dollar, P.; Wojek, C.; Schiele, B. Pedestrian detection: An evaluation of the state of the art. IEEE Trans. Pattern Anal. Mach. Intell. 2012, 34, 743–761. [Google Scholar] [CrossRef] [PubMed]
  8. Leibe, B.; Seemann, E.; Schiele, B. Pedestrian detection in crowded scenes. IEEE Conf. Comput. Vision Pattern Recognit. 2005, 1, 878–885. [Google Scholar]
  9. Enzweiler, M.; Gavrila, D.M. Monocular Pedestrian Detection: Survey and Experiments. IEEE Trans. Pattern Anal. Mach. Intell. 2009, 31, 2179. [Google Scholar] [CrossRef] [PubMed]
  10. Tuzel, O.; Porikli, F.; Meer, P. Pedestrian Detection via Classification on Riemannian Manifolds. IEEE Trans Pattern Anal. Mach. Intell. 2008, 30, 1713–1727. [Google Scholar] [CrossRef] [PubMed]
  11. Lin, T.; Zha, H. Riemannian Manifolds. IEEE Trans. Pattern Anal. Mach. Intell. 2008, 30, 1713–1727. [Google Scholar]
  12. Viola, P.; Jones, M. Robust Real-time Face Detection. Int. J. Comput. Vis. 2004, 57, 137–154. [Google Scholar] [CrossRef]
  13. Dalal, N.; Triggs, B. Histograms of Oriented Gradients for Human Detection. In Proceedings of the IEEE Conference on Computer Vision and Pattern Recognition, San Diego, CA, USA, 20–26 June 2005. [Google Scholar]
  14. Wu, B.; Nevatia, R. Detection of Multiple, Partially Occluded Humans in a Single Image by Bayesian Combination of Edgelet Part Detectors. In Proceedings of the Tenth IEEE International Conference on Computer Vision, Beijing, China, 17–20 October 2005. [Google Scholar]
  15. Wu, B.; Nevatia, R. Detection and Tracking of Multiple, Partially Occluded Humans by Bayesian Combination of Edgelet based Part Detectors. Int. J. Comput. Vis. 2007, 75, 247–266. [Google Scholar] [CrossRef]
  16. Lin, S.F.; Chen, J.Y.; Chao, H.X. Estimation of number of people in crowded scenes using perspective transformation. IEEE Trans. Syst. Man Cybern. 2001, 31, 645–654. [Google Scholar]
  17. Felzenszwalb, P.F.; Girshick, R.B.; Mcallester, D. Cascade object detection with deformable part models. Commun. ACM 2010, 56, 2241–2248. [Google Scholar]
  18. Chan, A.B.; Vasconcelos, N. Bayesian Poisson regression for crowd counting. In Proceedings of the IEEE 12th International Conference on Computer Vision, Kyoto, Japan, 27 September–4 October 2009. [Google Scholar]
  19. Ryan, D.; Denman, S.; Fookes, C.; Sridharan, S. Crowd Counting Using Multiple Local Features. In Proceedings of the IEEE Digital Image Computing: Techniques and Applications, Melbourne, Australia, 1–3 December 2009. [Google Scholar]
  20. Chen, K.; Loy, C.C.; Gong, S.; Xiang, T. Feature Mining for Localised Crowd Counting. In Proceedings of the British Machine Vision Conference, Guildford, UK, 3–7 September 2012. [Google Scholar]
  21. Paragios, N.; Ramesh, V. A MRF-based Approach for Real-Time Subway Monitoring. In Proceedings of the IEEE Conference on Computer Vision and Pattern Recognition, Kauai, HI, USA, 8–14 December 2001. [Google Scholar]
  22. Ma, Z.; Chan, A.B. Crossing the Line: Crowd Counting by Integer Programming with Local Features. In Proceedings of the IEEE International Conference on Computer Vision and Pattern Recognition, Portland, OR, USA, 23–28 June 2013. [Google Scholar]
  23. Ryan, D.; Denman, S.; Sridharan, S. An evaluation of crowd counting methods, features and regression models. Comput. Vis. Image Underst. 2014, 130, 1–17. [Google Scholar] [CrossRef] [Green Version]
  24. Lempitsky, V.; Zisserman, A. Learning to Count Objects in Images. Adv. Neural Inf. Process. Syst. 2010, 1324–1332. [Google Scholar]
  25. Wang, C.; Zhang, H.; Yang, L. Deep People Counting in Extremely Dense Crowds. In Proceedings of the ACM International Conference on Multimedia, Shanghai, China, 23–26 June 2015; pp. 1299–1302. [Google Scholar]
  26. Fu, M.; Xu, P.; Li, X. Fast crowd density estimation with convolutional neural networks. Eng. Appl. Artif. Intell. 2015, 81–88. [Google Scholar] [CrossRef]
  27. Zhang, Y.; Zhou, D.; Chen, S.; Gao, S.; Ma, Y. Single-Image Crowd Counting via Multi Column Convolutional Neural Network. In Proceedings of the IEEE Conference on Computer Vision and Pattern Recognition, Las Vegas, NV, USA, 1–26 June 2016; pp. 589–597. [Google Scholar]
  28. Sam, D.B.; Surya, S.; Babu, R.V. Switching Convolutional Neural Network for Crowd Counting. In Proceedings of the IEEE Conference on Computer Vision and Pattern Recognition, Honolulu, HI, USA, 21–26 July 2017; pp. 4031–4039. [Google Scholar]
  29. Shang, C.; Ai, H.; Bai, B. End-to-end crowd counting via joint learning local and global count. In Proceedings of the IEEE International Conference on Image Processing, Phoenix, AZ, USA, 25–28 September 2016; pp. 1215–1219. [Google Scholar]
  30. Idrees, H.; Saleemi, I.; Seibert, C.; Shah, M. Multi-Source Multi-Scale Counting in Extremely Dense Crowd Images. In Proceedings of the IEEE International Conference on Computer Vision and Pattern Recognition, Portland, OR, USA, 23–28 June 2013. [Google Scholar]
  31. Loy, C.C.; Gong, S.; Xiang, T. From Semi-supervised to Transfer Counting of Crowds. In Proceedings of the IEEE International Conference on Computer Vision, Sydney, Australia, 1–8 December 2013. [Google Scholar]
  32. Chan, A.B.; Liang, Z.S.; Vasconcelos, N. Privacy preserving crowd monitoring: Counting people without people models or tracking. In Proceedings of the IEEE Conference on Computer Vision and Pattern Recognition, Anchorage, AK, USA, 23–28 June 2008. [Google Scholar]
  33. Zhang, C.; Li, H.; Wang, X.; Yang, X. Cross-scene crowd counting via deep convolutional neural networks. In Proceedings of the IEEE Conference on Computer Vision and Pattern Recognition, Boston, MA, USA, 7–12 June 2015. [Google Scholar]
  34. Sindagi, V.A.; Patel, V.M. Generating high quality crowd density maps using contextual pyramid CNNs. In Proceedings of the IEEE Conference on Computer Vision and Pattern Recognition, Honolulu, HI, USA, 21–26 July 2017; pp. 1861–1870. [Google Scholar]
  35. Sermanet, P.; Kavukcuoglu, K.; Chintala, S.; LeCun, Y. Pedestrian Detection with Unsupervised Multi-stage Feature Learning. In Proceedings of the IEEE Conference on Computer Vision and Pattern Recognition, Portland, OR, USA, 23–28 June 2013. [Google Scholar]
  36. Zhong, Z.; Yin, W.; Venetianer, P.L. Fast Crowd Density Estimation in Surveillance Videos without Training. In Proceedings of the IEEE Ninth International Conference on Advanced Video & Signal-based Surveillance, Beijing, China, 18–21 September 2012. [Google Scholar]
  37. Peng, S.; Fang, Z.; Gao, Y. Crowd Counting Based on Feature Fusion of Multi-Scale Fully Convolutional Networks. J. Wuhan Univ. (Sci. Ed.) 2018, 64, 249–254. [Google Scholar]
  38. Ahmadi, M.H.; Mohseni-Gharyehsafa, B.; Farzaneh-Gord, M.; Ravindra, D.; Jilte, R.K.; Chau, K.W. Applicability of connectionist methods to predict dynamic viscosity of silver/water nanofluid by using ANN-MLP, MARS and MPR algorithms. Eng. Appl. Comput. Fluid Mech. 2019, 13, 220–228. [Google Scholar] [CrossRef]
  39. Kopsiaftis, G.; Protopapadakis, E.; Voulodimos, A.; Doulamis, N.; Mantoglou, A. Gaussian Process Regression Tuned by Bayesian Optimization for Seawater Intrusion Prediction. Comput. Intell. Neurosci. 2019, 2019, 1–12. [Google Scholar] [CrossRef] [PubMed]
  40. Sindagi, V.A.; Patel, V.M. Cnn-based cascaded multi-task learning of high-level prior and density estimation for crowd counting. IEEE Adv. Video Signal Based Surveill. 2017, 1–6. [Google Scholar]
  41. Marsden, M.; McGuiness, K.; Little, S.; O’Connor, N.E. Fully convolutional crowd counting on highly congested scenes. In Proceedings of the International Conference on Computer Vision Theory and Applications, Berlin, Germany, 11–14 March 2016. [Google Scholar]
Figure 1. (a) Pedestrian Street. (b) Festival celebration. (c) Sports event. (d) Tourist attraction.
Electronics 08 00701 g001
Figure 2. (ac) are methods based on the whole body. (df) are methods based on a part of the body.
Electronics 08 00701 g002
Figure 3. Camera perspective effect.
Electronics 08 00701 g003
Figure 4. The structure of the proposed deep scale adaptive convolutional neural network for crowd density map estimation.
Electronics 08 00701 g004
Figure 5. Samples for density map for crowd counting. (a, d and g) are original image. (b, e and h) are density map for ground truth, (c, f and i) are density map of Deep Scale-Adaptive Convolutional Neural Network (DSA-CNN).
Electronics 08 00701 g005
Figure 6. (a,b) are two sample images from ShanghaiTech Part_A and Part_B respectively. (c,d) are their density map generated by DSA-CNN.
Electronics 08 00701 g006
Figure 7. (a,b) are two sample images in UCF_CC_50 dataset. (c,d) are their density map generated by DSA-CNN for two images, respectively.
Electronics 08 00701 g007
Figure 8. Two sample images in WorldExpo’10 dataset. (a,b) are two sample images in WorldExpo’10 dataset. (c,d) are their density map generated by DSA-CNN for two images, respectively.
Electronics 08 00701 g008
Figure 9. The comparison of MAE with seven methods in five different scenes.
Electronics 08 00701 g009
Figure 10. Two sample images in UCSD dataset. (a,b) are two sample images in UCF_CC_50 dataset. (c,d) are their density map generated by DSA-CNN for two images, respectively.
Electronics 08 00701 g010
Figure 11. The MAE and MSE of different methods for the UCSD dataset.
Electronics 08 00701 g011
Table 1. The configuration of DSA-CNN.
Configuration of DSA-CNN
Input (color image)
Conv3-16 5 × 5Conv3-20 7 × 7Conv3-24 9 × 9
Merged layer (60)
MaxPooling (60)
Conv3-32Conv3-40Conv3-48MaxPooling
1 × 11 × 11 × 13 × 3
Conv3-32Conv3-40Conv3-48Conv3-16
3 × 35 × 57 × 71 × 1
Merged layer (136)
MaxPooling (136)
Conv3-16Conv3-20Conv3-24MaxPooling
1 × 11 × 11 × 13 × 3
Conv3-16Conv3-20Conv3-24Conv3-8
3 × 35 × 57 × 71 × 1
Merged layer (68)
Conv3-8Conv3-10Conv3-12MaxPooling
1 × 11 × 11 × 13 × 3
Conv3-8Conv3-10Conv3-12Conv3-4
3 × 35 × 57 × 71 × 1
Merged layer (34)
Conv3 1 × 1
Table 2. The comparison on ShanghaiTech dataset.
MethodPart_APart_B
MAEMSEMAEMSE
Zhang et al. [33]181.8277.732.049.8
MCNN [27]110.2173.226.441.3
Marsden et al. [41]126.5173.523.833.1
Cascaded-MTL [40]101.3152.420.031.1
Switching-CNN [28]90.4135.021.633.4
CP-CNN [34]73.6106.420.130.1
Ours68.4103.522.327.4
Table 3. The comparisons of Peak Signal to Noise Ratio (PSNR) and Structural Similarity (SSIM).
MethodPart_A
PSNRSSIM
MCNN20.910.52
CP-CNN21.720.72
Ours21.950.83
Table 4. The comparisons in UCF_CC_50 dataset.
MethodUCF_CC_50
MAEMSE
Zhang et al.467.0489.5
MCNN377.6509.1
Marsden et al.338.6424.5
Cascaded-MTL322.8397.9
Switching-CNN318.1439.2
CP-CNN295.8320.9
Ours270.1323.8

