Article

Disturbance and Signal Filter for Power Line Communication

by
Krzysztof Bernacki
1,*,
Dominik Wybrańczyk
1,
Marcin Zygmanowski
2,
Andrzej Latko
2,
Jarosław Michalak
2 and
Zbigniew Rymarski
1
1
Institute of Electronics, Faculty of Automatic Control, Electronics and Computer Science, Silesian University of Technology, 44-100 Gliwice, Poland
2
Department of Power Electronics, Electrical Drives and Robotics, Faculty of Electrical Engineering, Silesian University of Technology, 44-100 Gliwice, Poland
*
Author to whom correspondence should be addressed.
Electronics 2019, 8(4), 378; https://doi.org/10.3390/electronics8040378
Submission received: 23 December 2018 / Revised: 21 March 2019 / Accepted: 23 March 2019 / Published: 28 March 2019
(This article belongs to the Special Issue Filter Design Solutions for RF systems)

Abstract

:
Today, to use home automation, intelligent home controls or remote controls in the office, electronic equipment is moving away from wireless communication in favor of Power Line Communication (PLC). In the standard PLC solutions, the corrections that result from error transmissions are based on complex digital modulation methods and algorithms for validating the transmitted data without paying attention to the causes of the errors. This article focuses on the implementation of a filtering system for interference and signals in the 120–150 kHz band (CENELEC band C), which is injected into the network by transmitters. Such a filter separates the desired signal from the interference that is occurring in the network, which can result in communication errors. Moreover, when used properly, the filter can be used as a subsystem separation element. The paper presents the requirements, design, construction, simulation and test results that were obtained under actual operating conditions. It is possible to use less complex methods for correcting errors in transmission signals and to guarantee an improvement in the transmission rate using the proposed filter system.

1. Introduction

Power line communication systems have been used for various purposes within a broad range of fields, including telephony [1], street lighting controls, intercoms [2] and power transmission systems for almost 100 years [3,4]. Currently, Power Line Communications (PLCs) have a wide range of applications in smart grids [5,6]. The smart building market is in an early stage of its development and has great potential for future growth. According to the report “Smart Building Market Industry Analysis, Size, Growth, Trends, Segment and Forecast 2016–2021” that was prepared by MarketsandMarkets, the value of this market will increase from 7.26 billion dollars to 36.40 billion dollars by 2021 and the expected annual growth rate will be 38% [7]. The idea of an intelligent building has already taken root in developed Asian countries and in the USA, and its rapid development in Europe is also predicted. The fact that this trend is supported by a European Union policy is not without significance and the promotion of energy efficiency and pro-ecological solutions, including intelligent constructions, has been mentioned among the priorities for the coming years [8,9,10,11]. As the current market for intelligent home management systems is heavily dominated by companies that only sell their products to individuals with a high property status, smart home furnishings are an expression of luxury and prestige [12,13,14]. However, there are innovative systems that are becoming available at an affordable price, whose target group will be households with a good or medium financial standing, including both the owners of newly built houses/flats as well as existing homes/apartments.
Intelligent building systems come in three forms. The first is comprised of wired systems that use a dedicated communication cable whose big advantage is its stability. However, due to the use of this dedicated communication cable, these systems require a rethinking of the deployment and a definition of the desired functionalities at the beginning of the investment. Therefore, choosing this system for apartments in the secondary market requires a costly renovation. Other disadvantages are their complicated configuration and high price. An alternative solution is a wireless system [15]. The advantages of wireless systems include the ability to adapt the intelligent system to any building and to ensure price competitiveness. On the other hand, due to electromagnetic interference in the buildings as well as difficulties in data transmission in the event of obstacles in the signal path and directives that limit the maximum allowable transmitting powers, these wireless systems do not always work stably. Systems that work in a mesh topology can compensate for the effects of unstable operations; however, due to their characteristics, if one of the elements fails, the system may cease to function completely. It should also be noted that the use of wireless solutions may become problematic in the near future due to the number of devices that operate in a wireless mode. IoT solutions should also be distinguished [16]. However, IoT solutions may encounter the same problems that were mentioned earlier for wireless products. The third possible solution is wired systems that have no additional communication cable. Such PLC systems communicate via power lines; thus, they combine stability with ease of use and can easily be adapted to existing buildings. A hybrid solution that uses both wired and wireless communication (such as PLC and wireless) [17,18,19] is a more expensive solution.
Particular attention should be paid to the Power Line Communication systems that communicate on the 230 VAC/50 Hz and 110 VAC/ 50–60Hz power lines, which can be easily adapted—each element that is connected to the power supply can simultaneously be connected to an intelligent building system [20,21].
Depending on the end application, broadband PLC [22] and low-frequency narrowband PLC will be discussed. Broadband PLC (also BPL—Broadband over Power Line) permits a >100 Mbps data rate and usually works on the 2–30 MHz band (also with the possibility to use 30–86 MHz as an additional bandwidth). BPL is usually used in applications for which a relatively high data rate (such as for PLC capabilities) is required, for example, for the in-home distribution of IPTV, HDTV, VoIP, internet content or for communication between electrical systems and appliances. The BPL standards usually define a protocol-dependent MAC layer. Advanced encryption such as a 128-bit AES (Advanced Encryption Standard) encryption for HomePlug AV can also be included. Although the end applications that use BPL offer a relatively high data rate, there are a few limitations such as a limited effective range, an unpredictable response time, an expensive large filter and matching circuits and relatively high processing needs (process encryption, PHY, MAC and IPv4/IPv6 layers). What is more, BPL can potentially cause electromagnetic interference problems in situations in which some of the energy is radiated as radio frequency interference. As for low-frequency narrowband PLCs, according to European CENELEC standard, few frequency bands have been defined for power line communication use. Frequency band A (9 to 95 kHz) is limited to use by energy providers. Although frequency band B (95 to 125 kHz) and frequency band D (140 to 148.5 kHz) are open for end-user applications, no access protocol has been defined. Frequency band C (125 to 140 kHz) is also open for end-user applications but CSMA/CA (Carrier Sense Multiple Access/Collision Avoidance) [23] protocol for the 132.5 kHz frequency has been defined. PRIME and G3 specifications, which are suitable for smart-metering applications [24] and have defined and structured PHY and MAC layers, should also be mentioned. There are also transceivers that are fully configurable. For a low-frequency narrowband PLC that has a scarifying data rate (up to 128 kbps) but has a large effective range (compared to BPL) and a fast response time, its filters and matching circuits are less expensive, and its processing needs are significantly less demanding—simple encryption and the possibility of defining its own MAC layer. The end application was defined as a power line communication home automation system in which short frames (commands) are exchanged between the nodes and for which the effective range and fast system response time is critical. Autonomous nodes are distributed in the system, and therefore a small form factor and low power consumption must be guaranteed. Inexpensive nodes and accompanying elements are also desirable. Therefore, a low-frequency narrowband power line communication opened for end-user applications with defined medium access control and advantageously without any protocol-dependent MAC was selected as one of the possible application scenarios.
In this case, a ready-made STEVAL-IHP005V1 development board with an ST7540 was used to perform the PLC communication tests. The line coupling interface was modified to allow the ST7540 device to transmit and receive on the AC mains line using the available FSK and PSK [25,26] modes within the European CENELEC EN50065-1 standard C band, which is specified for home network systems with the mandatory access protocol CSMA/CA. Customized software was developed for the STM32 microcontroller, which was included in the reference design in order to make it more flexible and suitable for use as a standalone smart PLC node [27].
Currently, many electric energy receivers are strongly non-linear. Unfortunately, these types of receivers often add disturbances to the power supply network in the frequency band that is used for PLC communication [28]. Under certain circumstances, these may interfere with system communication, thereby leading to delays in executing a command. In extremely unfavorable cases, they can prevent communication completely. One of the ways to avoid such problems with a connection is to create an appropriate communication protocol using the appropriate modulation for the signal transmission [29,30,31,32]. Unfortunately, in many cases [33], the application of even the most sophisticated communication protocol does not solve the problems connected with the transmission of a useful signal. An additional element of such a system operating using PLC technology should be a filter that separates the undesirable signals (noise, interference, disturbances, signals from other PLC network) from the desired signal in the transmission medium. There are many EMI filters [34,35] on the market, but only few fulfill PLC specific requirements. Usually, PLC EMI filters are relatively large and expensive three-phase filters that are intended to be placed in an electrical switchboard next to the main electricity switch. The cost and form factor of the available PLC EMI filters means that they are not suitable for distributed PLC home automation systems. What is more, in the event that the disturbance source is located after the EMI filter, the communication frequencies are vulnerable to disturbances. An example of such a disturbance source that is located inside the PLC network might be the LED power supply or a fluorescent lamp that is controlled by the home automation system.
There is a need for a compact, single-phase, low-current (5 A), cost-effective filter for the distributed PLC home automation applications that work in CENELEC band C. The main goal is to filter a disturbance source inside the home grid as well as to filter a disturbance source that is located near the communication node.

2. Filter Design

From the point of view of the application of a given electronic system, the basic task of filters is to suppress the undesirable component frequencies that may occur in the control signal. Filter systems are divided into different groups by considering the appropriate criteria. One of the most important of these divisions is the frequency band that is to be suppressed by the filter. Thus, there are different filters—low-pass, high-pass, band-pass including broadband and narrowband (selective) and band-stop—that suppress the signals in a specific frequency band [36]. Other criteria that are considered in the classification of the filters are, for example, the shape of the frequency characteristics: the amplitude and phase, the type of elements that are used and the technology in the system execution. Another important feature of a filter is its level. Filters at I, II and higher levels are used when the higher the filter level, the steeper the edges at the ends of the frequency response are and the frequency response (amplitude) is ideal (rectangular).
The article will focus on the design of an LC filter with chokes in the longitudinal branch and capacitors in the transverse branch as is shown with a diagram in Figure 1a. The role of the inductors is to increase the impedance for a high frequency differential mode component (current or voltage) and the capacitors constitute a low impedance path for differential disturbances at Terminals B1 and B2. In addition, the LC parameters were selected so that the resonance frequency was smaller than the 133 kHz communication frequency that had been selected for the purposes of the study and were of an inductance L = 66 μH and a capacity C = 200 nF, respectively. The influence of the change of the inductor parameters was also taken into account [37,38,39]. The impedance characteristics as seen from Terminals A1, A2 and Terminals B1, B2 are shown in Figure 2. For the communication frequency fcom = 133 kHz, the impedance module was ZAA = 49.17 Ω and ZBB = 6.71 Ω. Such impedance values effectively contribute to the filtering of high frequency disturbances in the communication band when the source of the disturbances is connected to Terminals B1, B2.
The paper will focus on an analysis of an LC filter with a structure as is shown in Figure 1b. Figure 1c presents parasitic resistance occurring in L and C. These values are dependent on the components and magnetic materials being used [38]. The solution uses two chokes with the toroidal core DTMSS-20/0.033/8.0-V with the inductance L1 = 33 μH (which gives inductance L = 66 μH) with an allowable current of 8 A and a resistance for the direct current of 15.9 mΩ (total RLdc = 31.8 mΩ). Two WIMA MKS 100 nF/630 V capacitors with a capacity of 100 nF were used. The filter schemes with a view of the printed circuit are shown in Figure 3.

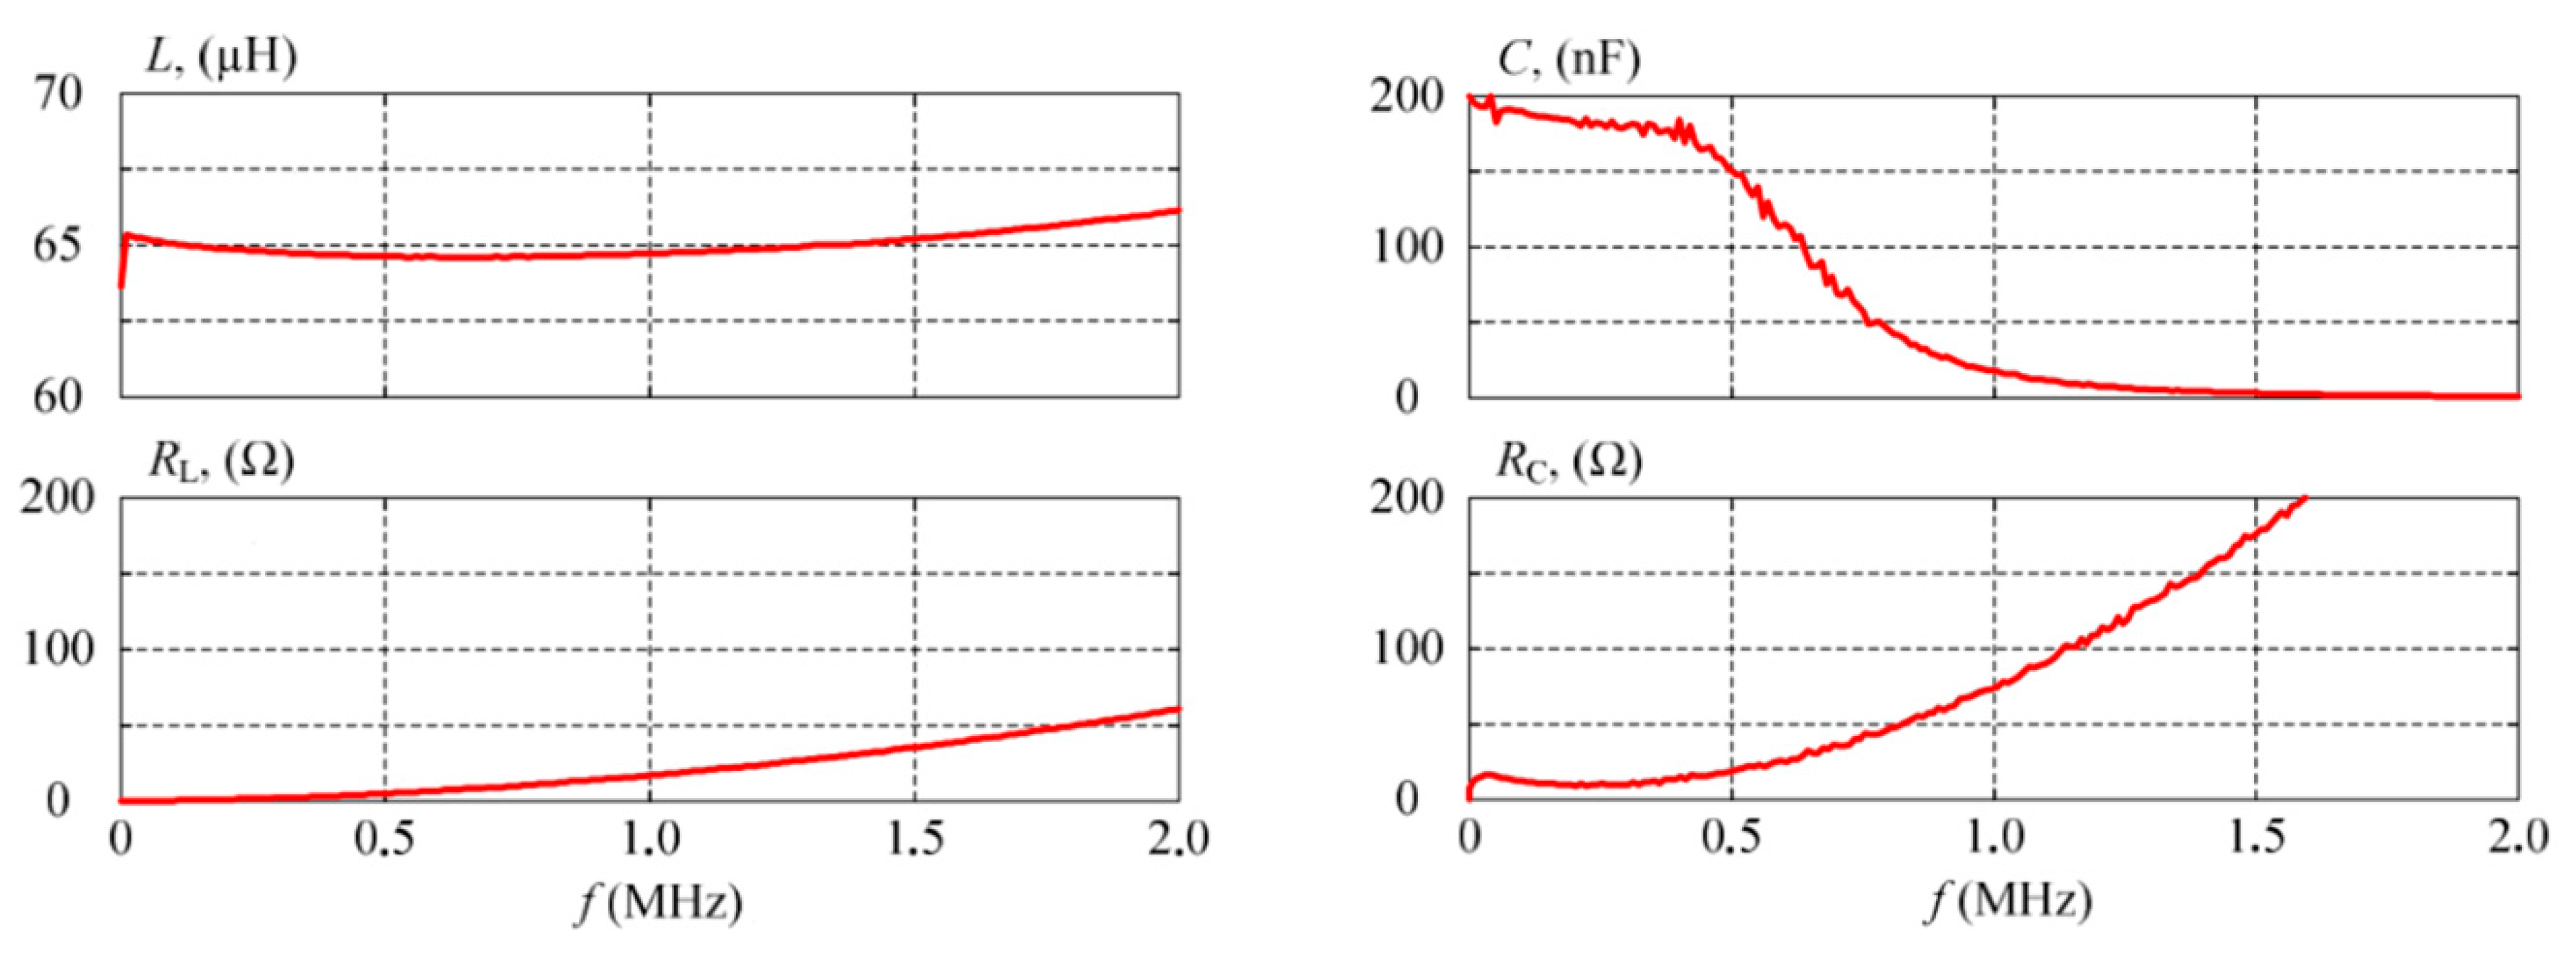
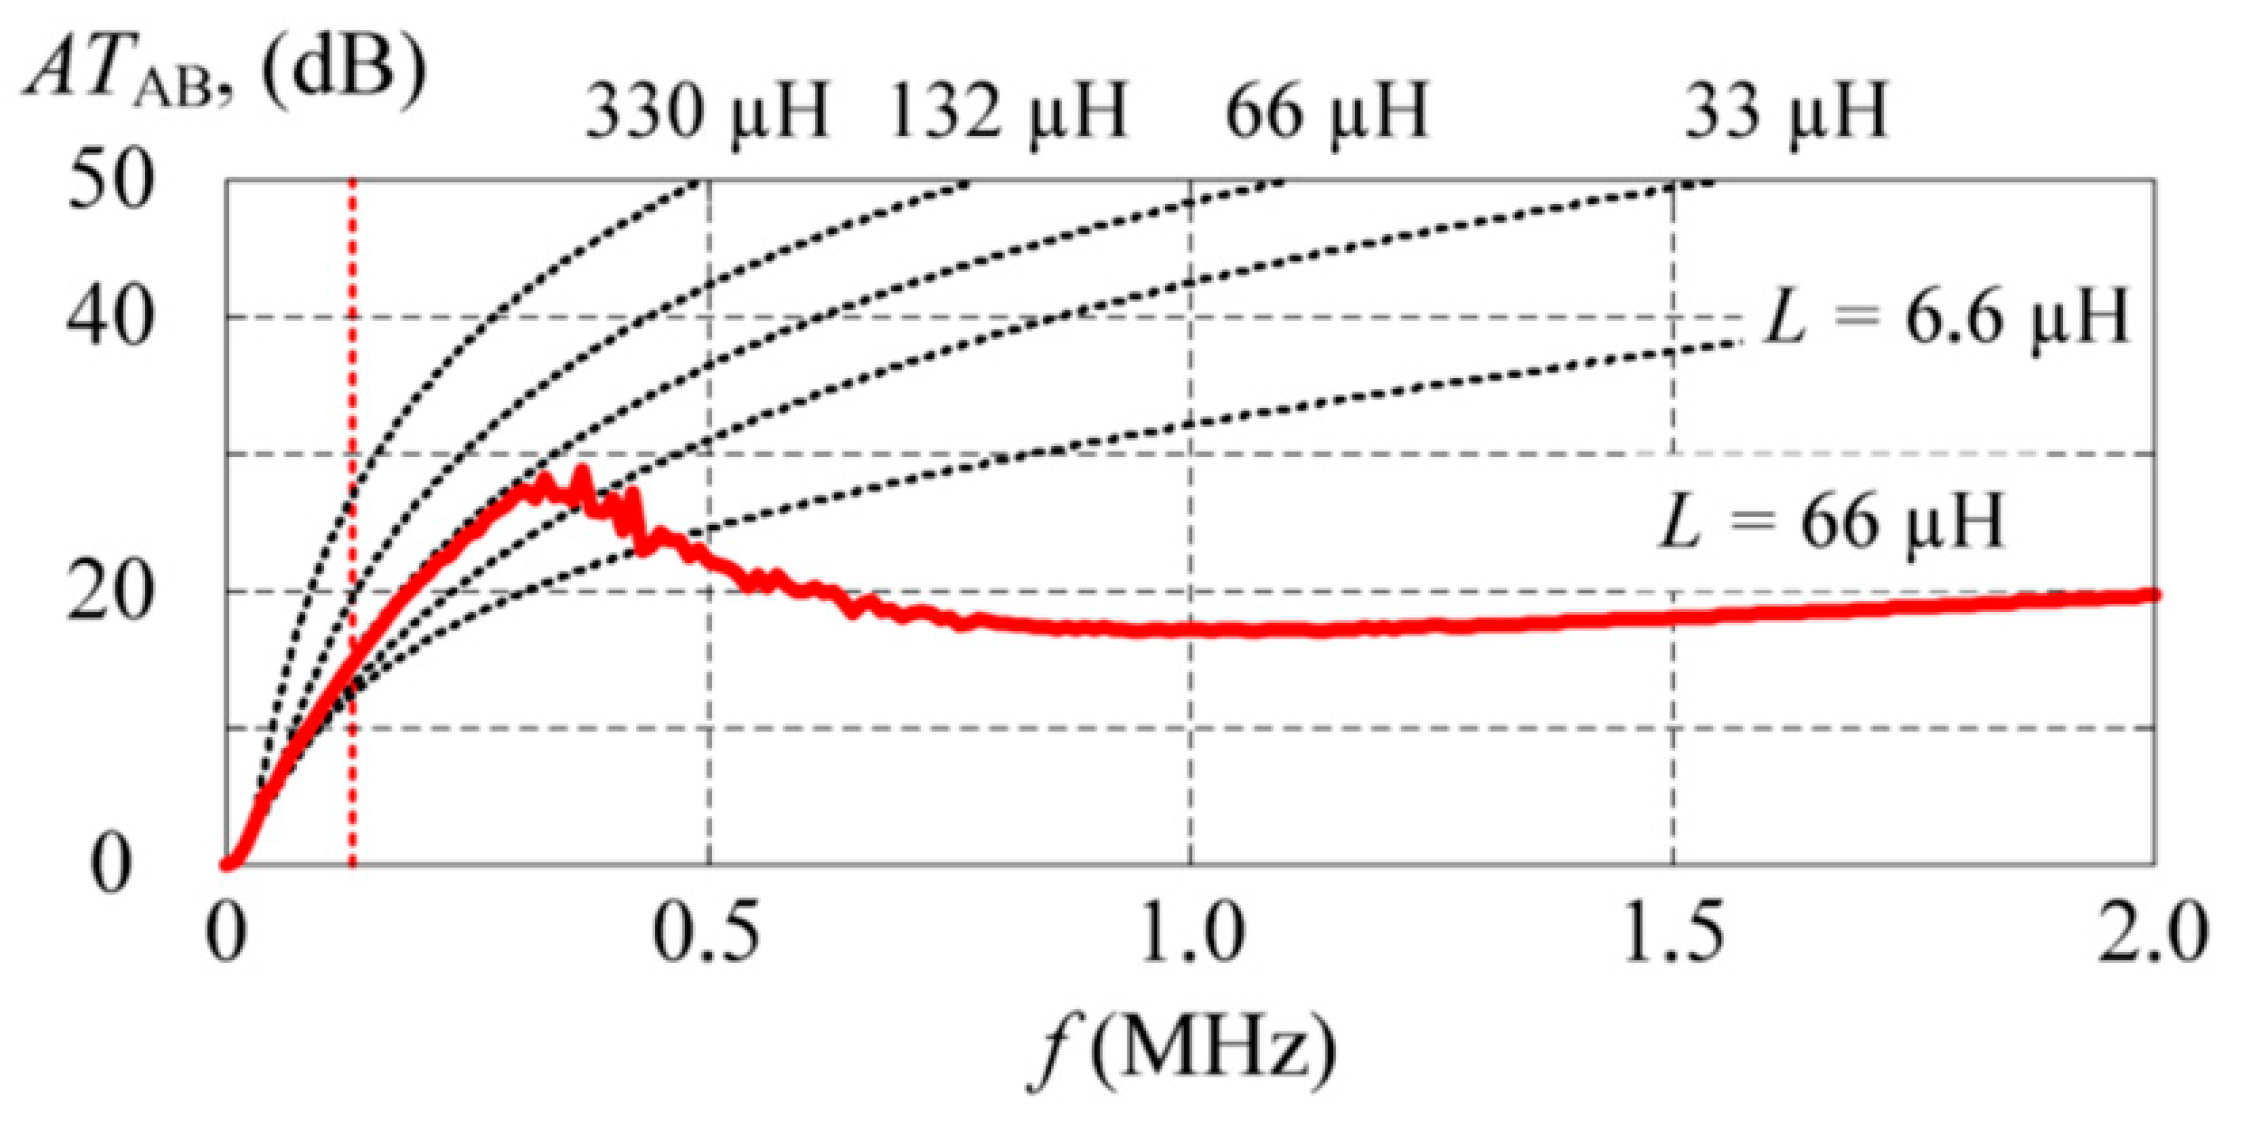
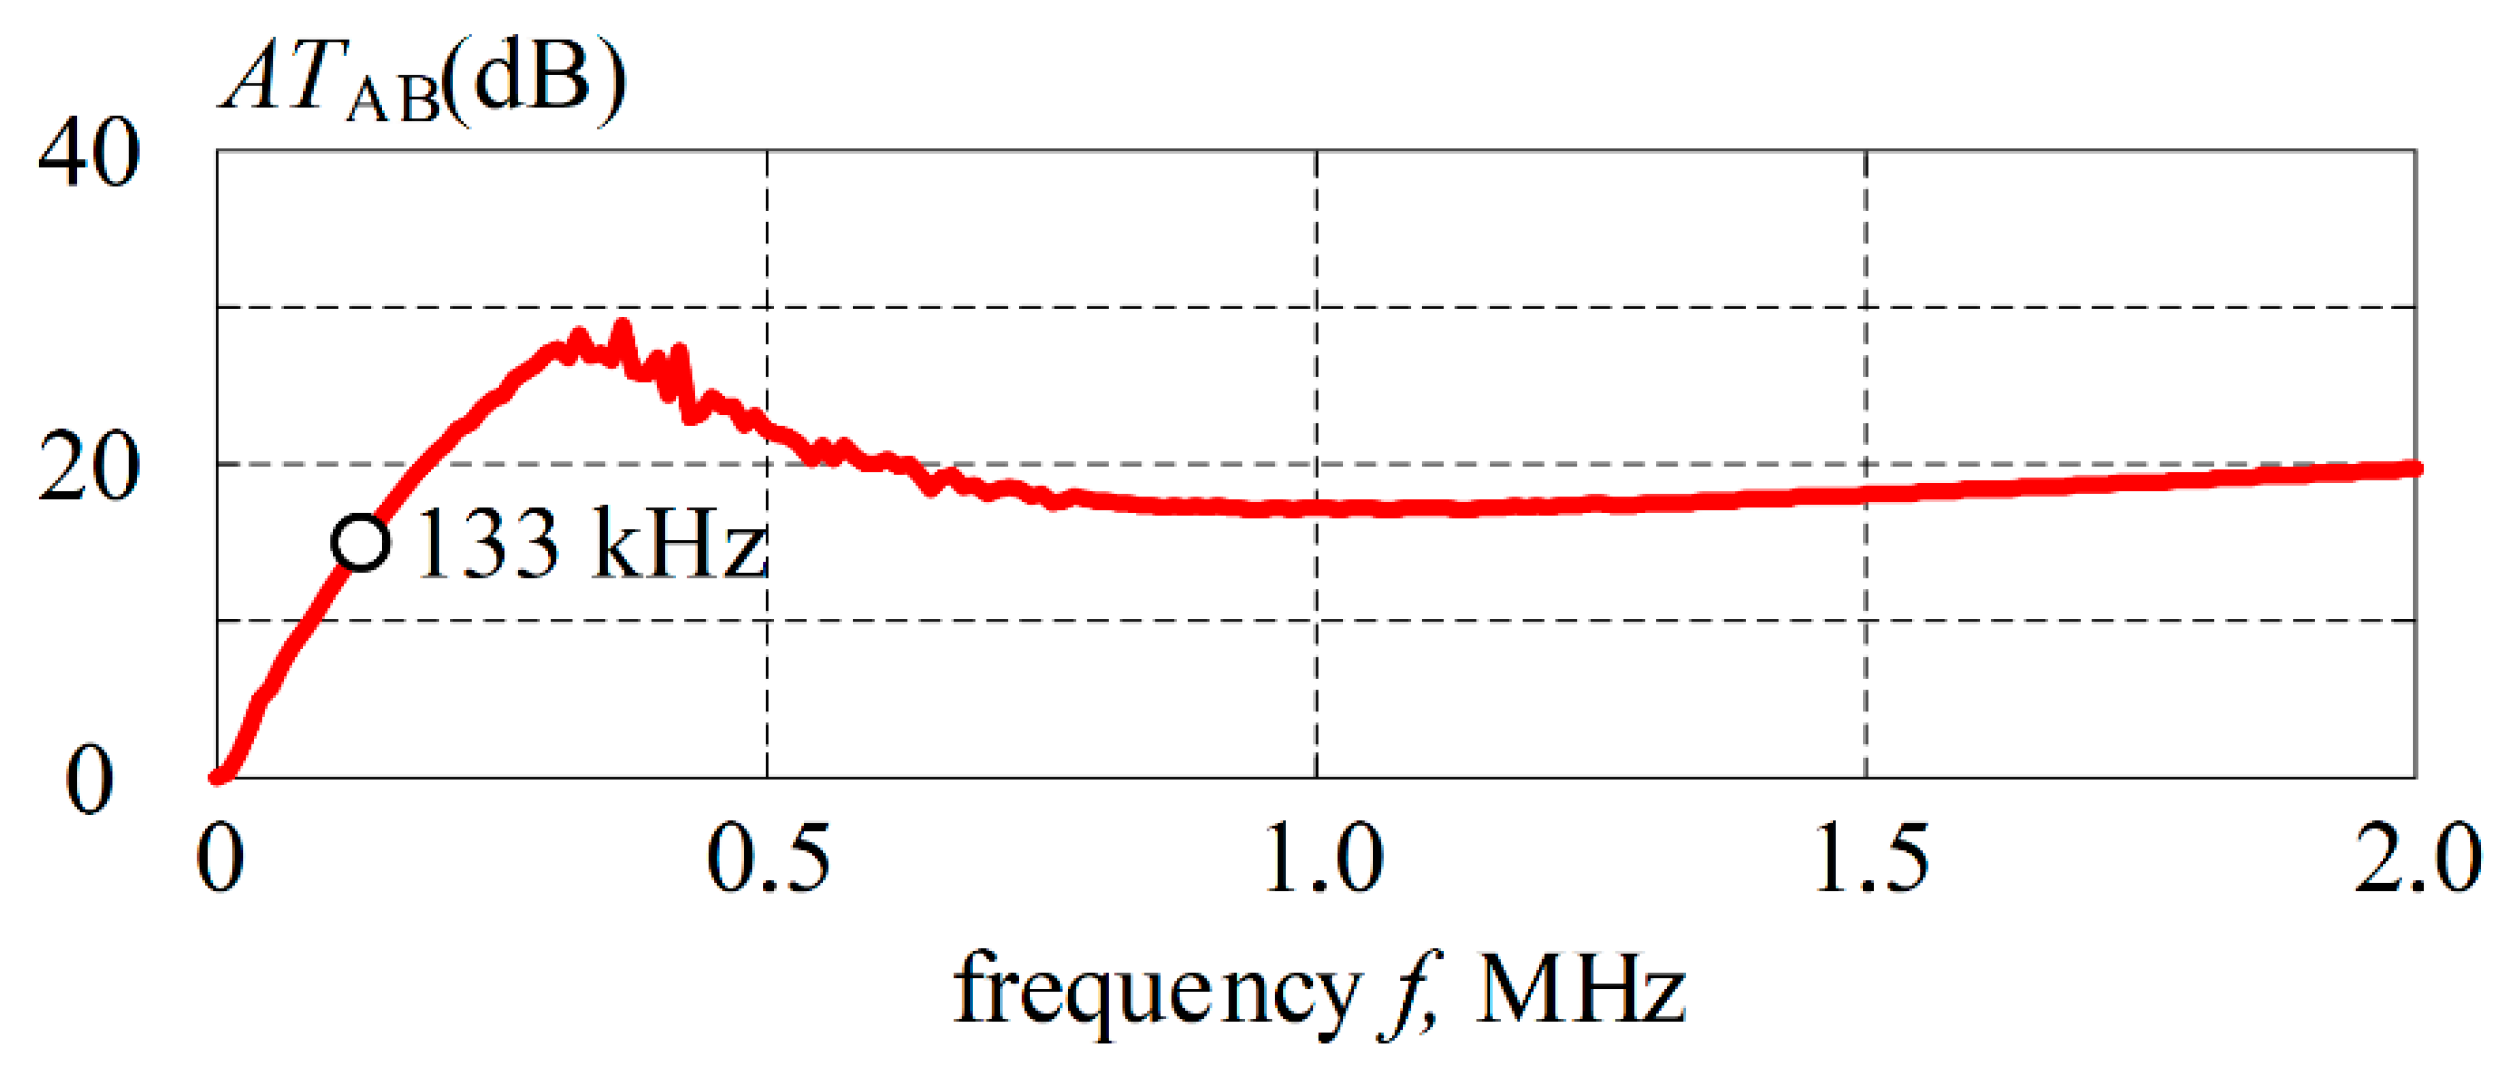
3. Insertion Loss Filter

In order to determine the insertion loss of the topology LC the filter in Figure 1, filter impedance was measured as a function of the frequency using an Agilent 4294 A Impedance Analyzer in a frequency range of 40 Hz to 2 MHz. Figure 1c shows the parasitic resistances of the reactors and capacitors, which, due to the impedance analyzer measurements, led to the determination of the actual parameters as a function of the frequency. The measurements were taken for Figure 3 of the filter. The filters for the SMD inductors were not analyzed because they had a different substitute pattern in which significant self-capacitances of the inductor winding were revealed. Using the toroid core revealed a relatively low self-capacitance of the inductor winding, and therefore, these inductors were taken into consideration for the filter design. Figure 4 presents the frequency characteristics of inductance L and resistance RL of the inductors as well as the capacitance C and resistance RC of the capacitor. The inductance of the inductor was practically constant as a function of frequency, but the capacity of the capacitor changed significantly.
According to the LC filter equivalent parameters, the insertion loss was determined from Terminals A1, A2 and from Terminals B1, B2. Both insertion losses were determined analytically for circuits as is shown in Figure 5. The insertion loss was defined as in Equation (1)
A T ( d B ) = 20 log | V 1 V 2 | .
Voltage V1 is the voltage that occurs on the standard resistor Rw = 50 Ω in a case in which there is no filter in the system (Figure 6a); and V2 is the output voltage on a standard resistor in a case in which the analyzed LC filter is connected between the Rw resistors (Figure 6b).
According to Figure 6, the following dependences on the voltages V1 and V2 can be determined as follows:
V 1 = V S 2 ,
V 2 = ( V S Z C R w Z C + R w R w + Z L + Z C R w Z C + R w ) ,
where Z C = 1 j ω C + R C ;   Z L = j ω L + R L , thus Equation (3) can be rewritten into Equation (4):
A T AB ( d B ) = 20 log | V S 2 V S Z C R w Z C + R w R w + Z L + Z C R w Z C + R w | = 20 log | 1 2 Z C R w Z C + R w R w + Z L + Z C R w Z C + R w | .
For the insertion loss that was measured from terminals B to A, the scheme is shown in Figure 5 applies.
Voltage V1 was the same as in the previous case V1 = VS/2. Voltage V2 was determined according to Equation (5) and the filter insertion loss is given as Equation (6).
V 2 = V S Z LCR Z LCR + R w R w + Z L R w ,
where Z LCR = ( Z L + R w ) Z C Z L + R w + Z C thus the filter insertion loss is given as
A T AB ( d B ) = 20 log | V S 2 V S ( Z LCR Z LCR + R w ) R w + Z L R w | = 20 log | 1 2 ( Z LCR Z LCR + R w ) R w + Z L R w | .
Equations (4) and (6) are simplified to the same form, which means that the insertion loss of the filter on the side of Terminals A and B are equal and can be described by Equation (7). The characteristics of the insertion loss are presented as the frequency function in Figure 7.
A T AB ( d B ) = A T BA ( d B ) = 20 log | 1 2 Z C R w R w ( Z C + Z L + R w ) + Z C ( Z L + R w ) | .
As can be seen in Figure 8, the insertion loss for the 133 kHz frequency that was determined was about 16 dB. Figure 7 shows the characteristics of the filter insertion loss along with the insertion loss of the lossless filters with different inductances and capacitances as a function of the frequency. The insertion loss characteristics are presented for the different inductance values assuming that the rated value was L = 66 μH and the characteristics are given for 0.1L, 0.5L, L, 2L, 5L. For the ideal filters, insertion loss values at f = 133 kHz were 12.5, 13.3, 15.4, 19.7 and 27.1 dB.
Figure 9 shows the filter insertion loss characteristics of the LC filter together with the ideal characteristics that were obtained for filters with different capacitance values with the assumption that C = 200 nF for 0.1C, 0.5C, C, 2C and 5C. With such insertion loss characteristics for the frequency f = 133 kHz, they were 0.9, 9.3, 15.4, 21.6 and 29.7 dB. Based on the actual characteristics, it can be seen that this solution is ideal for frequencies up to 350 kHz. The reason for the discrepancy between the actual insertion loss characteristics and the ideal characteristics was a decrease in the capacitor capacitance for the frequencies above 350 kHz (Figure 4), while the inductance of the chokes in the frequency range from 40 Hz to 2 MHz remained practically constant. The developed filter is a differential filter and the insertion loss for this filter will never be high as is the case with a common filter in which the common currents component are small.

4. Thermal Testing of the Filter

If the designed filter is applied next to the disturbance source, it might be exposed to difficult operating conditions such as a constant maximum current flow and poor air circulation. Therefore, heat tests were carried out at a rated current equal to 5 A. The solutions used elements whose rated currents exceeded a 5 A r.m.s. value. The tests were carried out with a load consisting of a set of power supplies with LED lighting that were connected in parallel with a fluorescent lamp and additionally with a thermoregulator with a thyristor voltage controller with an applied phase control. The sum of the currents of the load for the tests was set at 5.4 A. The measurements were performed at an ambient temperature of 19.3 °C. The temperature was measured using a ThermoGear G-30 InfReC thermal imaging camera and a universal meter with an APPA-305 temperature measurement. In each case, the temperature sensor was attached to the surfaces. Therefore, the value from the meter with the temperature sensor was taken as the actual value. A thermal camera was used to determine the points with highest temperature as well as the temperature distribution. In the case of a filter with toroidal throttles, the temperature at a current of 5.4 A in the steady state was 44 °C. The photograph from the thermal camera with the toroidal choke (Figure 10) for the steady state after heating the filter elements with the 5.4 A current indicated the temperature distribution on the individual elements. From this, it can be seen that the highest operating temperatures in the filter were observed in the inductors because they conducted the entire load current. However, their operating temperature remained relatively low.

5. Verification of the Correct Operation of the Developed Filter

The measurements were carried in five variants. The schematic of the measurement system is shown in Figure 11, Figure 12, Figure 13, Figure 14 and Figure 15 where: the AC source symbol together with yellow noise symbol represents real-life power grid connection, F—the designed filter, EMI—Schafner interference attenuation filter EMI FN 3256 [40], TPLC—transmitter (switch) of the PLC communication system, RPLC—communication system executive (receiver) and ChX—probe connection voltage differentials to the respective oscilloscope channels. The voltage spectra were measured using the FFT function. The scale of X: 50 kHz/div and Y: 10 dB/div was set and the offset was X: 0 Hz and Y: −30 dB. The load consisted of:
-
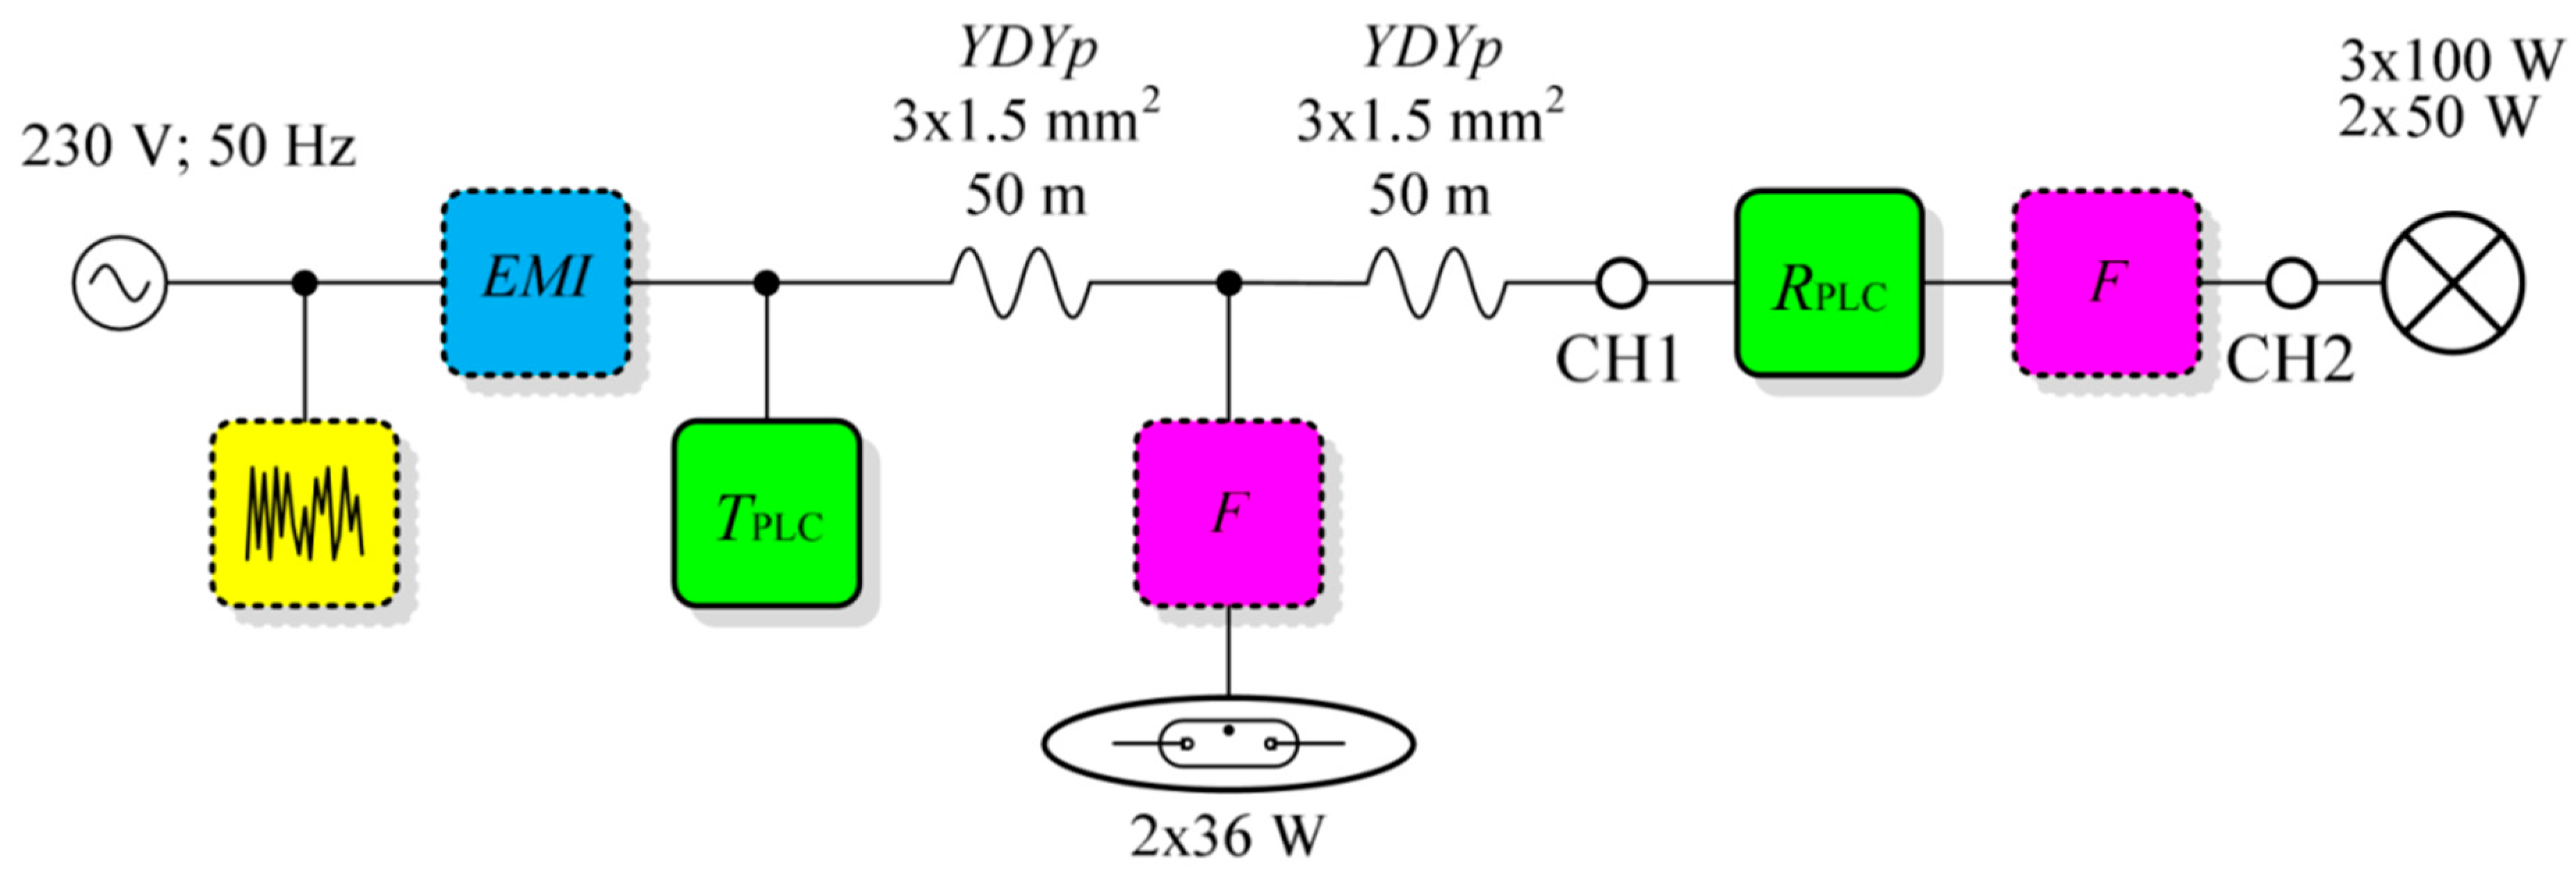
At the end of the supply line: 3 × 12 V/100 W halogen power supplies (each one) and 2 × 12 V/50 W halogen bulbs (each one);
-
In the middle of the power line: 1 × fluorescent lamp 2 × 36 W with an electronic ballast.
Additional tests without EMI filters were carried out. The schematic of the measurement system is shown in Figure 14 and Figure 15. Voltage waveforms and voltage harmonics spectra for the two variants configurations is shown in Figure 17.
Based on the results of the measurements (Figure 16 and Figure 17 and Table 1 and Table 2), it was found that:
  • non-linear type receivers and power supplies weakened the communication signal of the developed system significantly due to the capacitive filter in the input circuits of the power supplies;
  • the developed filter significantly improved the communication signal level of the developed system in each of the considered cases;
  • comparing the results for f1 and the measurements for the variant at UCH1 and UCH2, the difference in the signal levels at the input and output of the filter was about 5 dBV; however, it must be added that it is difficult to interpret this difference as an insertion loss because sources of interference were present on both sides of the filter;
  • by comparing the results for f2 and the measurements for the variant at UCH1 and UCH2, the difference in the signal levels was about 20 dBV;
  • adding a fluorescent luminaire in the middle of the model circuit line introduced additional disturbances; these disturbances occurred in the immediate vicinity of 133 kHz, which is used for the transmissions in the developed system;
  • it is reasonable to also use the filter for devices that are not controlled by a home automation system that has all types of power supplies installed in the immediate vicinity of the operating system; however, such receivers introduce disturbances that may interfere with the transmissions of the developed system;
  • by comparing the relevant cases, a significant reduction of interference at the level of 5 dBV and an improvement of the signal with a transmission frequency of 133 kHz at the level of 20 dBV can be observed, which proves the need to use correctly designed filters for communication in a PLC;
  • the use of an EMI filter at the input of the system also resulted in a very strong insertion loss of the communication signal of the developed system, due to the large capacity of the EMI filter;
  • obtained attenuation level is sufficient to filter both disturbances and communication signals around 133 kHz;
  • with specific filter applications, an independent communication subnetwork can be created (before and after designed filter), such application might be advantageous for PLC home automation system throughput and response time;

6. Statistical Tests Used to Verify the Correct Operation of the Filter in a Model System

In order to verify the correct operation of the filters in the model system, a series of statistical tests were performed with different topologies of the model system. Nonetheless, the topology was always based on the layout shown in Figure 13. In each case, the same board, ST7540 configuration, software, 20-byte frame and transmission scheme were used. The transmission scheme was a series of 50 switches ON and 50 switches OFF commands that were sent with one second delay in between transmissions. A carrier frequency of 132.5 kHz was used with a 2.4 kHz frequency deviation (131.348 kHz for “1” and 133.626 kHz for “0”) and 2400 Baud. To improve the robustness, Manchester coding was used. The Forward Error Correction (FEC) technique was used as the error correction mechanism. Situations of correct switching without the need for error correction (CS), correct switching after FEC correction (with FEC) and unsuccessful switching (US) were observed. The series of tests was performed for the following topologies of the model system:
  • TEST1—an EMI filter was connected at the model system input and a fluorescent lamp with a power supply system was connected in the middle of the wires, while LED lighting systems with power supply units, a fluorescent lamp and LED lighting were connected behind the proposed filter system (Figure 13).
  • TEST2—an EMI filter was present at the input of the model system and a fluorescent lamp with a power supply system was connected in the middle of the wires, LED lighting systems with power supplies worked as the receiver, a fluorescent lamp with no filter was connected and LED lighting was connected with the proposed filtering system (Figure 12).
  • TEST3—an EMI filter was present at the input of the model system, while LED lighting systems with power supplies and a fluorescent lamp with a power supply system worked as the receiver and the receivers were connected with the proposed filtering system (Figure 18).
  • TEST4—an EMI filter was present at the input of the system, while the receiver was used to work with the LED lighting systems with the power supplies and a fluorescent lamp with a power supply system and the receivers operated without the proposed filtering system (Figure 19).
Based on the statistical tests that were performed (Table 3), the following can be concluded:
  • in the case of the switch OFF tests, there were more problems with the transmission and cases in which there was no response to the signal from the transmitter more often. This was because the receivers generated interference that hindered the reception of the signals;
  • the absence of additional filters in the system made it practically impossible to control the receivers when connecting in the middle of wires or as a controlled receiver of the fluorescent lamp (TEST2 and TEST4);
  • in the case of an EMI filter and the use of the developed filters, full system efficiency was obtained from the point of view of controlling the receivers.

7. Conclusions

Today, PLC communication is being used more and more to implement home automation solutions as well as in intelligent homes and remote controls for electronic equipment. In the standard solutions, corrections resulting from error transmissions are based on complex digital modulation methods and algorithms for validating the transmitted data without paying attention to the origin of the errors. In this article, we have focused on the implementation of a filtering system for interference in the 120–150 kHz band that is introduced into the network by receivers. Such a filter separates the desired signal from the interference that occurs in a network, which can result in communication errors. An additional advantage of the developed solution is the ability to provide physical signal separation between two PLC sub-systems (before and after the filter system). This approach might possibly make the response faster and increase the throughput of PLC sub-systems. The entire project cycle was presented beginning with specifying the requirements, through the design, simulation, execution and testing under operating conditions. All of the tests were carried out in real life working conditions with an additional load and the validity and impact of using the EMI filter on the efficiency of information transmissions in the PLC was considered. Through these efforts, it was shown that by using an appropriate filtering system, it is possible to use less complex methods of error correction in the transmission of signals, thus enabling an increase in the transmission speed. In addition, due to the reduction in the complexity of the corrective methods, it is possible to use the computed savings in the capacities to implement other important functionalities or to improve the transmission security without affecting the transmission delay and user experience.

Author Contributions

Conceptualization, K.B. and D.W.; Methodology, D.W., K.B. and M.Z.; software, D.W. and K.B.; Validation, D.W., K.B., M.Z., A.L., J.M.; Formal analysis, D.W. and K.B.; Investigation, K.B., D.W.; Resources, D.W., K.B. and M.Z., Writing—original draft preparation, K.B.; Writing—review and editing D.W., K.B. and Z.R.; Visualization, K.B. and D.W.; Supervision, Z.R.; Funding acquisition, K.B.

Funding

This research was partially supported by the Polish Ministry of Science and Higher Education funding for statutory activities (BK, BKM) of the Institute of Electronics, Silesian University of Technology.

Acknowledgments

The calculations were performed using the IT infrastructure that was funded by the GeCONiI project (POIG.02.03.01-24-099/13).

Conflicts of Interest

The authors declare no conflict of interest.

References

  1. Schwartz, M. Carrier-wave telephony over power lines: Early history. IEEE Commun. Mag. 2009, 47, 14–18. [Google Scholar] [CrossRef]
  2. Whiffen, T.; Naylor, S.; Hill, J.; Smith, L.; Callan, P.; Gillott, M.; Wood, C.; Riffat, S. A concept review of power line communication in building energy management systems for the small to medium sized non-domestic built environment. Renew. Sustain. Energy Rev. 2016, 64, 618–633. [Google Scholar] [CrossRef]
  3. Alanne, K.; Cao, S. An overview of the concept and technology of ubiquitous energy. Appl. Energy 2019, 238, 284–302. [Google Scholar] [CrossRef]
  4. Arcia-Garibaldi, G.; Cruz-Romero, P.; Gómez-Expósito, A. Future power transmission: Visions, technologies and challenges. Renew. Sustain. Energy Rev. 2018, 94, 285–301. [Google Scholar] [CrossRef]
  5. Sendin, A.; Pena, I.; Angueira, P. Strategies for Power Line Communications Smart Metering Network Deployment. Energies 2014, 7, 2377–2420. [Google Scholar] [CrossRef] [Green Version]
  6. Sharma, K.; Saini, L.M. Power-line communications for smart grid: Progress, challenges, opportunities and status. Renew. Sustain. Energy Rev. 2017, 67, 704–751. [Google Scholar] [CrossRef]
  7. Available online: http://www.marketresearchstore.com/report/global-building-automation-systems-market-industry-analysis-73569 (accessed on 20 March 2019).
  8. Ikpehai, A.; Adebisi, B.; Rabie, K.; Haggar, R.; Baker, M. Experimental Study of 6LoPLC for Home Energy Management Systems. Energies 2016, 9, 1046. [Google Scholar] [CrossRef]
  9. Ikpehai, A.; Adebisi, B.; Rabie, K. Broadband PLC for Clustered Advanced Metering Infrastructure (AMI) Architecture. Energies 2016, 9, 569. [Google Scholar] [CrossRef]
  10. Mlynek, P.; Misurec, J.; Koutny, M. Modeling and evaluation of power line for Smart grid communication. Przegląd Elektrotechniczny 2011, 87, 228–232. [Google Scholar]
  11. Lesek, F.; Petr, F. A Multiconductor Model of Power Line Communication in Medium-Voltage Lines. Energies 2017, 10, 816. [Google Scholar]
  12. Galli, S.; Scaglione, A.; Wang, Z. For the grid and through the grid: The role of power line communications in the smart grid. Proc. IEEE 2011, 99, 998–1027. [Google Scholar] [CrossRef]
  13. Rastegar, M.; Fotuhi-Firuzabada, M.; Lehtonenb, M. Home load management in a residential energy hub. Electr. Power Syst. Res. 2015, 119, 322–328. [Google Scholar] [CrossRef]
  14. Zhu, Y.; Wu, J.; Wang, R.; Lin, Z.; He, X. Embedding Power Line Communication in Photovoltaic Optimizer by Modulating Data in Power Control Loop. IEEE Trans. Ind. Electron. 2019, 66, 3948–3958. [Google Scholar] [CrossRef]
  15. Elazhary, H. Internet of Things (IoT), mobile cloud, cloudlet, mobile IoT, IoT cloud, fog, mobile edge and edge emerging computing paradigms: Disambiguation and research directions. J. Netw. Comput. Appl. 2019, 128, 105–140. [Google Scholar] [CrossRef]
  16. Kamal, M.; Parvin, S.; Saleem, K.; Al-Hamadi, H.; Gawanmeh, A. Efficient low cost supervisory system for Internet of Things enabled smart home. In Proceedings of the IEEE International Conference on Communications Workshops, Paris, France, 21–25 May 2017; pp. 864–869. [Google Scholar]
  17. Li, M.; Lin, H. Design and Implementation of Smart Home Control Systems Based on Wireless Sensor Networks and Power Line Communications. IEEE Trans. Ind. Electron. 2015, 62, 4430–4442. [Google Scholar] [CrossRef]
  18. Mendes, T.; Godina, R.; Rodrigues, E.; Matias, J.; Catalão, J. Smart home communication technologies and applications: Wireless protocol assessment for home area network resources. Energies 2015, 8, 7279–7311. [Google Scholar] [CrossRef]
  19. Han, J.; Choi, C.; Park, W.; Lee, I.; Kim, S. Smart home energy management system including renewable energy based on ZigBee and PLC. IEEE Trans. Consum. Electron. 2014, 60, 198–202. [Google Scholar] [CrossRef]
  20. Fernandes, V.; Poor, H.; Ribeiro, M. Analyses of the Incomplete Low-Bit-Rate Hybrid PLC-Wireless Single-Relay Channel. IEEE Internet Things J. 2018, 5, 917–929. [Google Scholar] [CrossRef]
  21. Zhao, X.; Zhang, H.; Lu, W.; Li, L. Approach for modelling of broadband low-voltage PLC channels using graph theory. IET Commun. 2018, 12, 1524–1530. [Google Scholar] [CrossRef]
  22. Pinto-Benel, F.; Cruz-Roldán, F. Exploring the performance of prototype filters for broadband PLC. In Proceedings of the IEEE International Symposium on Power Line Communications and its Applications (ISPLC), Madrid, Spain, 3–5 April 2017; pp. 1–6. [Google Scholar]
  23. Choi, H.; Moon, J.; Lee, I.; Lee, H. Carrier Sense Multiple Access with Collision Resolution. IEEE Commun. Lett. 2013, 17, 1284–1287. [Google Scholar] [CrossRef]
  24. Lopez, G.; Moreno, J.I.; Amaris, H.; Salazar, F. Paving the road toward Smart Grids through large-scale advanced metering infrastructures. Electr. Power Syst. Res. 2015, 120, 194–205. [Google Scholar] [CrossRef]
  25. Peck, M.; Alvarez, G.; Coleman, B.; Moradi, H.; Forest, M.; Aalo, M. Modeling and Analysis of Power Line Communications for Application in Smart Grid. In Proceedings of the 15th LACCEI International Multi-Conference for Engineering, Education and Technology, Boca Raton, FL, USA, 19–21 July 2017; pp. 1–6. [Google Scholar]
  26. Cavdar, I.H. Performance analysis of FSK power line communications systems over the time-varying channels: Measurements and modeling. IEEE Trans. Power Deliv. 2004, 19, 111–117. [Google Scholar] [CrossRef]
  27. Available online: https://www.st.com/resource/en/data_brief/steval-ihp005v1.pdf (accessed on 20 March 2019).
  28. Lampe, L.; Rahman, M.; Saffar, H. Characteristics of power line networks: Diversity and interference alignment. In Proceedings of the IEEE International Symposium on Power Line Communications and its Applications (ISPLC), Madrid, Spain, 3–5 April 2017; pp. 1–6. [Google Scholar]
  29. Juwono, F.; Guo, Q.; Chen, Y.; Xu, L.; Huang, D.; Wong, K. Linear Combining of Nonlinear Preprocessors for OFDM-Based Power-Line Communications. IEEE Trans. Smart Grid 2016, 7, 253–260. [Google Scholar] [CrossRef]
  30. Cui, Y.; Liu, X.; Cao, J.; Xu, D. Network Performance Optimization for Low-Voltage Power Line Communications. Energies 2018, 11, 1266. [Google Scholar] [CrossRef]
  31. Nombela, F.; García, E.; Ureña, J.; Hernández, A.; Poudereux, P. Robust synchronization algorithm for broadband PLC based on Wavelet-OFDM. In Proceedings of the IEEE 20th Conference on Emerging Technologies & Factory Automation, Luxembourg, 8–11 September 2015; pp. 1–7. [Google Scholar]
  32. Mathur, A.; Bhatnagar, M.; Panigrahi, B. Maximum likelihood decoding of QPSK signal in power line communications over Nakagami-m additive noise. In Proceedings of the IEEE International Symposium on Power Line Communications and its Applications, Austin, TX, USA, 29 March–1 April 2015; pp. 7–12. [Google Scholar]
  33. Okazima, N.; Baba, Y.; Nagaoka, N.; Ametani, A.; Temma, K.; Shimomura, T. Propagation Characteristics of Power Line Communication Signals Along a Power Cable Having Semiconducting Layers. IEEE Trans. Electromagn. Compat. 2010, 52, 756–769. [Google Scholar] [CrossRef]
  34. Ozenbaugh, R.L. EMI Filter Design, 2nd ed.; Marcel Dekker Inc.: New York, NY, USA, 2001. [Google Scholar]
  35. Verma, R.; Maity, T.; Hofsajer, I. Multipath conductors for EMI filter: Recent developments. Iet Sci. Meas. Technol. 2018, 12, 575–580. [Google Scholar] [CrossRef]
  36. Das, J. Passive filters-potentialities and limitations. Ieee Trans. Ind. Appl. 2004, 40, 232–241. [Google Scholar] [CrossRef]
  37. Bernacki, K.; Rymarski, Z.; Dyga, Ł. Selecting the coil core powder material for the output filter of a voltage source inverter. Electron. Lett. 2017, 53, 1068–1069. [Google Scholar] [CrossRef]
  38. Rymarski, Z. Measuring the real parameters of single-phase voltage source inverters for UPS systems. Int. J. Electron. 2017, 104, 1020–1033. [Google Scholar] [CrossRef]
  39. Rymarski, Z.; Bernacki, K.; Dyga, Ł. The influence of the properties of magnetic materials on a voltage source inverter control. In Proceedings of the IEEE Conference on Control Applications (CCA), Nice/Antibes, France, 8–10 October 2014; pp. 1127–1132. [Google Scholar]
  40. Available online: https://www.schaffner.com/product-storage/datasheets/fn-3256/ (accessed on 20 March 2019).
Figure 1. Scheme of the LC single-phase filter with two 33 μH inductor chokes and two 100 nF capacitors: (a) scheme, (b) a substitute scheme of the ideal filter, (c) a filter scheme with the resistive parasitic elements indicated.
Electronics 08 00378 g001
Figure 2. Magnitudes of the impedances seen from terminals A1, A2, ZAA and B1, B2, ZBB given as the functions of the frequency for the designed filter.
Electronics 08 00378 g002
Figure 3. LC filter with two THT 33 μH chokes: (a) filter scheme, (b) 3D view of the board (57.5 mm width and 31.0 mm height, nominal current 5 A).
Electronics 08 00378 g003
Figure 4. Measured inductance, resistance of the filter inductor, capacitance and its series equivalent resistance of the filter capacitor.
Electronics 08 00378 g004
Figure 5. Schematics (circuits) in which the V1 and V2 voltages were obtained in order to calculate the insertion loss of the filter from Terminals B to A: (a) system without a filter—determination of the voltage V1 and (b) system with a filter—determination of the voltage V2.
Electronics 08 00378 g005
Figure 6. Circuit schemes for which the V1 and V2 voltages were required to determine the filter insertion loss from Terminals A to B: (a) system without a filter to determine voltage V1 and (b) system with a filter to determine voltage V2.
Electronics 08 00378 g006
Figure 7. Insertion loss characteristics of the experimental LC filter with the ideal characteristics given for different inductance values and a fixed capacitance of C = 200 nF.
Electronics 08 00378 g007
Figure 8. Insertion loss of the LC filter with two 33 μH inductions.
Electronics 08 00378 g008
Figure 9. Insertion loss characteristics of the experimental LC filter with the ideal characteristics given for different values of the capacitances and a fixed inductance of L = 66 μH.
Electronics 08 00378 g009
Figure 10. Thermographic photograph of the filter.
Electronics 08 00378 g010
Figure 11. Connection schematic of the model with an EMI filter and without an additional receiver connected in the middle of the line—Variant 1.
Electronics 08 00378 g011
Figure 12. Connection schematic of the model with an EMI filter and an additional receiver connected in the middle of the line (without an F filter)—Variant 2.
Electronics 08 00378 g012
Figure 13. Connection schematic of the model with an EMI filter and an additional receiver connected in the middle of the line by an F filter—Variant 3.
Electronics 08 00378 g013
Figure 14. Connection schematic of the model without an EMI filter and with an additional receiver connected in the middle of the line (without the F filter)—Variant 4.
Electronics 08 00378 g014
Figure 15. Connection schematic of the model without an EMI filter and with an additional receiver connected in the middle of the line by the F filter—Variant 5.
Electronics 08 00378 g015
Figure 16. Voltage waveforms and voltage harmonics spectra for the various configurations of the system with the developed filter (X: 50 kHz/div and Y: 10 dB/div). System status: TPLC: broadcast ON; RPLC: ON, measured/analyzed voltages UCH1 and UCH2; measured frequency signal level f1 is the intersection of the black lines and the measured frequency signal level f2 is the intersection of the red lines.
Electronics 08 00378 g016
Figure 17. Voltage waveforms and voltage harmonics spectra for the various configurations of the system with the developed filter (X: 50 kHz/div and Y: 10 dB/div). System status: TPLC: broadcast ON; RPLC: ON, measured/analyzed voltages UCH1 and UCH2; measured frequency signal level f1 is the intersection of the black lines and the measured frequency signal level f2 is the intersection of the red lines.
Electronics 08 00378 g017
Figure 18. Connection schematic of the model with an EMI filter while LED lighting systems with power supplies and a fluorescent lamp with a power supply system working as the receiver, the receivers were connected with the proposed filtering system (TEST 3).
Electronics 08 00378 g018
Figure 19. Connection schematic of the model with an EMI filter while LED lighting systems with power supplies and a fluorescent lamp with a power supply system working as the receiver, the receivers were connected without the proposed filtering system (TEST 4).
Electronics 08 00378 g019
Table 1. List of the signal level measurements for the frequency f2 = 133 kHz and for the highest disturbance components f1.
NumberVariantf1
[kHz]
Uf1
[dBV]
f2
[kHz]
Uf2
[dBV]
1.1a/UCH173−20.0133−11.9
2.1b/UCH273−15.6133−35.0
4.2c/UCH173−21.9133−21.3
5.2d/UCH273−14.4133−39.1
7.3e/UCH183−18.8133−11.9
8.3f/UCH276−13.1133−34.4
Table 2. List of the signal level measurements for the frequency f2 = 133 kHz and for the highest disturbance components f1.
NumberVariantf1
[kHz]
Uf1
[dBV]
f2
[kHz]
Uf2
[dBV]
1.4a/UCH184−17.2133−11.6
2.4b/UCH274−13.8133−36.5
3.5c/UCH182−22.8133−4.1
4.5d/UCH282−15.6133−35.0
Table 3. Results of the statistical tests, correct switching (CS), unsuccessful switching (US) and correct switching with Forward Error Correction (FEC).
NumberSetting the ModelSwitch ONSwitch OFF
CSWith FECUSCSWith FECUS
1.TEST13020035150
2.TEST202480248
3.TEST32624030200
4.TEST405000248

