Article

A Topology-Based Approach to Improve Vehicle-Level Electromagnetic Radiation

1
School of Automotive Engineering, Chongqing University, Chongqing 400000, Chnia
2
China Automotive Technology and Research Center, Tianjin 300300, China
*
Author to whom correspondence should be addressed.
Electronics 2019, 8(3), 364; https://doi.org/10.3390/electronics8030364
Submission received: 27 January 2019 / Revised: 11 March 2019 / Accepted: 20 March 2019 / Published: 25 March 2019
(This article belongs to the Special Issue Industrial Applications of Power Electronics)

Abstract

:
The popularity of the electric vehicle (EV) brings us many challenges of electromagnetic compatibility (EMC). Automotive manufacturers are obliged to keep their products in compliance with EMC regulations. However, the EV is a complex system composed of various electromagnetic interferences (EMI), sensitive equipment and complicated coupling paths, which pose great challenges to the efficient troubleshooting of EMC problems. This paper presents an electromagnetic topology (EMT) based model and analysis method for vehicle-level EMI prediction, which decomposes an EV into multi-subsystems and transforms electromagnetic coupling paths into network parameters. This way, each part could be modelled separately with different technologies and vehicle-level EMI was able to be predicted by algebra calculations. The effectiveness of the proposed method was validated by comparing predicted vehicle-radiated emissions at low frequency with experimental results, and application to the troubleshooting of emission problems.

1. Introduction

With the rising demand of the electric vehicle (EV), the electromagnetic environment deteriorates rapidly because of the big voltage, great current and high frequency in a limited vehicle space [1,2]. The EV is a source of radiation, and where human beings travel as passengers or drivers, so human exposure conditions are always taken into account in the study of electromagnetic compatibility (EMC) conditions. Due to the body shielding effect [3], a certain amount of electromagnetic radiation is absorbed depending on several factors, such as the frequency and polarization of signal, and the features of environment [4]. To prevent electromagnetic interference (EMI) generated by onboard electronic/electrical components from breaking down the operation of other equipment components, EVs are obliged to satisfy special component and vehicle level EMC regulations, such as CISPR 12 and SAE J551-5 [5]. However, such tests cannot be conducted until the components are confirmed and the vehicle layout is established, which is at a very late stage in the vehicle development process, and many resources are required to find out and solve electromagnetic compatibility (EMC) problems. To improve the development efficiency, numerical simulation technologies have been gradually adopted for early stages by automotive manufacturers to predict and troubleshoot according to some improvement measures, such as change of vehicle layout, usage of special wires, shielding bodies, circuit filters, etc. [6,7]
Many efforts have been attempted and presented to improve EV EMC by controlling the interference sources [8,9,10,11,12]. For example, the authors of Reference [9] studied the internal noise transmission path of a high-power DC/DC converter based on which some interference suppression methods were suggested. A new active filter for the high frequency common mode (CM) currents of a motor driver was designed to reduce the radiated emission [10]. Nevertheless, vehicle-level EMC problems are associated with not only components but also factors such as body structure, vehicle layout, cable routing, etc. [2]. Moreover, even if all modules satisfy their EMC requirements, there may still exist vehicle-level EMC problems. It is necessary to model and simulate the vehicle-level EMC from early development stages.
There are primarily two ways to model and simulate EMC problems of such complex systems as EV. One is realized by transforming the electromagnetic coupling, parasitic effects, generation of interferences, etc., into equivalent circuits with lumped parameters [13,14,15,16,17]. Reference [13] extracted the conducted electromagnetic disturbance parameters of the wiring system using the partial element equivalent circuit method. Additionally, the connector was further considered [14]. Reference [15] presented a transmission line theory-based approach to predict the EMI induced on the communication network. Because of the difficulty in fitting with the equivalent circuits, especially when the considered frequency is very high, this method is limited to the low frequency range and used in conducted problems [16,17]. Moreover, extensive experience is required to determine the parts needed to be modeled exactly, especially when the analyzed system is very complicated. Reference [18] divided the vehicle-level EMC problem into electrical large and small parts, and then the multi-port network was adopted to predict the emission. This technique can be used in the high frequency range, but the whole system is required to be modeled to acquire the network parameter. Reference [19] studied the EMI generated by the power inverter system in EV based on series of a two-port network.
The other ignores the internal details and adopts transfer functions to describe both conducted and radiated process, which makes it easy to use in practice [20]. Among these types of methods, electromagnetic topology (EMT) is representative. It decomposes a large and complex system into multi-subsystems according to the electromagnetic shielding level [21,22,23], and can be successfully applied to evaluate the EMC performance of a Boeing 707 airplane [21]. The confidence level of prediction relies heavily on the accuracy of the transfer function, which varies with the impedance of connected ports. This implies that all actual components are required to be present and interconnected correctly to obtain accurate transfer functions and any change may result in a new model process of the whole system.
To overcome these problems, this paper proposes a topology-based method to predict vehicle-level EMI from 150 kHz to 30 MHz. This method adopts multi-port networks to describe the subsystem of EMT, which decouples the characteristic coupling among ports and transfer paths, and enables each part to be modeled separately with different technologies. The algebra equation of this topological model is derived to solve the radiated EMI analytically. Furthermore, the main interference source is found by the sensitivity analysis using this model. This paper is organized as follows: Section 2 introduces the methods and materials of modelling for the studied EMC problems of EV. Section 3 analyzes the predicted and diagnostic results and Section 4 concludes the paper.

2. Methods and Materials

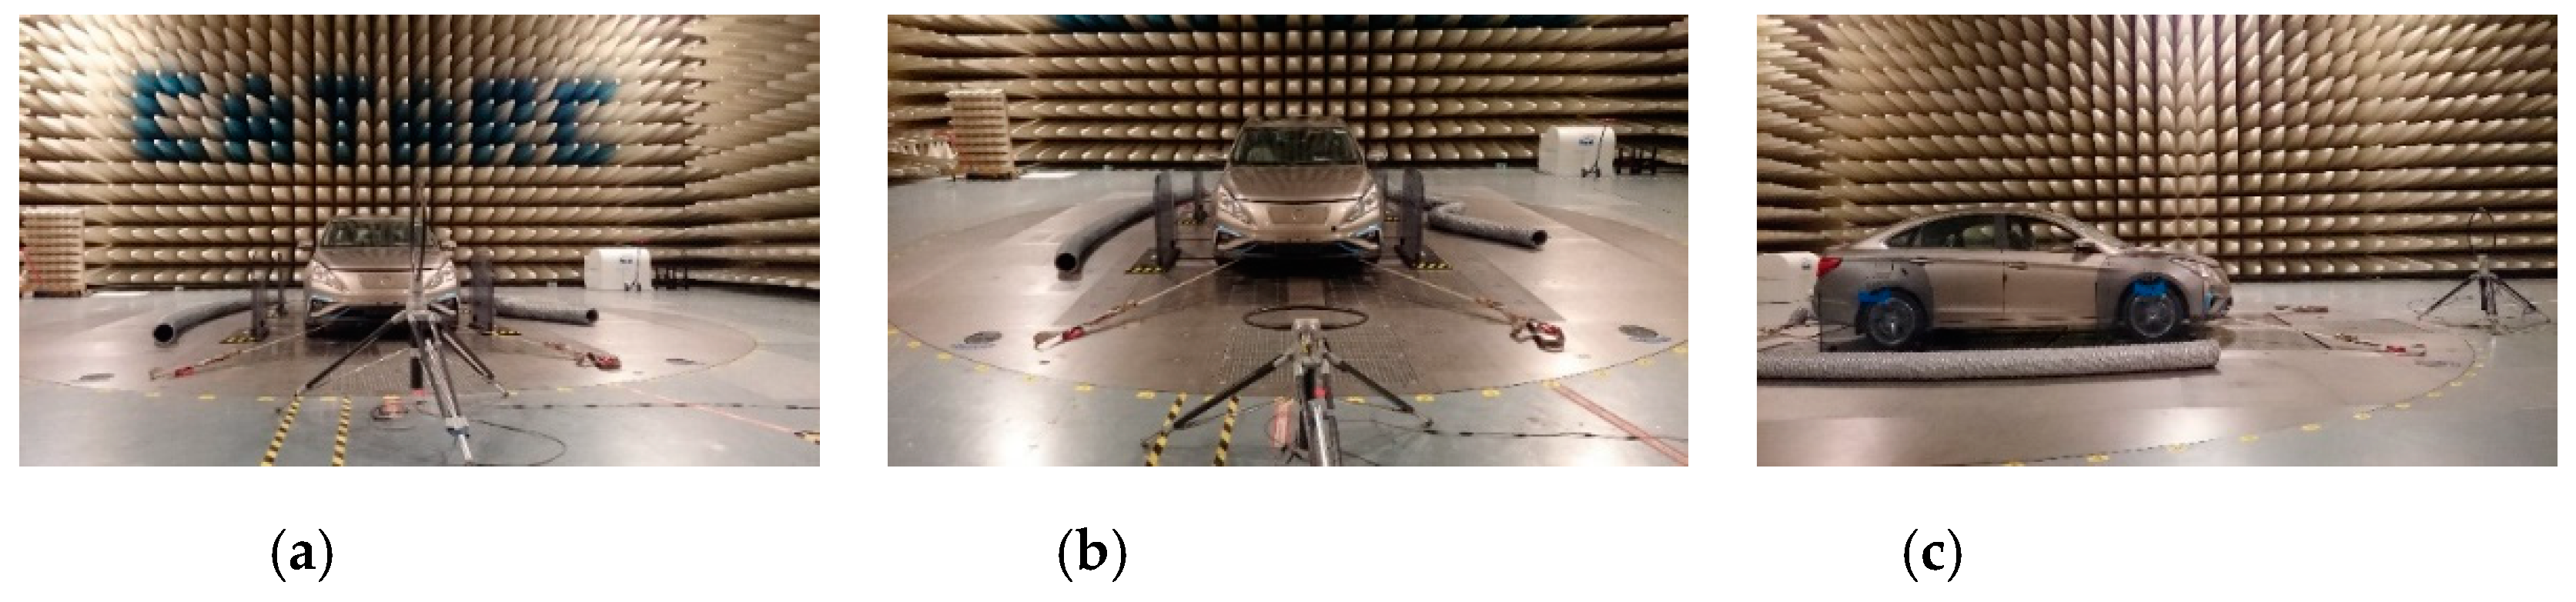
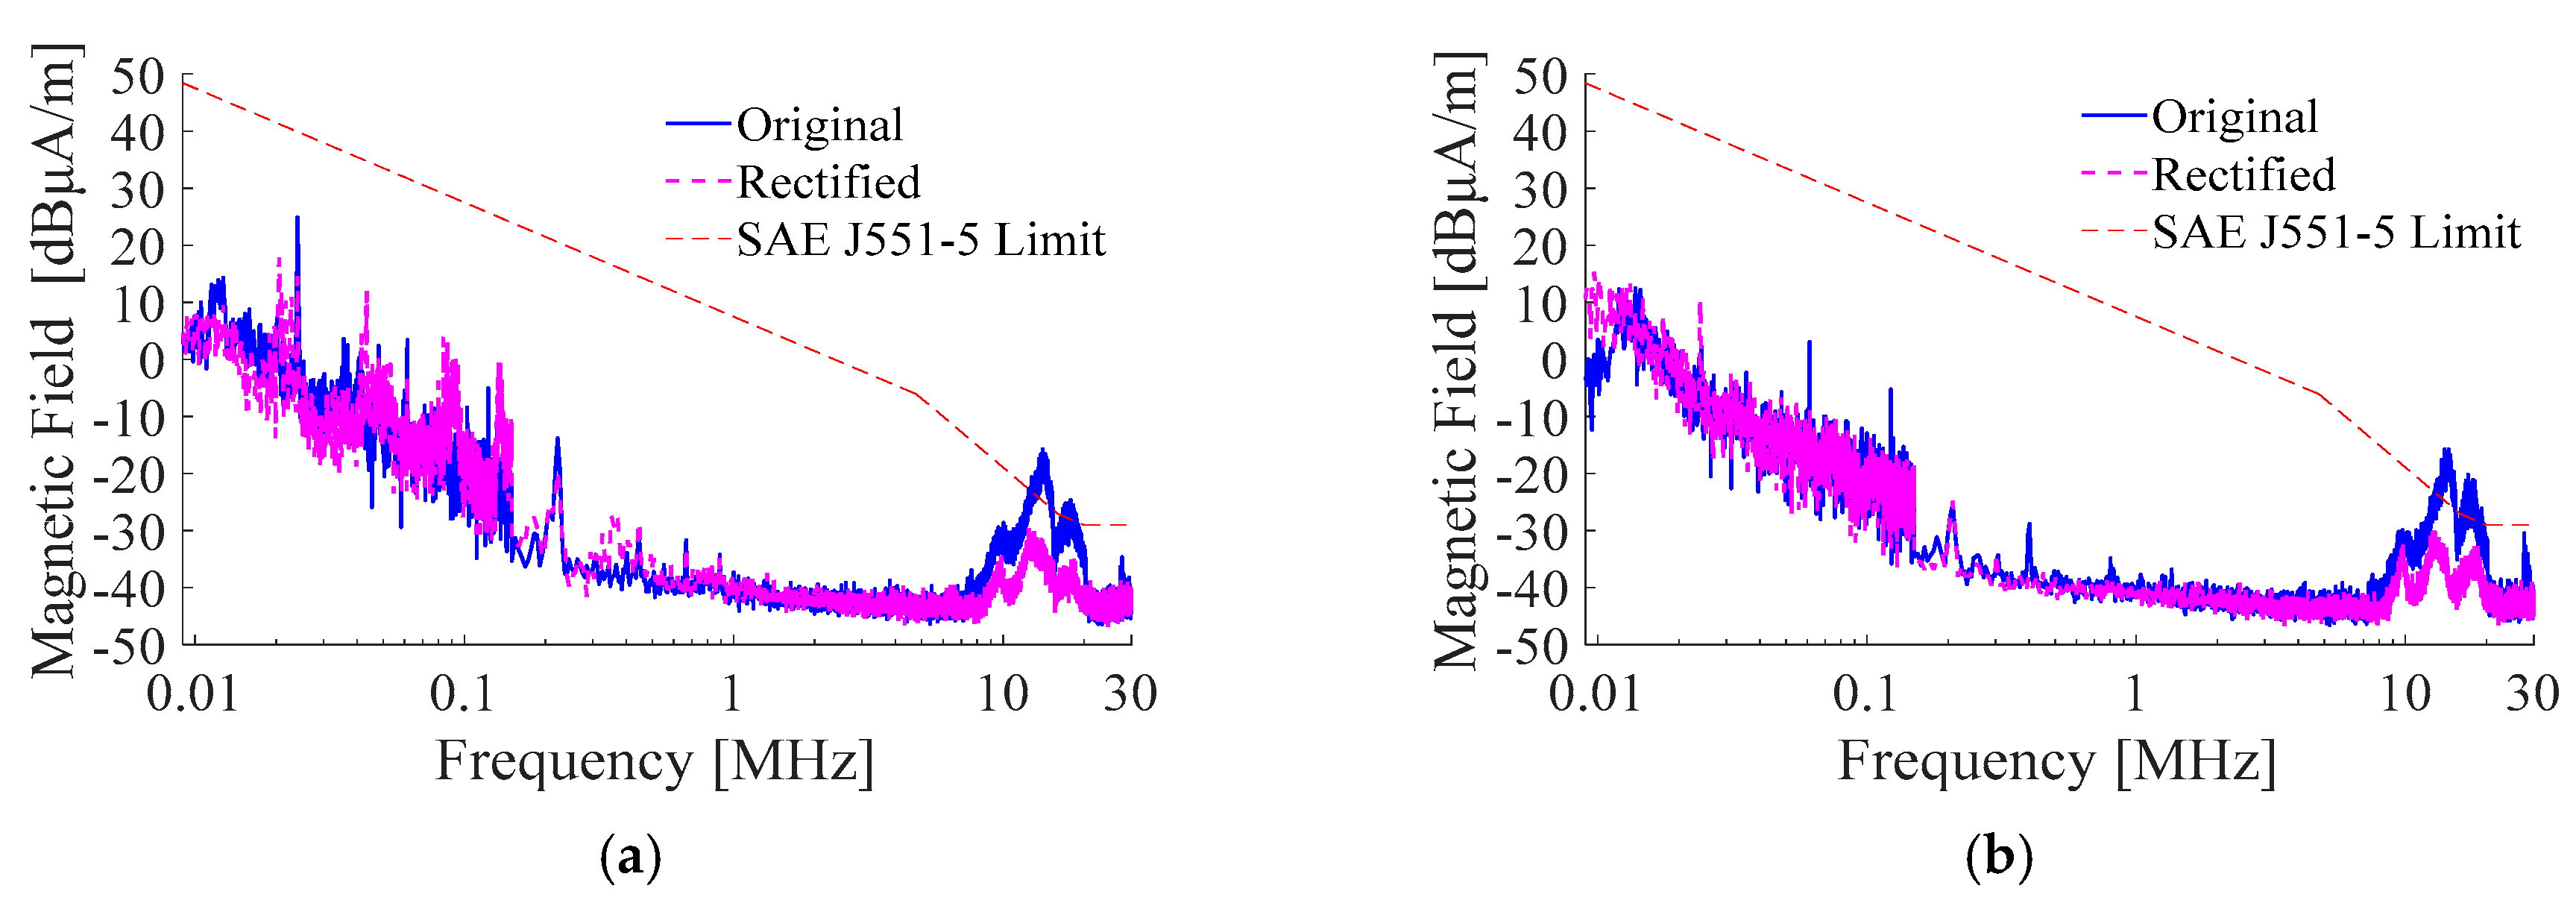
The studied sedan was electric and obliged to satisfy the regulation SAE J551-5. The vehicle running state and test system layout were consistent with this regulation during the testing. The antenna was positioned 1 m above the ground and 3 m away from EV body. Figure 1 shows the layout of the loop antenna when measuring the radiated magnetic emission at the front side of the vehicle as an example.
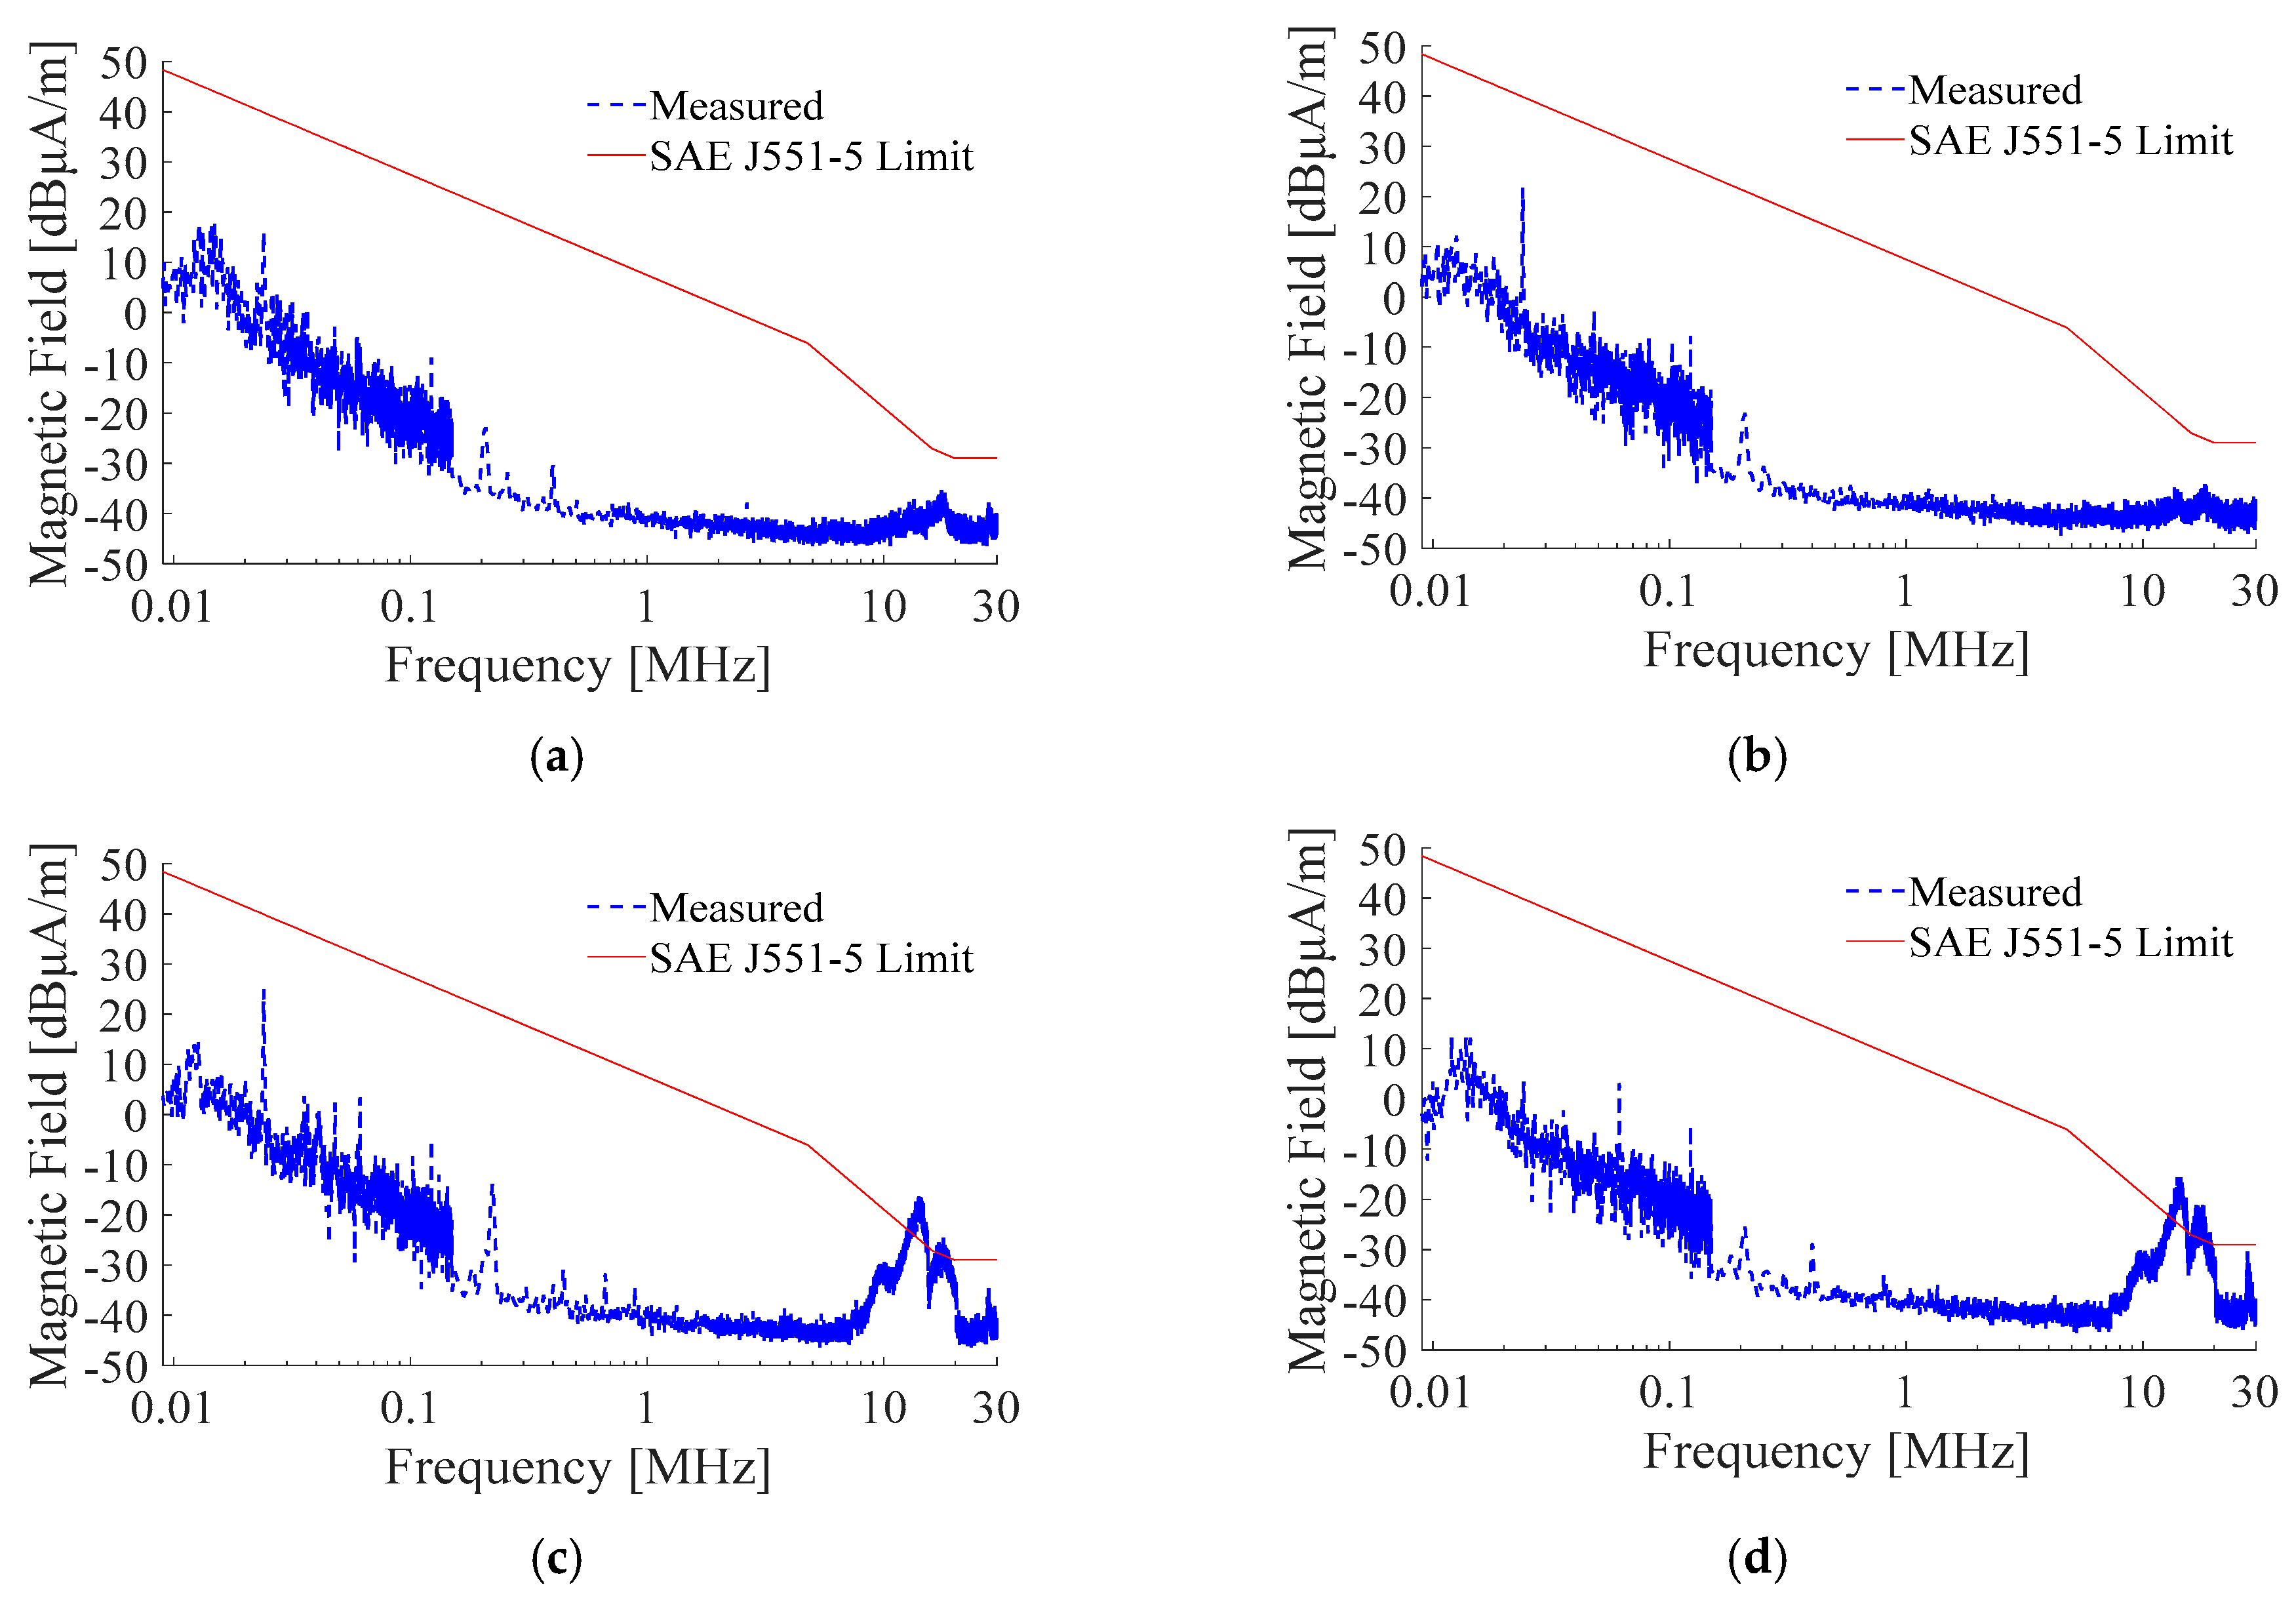
Its radiated electric field was below the regulation limit, while the magnetic emission exceeded as shown in Figure 2, which only shows some results. During testing, the radiated emission was measured at four directions around the vehicle, the electric field was measured by a rod antenna with vertical polarization, and x, y, z polarization directions for loop antenna when measuring the magnetic field (Figure 1). From the test results, the radiated magnetic field on both left and right side exceeded the limit by about 10 dB at the frequency around 18 MHz. Since the vehicle layout was delivered and fixed, it was almost impossible to change the component arrangement and electrical system, and one feasible way would have been to find out and improve the main interference source. One way to identify the source is by comparing the emissions under different combinational running states by switching on/off components. It is very resource-consuming and cannot provide an efficient improvement measure. In this paper, a numerical way is presented to identify the main interference source and reduce the radiated emission of EV.

2.1. Modelling of Vehicle Level Radiation

The radiated emission at low frequency was mainly caused by the high-voltage system of the EV, and so first the high-voltage system was analyzed to find out what and how to model.

2.1.1. High-Voltage System Analysis

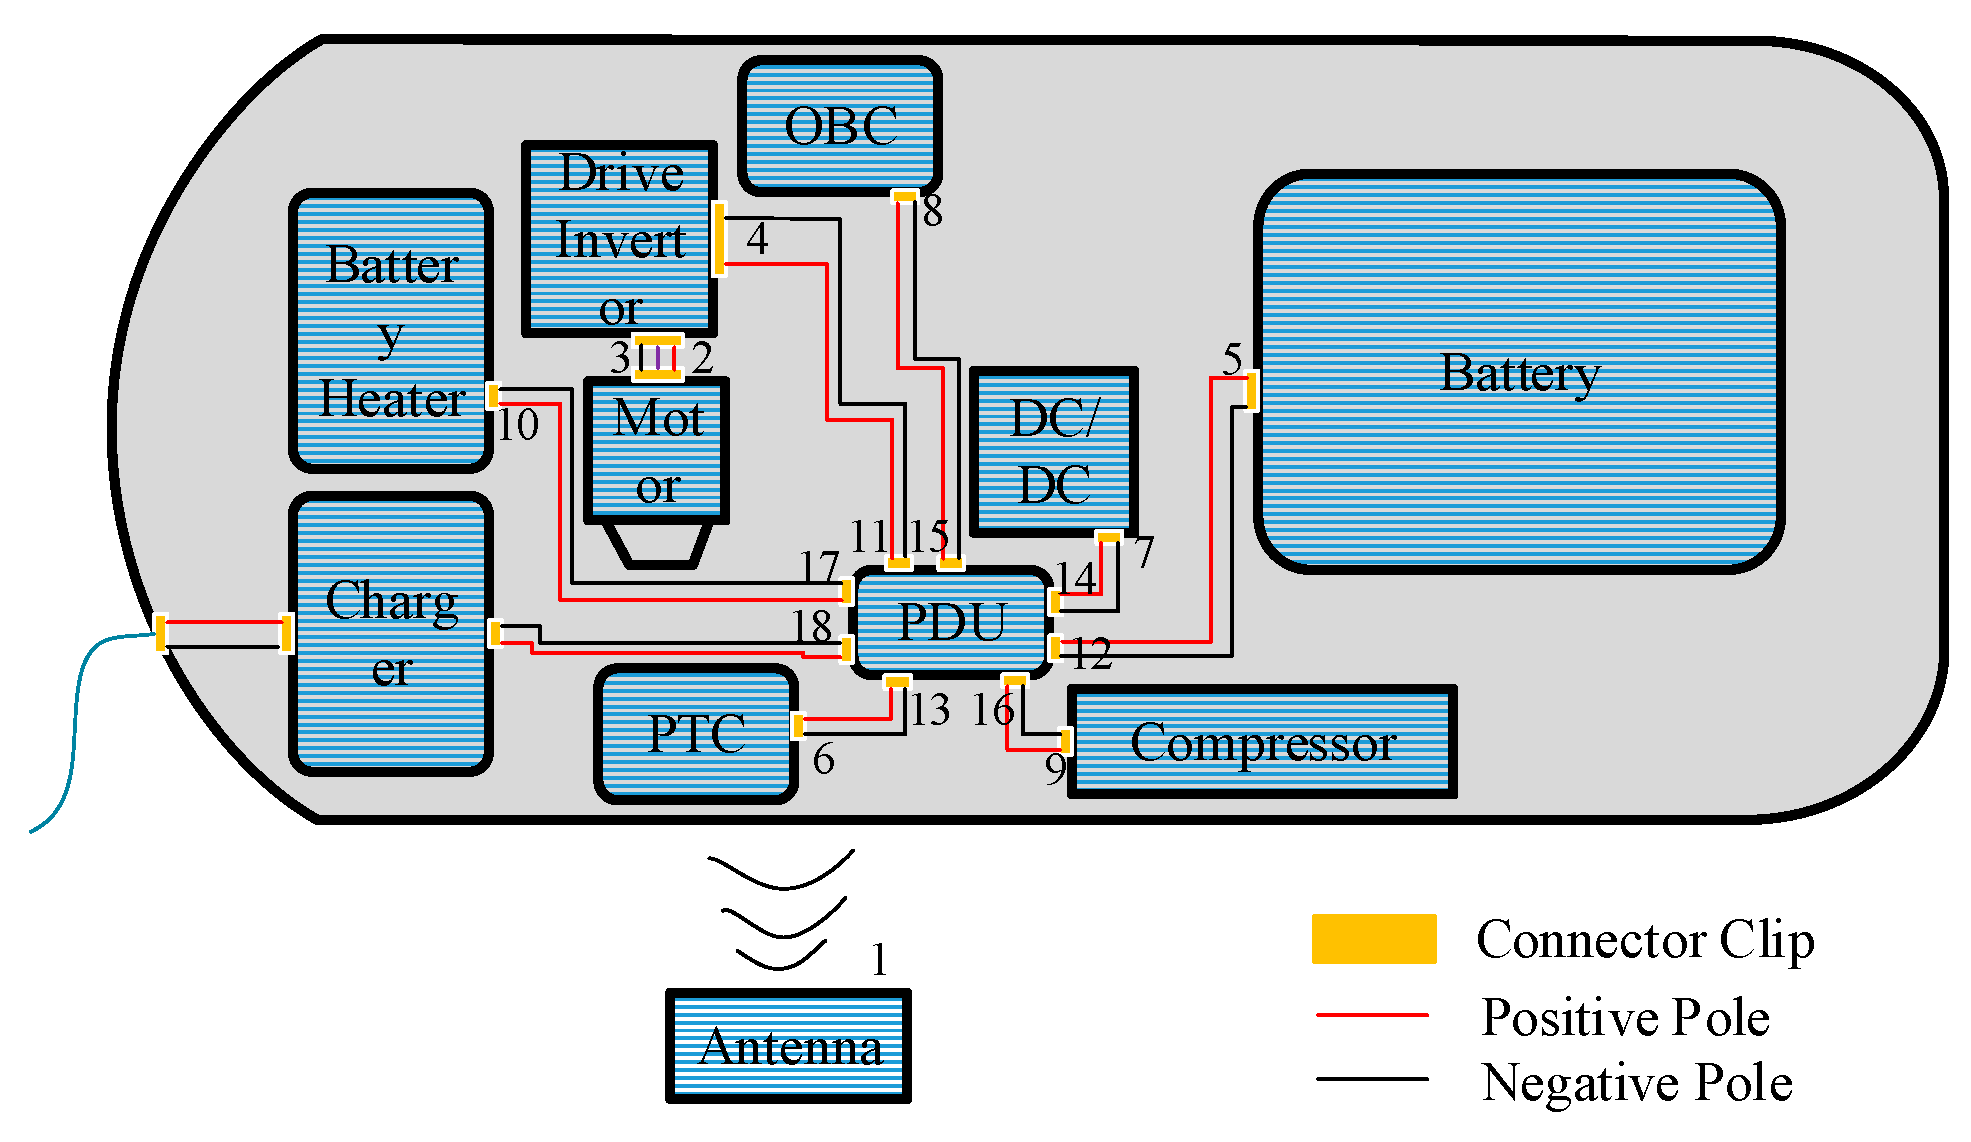
The high-voltage system of the EV consisted of DC/DC, on board charger (OBC), positive temperature coefficient heater (PTC), battery heater, compressor, traction system, power battery, cables and power distribution unit (PDU) as shown in Figure 3. Under the test condition, the components PTC, OBC and compressor are inactive. The radiated emission is mainly caused by DC/DC and traction system due to their internal power electronic devices with high frequency switching. The cables combined with the vehicle body act as the transmitting antenna. Since the positive and negative high-voltage cables were routed parallel and closely, the emission generated by the differential mode noise was ignorable and only CM was considered here.
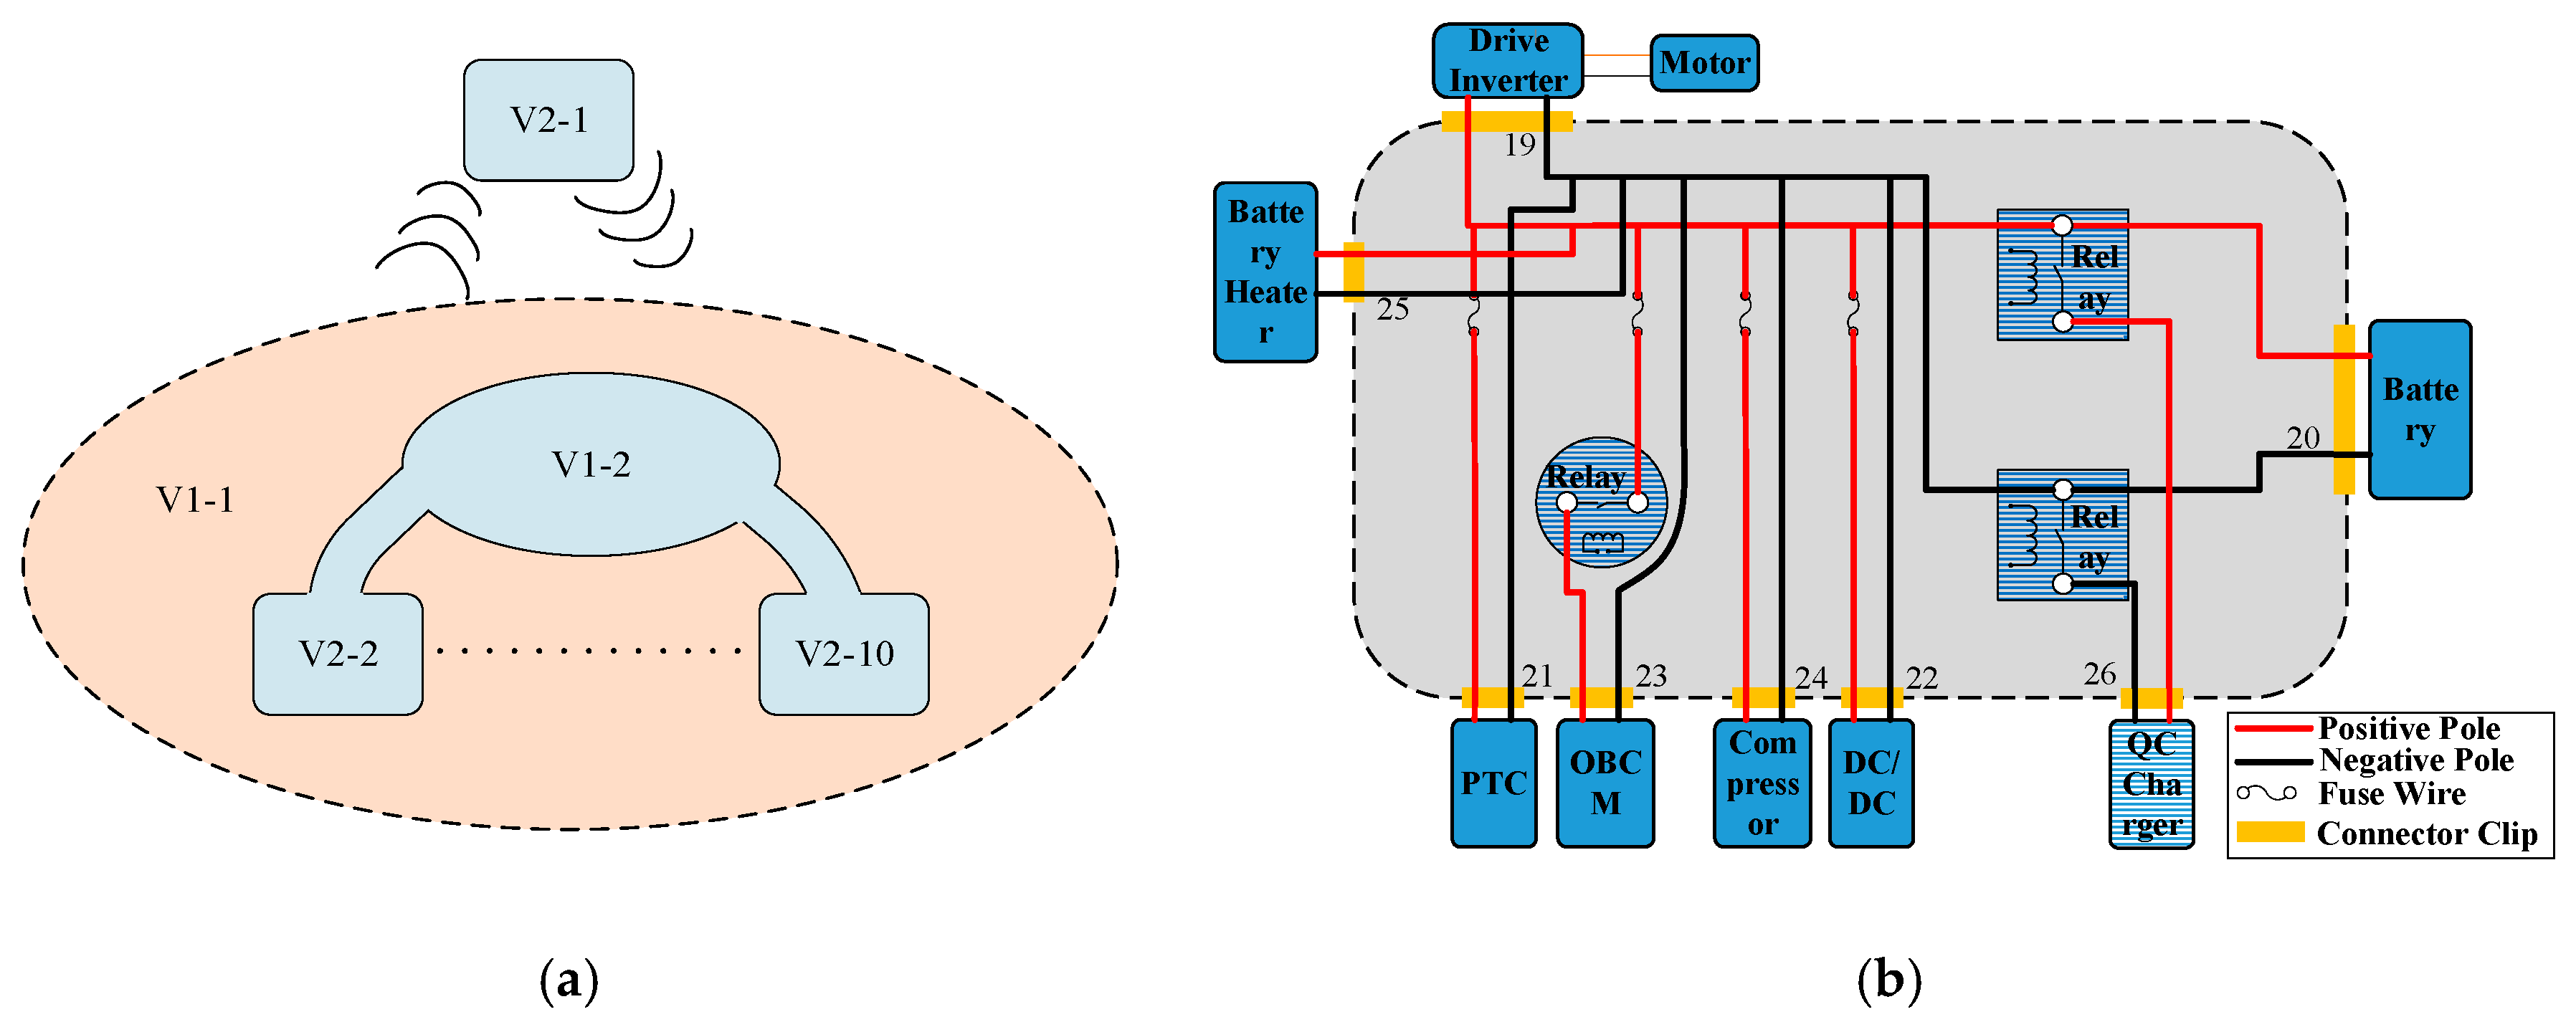
Then the considered system was divided into two types of sub-volumes according to their shielding levels, depicted in Figure 4a [21]. The vehicle’s metal body allowed electromagnetic waves to travel through apertures such as windows, door gaps, etc., so the internal space of EV was classified as an unscreened volume V1-1. Since the metal cases of the components including DC/DC, OBC, traction system, etc., were excellent shielding, they were defined as shielded volumes indexed from V2-1 to V2-10. Different from these components connected with only one pair of high-voltage cables, PDU (indexed by V1-2) was a conjunction of all high-voltage cables, in which the cables were connected with bus–bar resulting in conducted and near field couplings (see Figure 4b).
The principle of the modelling process of a high-voltage system is shown in 
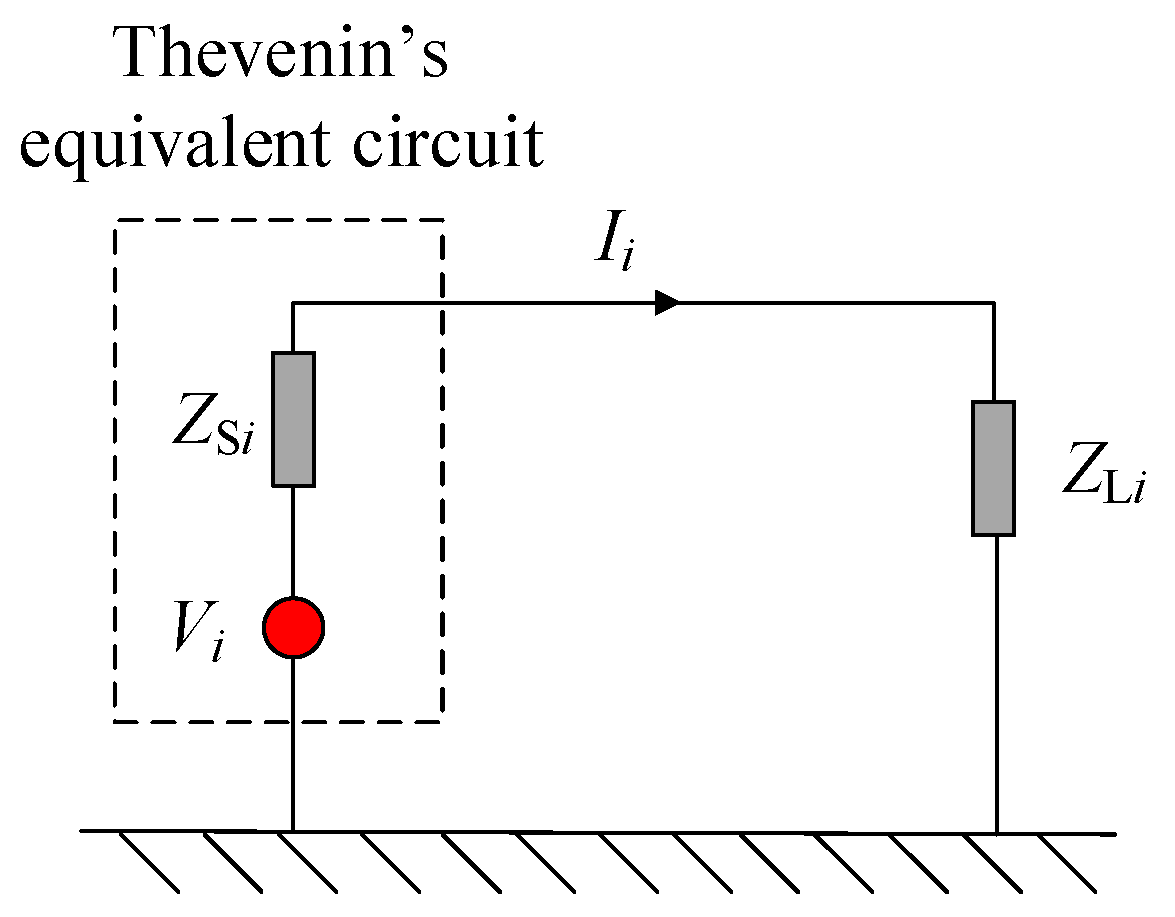
Figure 5. Good shielding isolated the radiated noise generated by inside sources and the vehicle-level emissions were mostly radiated by the connecting cables. Such shielded components were modeled by the Thevenin’s equivalent circuits. On the contrary, the parts in an unscreened volume had unneglectable couplings with the outside. To model with less experience, a multi-port network was adopted to describe such complicated relations. Though multi-port networks mainly dealt with the linear coupling, from the above analysis it was realized that the emissions were mostly radiated by the cables and bodies, which were linear. The nonlinear parts were integrated in the shielded sub-volumes described by the equivalent circuits.

2.1.2. Modelling of Electromagnetic Radiation

Based on the analysis in Section 3.1, the EV was split into two multi-port networks as shown in Figure 6, where Network 1 was made up of the considered components including cables, measuring antennas, body, etc., i.e., V1-1 and V2-1~V2-10. Network 2 only consisted of the PDU, i.e., V1-2. The number of network ports was the same as that in Figure 3 and Figure 4.
In Figure 6, Vi and ZSi (i = 1, ,10) were the equivalent voltage and internal impedance of components, Ui and Ii were the port voltage and current of the network. To simplify the representation, it should be noted that: (a) Both sensitive equipment and interference sources were modeled by the Thevenin’s equivalent circuits and the voltage of sensitive ones was set to zero; (b) the measuring antenna was considered to be sensitive equipment. The following variables were defined to describe the networks:
U = [ U v e c U p d u ] ,   U v e c = [ U 1 U 18 ] ,   U p d u = [ U 19 U 26 ] , I = [ I v e c I p d u ] ,   I v e c = [ I 1 I 18 ] ,   I p d u = [ I 19 I 26 ] ,
V = [ V 2 V 10 ] ,   Z S = diag ( Z S 2 , , Z S 10 ) ,   Z L = [ Z S 1 ] ,
Z = [ Z v e c Z p d u ] ,   Z v e c C 18 × 18 ,   Z p d u C 8 × 8 ,
where Equation (1) defined the variables of the network ports, Equation (2) was the Thevenin’s circuit parameters of components, and in Equation (3) Z v e c and Z p d u were the network impedance parameters of Network 1 and Network 2, respectively, C was the set composed of complex matrices. The advantage of using network impedance parameter was that it was independent of port characteristics, which implies that the required parameters could be obtained separately by different technologies.
According to the connection of high-voltage system depicted in Figure 3 and Figure 4b, the Network 1 ports indexed from 11 to 18 were connected to the Network 2 ports indexed from 19 to 26 one by one in sequence. To simplify the representation of the vehicle radiation model, the following topologies have been defined to describe the connection relationships:
G U R 8 × 26 , G U ( i , j ) = { 1 ,   i f   i = 1 , , 8   a n d   j = i + 10 1 ,   i f   i = 1 , , 8   a n d   j = i + 18 0 ,   otherwise , G I R 8 × 26 , G I ( i , j ) = { 1 ,   if   i = 1 , , 8   and   j = i + 10 ,   i + 18 0 ,   otherwise , G   S R 10 × 26 , G S ( i , j ) = { 1 ,   if   i = 1 , , 9   and   j = i + 1 0 , otherwise , G L R 26 , G L ( i ) = { 1 ,   if   i = 1 0 ,   otherwise ,
where R was the set composed of matrices whose entity was selected from { 1 ,   0 ,   1 } , G U and G I represented the connection relationships of voltage and current at the junctions of ports to satisfy Kirchhoff’s law, G L and G S were used to combine all equivalent circuit parameters together.
Then the topological vehicle radiation model combining Network 1 and Network 2 became
G L U = Z L G L I , G S U = V Z S G S I , U = Z I
At the junctions of ports, the following equations were established from Kirchhoff’s law:
G U U = 0 , G I I = 0
The port voltage U was calculated by substituting Equation (6) into Equation (5) as
U = Z [ G L Z + Z L G L G S Z + Z S G S G U Z G I ] 1 [ 0 V 0 0 ] .
Then the port voltage U 1 of the measuring antenna was obtained. With the antenna factor, the strength of magnetic field could be calculated by
| H a n t | = | U 1 | · AF H
where | H a n t | was the strength of magnetic field and AF H was the antenna factor.

2.2. Acquiring Model Parameters

2.2.1. Network Parameter

The Z-parameter of the network was difficult to measure directly, because it was hard to construct the required open circuit condition in practice especially at the high frequency range. Instead, S-parameter was always used to describe the network characteristic, which can be measured by a network analyzer [24] or calculated by commercial three-dimensional electromagnetic field solving software, such as CST Microwave Studio (V2018, Paris, France), HFSS (v17.2, Pittsburgh, USA), FEKO (v2018, Wisconsin, USA), etc. [25]. In this study the model used to calculate the S-parameter of network by FEKO is shown in Figure 7.
The FEKO models were solved by a workstation whose memory was 64G and CPU was E5-2650. When calculating the Network 1, the PDU was simplified to a metal box, whose internal coupling among high-voltage cables was solved by Network 2 separately. The calculated frequency range and the layout of loop antenna were defined according to SAE J551-5. The Z-parameter of network could be obtained from the S-parameter calculated by FEKO as the following and some network parameters are shown in Figure 8 as an example [18]:
Z = Z 0 ( E + S ) ( E S ) 1
where Z , and S were the Z-parameter and S-parameter, Z 0 was the port impendence and E represented the identity matrix. Compared to the S-parameter, which varied in port impedance, the Z-parameter was independent of port characteristics. It was unnecessary to recalculate the network parameter to match the actual port impedance if the Z-parameter was used to predict the vehicle-level EMI.

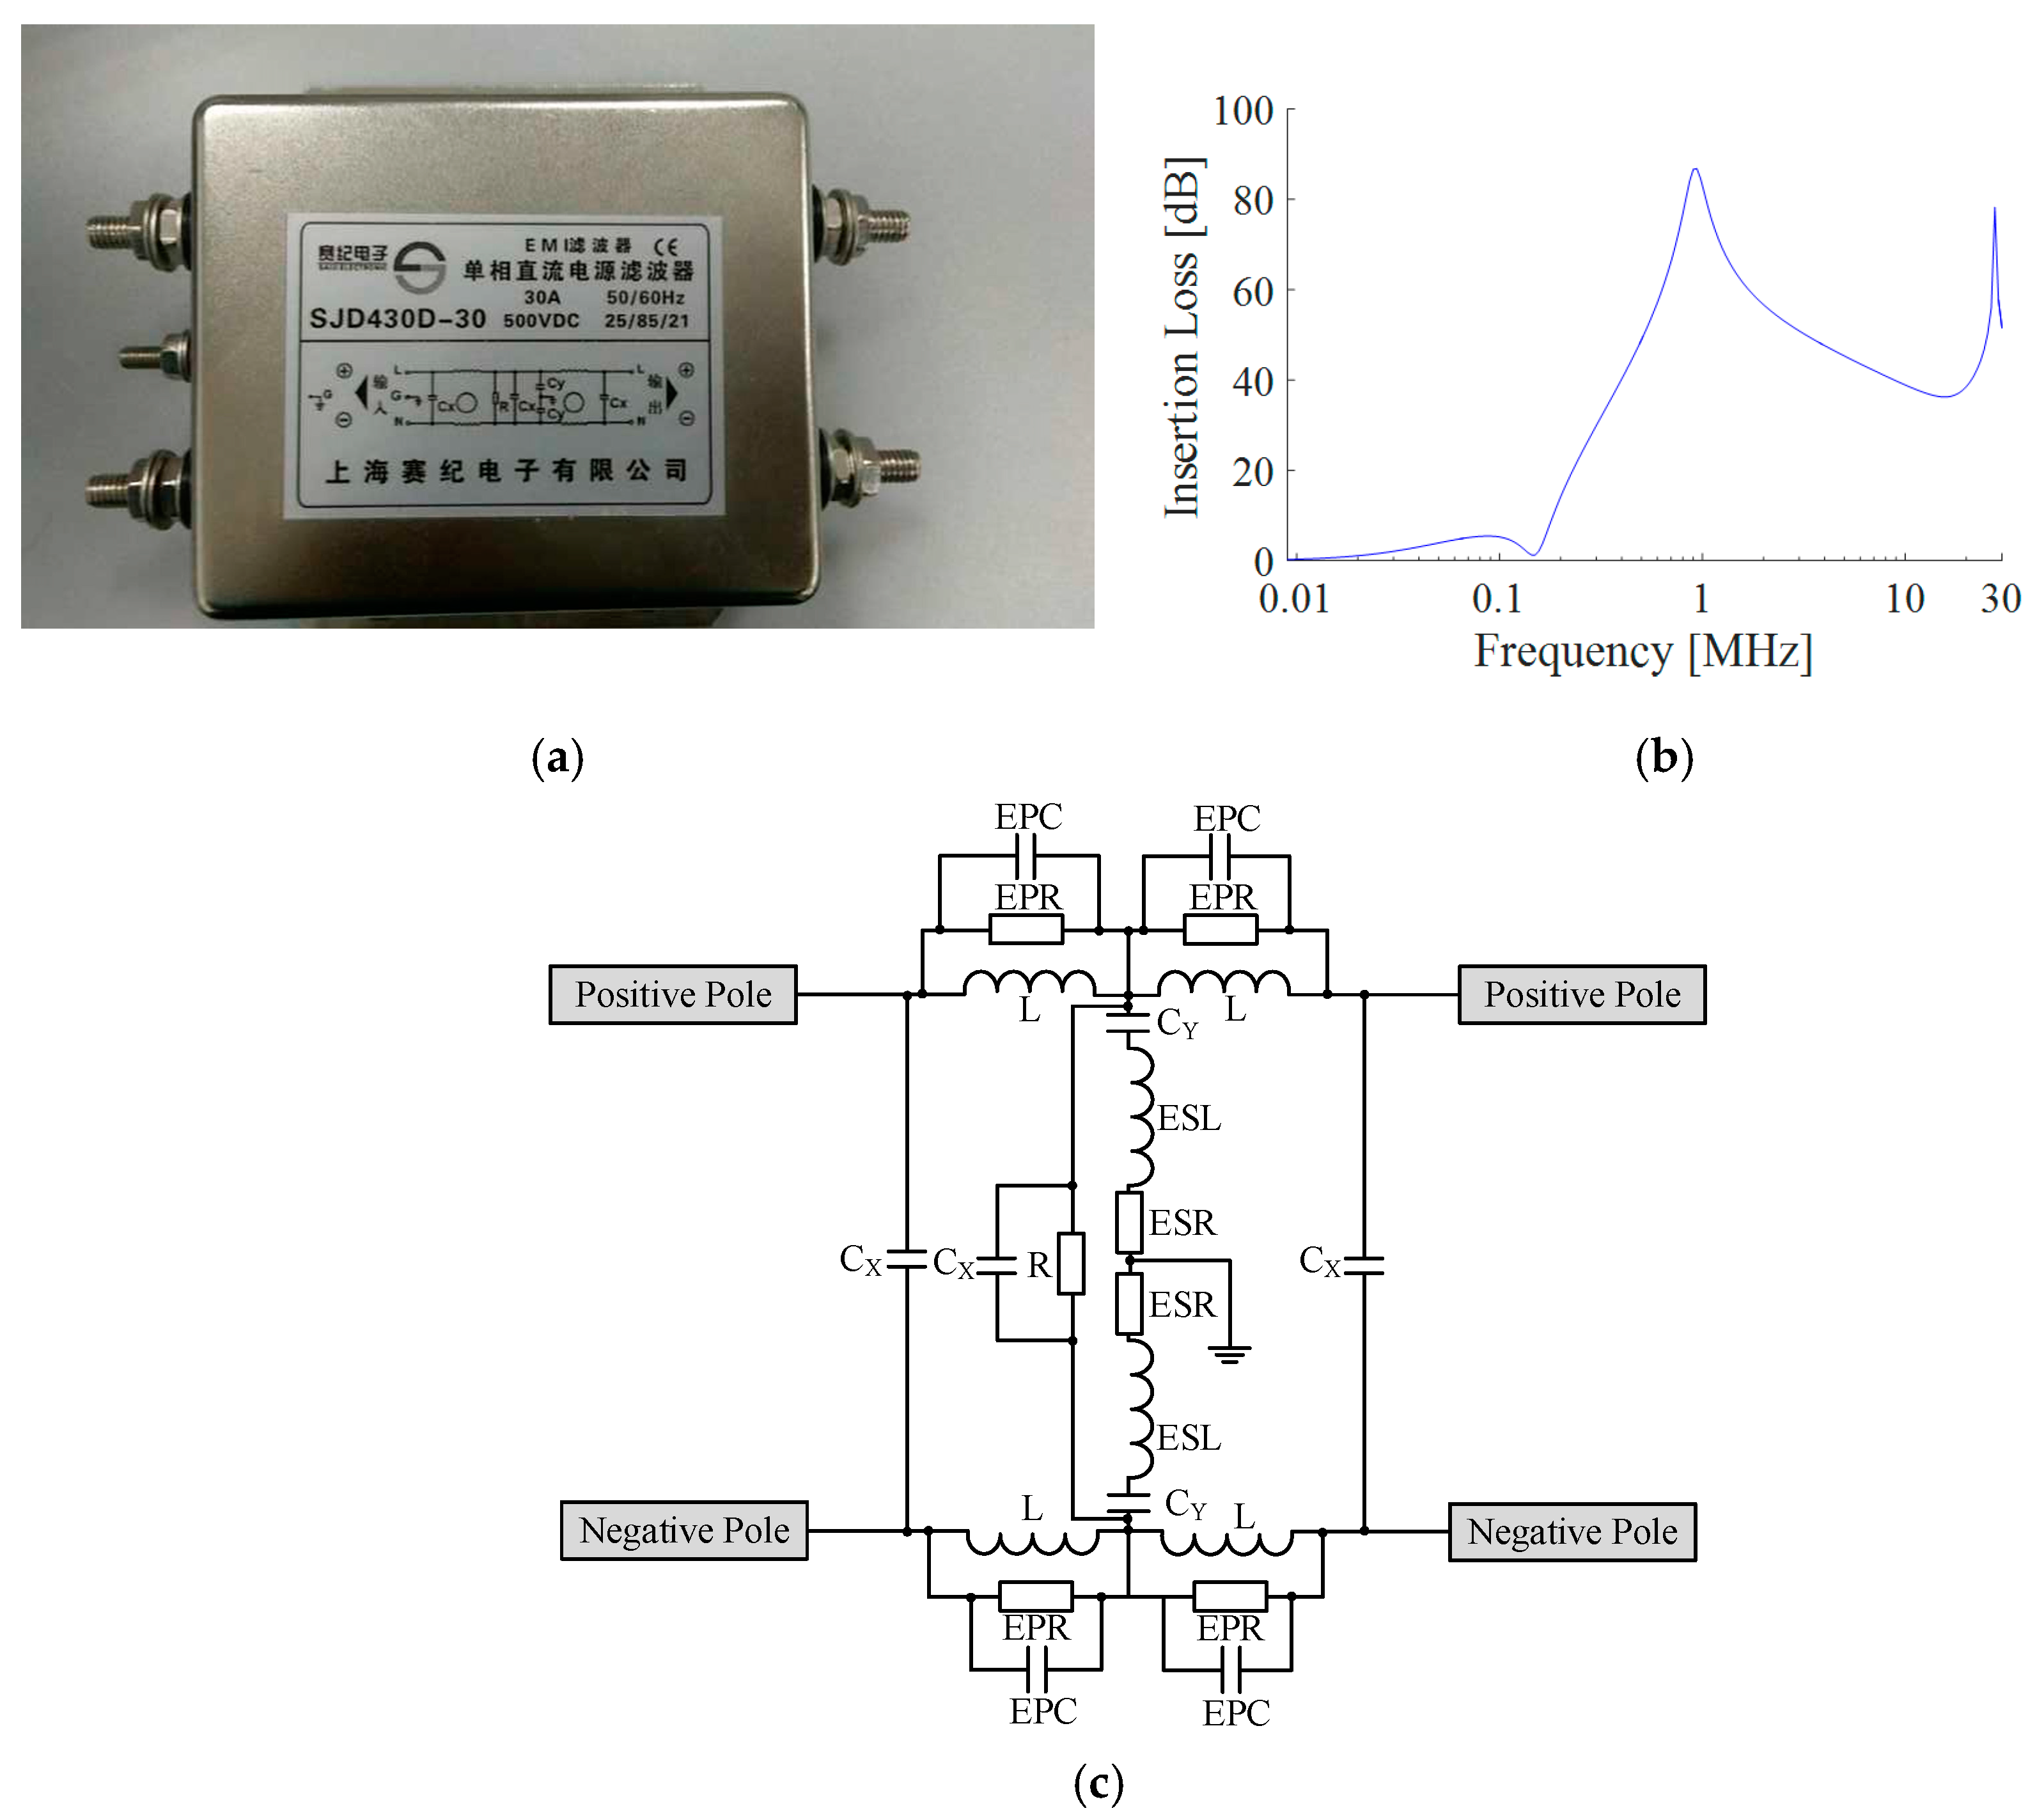
2.2.2. Equivalent Circuit Parameters

From the analysis in Section 2.1.1, the EMI was mainly induced by the CM interference, which was modeled by the Thevenin’s equivalent circuits (shown in 
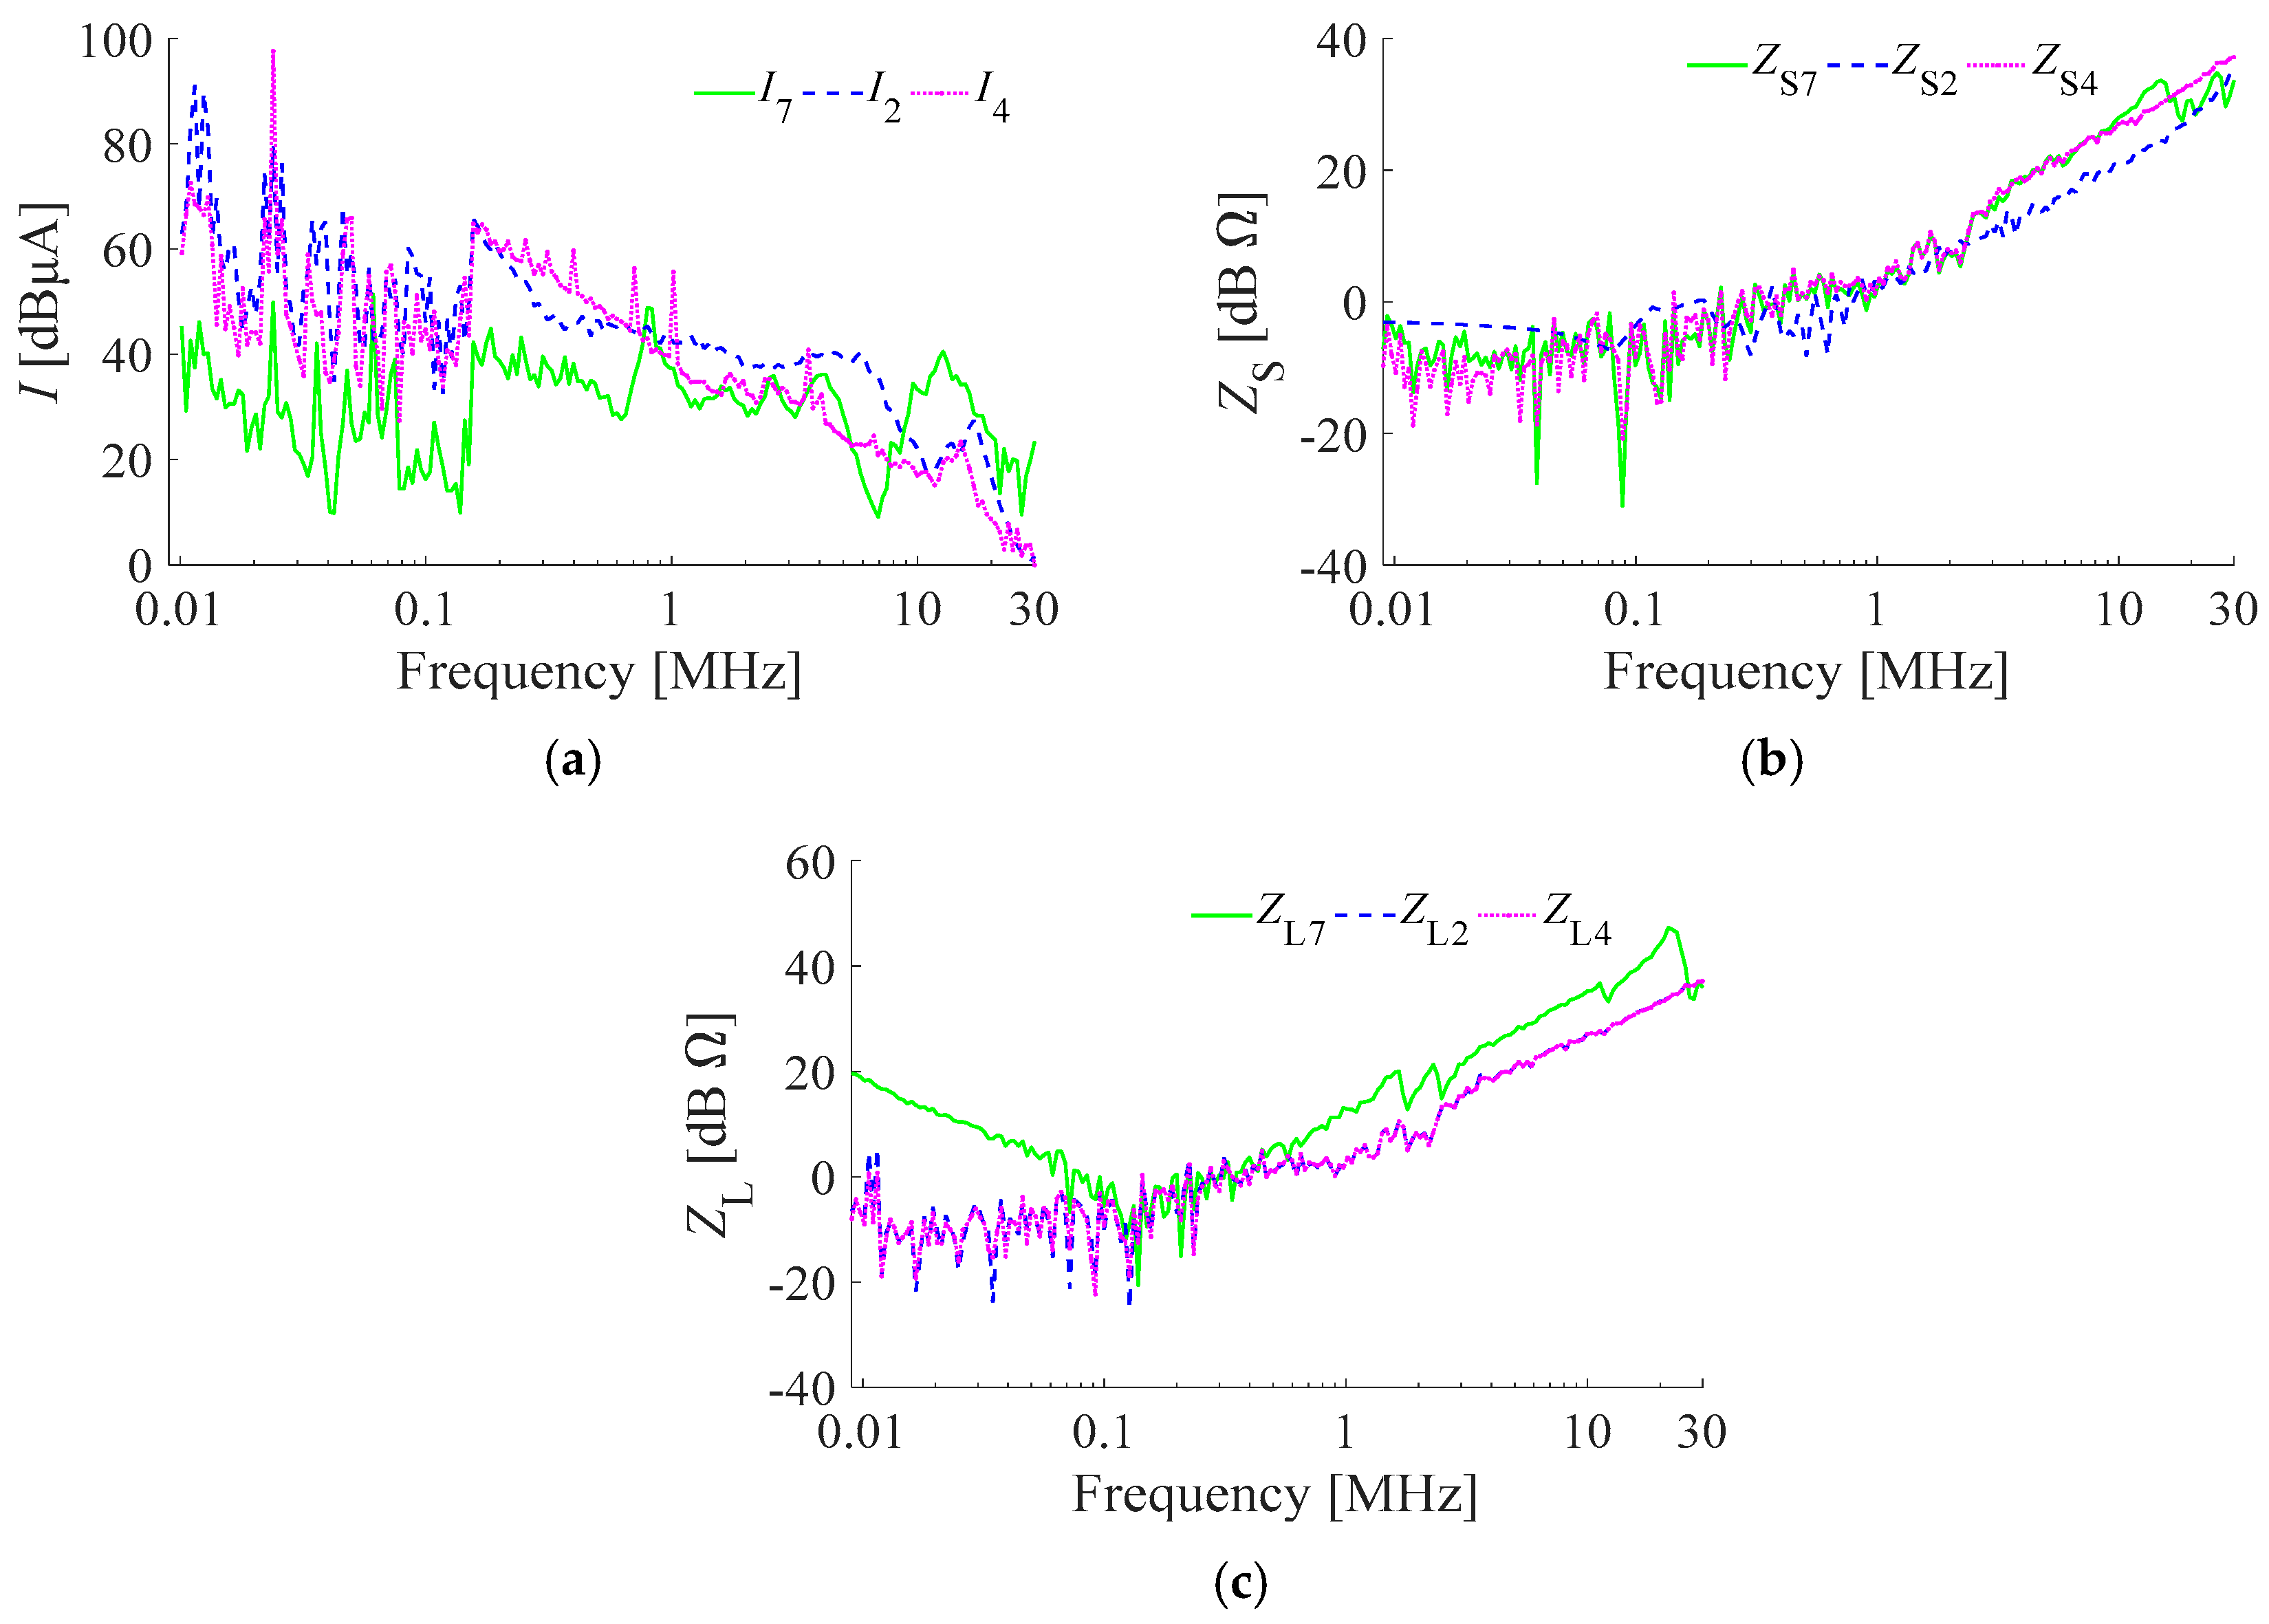
Figure 9) with the following steps: (a) Measure the CM current at the connector of each interference source in real vehicle or bench test; (b) measure the CM output impedance and terminating impedance of all components connected to the network; (c) the equivalent circuit parameters were obtained by calculating the equivalent voltage of interference source with the measured data as:
V i = I i · ( Z S i + Z L i )
where V i and I i were the CM voltage and current respectively, Z S i was the output impedance and Z L i was the terminating impedance. Here the CM current and impedance were measured by a broadband current clamp and a network analyzer, respectively.
According to the analysis in Section 2.1, the ports indexed by 2, 4 and 7 were connected to the interference sources and others were considered to be loads whose impedances were directly measured by the network analyzer. Figure 10 shows the measured equivalent circuit parameters required to calculate the CM voltage by Equation (10), and the test condition was 40 km/h in accordance with SAE J551-5.

3. Results and Analysis

3.1. Validation of EMI Prediction Model

With the model parameters obtained in Section 2.2, the radiated EMI was predicted by Equation (8), which was compared with the experimental results as shown in Figure 11. It shows that the trend of the predicted and measured values agree with each other well and the main peaks at about 25 KHz and 18.8 MHz could be predicted exactly. The overall prediction accuracy in the whole frequency range was about 71%. It indicates that the proposed approach could describe the vehicle-level EMI correctly and that this EMI model could be used to troubleshoot the EMI problem in the next section.

3.2. Interference Source Diagnosis

At this late of a stage in the vehicle development process, it is impossible to change the vehicle layout design, so in this paper the diagnosis was used to find the main interference sources. One practical way to identify the source was by comparing the EMI under different combinational running states by switching on/off components, which was very resource-consuming and cannot provide an efficient improvement measure. In this section, a sensitivity-based approach has been presented to analyze and find out the main interference source using the EMI prediction model.
The magnetic field was proportional to the port voltage U 1 of the antenna, which was a sum of the products of the coupling coefficients and interferences, i.e., DC/DC and electric drive system. To find out which contributes most to the magnetic field, the sensitivity of the interferences to the induced voltage at the antenna was calculated and shown in Figure 12a. The results show that the magnetic field was more sensitive to the interference of DC/DC (V7). And to further validate this conclusion, the induced magnetic field components of different sources were calculated (see Figure 12b). The magnetic field generated by DC/DC was greater than that by motor by 15 dBμA/m and electric drive inverter by 47 dBμA/m at the frequency in excess of regulation, which was consistent with the sensitivity analysis results. As such, it is preferable to attenuate the interference of DC/DC rather than others and the EMI suppression was designed in the next section.

3.3. EMI Suppression

According to the previous analysis results, DC/DC was the main interference source. In this section, considering both the cost and filtering effect, a single-phase DC power filter (see Figure 13) was selected to prevent the disturbance of DC/DC from radiating by its connected high-voltage cables [26]. Its equivalent circuit model, including the parasitic effects is shown by Figure 13c, whose circuit parameters were provided by the manufacturer and listed as: LC = 0.45 mH, CY = 4.7 nF, CX = 470 uF, R = 0.47 MΩ, EPC = 67 nF, EPR = 16.8 kΩ, ESL = 7 nH, ESR = 0.05 mΩ.
Considering filter effectiveness, this filter should be installed closely to DC/DC. However, it was hard to carry out because of the compact size of DC/DC. Relatively, it was easier to install the filter in PDU, to which DC/DC was also connected. To further validate the effectiveness of the selected filter and choose its installation position, some further comparative simulations were conducted. The results in Figure 14 show that: (a) The selected filter could attenuate the EMI generated by DC/DC effectively at the exceeded frequency range; (b) generally it was better to install the filter at the port 7 of DC/DC (see Figure 3); (c) the radiated magnetic field was reduced by about 20 dBμA/m at around 18 MHz when the filter was installed at the port 22 of PDU (see Figure 4b), which was also acceptable compared with the exceeded test results shown in Figure 2.
Considering the difficulty of engineering, the filter was finally installed in PDU and the improvement test results of the magnetic field are shown in Figure 15, from which it was found that the presented filter and its installation position could attenuate the interference generated by DC/DC and the magnetic field emission passed the requirement of SAE J551-5.

4. Discussion and Conclusions

This paper proposed a prediction method of vehicle-level EMI based on EMT and electric network theory to troubleshoot the EMC problem more efficiently. It was concluded from the analysis and application results that:
(1) The proposed EMT based method was an effective way to model the EMC problem of a complicated system with less engineering experience. For each subsystem, the parameter values could be derived independent of other parts with different technologies by adopting the network with a Z-parameter.
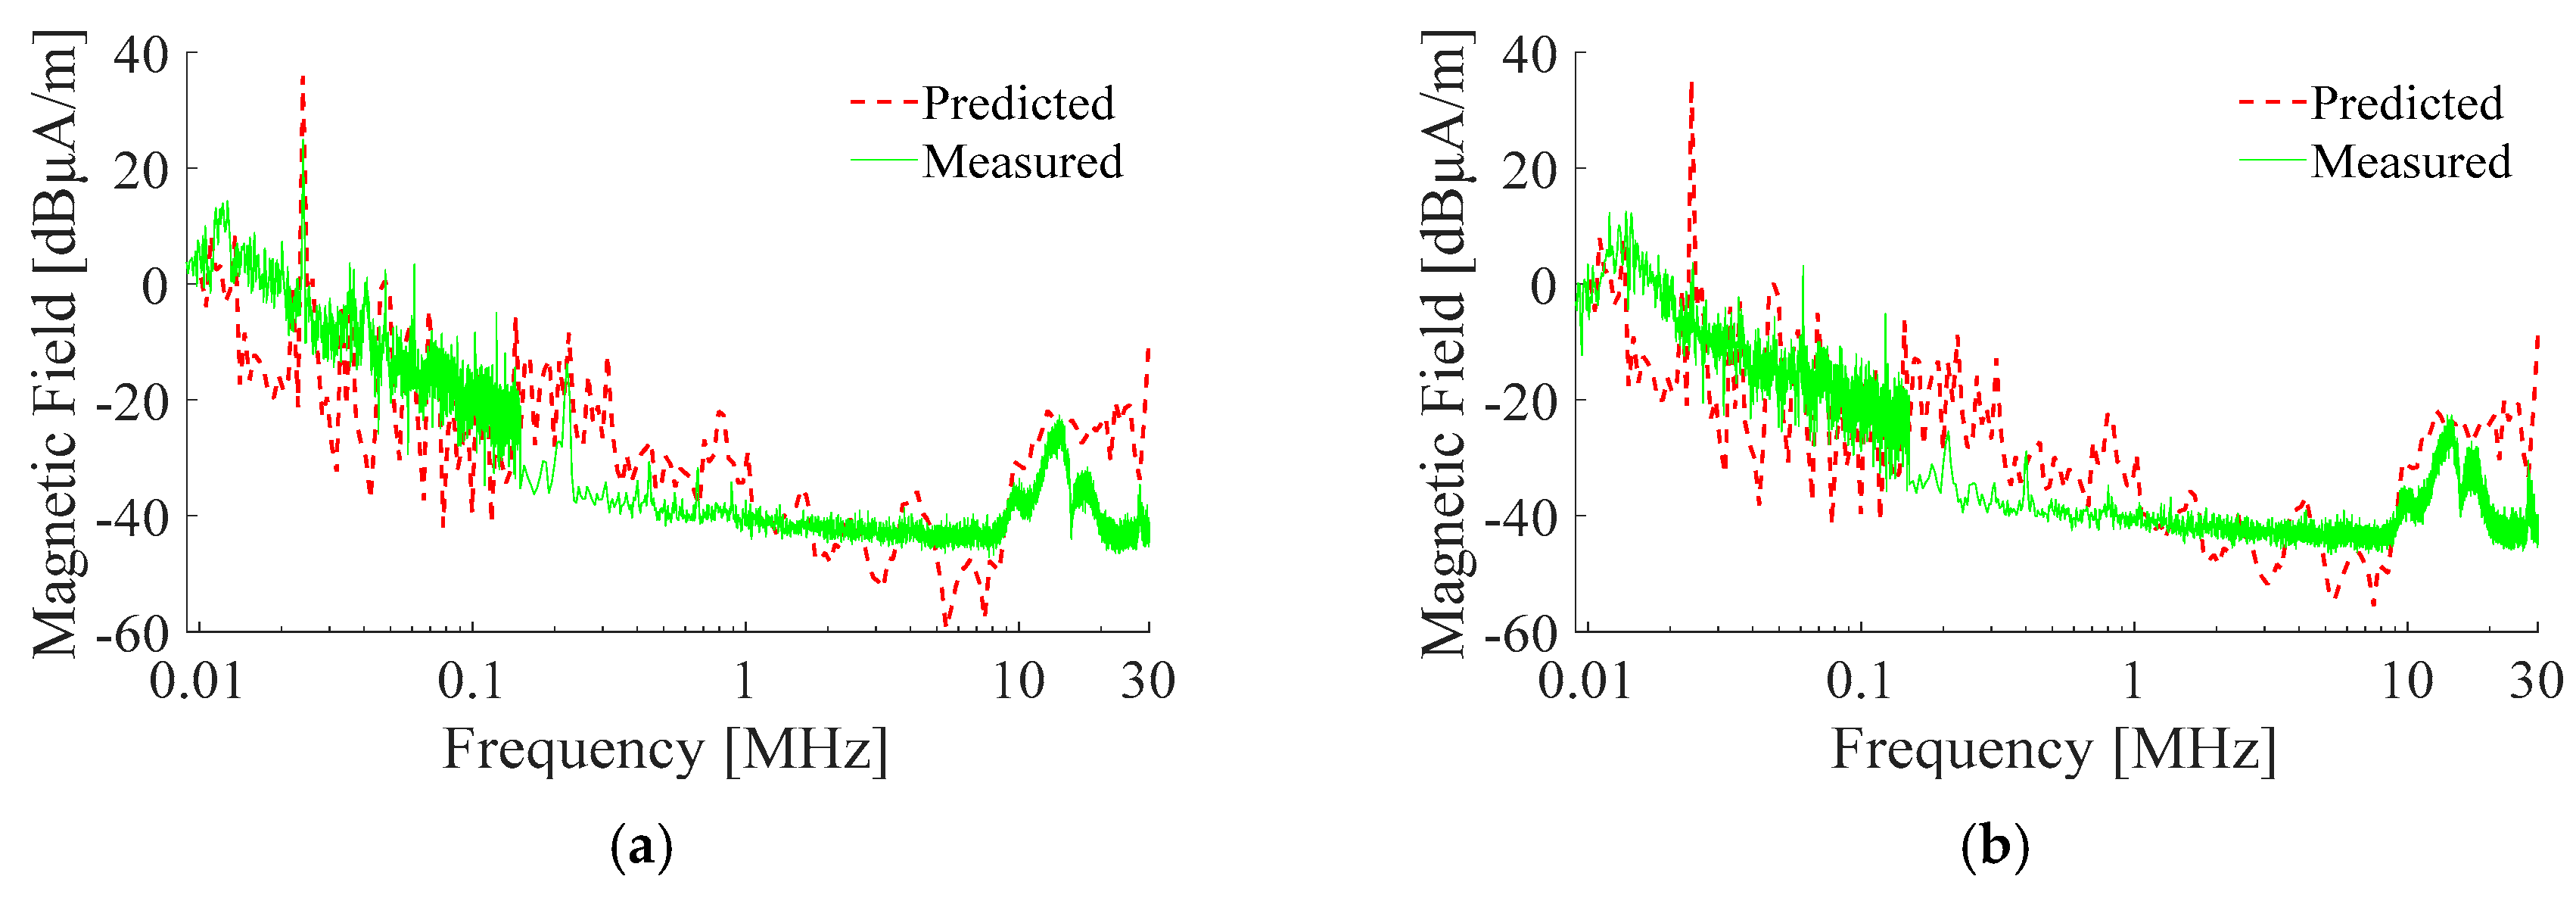
(2) The EMT based model for vehicle-level radiated emission at low frequency was accurate enough to predict and troubleshoot the EMC problem of the EV. It has the potential ability to be extended to higher frequency ranges and more EMC problems.
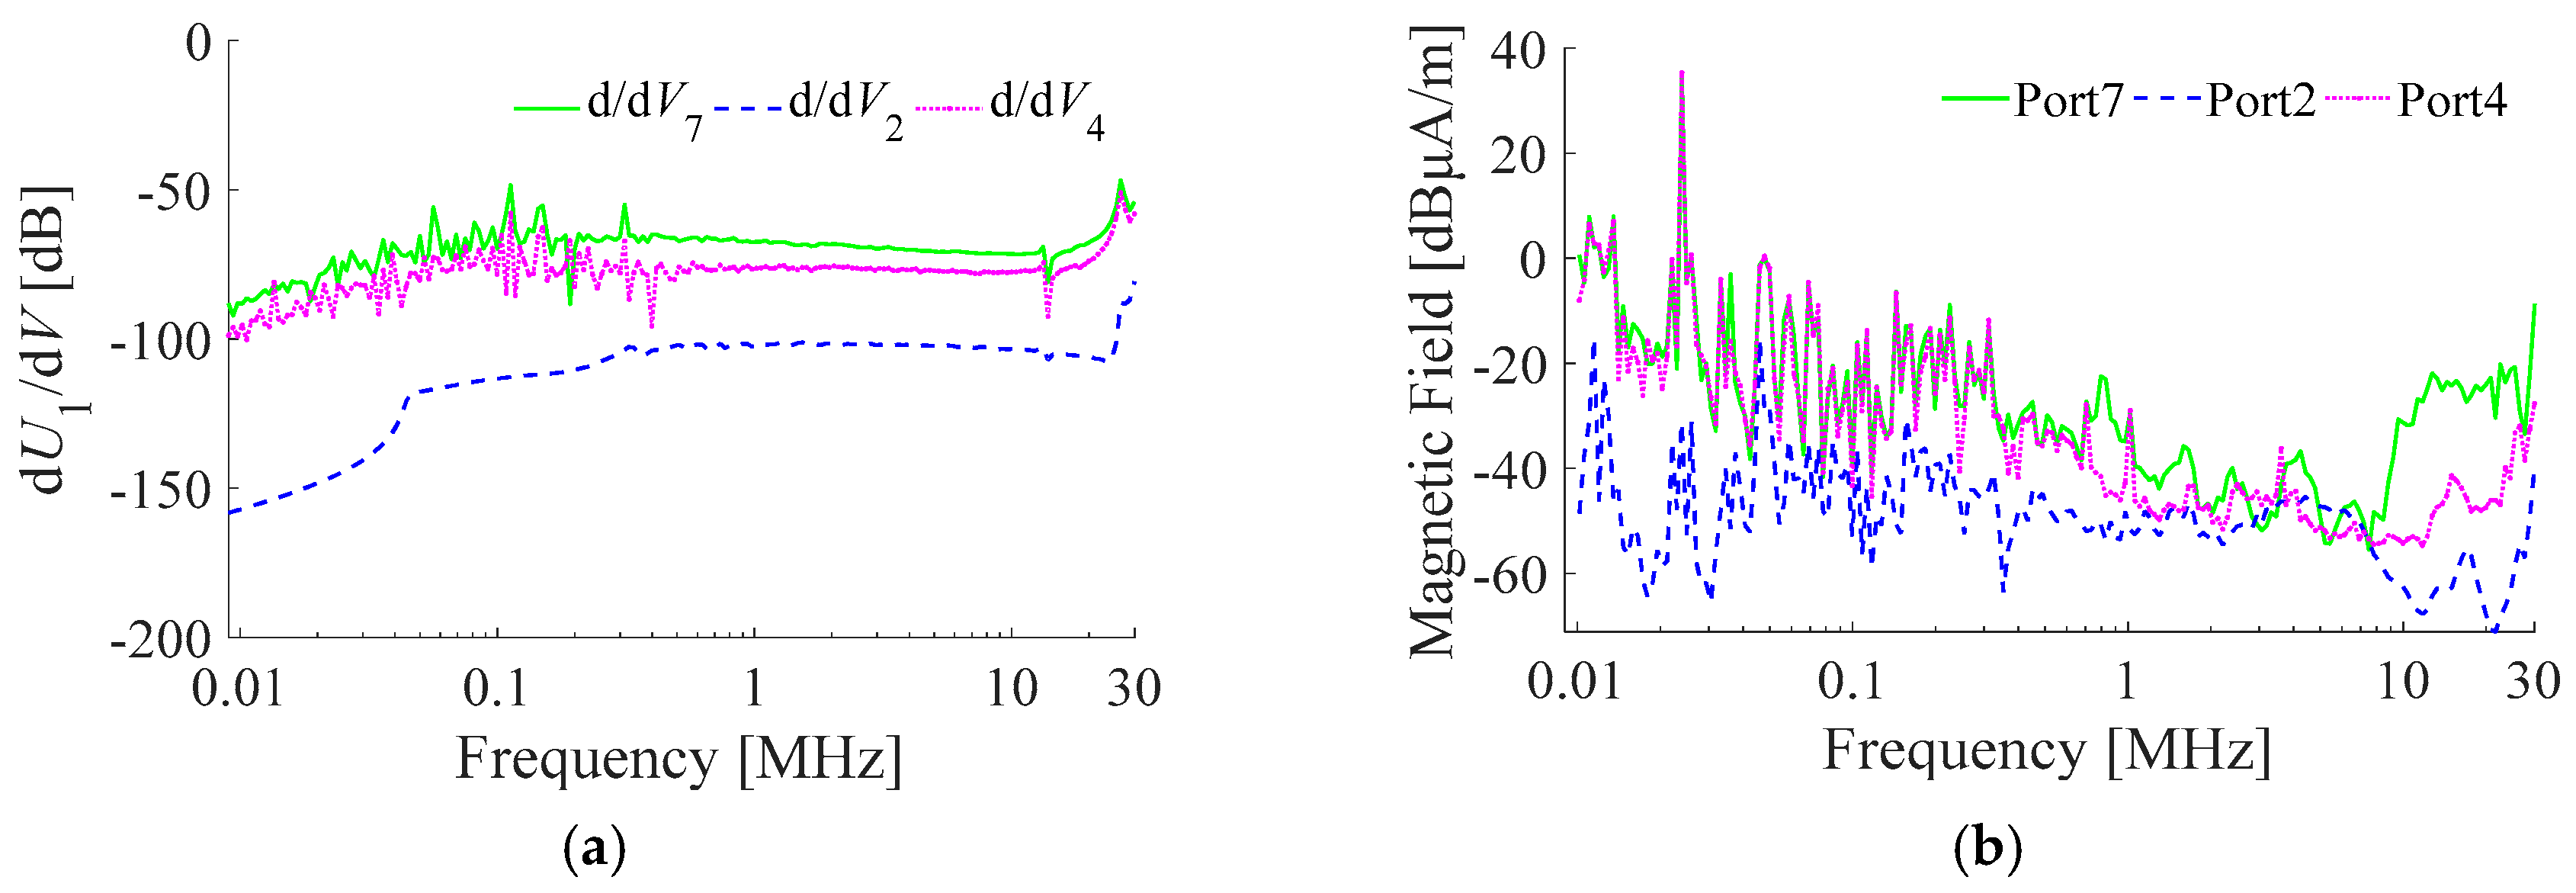
(3) The sensitive analysis method could be used to find out the main interference source, based on this EMI prediction model, by which the resource-consumed experimental diagnosis process was replaced successfully. However, further studies are needed on its theoretical base and on general application technologies.
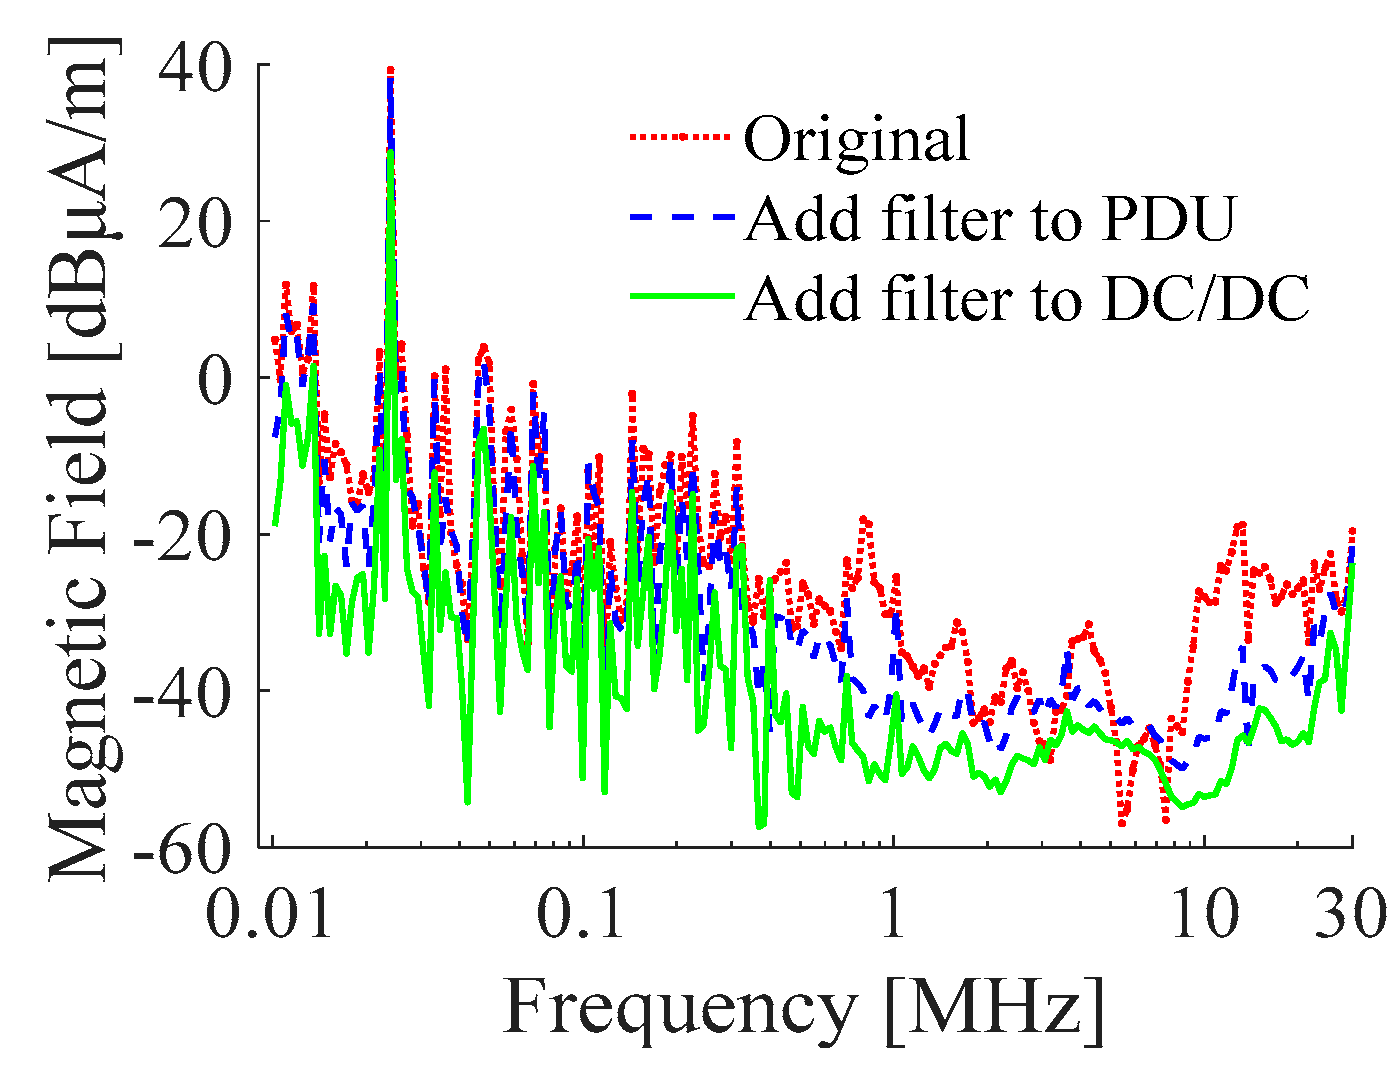
(4) The presented EMI suppression approach could attenuate the interference generated by DC/DC sufficiently and the radiated emission at low frequency of studied EV finally met the requirements of SAE J551-5.

Author Contributions

Formal analysis, C.W.; writing-review and editing, F.G.; original draft preparation, H.D.; funding acquisition, Z.W.

Funding

This research was funded by the National Key R&D Program of China under grant 2017YFB0102504 and the Scientific Technological Plans of Chongqing under grant cstc2017zdcy-zdzx0042.

Acknowledgments

Thanks to the China Automotive Technology and Research Center, who provided the EV and the EMC laboratory.

Conflicts of Interest

The authors declare no conflict of interest.

References

  1. Hamza, D.; Pahlevaninezhad, M. Integrated capacitor for common-mode EMI mitigation applicable to high frequency planar transformers used in electric vehicles DC/DC converters. In Proceedings of the IEEE Energy Conversion Congress and Exposition (ECCE), Pittsburgh, PA, USA, 14–18 September 2014; pp. 4809–4814. [Google Scholar]
  2. Ivan, E.; Fernando, A.; Mateo, J.; Alvaro, P.; Javier, P.; Francisco, J.A. Common mode noise propagation and effects in a four-wheel driven electric vehicle. IEEE Trans. Electromagn. Compat. 2018, 60, 132–139. [Google Scholar]
  3. De Miguel-Bilbao, S.; Blas, J.; Ramos, V. Effective analysis of human exposure conditions with body-worn dosimeters in the 2.4 GHz band. J. Vis. Exp. 2018, 135, e56525. [Google Scholar] [CrossRef] [PubMed]
  4. De Miguel-Bilbao, S.; Ramos, V.; Blas, J. Responses to comments on assessment of polarization dependence of body shadow effect on dosimetry measurements in the 2.4 GHz band. Biolectromagnetics 2017, 38, 650–652. [Google Scholar] [CrossRef] [PubMed]
  5. Jose, H.; Artur, N.; Jose, S.; Magno, A. Proposal for a Brazilian regulation of electromagnetic compatibility applied to automotive vehicles. In Proceedings of the IEEE International Symposium on Electromagnetic Compatibility, Ottawa, ON, Canada, 25–29 July 2016; pp. 495–500. [Google Scholar]
  6. Bernas, N.R. Electromagnetic compatibility design modification considerations in electronic equipment. In Proceedings of the IEEE Symposium on Product Compliance Engineering, San Diego, CA, USA, 10–12 October 2011; pp. 1–5. [Google Scholar]
  7. Kim, T.H.; Kim, M.; Ahn, B.J.; Jung, S.Y. Study of EMC optimization of automotive electronic components using CAE. In Proceedings of the International Conference on Electrical Machines and Systems, Busan, Korea, 26–29 October 2013; pp. 26–29. [Google Scholar]
  8. Li, P.; Jiang, L.J. Source reconstruction method-based radiated emission characterization for PCBs. IEEE IEEE Trans. Electromagn. Compat. 2013, 55, 933–940. [Google Scholar] [CrossRef]
  9. Chun, H.T.; Han, S.H. Converter switching noise reduction for enhancing EMC performance in HEV and EV. In Proceedings of the International Exhibition and Conference for Power Electronics, Intelligent Motion, Renewable Energy and Energy Management, Nuremberg, Germany, 10–12 May 2016; pp. 1–8. [Google Scholar]
  10. Piazza, M.C.; Luna, M.; Ragusa, A.; Vitale, G. An improved common mode active filter for EMI reduction in vehicular motor drives. In Proceedings of the IEEE Vehicle Power and Propulsion Conference, Chicago, IL, USA, 6–9 September 2011; pp. 1–8. [Google Scholar]
  11. Gao, X.; Su, D. Suppression of a certain vehicle electrical field and magnetic field radiation resonance point. IEEE Trans. Veh. Technol. 2018, 67, 226–234. [Google Scholar] [CrossRef]
  12. Yu, Z.; Mix, J.A.; Sajuyigbe, S.; Slattery, K.P.; Fan, J. An improved dipole-moment model based on near-field scanning for characterizing near-field coupling and far-field radiation from an IC. IEEE Trans. Electromagn. Compat. 2013, 55, 97–108. [Google Scholar] [CrossRef]
  13. Yahyaoui, W.; Pichon, L.; Duval, F. A 3D PEEC method for the prediction of radiated fields from automotive cables. IEEE Trans. Magn. Mag. 2010, 46, 3053–3056. [Google Scholar] [CrossRef]
  14. Li, P.; Yang, F.R.; Xu, W.Y. An efficient approach for analyzing shielding effectiveness of enclosure with connected accessory based on equivalent dipole modeling. IEEE Trans. Electromagn. Compat. 2016, 58, 103–110. [Google Scholar] [CrossRef]
  15. Maeda, N.; Tanaka, K.; Imai, T. Estimation of inverter EM noise propagation to network communication through wire harness. World Electr. Veh. Assoc. J. 2007, 1, 121–125. [Google Scholar] [CrossRef]
  16. Jeschke, S.; Hirsch, H.; Trautmann, M.; Maarleveld, M. EMI measurement on electric vehicle drive inverters using a passive motor impedance network. In Proceedings of the Asia-Pacific International Symposium on Electromagnetic Compatibility, Shenzhen, China, 18–21 May 2016; pp. 292–294. [Google Scholar]
  17. Chen, S.; Nehl, T.W.; Lai, J.S.; Huang, X. Towards EMI prediction of a PM motor drive for automotive applications. In Proceedings of the Applied Power Electronics Conference and Exposition, New Orleans, LA, USA, 9–13 February 2003; pp. 14–22. [Google Scholar]
  18. Gao, F.; Ye, C.; Wang, Z.; Li, X. Improvement of low frequency radiated emission in electric vehicle by numerical analysis. J. Control Sci. Eng. 2018, 2018, 5956973. [Google Scholar] [CrossRef]
  19. Zhai, L.; Zhang, X.; Bondarenko, N.; Loken, D.; Doren, T.P.V.; Beetner, D.G. Mitigation emission strategy based on resonances from a power inverter system in electric vehicles. Energies 2016, 9, 419. [Google Scholar] [CrossRef]
  20. Liu, G.; Chen, C.; Tu, Y. Anticipating full vehicle radiated EMI from module-level testing in automobiles. In Proceedings of the IEEE International Symposium on Electromagnetic Compatibility, Minneapolis, MN, USA, 19–23 August 2002; pp. 982–986. [Google Scholar]
  21. Parmantier, J.P. Applications of EM topology on complex wiring systems. In Proceedings of the International Symposium on Electromagnetic Compatibility, Magdeburg, Germany, 2–6 August 1999; pp. 5–7. [Google Scholar]
  22. Parmantier, J.P. Numerical coupling models for complex systems and results. IEEE Trans. Electromagn. Compat. 2004, 46, 359–367. [Google Scholar] [CrossRef]
  23. Xiao, P.; Du, P.; Ren, D. A hybrid method for calculating the coupling to PCB inside a nested shielding enclosure based on electromagnetic topology. IEEE Trans. Electromagn. Compat. 2016, 58, 1701–1709. [Google Scholar] [CrossRef]
  24. Chen, G.; Zhao, L.; Yu, W.H.; Yan, S.; Zhang, K.; Jin, J.-M. A general scheme for the discontinuous Galerkin time-domain modeling and S-parameter extraction of inhomogeneous waveports. IEEE Trans. Microw. Theory Tech. 2018, 66, 1701–1717. [Google Scholar] [CrossRef]
  25. Cuffe, P.; Milano, F. Validating two novel equivalent impedance estimators. IEEE Trans. Power Syst. 2018, 33, 1151–1152. [Google Scholar] [CrossRef]
  26. Varajao, D.; Araujo, R.E.; Miranda, L.M.; Lopes, J.A.P. EMI filter design for a single-stage bidirectional and isolated AC-DC matrix converter. Electronics 2018, 7, 318. [Google Scholar] [CrossRef]
Figure 1. Layout of loop antenna at front side. (a) y polarization direction; (b) z polarization direction; (c) x polarization direction.
Electronics 08 00364 g001
Figure 2. Radiated magnetic field. (a) x polarization direction at front side; (b) x polarization direction at rear side; (c) x polarization direction at left side; (d) x polarization direction at right side.
Electronics 08 00364 g002
Figure 3. Schematic of high-voltage system layout.
Electronics 08 00364 g003
Figure 4. Topological model of high-voltage system. (a) Topological diagram; (b) internal schematic of power distribution unit (PDU).
Electronics 08 00364 g004
Figure 5. Conversion principle of electromagnetic path to equivalent circuit.
Electronics 08 00364 g005
Figure 6. Equivalent multi-port network model. (a) Vehicle-level; (b) PDU.
Electronics 08 00364 g006
Figure 7. Models in FEKO. (a) electric vehicle (EV) model; (b) PDU model; (c) x polarization direction of loop antenna.
Electronics 08 00364 g007
Figure 8. Network parameters. (a) S-parameter; (b) Z-parameter.
Electronics 08 00364 g008
Figure 9. Equivalent model of component.
Electronics 08 00364 g009
Figure 10. Equivalent circuit parameters. (a) Interference current; (b) equivalent output impedance; (c) equivalent terminating impedance.
Electronics 08 00364 g010
Figure 11. Comparing results of magnetic field with x polarization. (a) Left side; (b) right side.
Electronics 08 00364 g011
Figure 12. Diagnosis results. (a) Sensitive analysis; (b) magnetic field component of each port.
Electronics 08 00364 g012
Figure 13. Single-phase DC power supply filter. (a) Product picture; (b) insertion loss; (c) schematic diagram.
Electronics 08 00364 g013
Figure 14. Comparison of radiated electromagnetic interference (EMI).
Electronics 08 00364 g014
Figure 15. Test results of x polarization direction. (a) Left side; (b) right side.
Electronics 08 00364 g015

