1. Introduction
To enhance power generation efficiency, photovoltaic (PV) systems are generally installed at unshaded locations. However, if such systems are installed outdoors over a long period, the PV modules might be degraded with time, engendering power reduction or failure; the output power of the systems substantially decreases in the event of shading or failure. Because detecting PV module failure through unassisted vision is difficult, conventionally examining each module through manually operated instruments would be a time-consuming process [
1]. Therefore, establishing an effective fault diagnosis system is necessary.
Currently, numerous researchers are studying fault detection in PV systems. A previous study proposed a binary system coding method for detecting abnormal overcurrent situations in module arrays, thereby determining whether the modules are shaded [
2]; subsequently, an overlapped diode can be connected to the modules to prevent them from the effects of shading. This method focuses only on detecting the effect of overcurrent on modules. However, overcurrent is not the sole factor associated with shading and faults in PV module arrays. The data measurement and calculation processes in this method are complicated; therefore, operators must possess a considerable level of expertise in order to execute this method, thus imposing a challenge in implementation. Another researcher utilized a thermal imager for fault diagnosis [
3]. The researcher installed an additional thermal camera for detecting the temperature distribution of module arrays, thereby inferring the location of faults. However, when this approach is used in regions with relatively low irradiance, the temperature variation might not be substantial, resulting in reduced judgment accuracy. Moreover, the number of thermal cameras increases with the implementation area, raising the cost of large-scale PV power plant construction. Studies conducted on fault diagnosis have included additional sensors [
4,
5] for extracting characteristic parameters for fault detection. Nevertheless, such sensors may deteriorate due to prolonged exposure to outdoor environments, and the adoption of sustainable sensors increases development costs. To avoid the deterioration of sensors or the increase in construction costs, the author of this paper discarded the idea of installing sensors outdoors and previously developed a detection circuit with an artificial intelligence algorithm for fault detection [
6]; the disadvantage of this measure is that it can only determine which array in the module arrays is faulty, rather than the precise piece of faulty module.
A previous study proposed a MATLAB-based modeling and simulation scheme for analyzing PV module arrays under shaded conditions [
7]. In this scheme, the variations of current–voltage (I–V) and power–voltage (P–V) characteristic curves are analyzed according to the number of shaded modules, configuration of PV module arrays, and whether a bypass diode or a blocking diode is installed. Finally, the relevant simulation parameters constitute the basis for determining shading or failure. In practice, the parameters of a PV module change when a failure occurs, resulting in imprecise fault output characteristics that yield inaccurate results.
Thus, to ameliorate the aforementioned deficiencies, this paper proposes a PV module fault diagnosis system that is based on a binary search algorithm [
8]. This system accurately locates faulty modules and also requires only a low number of voltage sensors; thus, it has a low construction cost.
2. Maximum Power Point Tracking Techniques for PV Modules
2.1. Existing Maximum Power Point Tracking Techniques
To maintain the output power of a PV system at the maximum power point (MPP), maximum power point tracking (MPPT) techniques are commonly employed, such as variable universe fuzzy logic control considering temperature variability [
9], power feedback method [
10,
11], perturb and observe method [
12], and incremental conductance method [
13]. This study integrated particle swarm optimization (PSO) with an existing conventional MPPT technique to prevent the output characteristic curve from producing more than two peaks, which might produce results that are constrained in local maxima and fail to track the actual MPP [
14,
15,
16], when shading or failure occurs in PV module arrays. The proposed PSO algorithm employs a digital signal processor combined with a boost converter to achieve MPPT. Finally, failure cases were examined to verify the feasibility of the proposed method ensuring that a PV module array can operate at the MPP even with faulty modules at various locations.
2.2. PSO-Based MPPT Technique
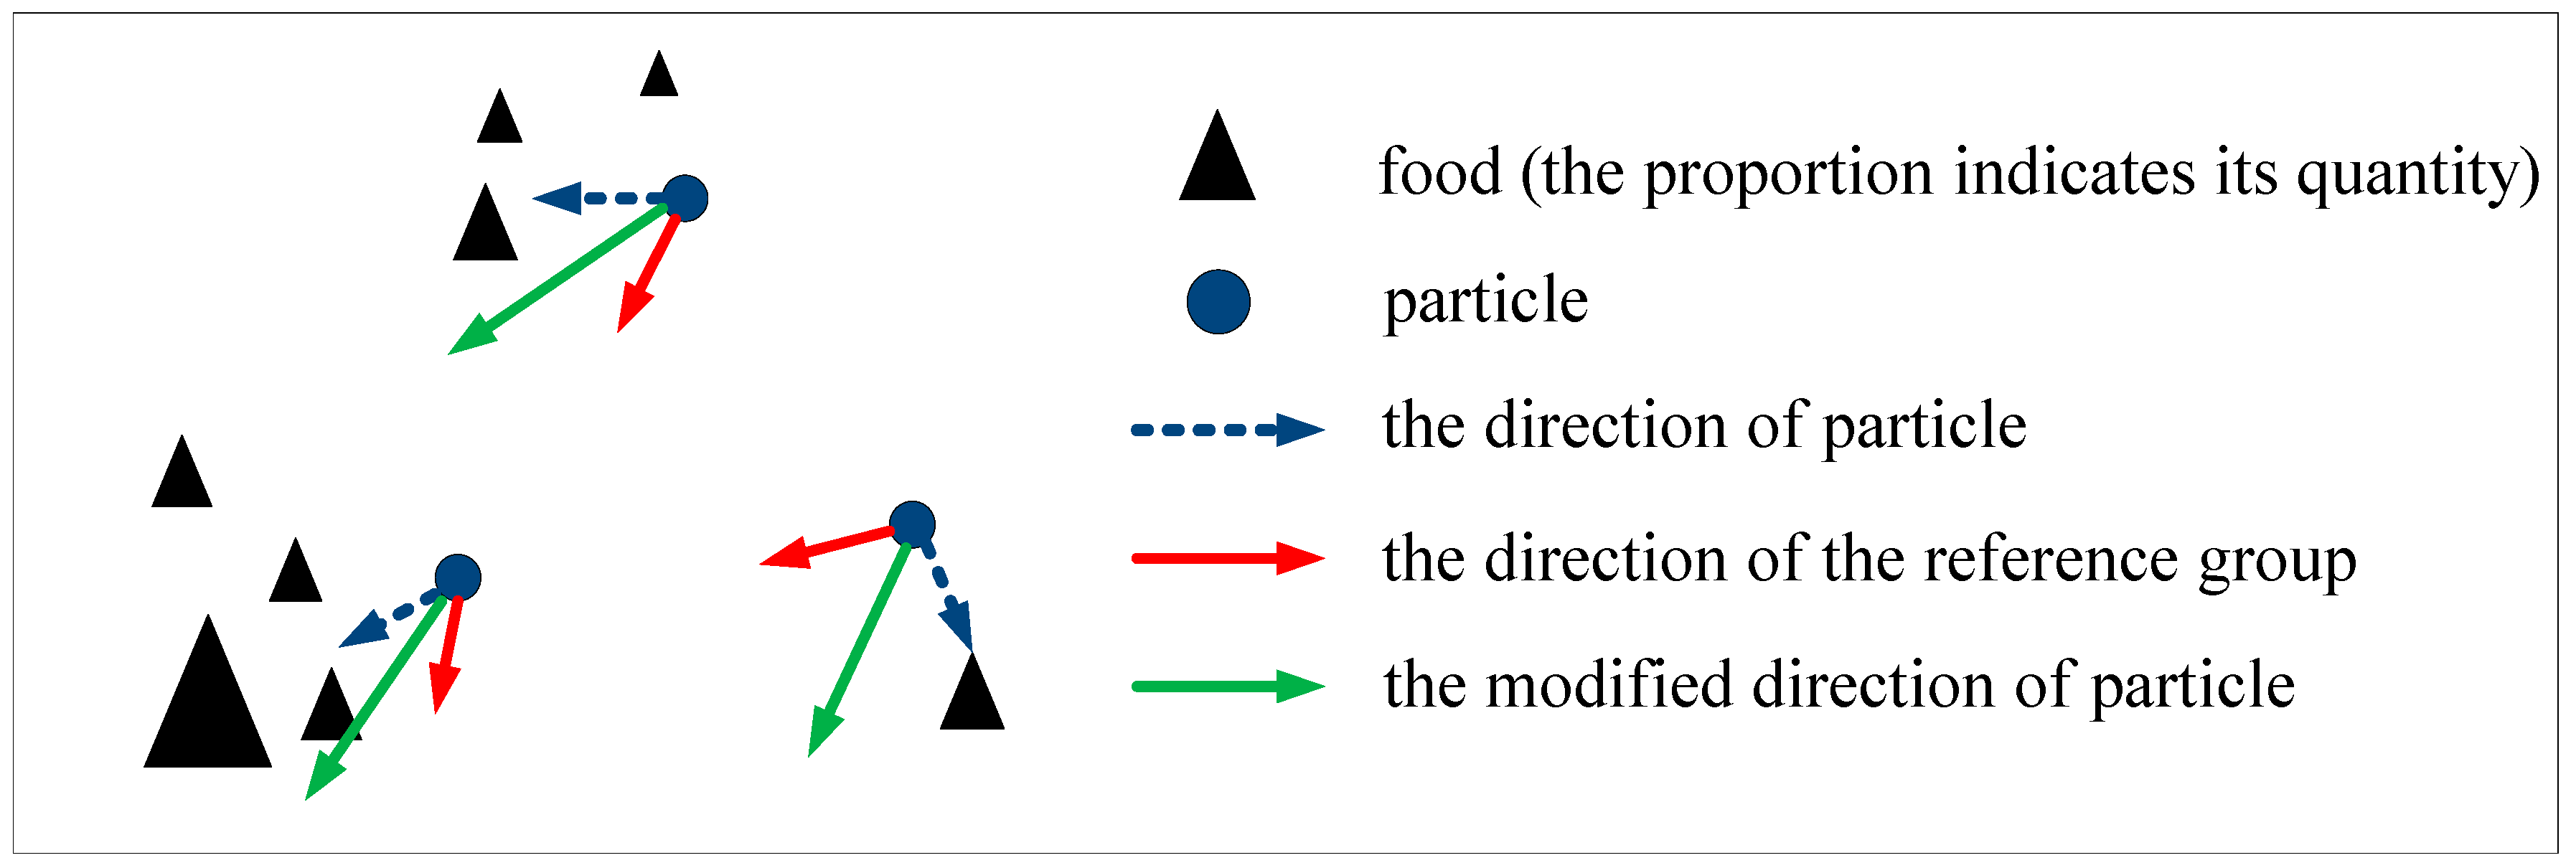
PSO, an artificial intelligence algorithm, was proposed by Kennedy and Eberhart in 1995 [
17]. This algorithm is inspired by information transmission associated with the foraging behaviors of birds. The algorithm comprises two essential parameters, namely the particle best value (
Pbest) and global best value (
Gbest), which influence the particle’s direction and its search direction, respectively. Each bird is regarded as a particle, and any particle possesses the memory and experience generated during its own movement. A particle can learn to adjust its own movement according to its individual experience and memory. In PSO, several particles move simultaneously, and a specific particle compares its experience with the experience of other particles simultaneously to determine the local optimal solution. Because of the characteristics of PSO, particles can learn and memorize the evolution of swarms in addition to their own evolution, thus assisting them in searching for the best value. The schematic of the PSO search approach is shown in
Figure 1.
The operating procedures of the PSO-based MPPT algorithm are outlined as follows:
- Step 1:
The number of particles (itotal) is set to 4, iteration number (jtotal) is set to 100, weight value (W) is set to 0.4, individual learning factor (C1) is set to 2, and group learning factor (C2) is set to 2.
- Step 2:
The duty cycle is set as the position of a particle, and the desired objective function is established (i.e., the output power value of the PV module array).
- Step 3:
The present voltage, current, and power value of the PV module array are obtained after the position of the particle is set in step 2.
- Step 4:
The fitness function values of the particles are compared to determine the best position in order to update the best position a particle has memorized (Pbest).
- Step 5:
Pbest is compared with Gbest. If Pbest is superior to Gbest, the current Gbest value is replaced by the Pbest value.
- Step 6:
Equations (1) and (2) of the PSO algorithm are used to update the parameter of each particle:
In the preceding two equations, and denote the speeds of particle i at time points j and j+1, respectively; W denotes the inertia weight; C1 denotes the cognitive learning factor; C2 denotes the social learning factor; rand1 () and rand2 () denote randomly generated values in the range of 0–1; denotes the best value for individual i at j; and Gbest denotes the best fitness value of the swarm. In addition, and represent the positions of i at j+1 and j, respectively.
- Step 7:
Steps 2–6 are repeated until the maximum number of iterations is attained.
- Step 8:
An assessment is conducted to determine whether the shading or failure condition changes. If the condition changes, the previous steps are repeated starting from step 1; otherwise, the ultimate value is retained.
3. Fault Detection Based on Binary Search Algorithm
In computer science, a binary search refers to a search algorithm that searches for a particular element in an ordered array. The search process starts from the middle elements of the array. If a middle element matches a target element, the search process is terminated. If the value of the target element is higher or lower than that of the middle element, the search continues in the half of the array that contains the element with the higher or lower value, respectively. Subsequently, the search continues by comparing the middle element of the array with the target element. In each comparison, the search method reduces the search range by half. Therefore, regardless of the number of series-parallel PV modules, the operating procedures of the proposed binary search method are the same. The operating procedures of the binary search method are outlined as follows:
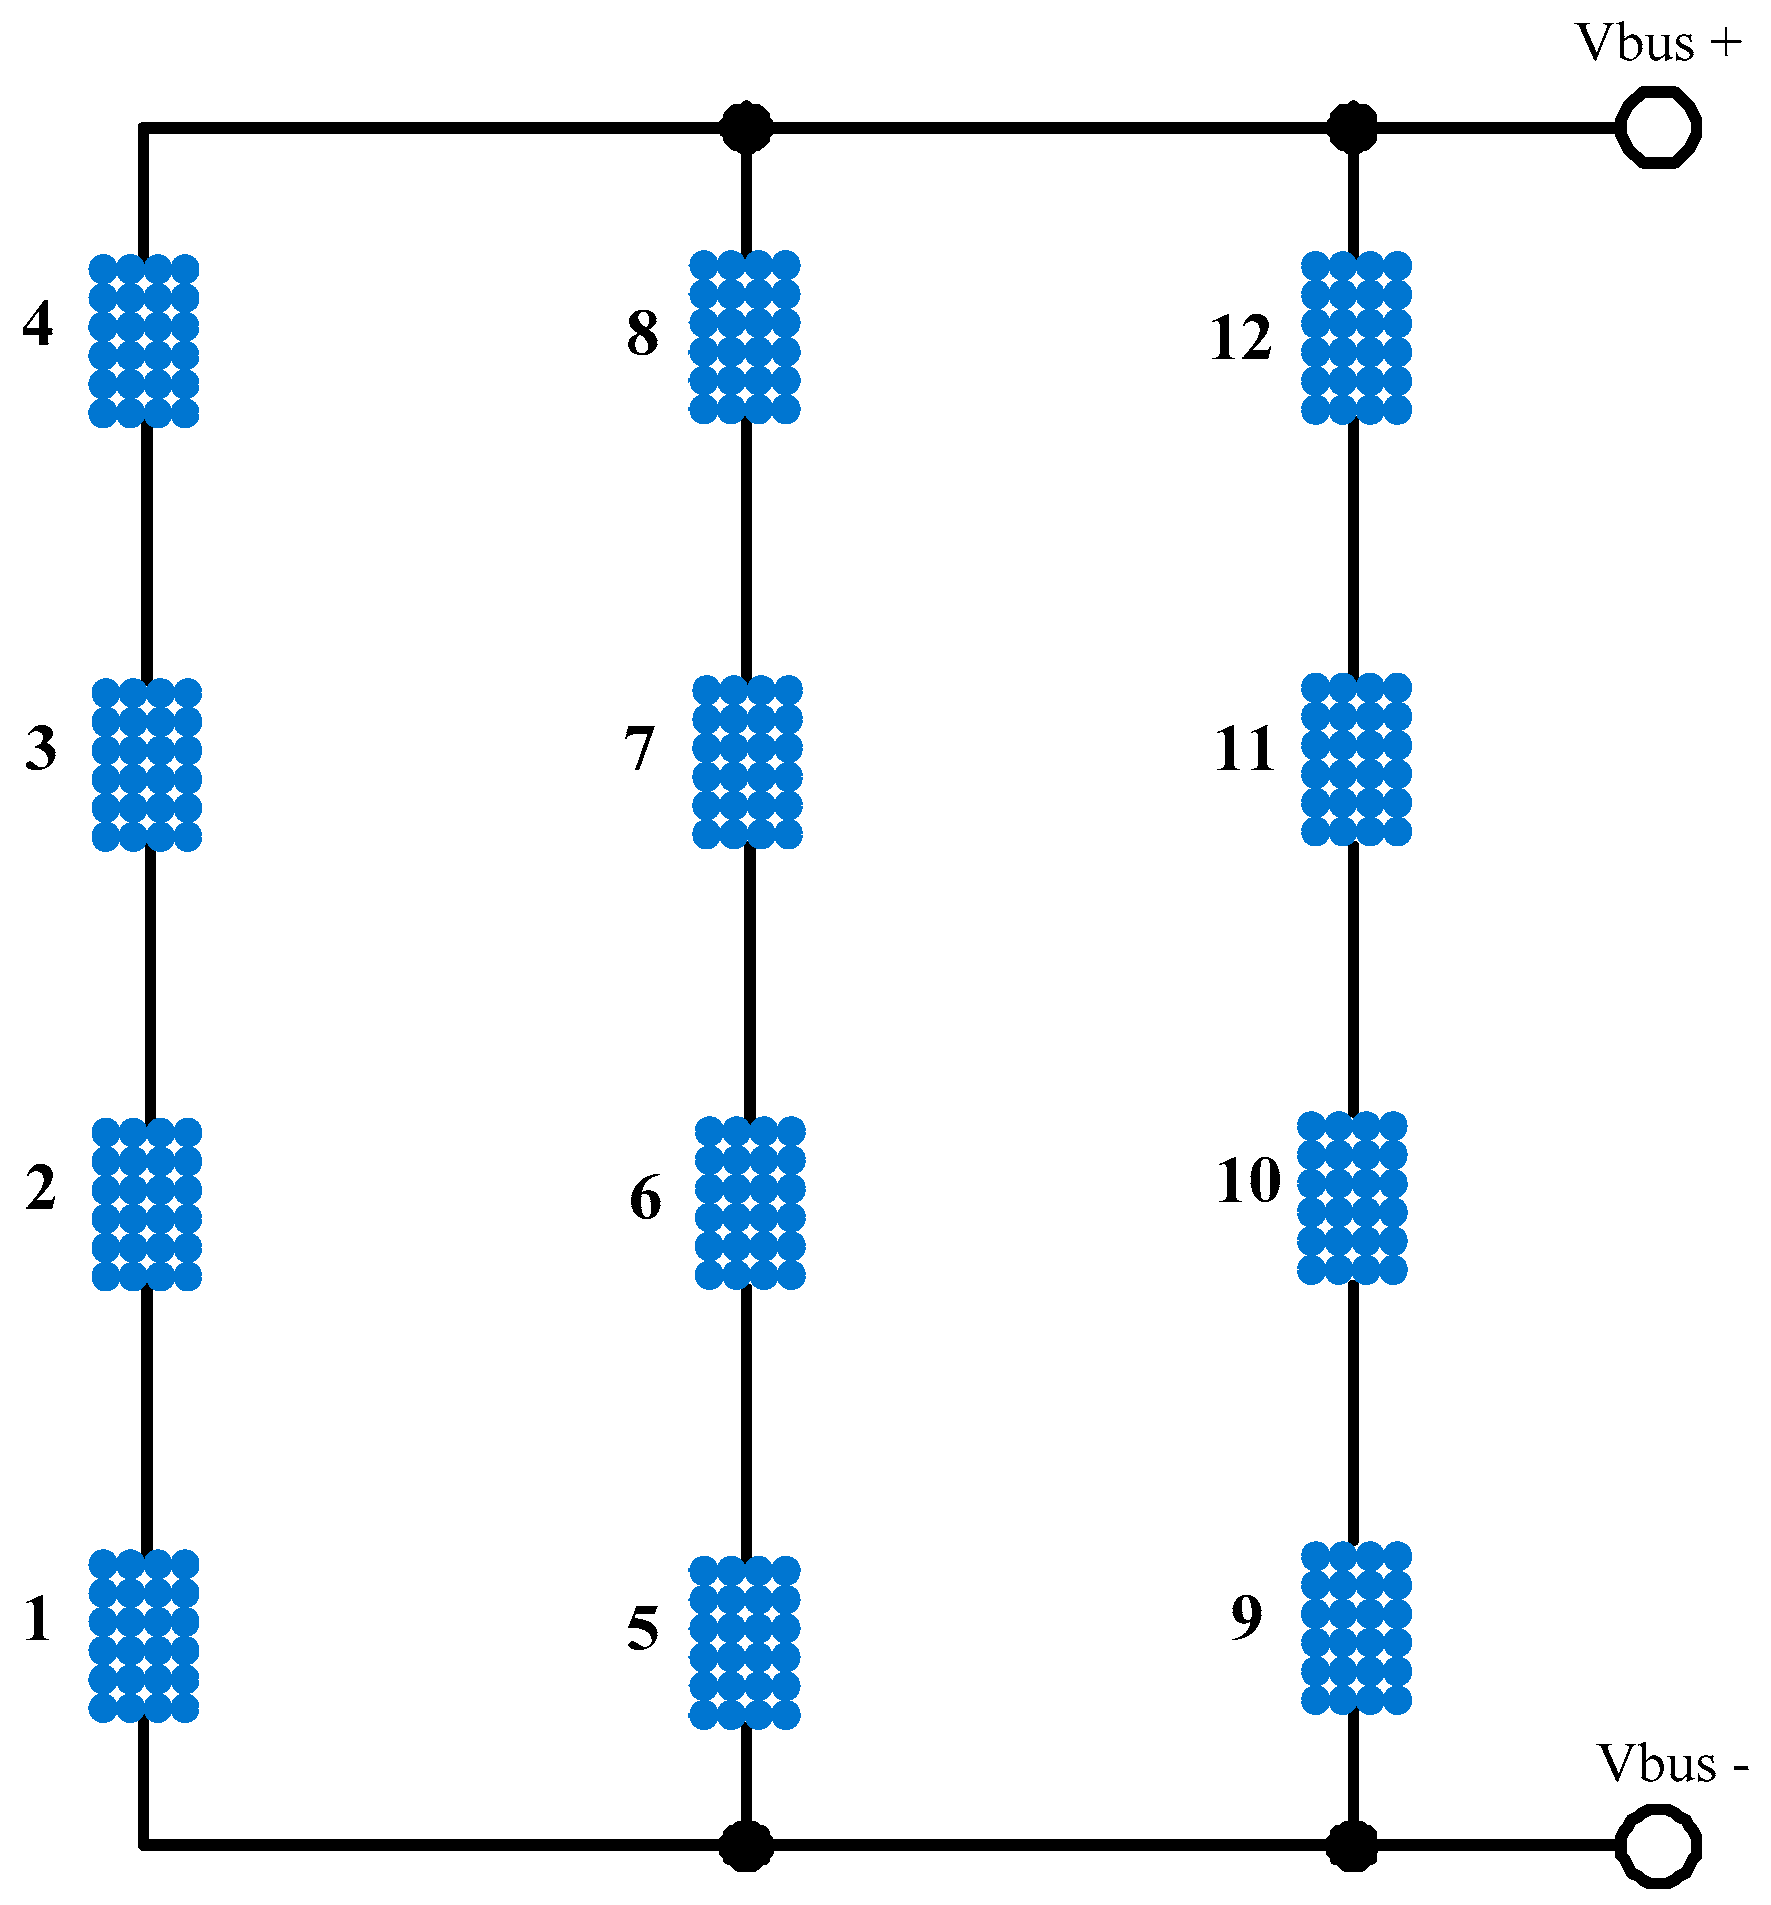
- Step 1:
Figure 2 illustrates a 4 × 3 series-parallel module array used for testing. Each of the 12 modules in the PV module array is assigned a code from 1 to 12 for identifying abnormal modules during detection. Subsequently, the arrays are divided into six regions, namely
L1,
L2,
L3,
R1,
R2, and
R3 (as shown in
Figure 3), and each voltage node between the modules is assigned a code from
A to
K.
- Step 2:
The voltage relationships among the regions
L1 and
R1,
L2 and
R2, and
L3 and
R3 are compared to identify regions in which abnormal modules may occur. The voltage of each region can be determined from the voltage between nodes (i.e.,
B,
E,
H,
J and
K); the calculation procedure is presented in Equation (3), where
Vref is the reference voltage of each region without module failure. If the voltage of a certain region is equal to
Vref, the region does not contain malfunctioning modules.
- Step 3:
Each region’s voltage data calculated using Equation (3) are then used to determine the search direction according to
Table 1. If the direction cannot be identified, the module array is not malfunctioning or under full shading. However, the probability of full shading (or full failure) is approximately 0; therefore, it is not considered.
- Step 4:
After the search direction is determined through
Table 1, the voltage of each module within the region involving a failure is calculated. For example, if the fault is type 1, then the voltages of module 1 and module 2 in
L1—which might contain a faulty module—are calculated (
Vmodule1 =
VAK and
Vmodule2 =
VBA, respectively). For the remaining fault types, the voltage of each module within the region involving a fault is calculated according to the same principle.
- Step 5:
The voltages of modules within the region involving potential faults are compared; the module with a relatively low voltage is considered abnormal. If the search direction covers more than two regions, the voltages of the modules in each region are directly compared, and the module with a lower voltage is considered faulty. The flow chart of the binary search algorithm is shown in
Figure 4.
4. Establishment of Fault Diagnosis Framework for PV Modules
Because weather conditions change constantly, it is difficult to reproduce the testing under the exact same weather conditions. Thus, it is a disadvantage for conducting fault diagnosis repeatedly under certain weather conditions anytime. Therefore, researchers must establish an MPPT system, fault detector, a software platform developed using Visual C#, and a PV module simulator applicable to examining various shading and fault conditions. In addition, Solar Pro simulation software can be applied to verify the corresponding electrical characteristics.
4.1. Development of MPPT System
MPPT is conducted using PSO because it can overcome the problem of multi-peak P–V curves. This problem occurs under failure or shading conditions and can prevent the detection of the actual MPP [
18].
Figure 5 shows the framework of the PSO-based MPPT system.
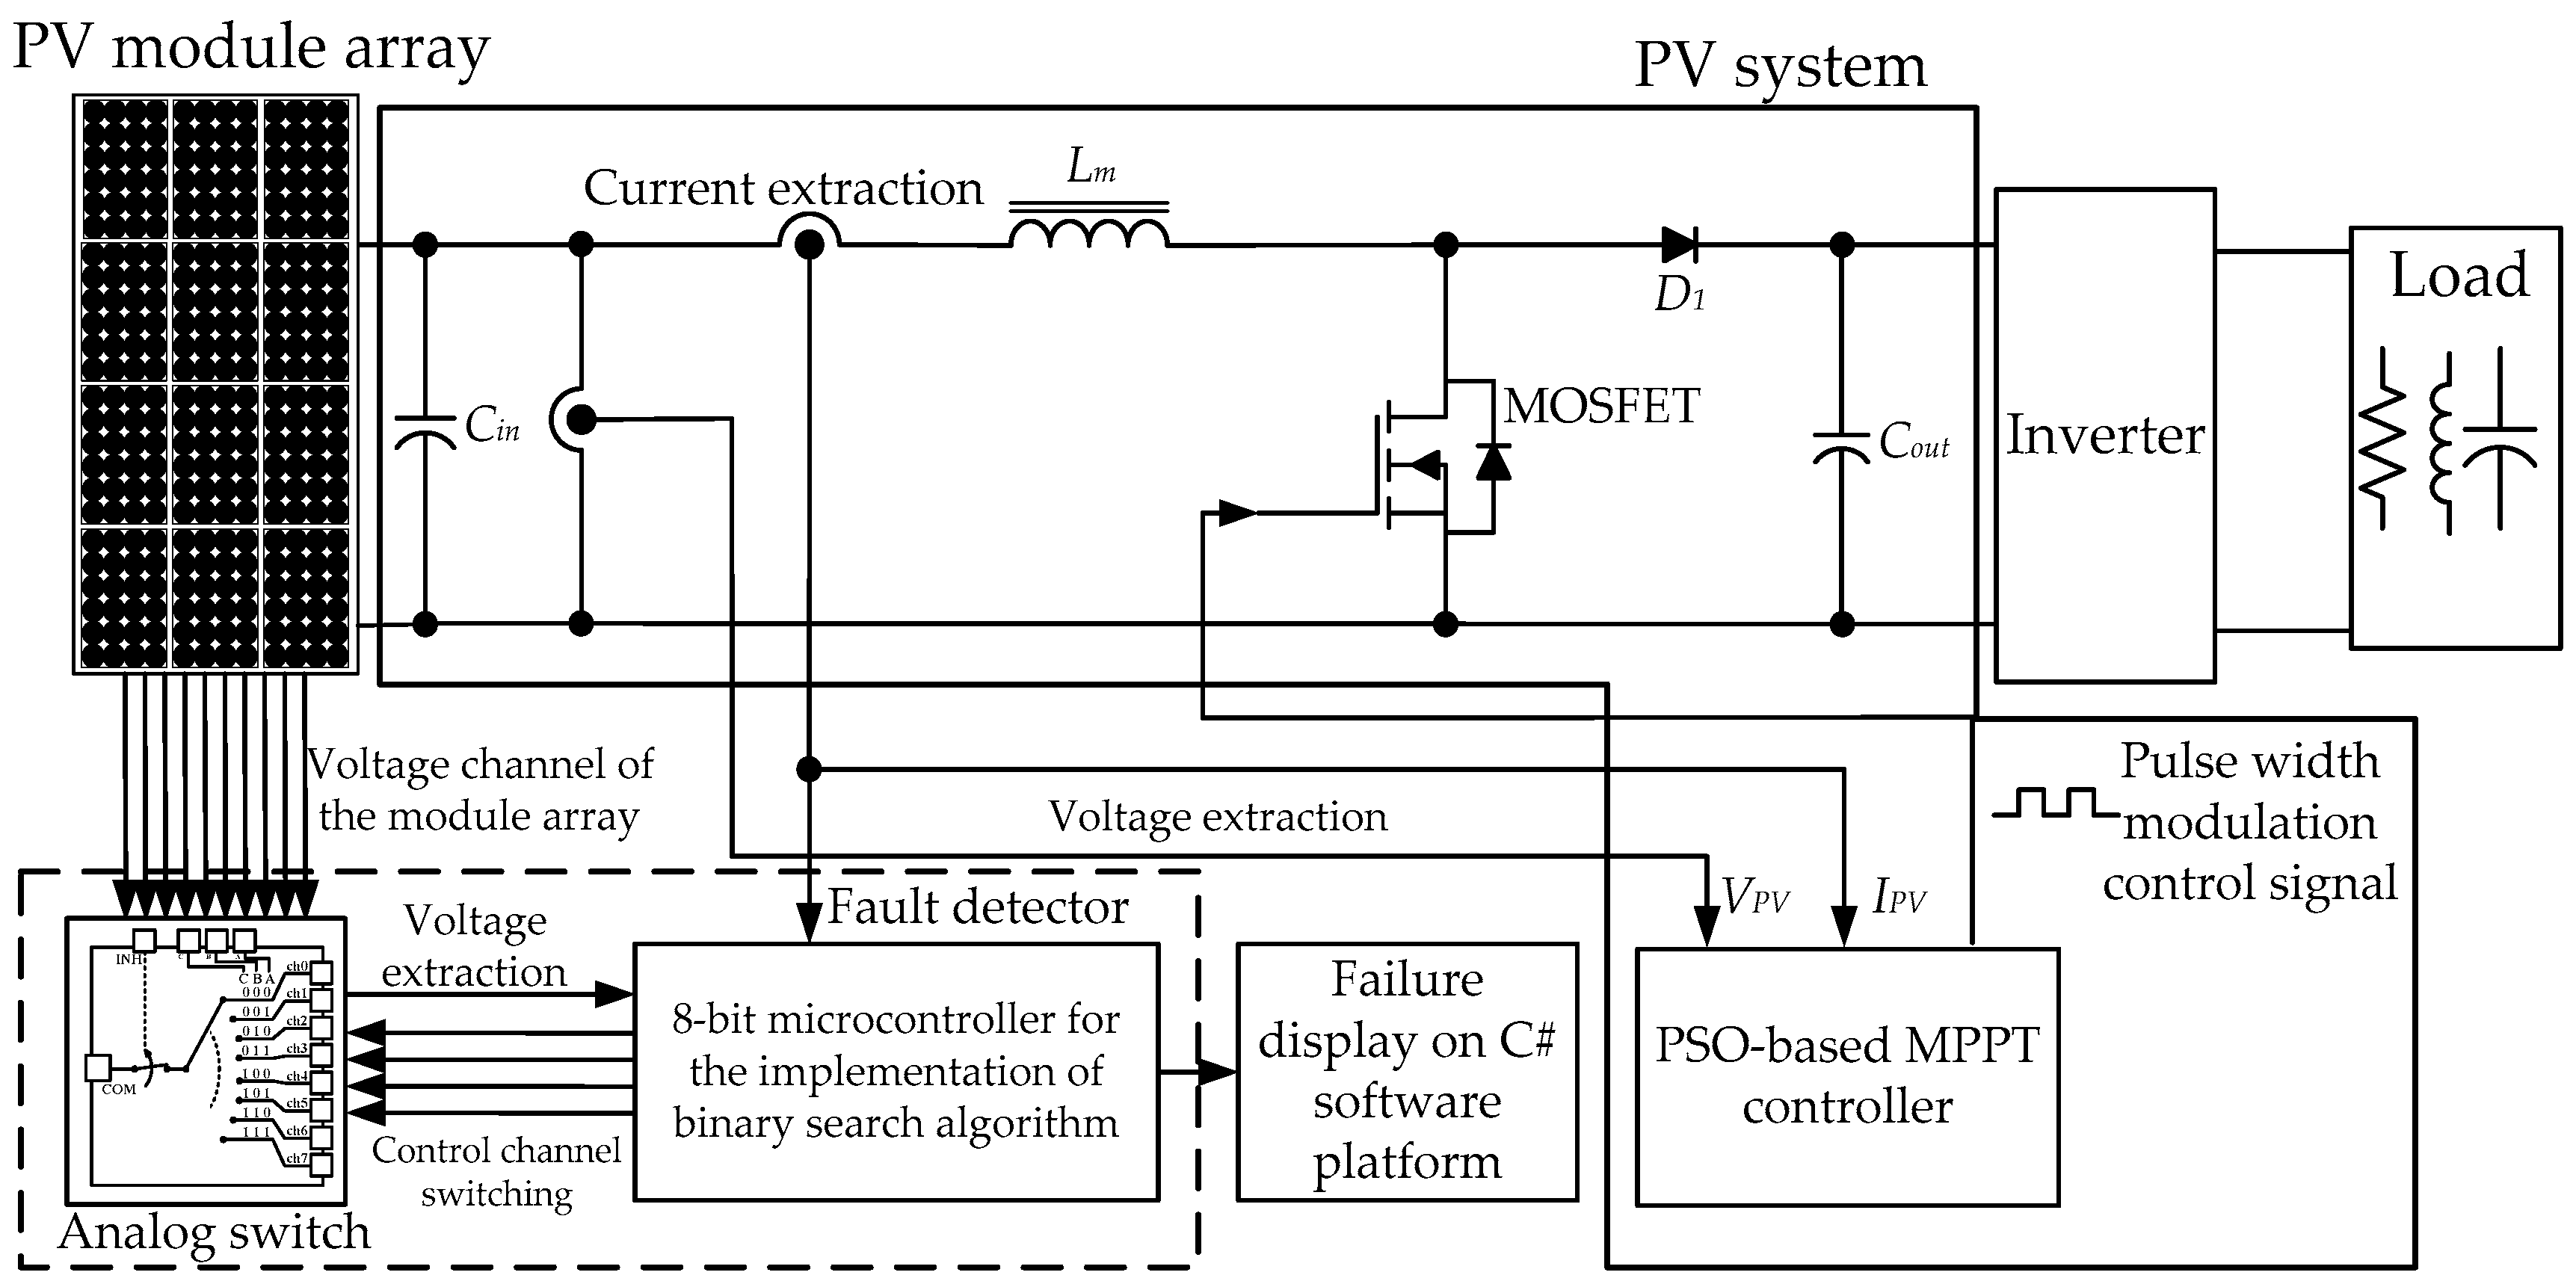
4.2. Development of Fault Detector
This study adopted a low-cost 8-bit microcontroller PIC18F8720 manufactured by Microchip Technology Inc. [
19] to implement an online fault detection method. The detector applies a binary search algorithm to solve the problem of multi-node voltages. Moreover, analog switches are used to switch the detection channels to reduce the number of integrated circuit components. The test results are displayed on a software platform developed using Visual C#.
Figure 6 presents the overall framework of the system.
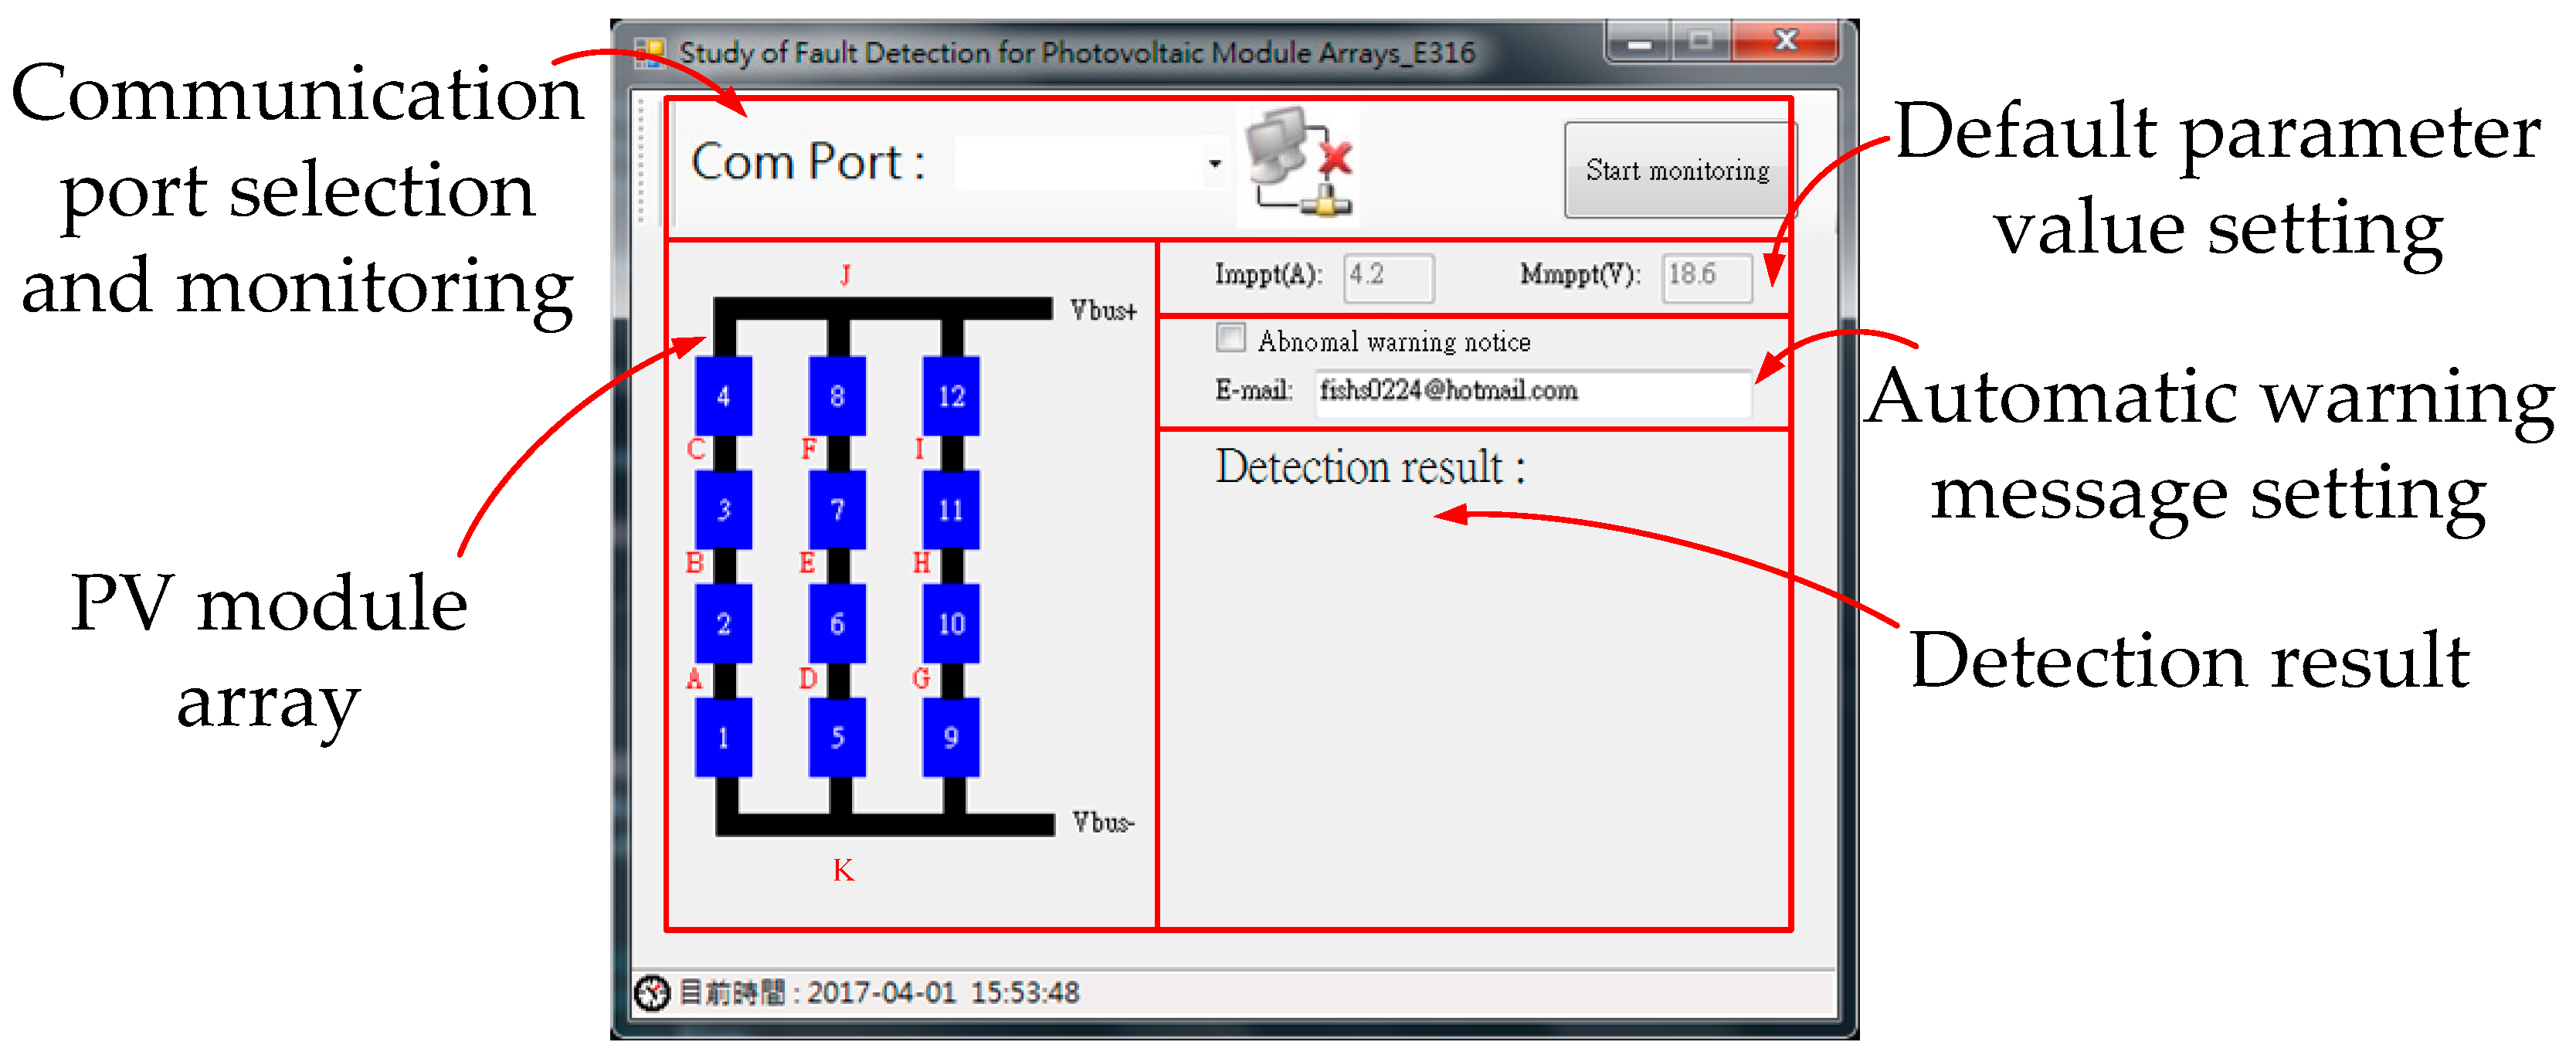
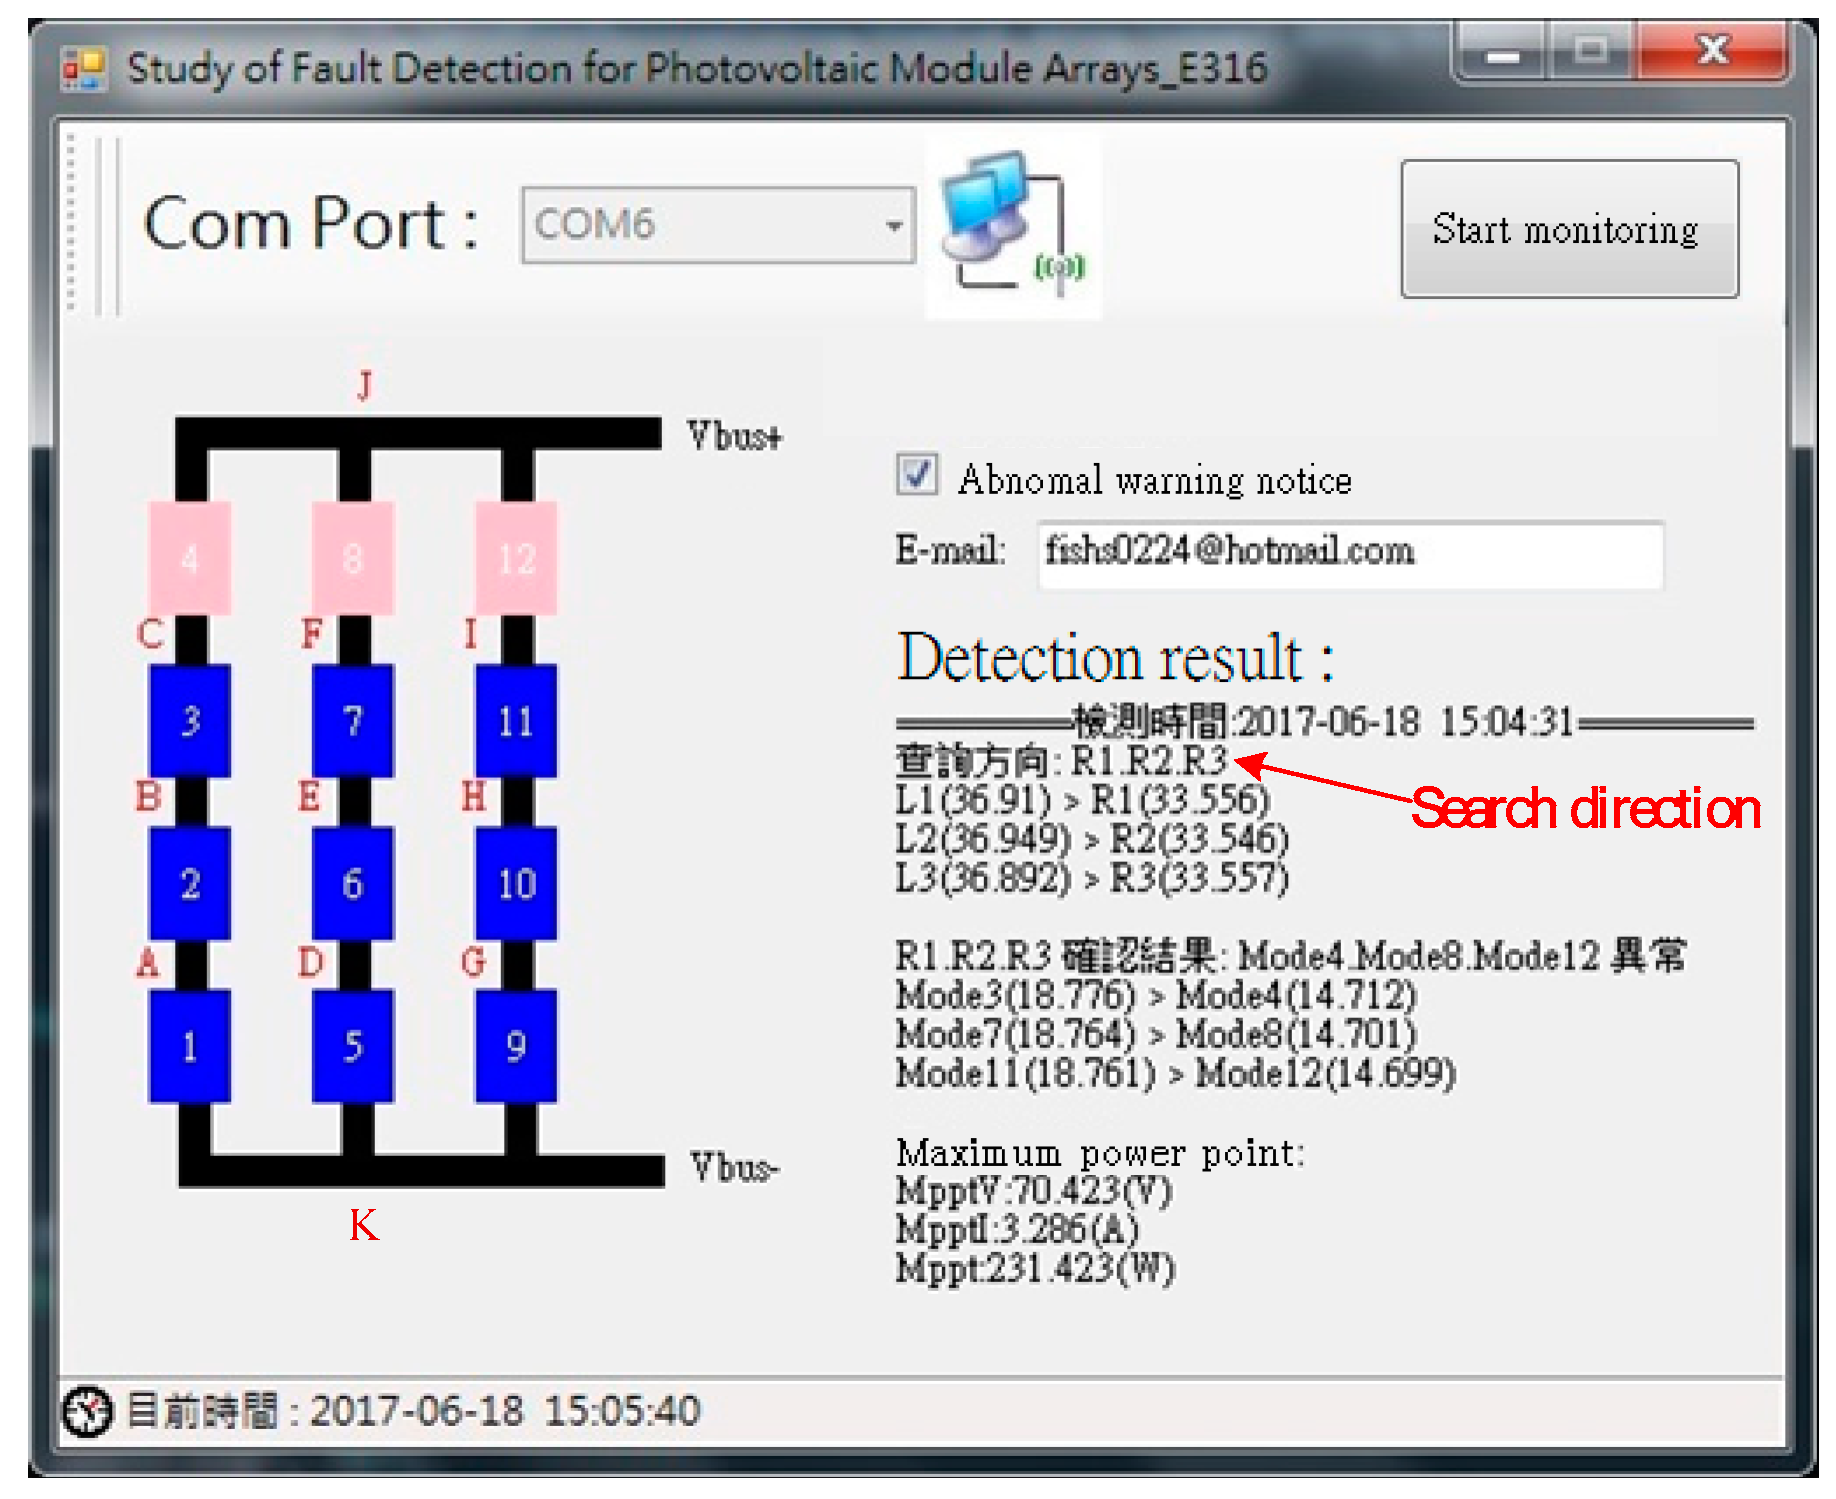
4.3. Software Platform Developed Using Visual C#
Figure 7 depicts the interface of fault diagnosis software developed using Visual C#. Users should select the appropriate communication port before initiating a monitoring process; after this selection, the detection result is displayed in the detection result section. If a module failure occurs in the PV module array, the color of the faulty module turns from blue to pink to notify the user (
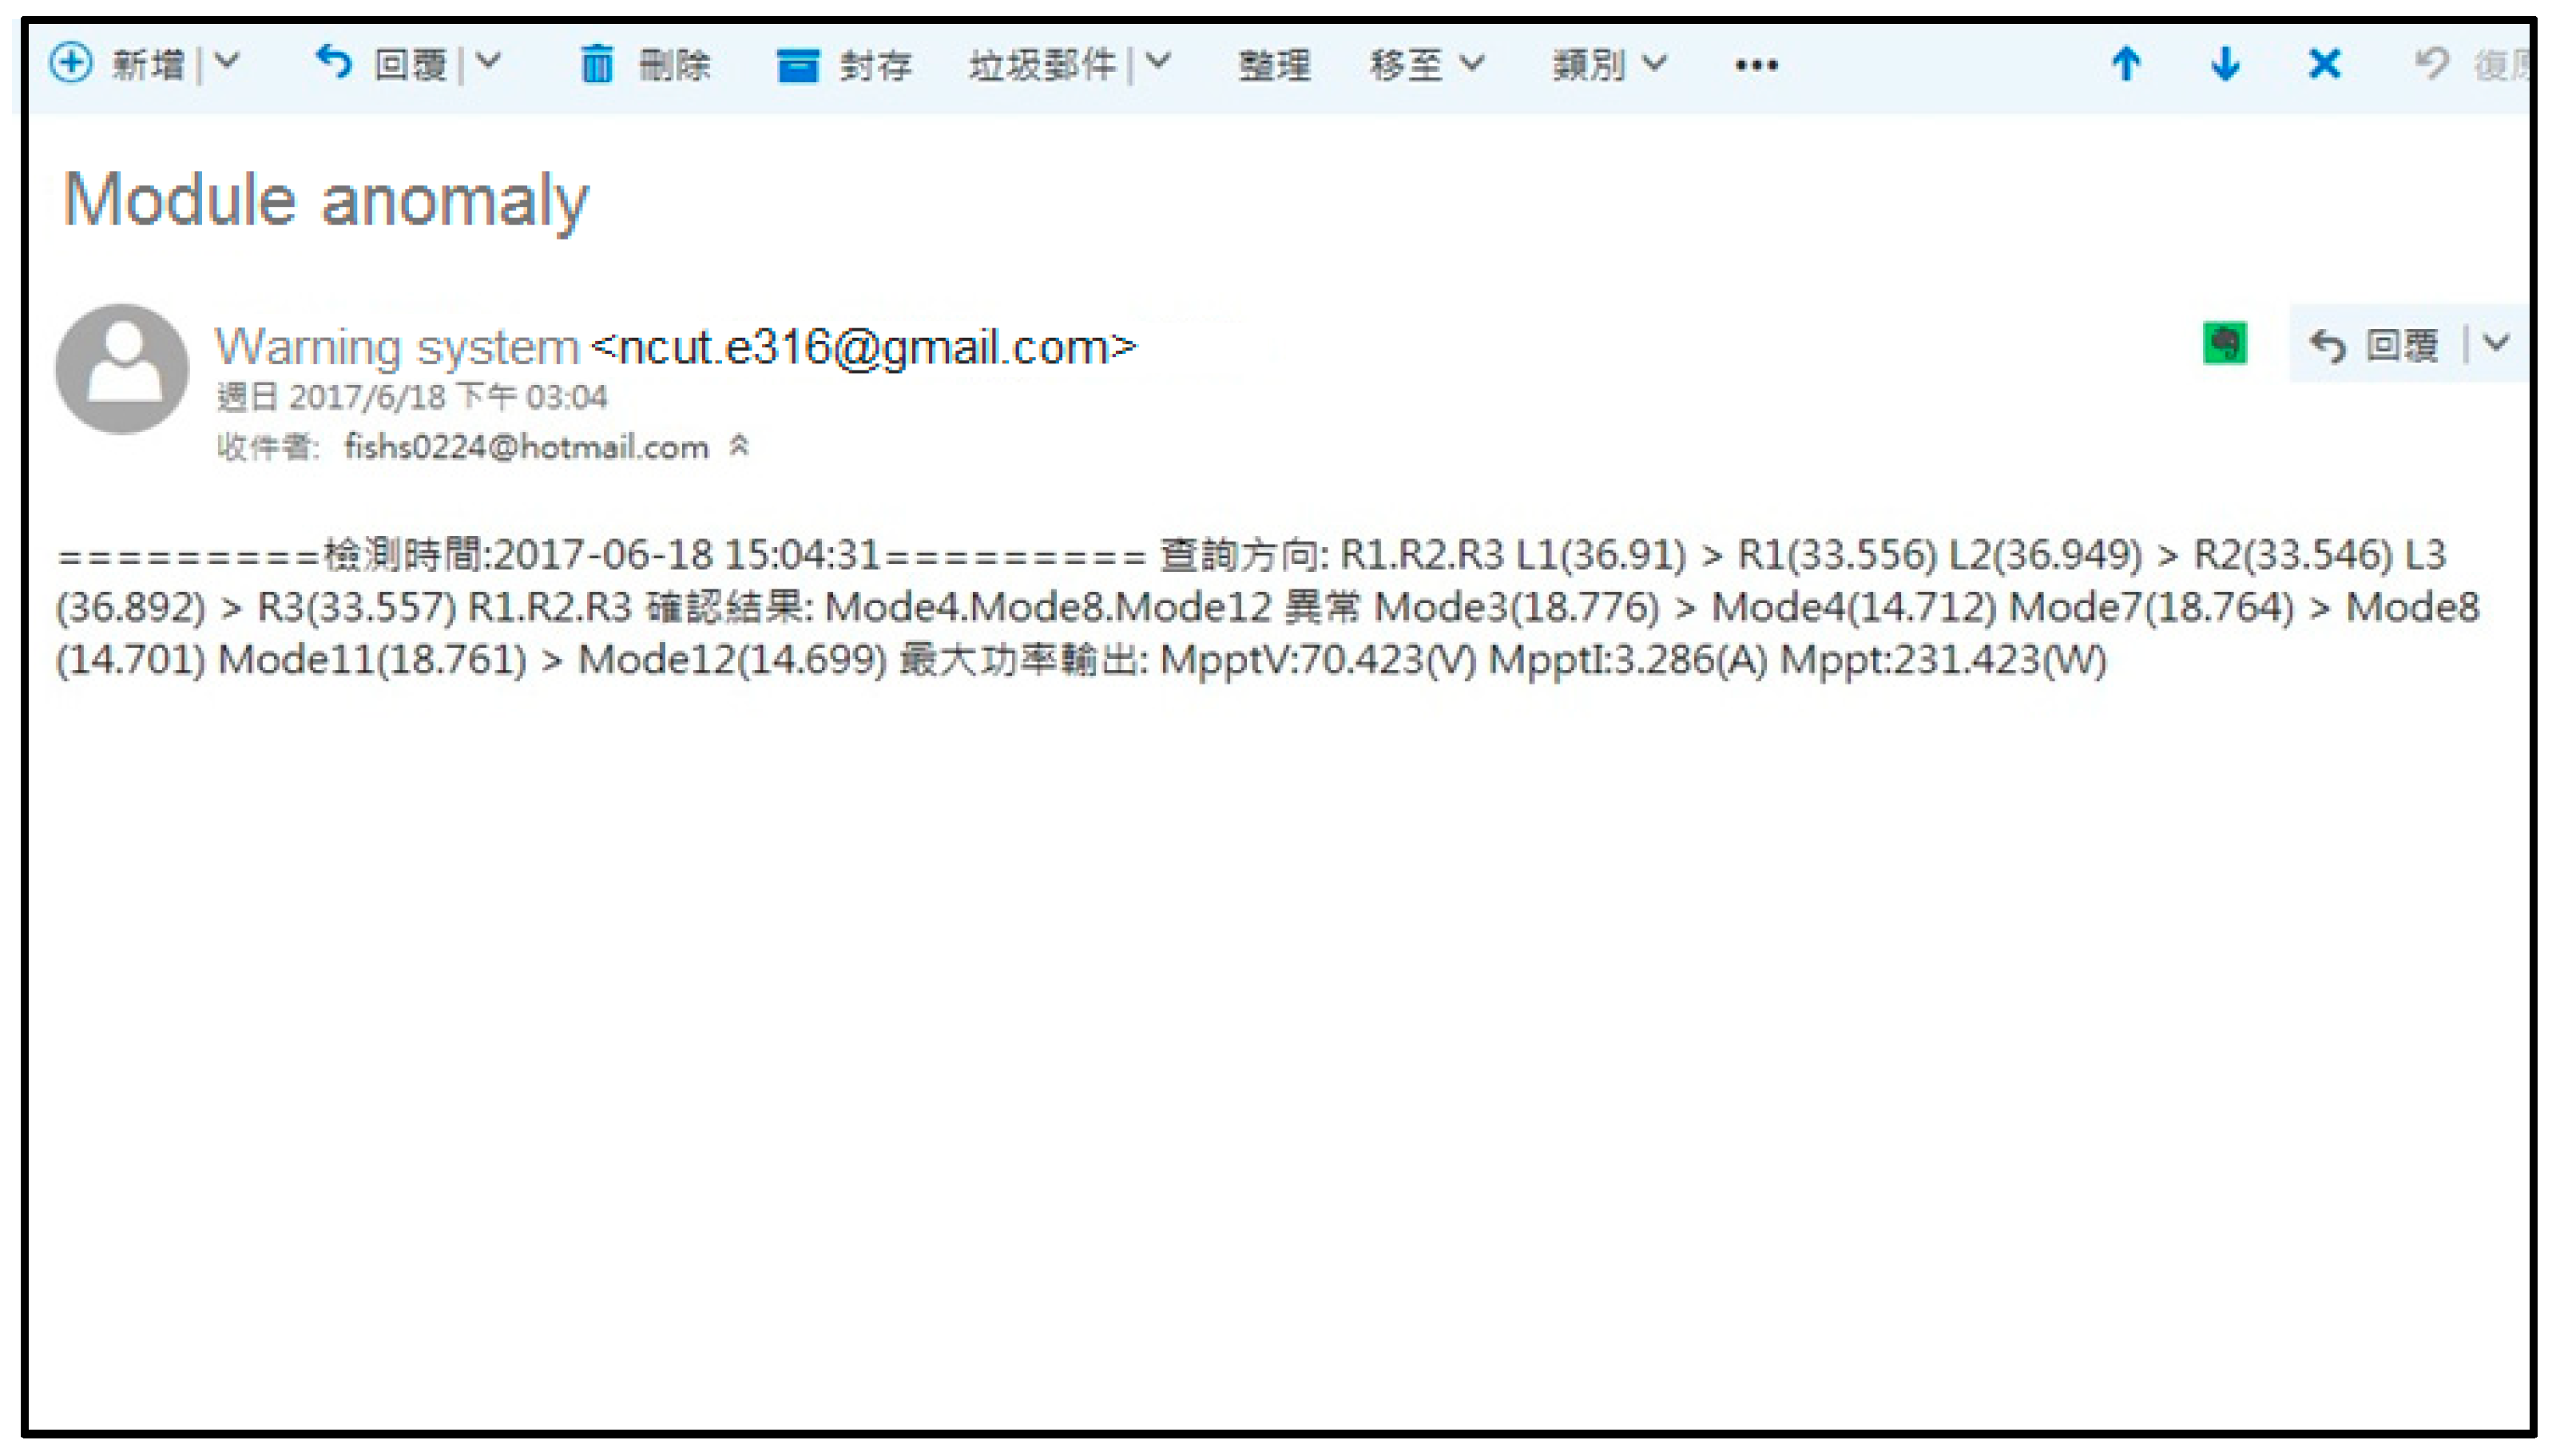
Figure 8). In addition, the system automatically sends the detection result to the user through e-mail if the automatic alert box is checked and the user provides an e-mail address in advance (
Figure 9).
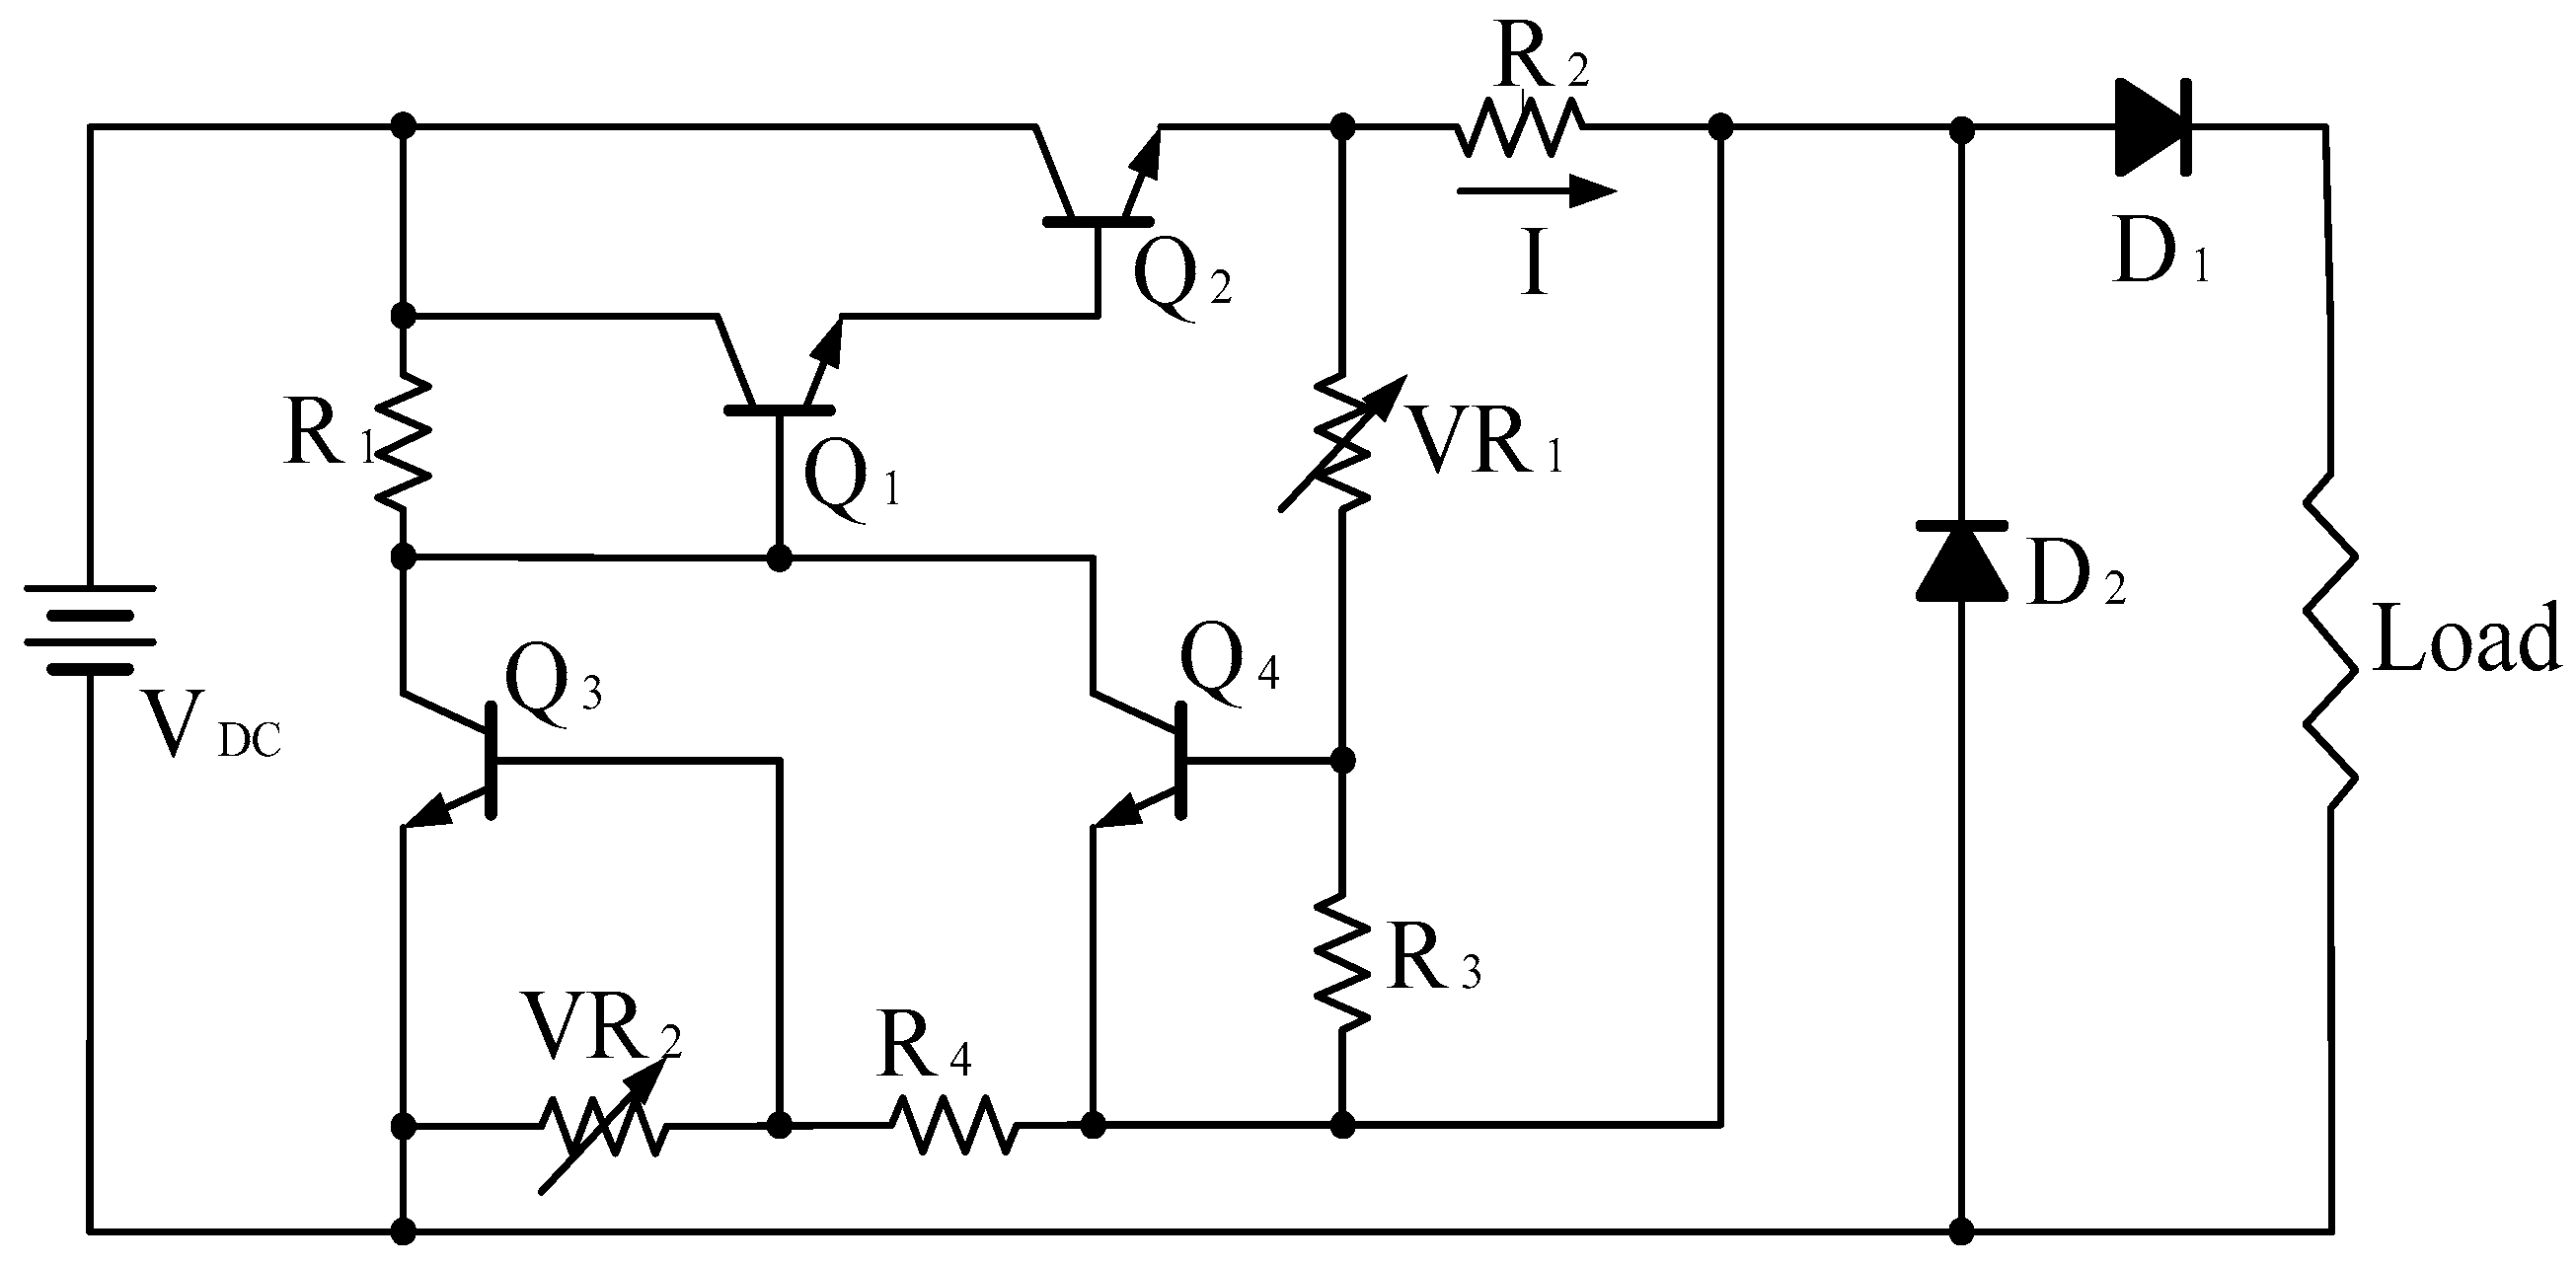
4.4. Establishment of PV Module Simulator with Adjustable Settings for Shading and Failure
The SANYO HIP-2717 PV module simulator can be set for shading and fault conditions.
Figure 10 illustrates the circuit framework of the simulator. The value of the open-circuit voltage and short-circuit current of the simulator can be adjusted to reflect the electrical characteristics of various shade conditions. In the simulator, shading was set to 0% and 30%.
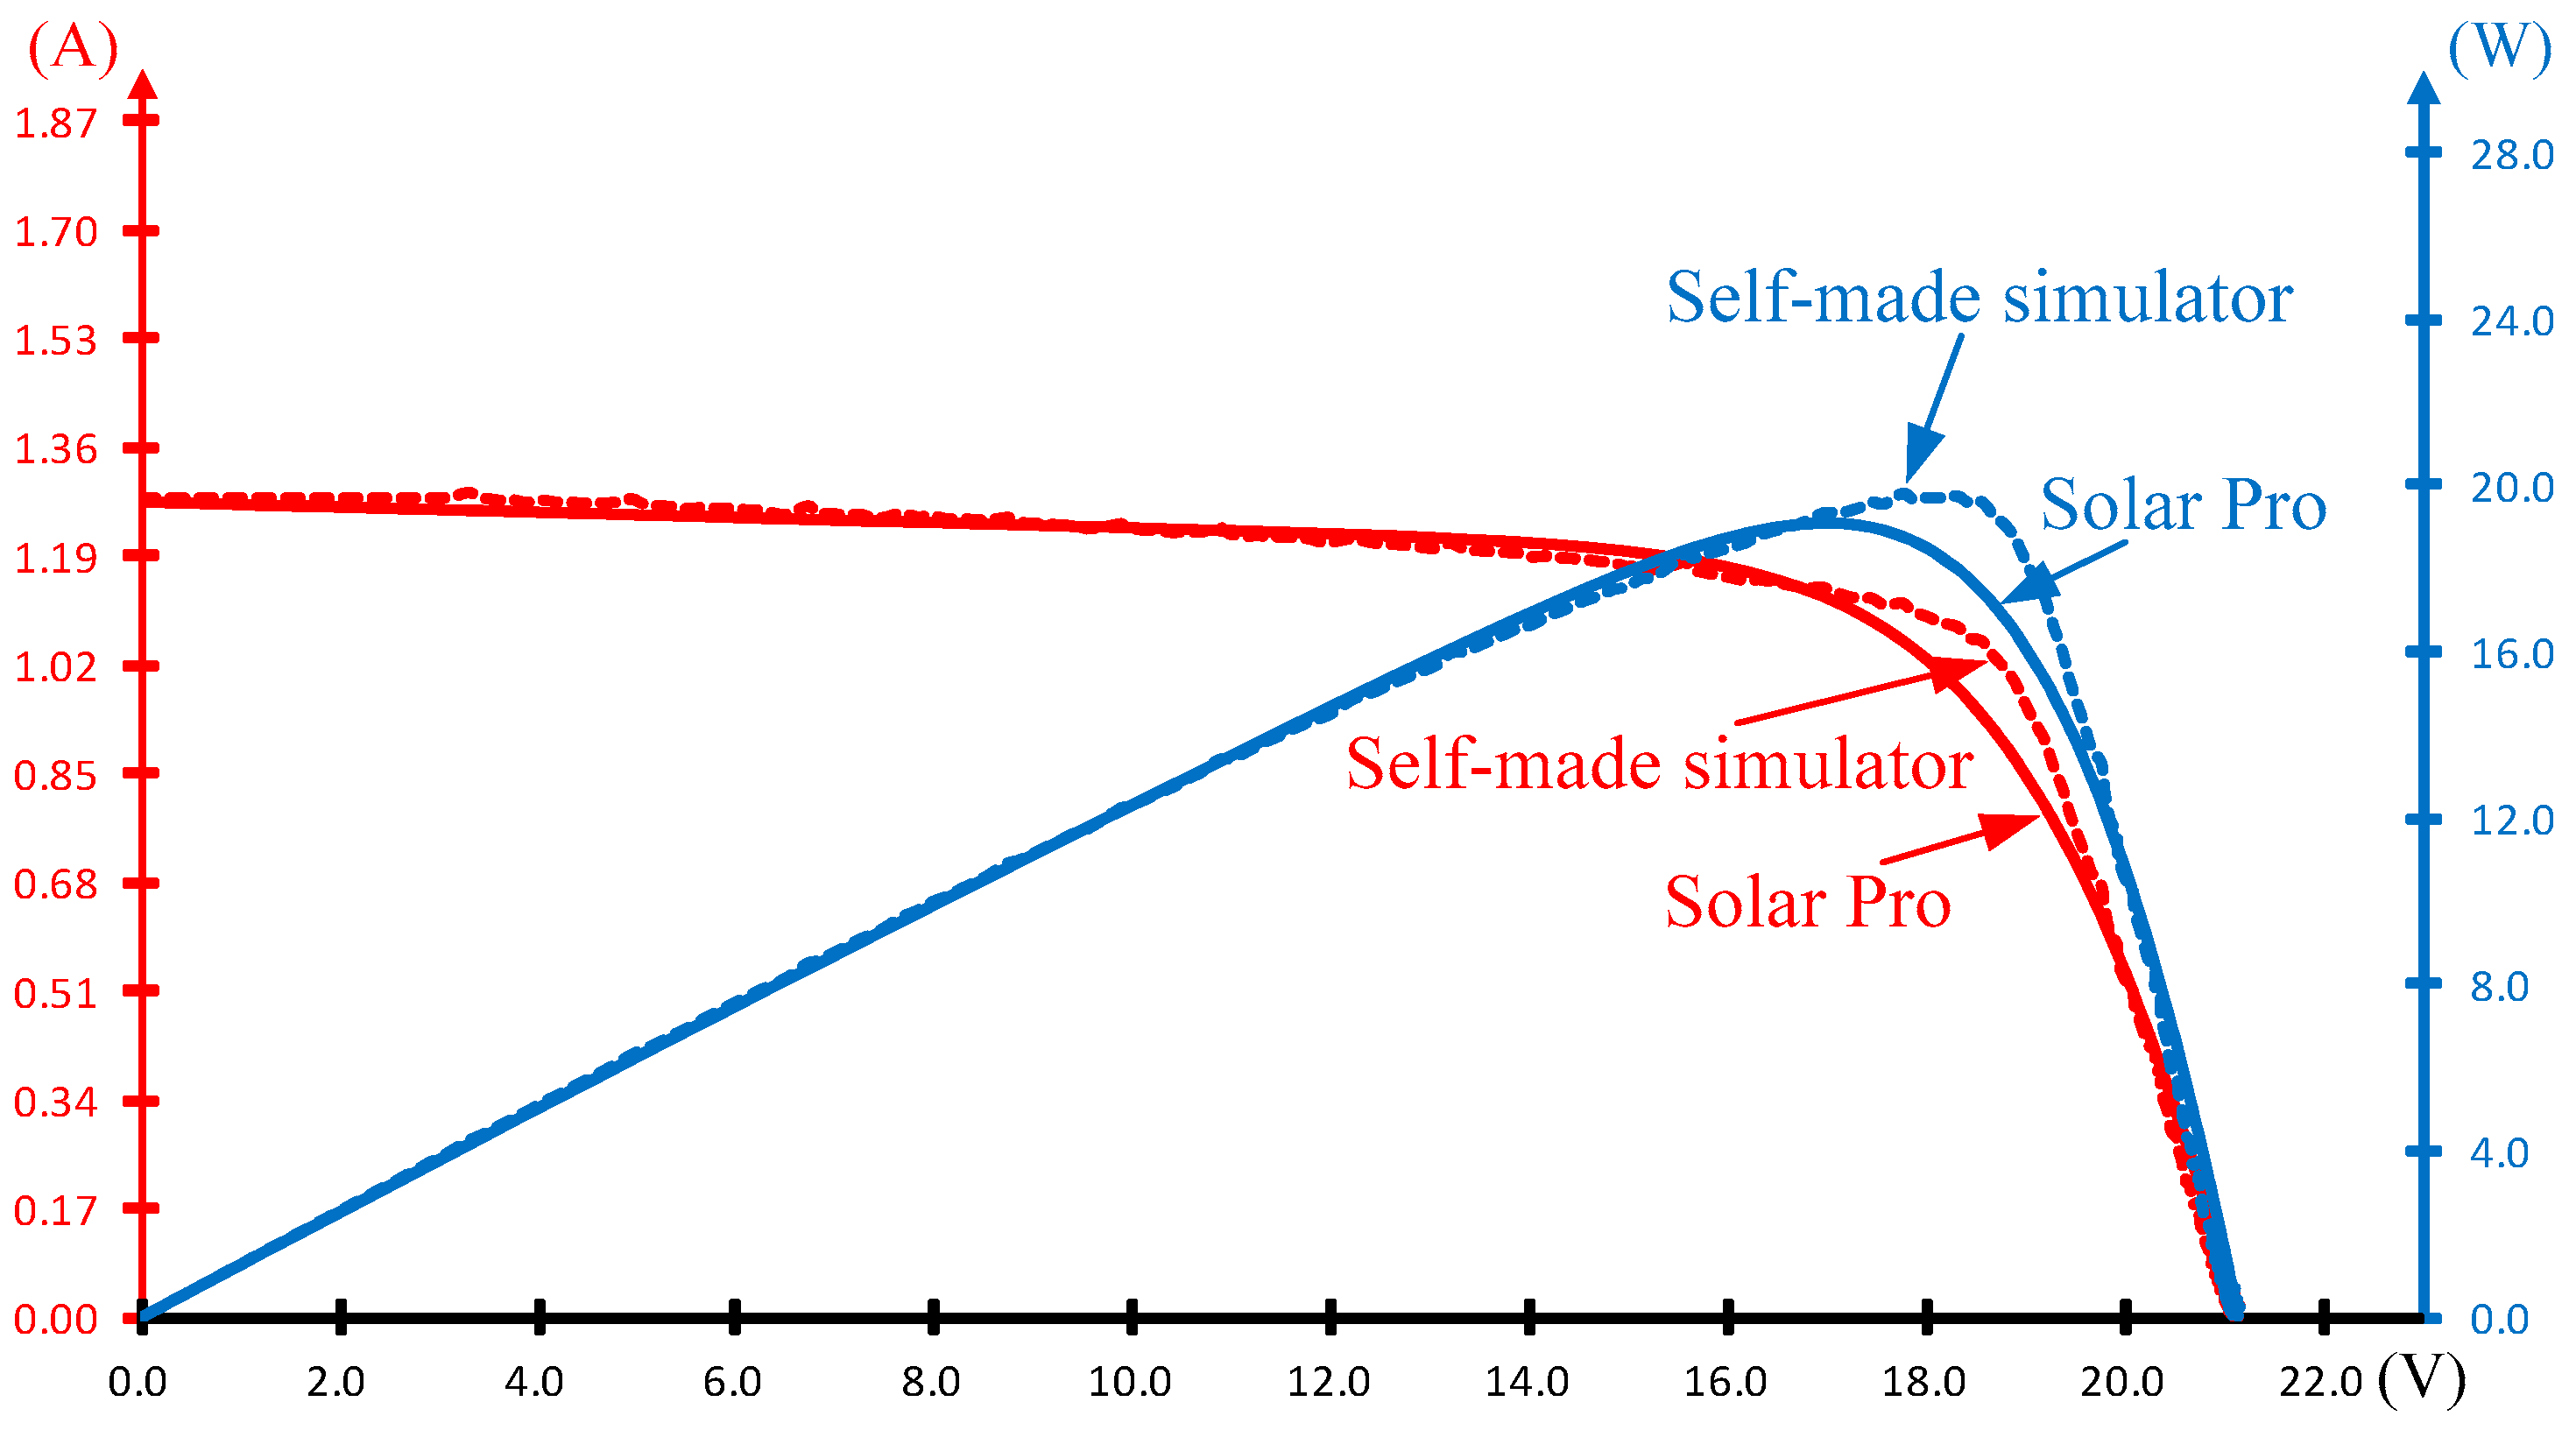
Figure 11 and
Figure 12 present comparisons of I–V and P–V curves measured by the EKO MP-170 I–V checker and those plotted using the Solar Pro simulation module at an irradiance of 1000 W/m
2 (0% shading) and 700 W/m
2 (30% shading), respectively. The characteristic curve of the proposed simulator is shown to conform to the characteristics of the SANYO HIP-2717 module. Based on the analysis in Reference [
20], it can be seen that the open-circuit voltageof the module at normal operation and shaded condition are calculated in a different way. Therefore, the characteristics of I-V and P-V curves will be different under normal operation and shading conditions. This will result in underestimation at 0% shading and overestimation at 30% shading. However, the curve trends of the simulator are consistent with that of a real photovoltaic module.
4.5. Establishment of Technology for Processing Information Obtained from Testing
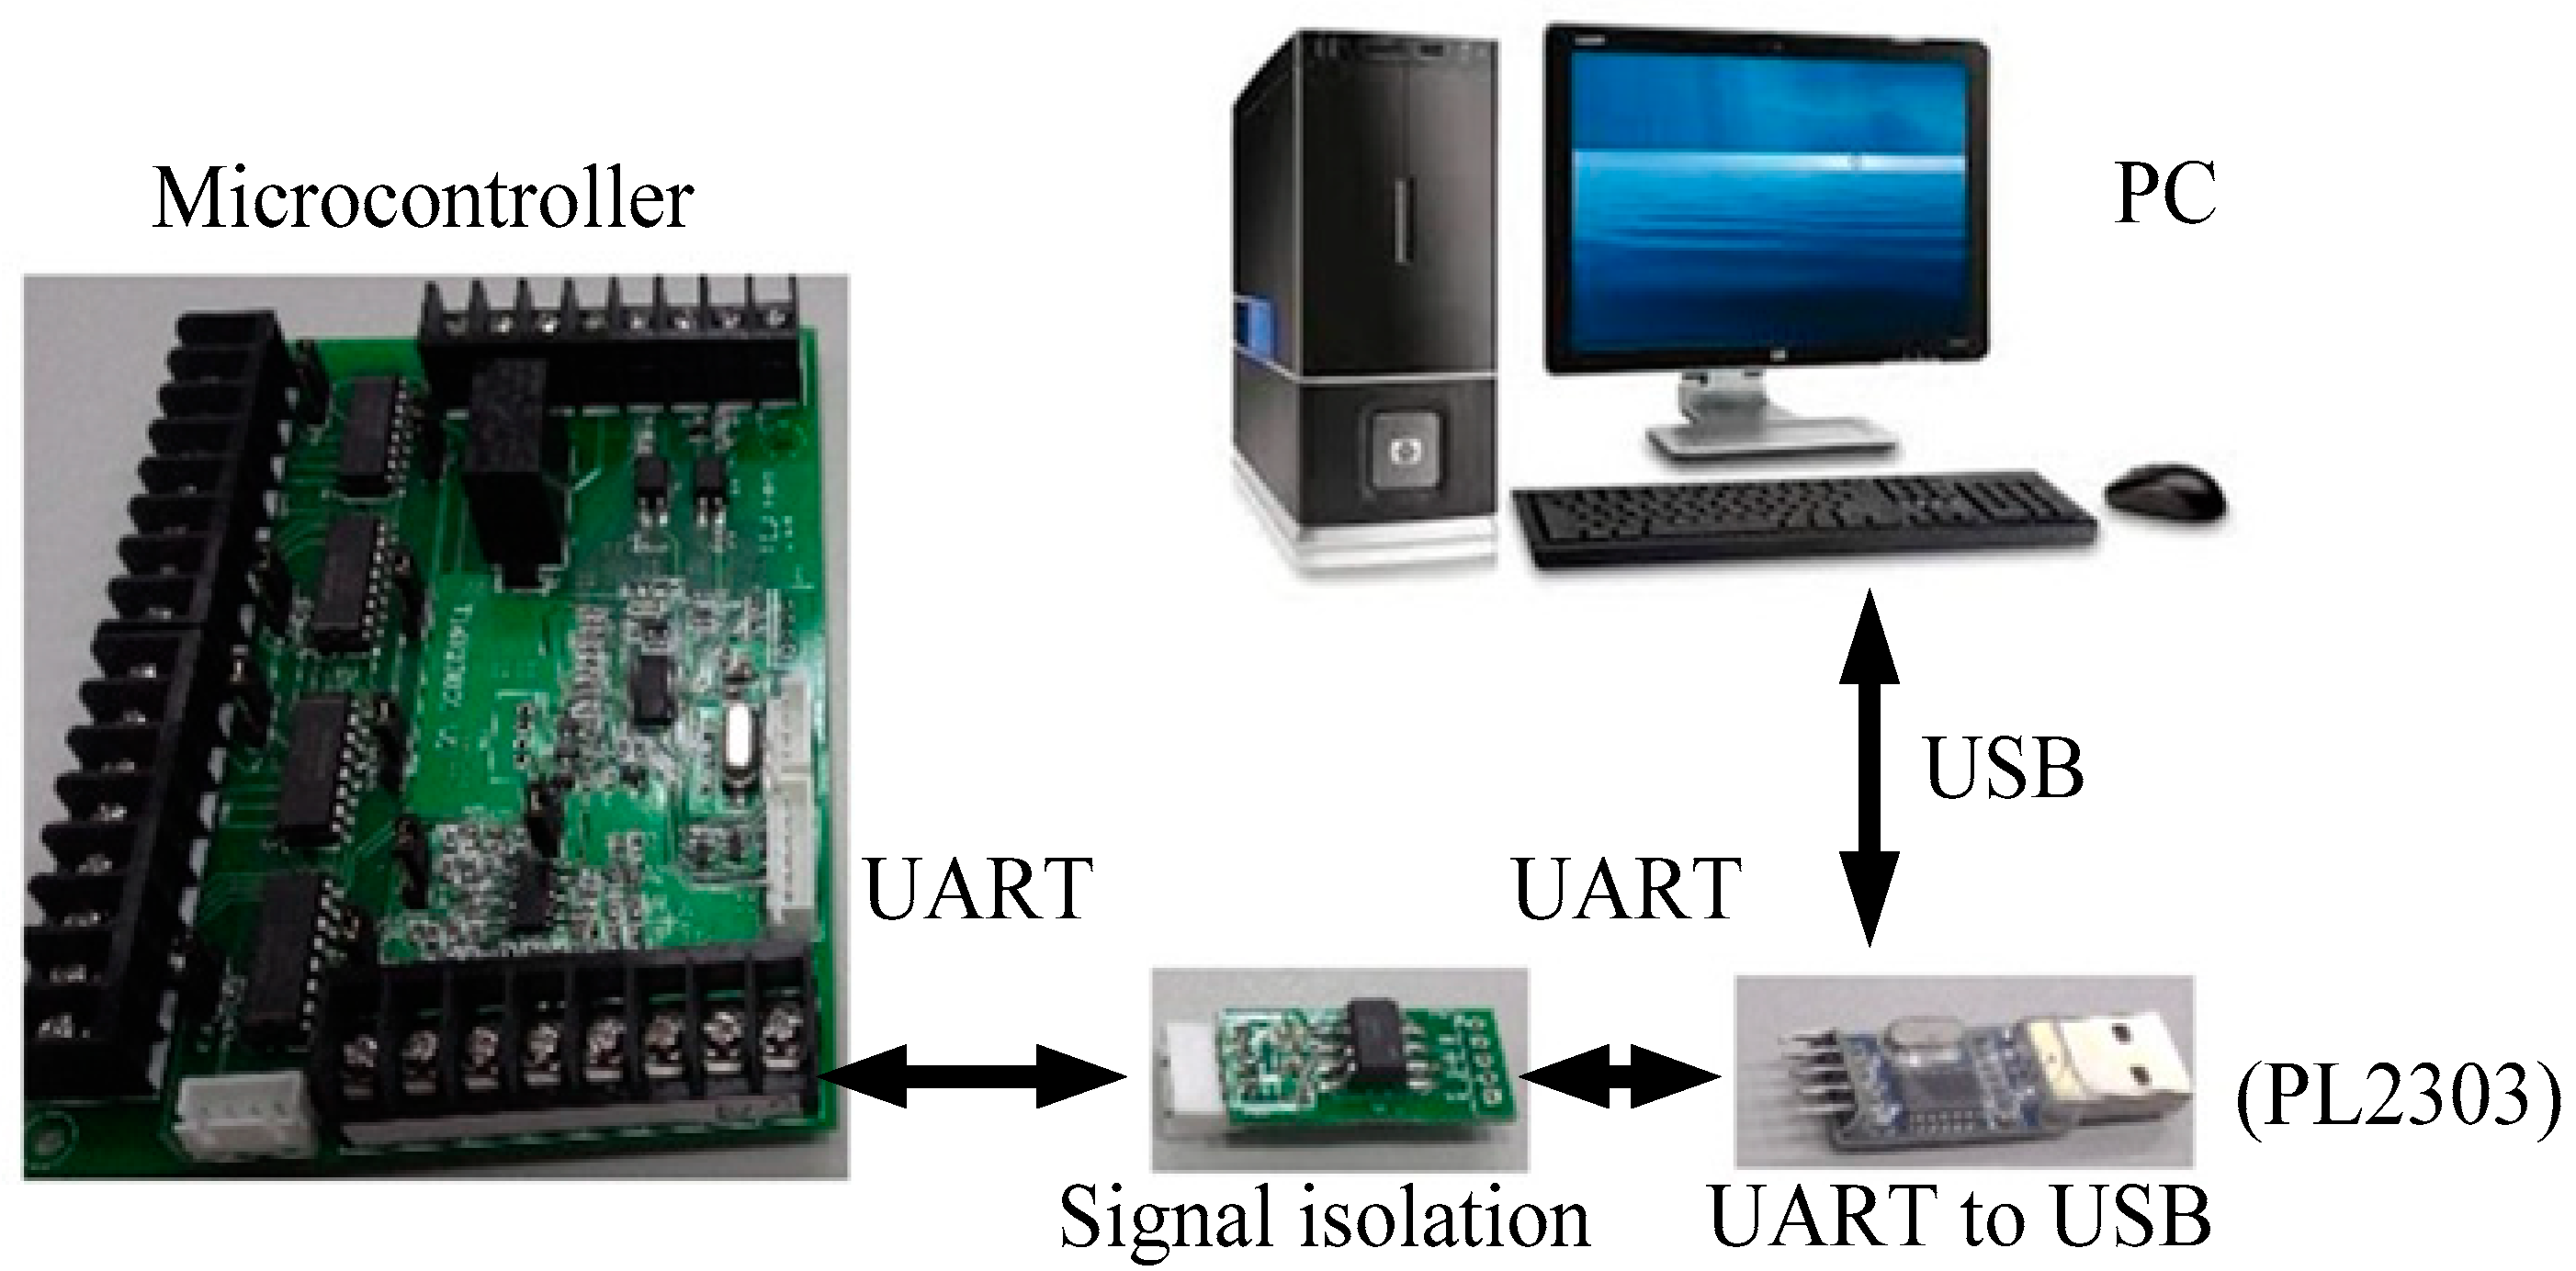
The adopted microcontroller uses a universal asynchronous receiver–transmitter (UART) as the channel for information output, transmitting the measured data to the personal computer (PC) terminal for subsequent processing. However, the PC only has a USB serial port and cannot directly link with the UART interface of the microcontroller. Therefore, a signal conversion tool, namely PL2303, is required to serve as the conversion interface between UART and USB.
Figure 13 shows the signal conversion relationship. The direct current voltage ranges of the PC and microcontroller terminals are dissimilar. Therefore, because of safety considerations, an isolation system is necessary during signal conversion between the two.
Figure 14 illustrates a self-designed isolation circuit that contains a high-speed optical coupler (6N137) for signal isolation during conversion.
5. Measurement Results
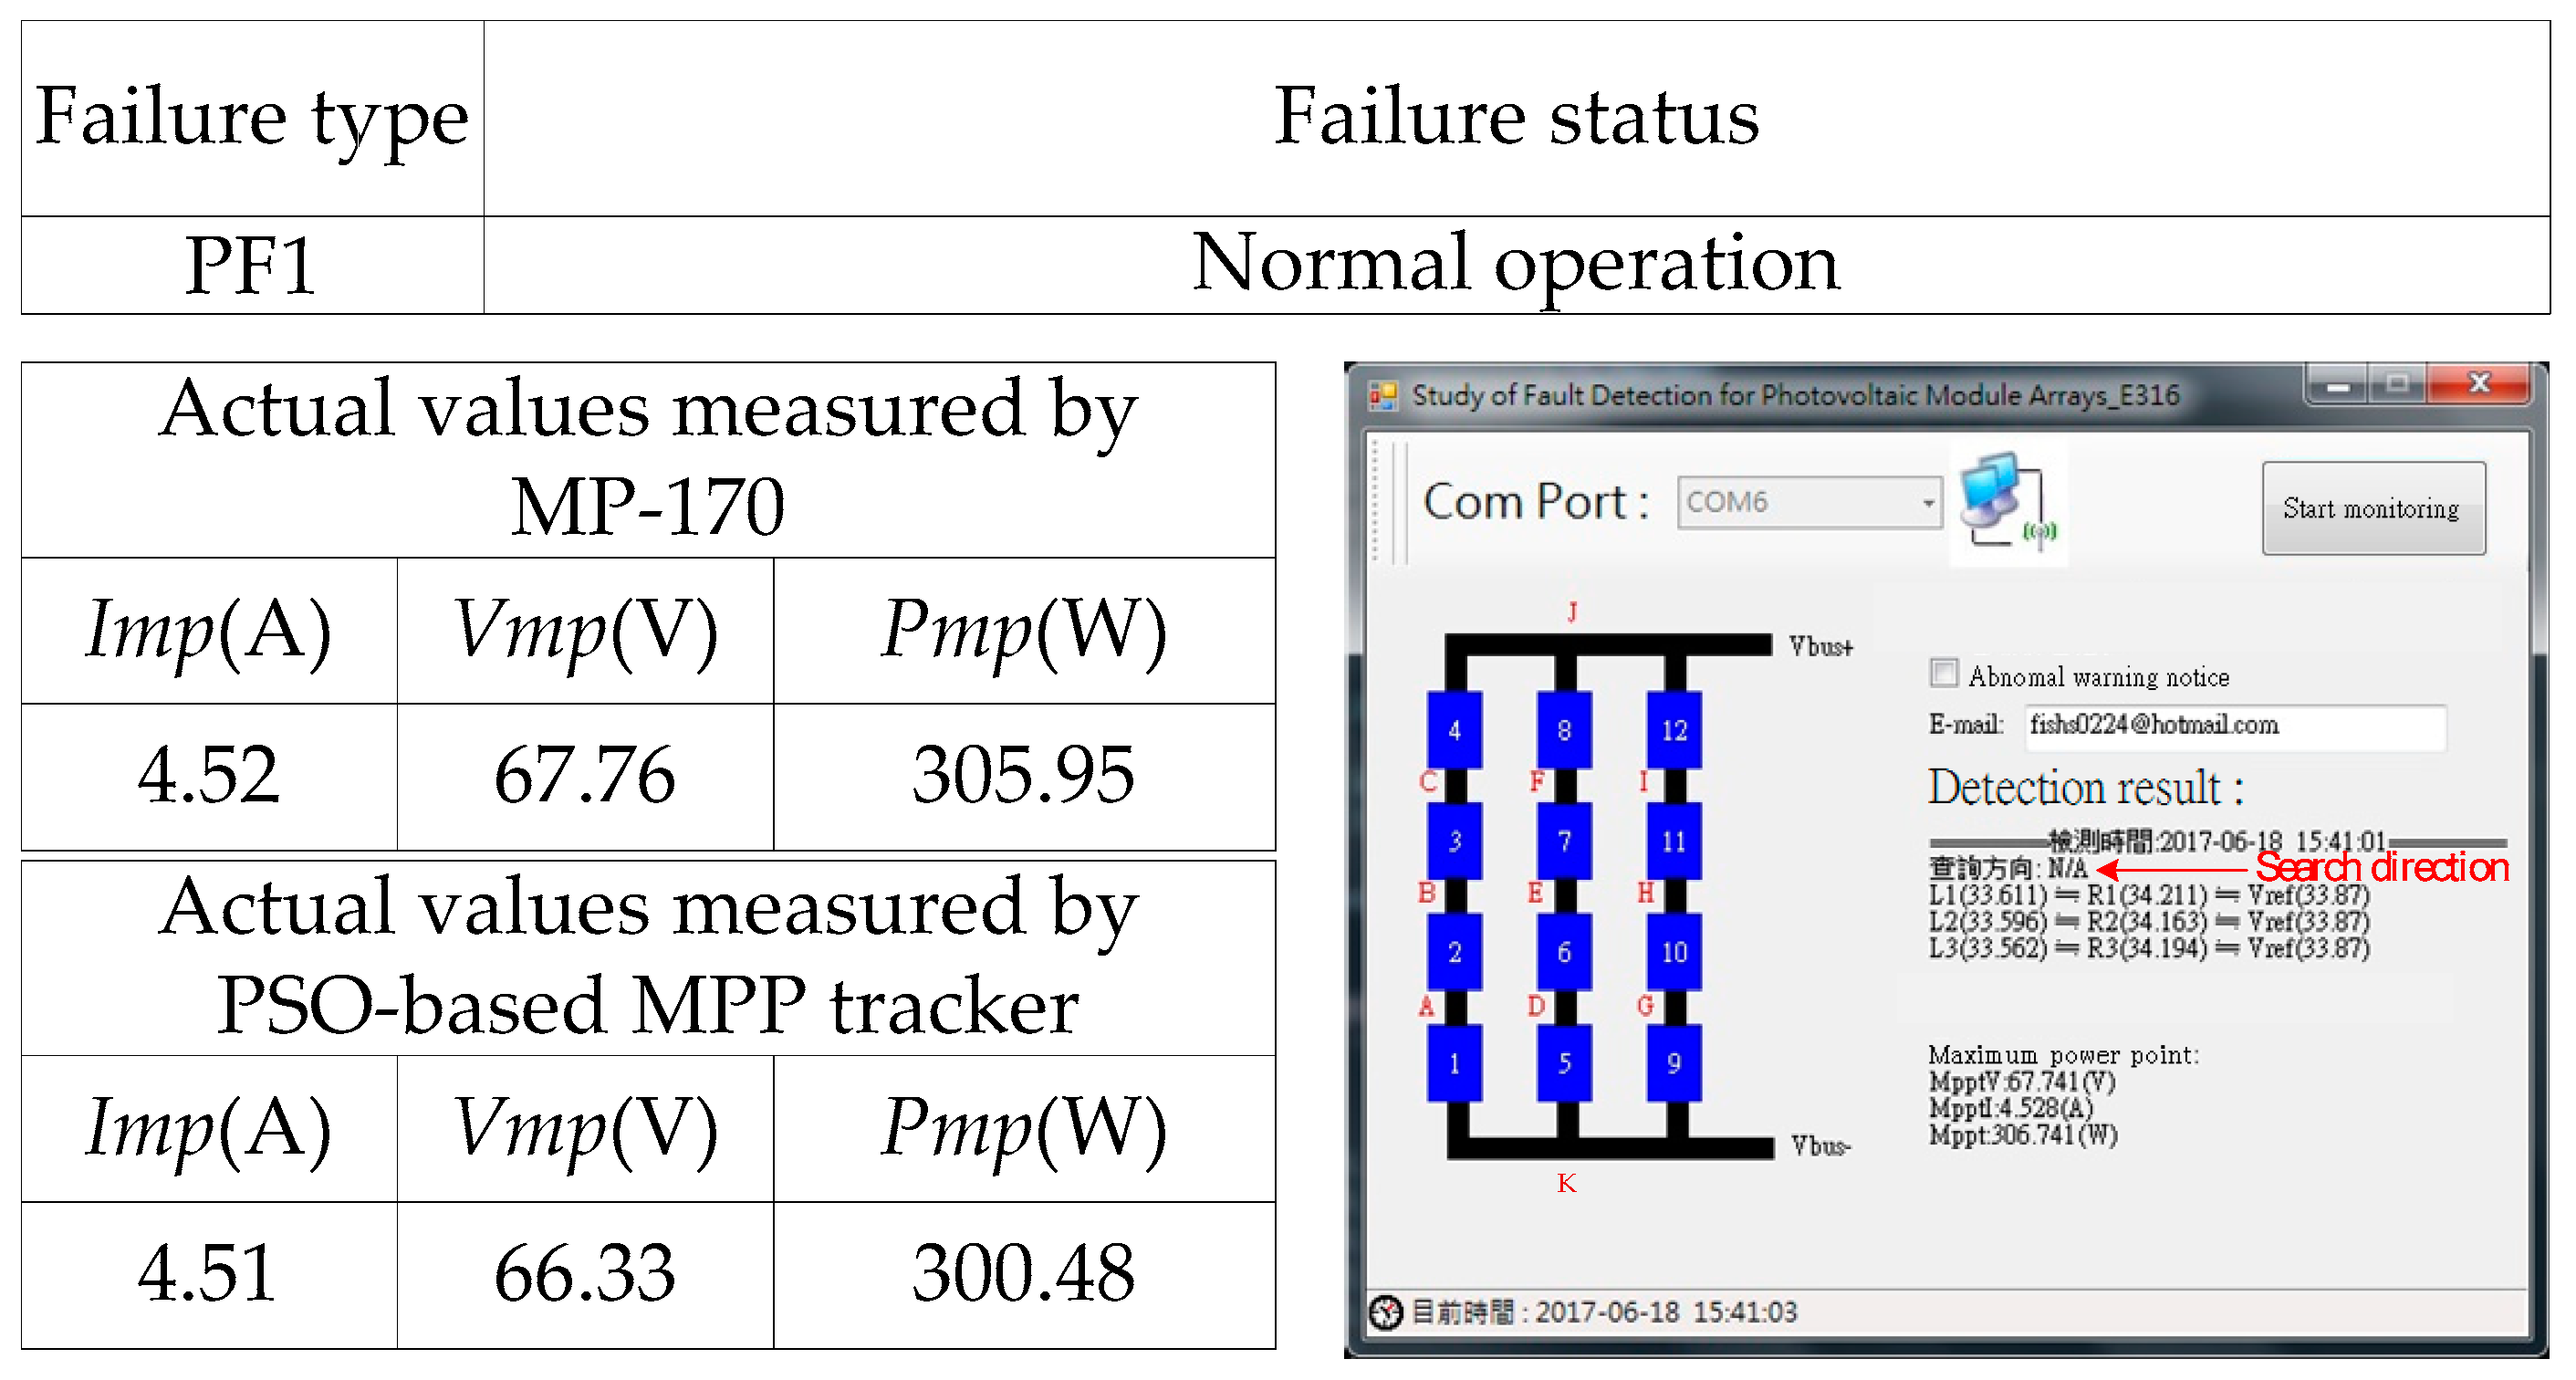
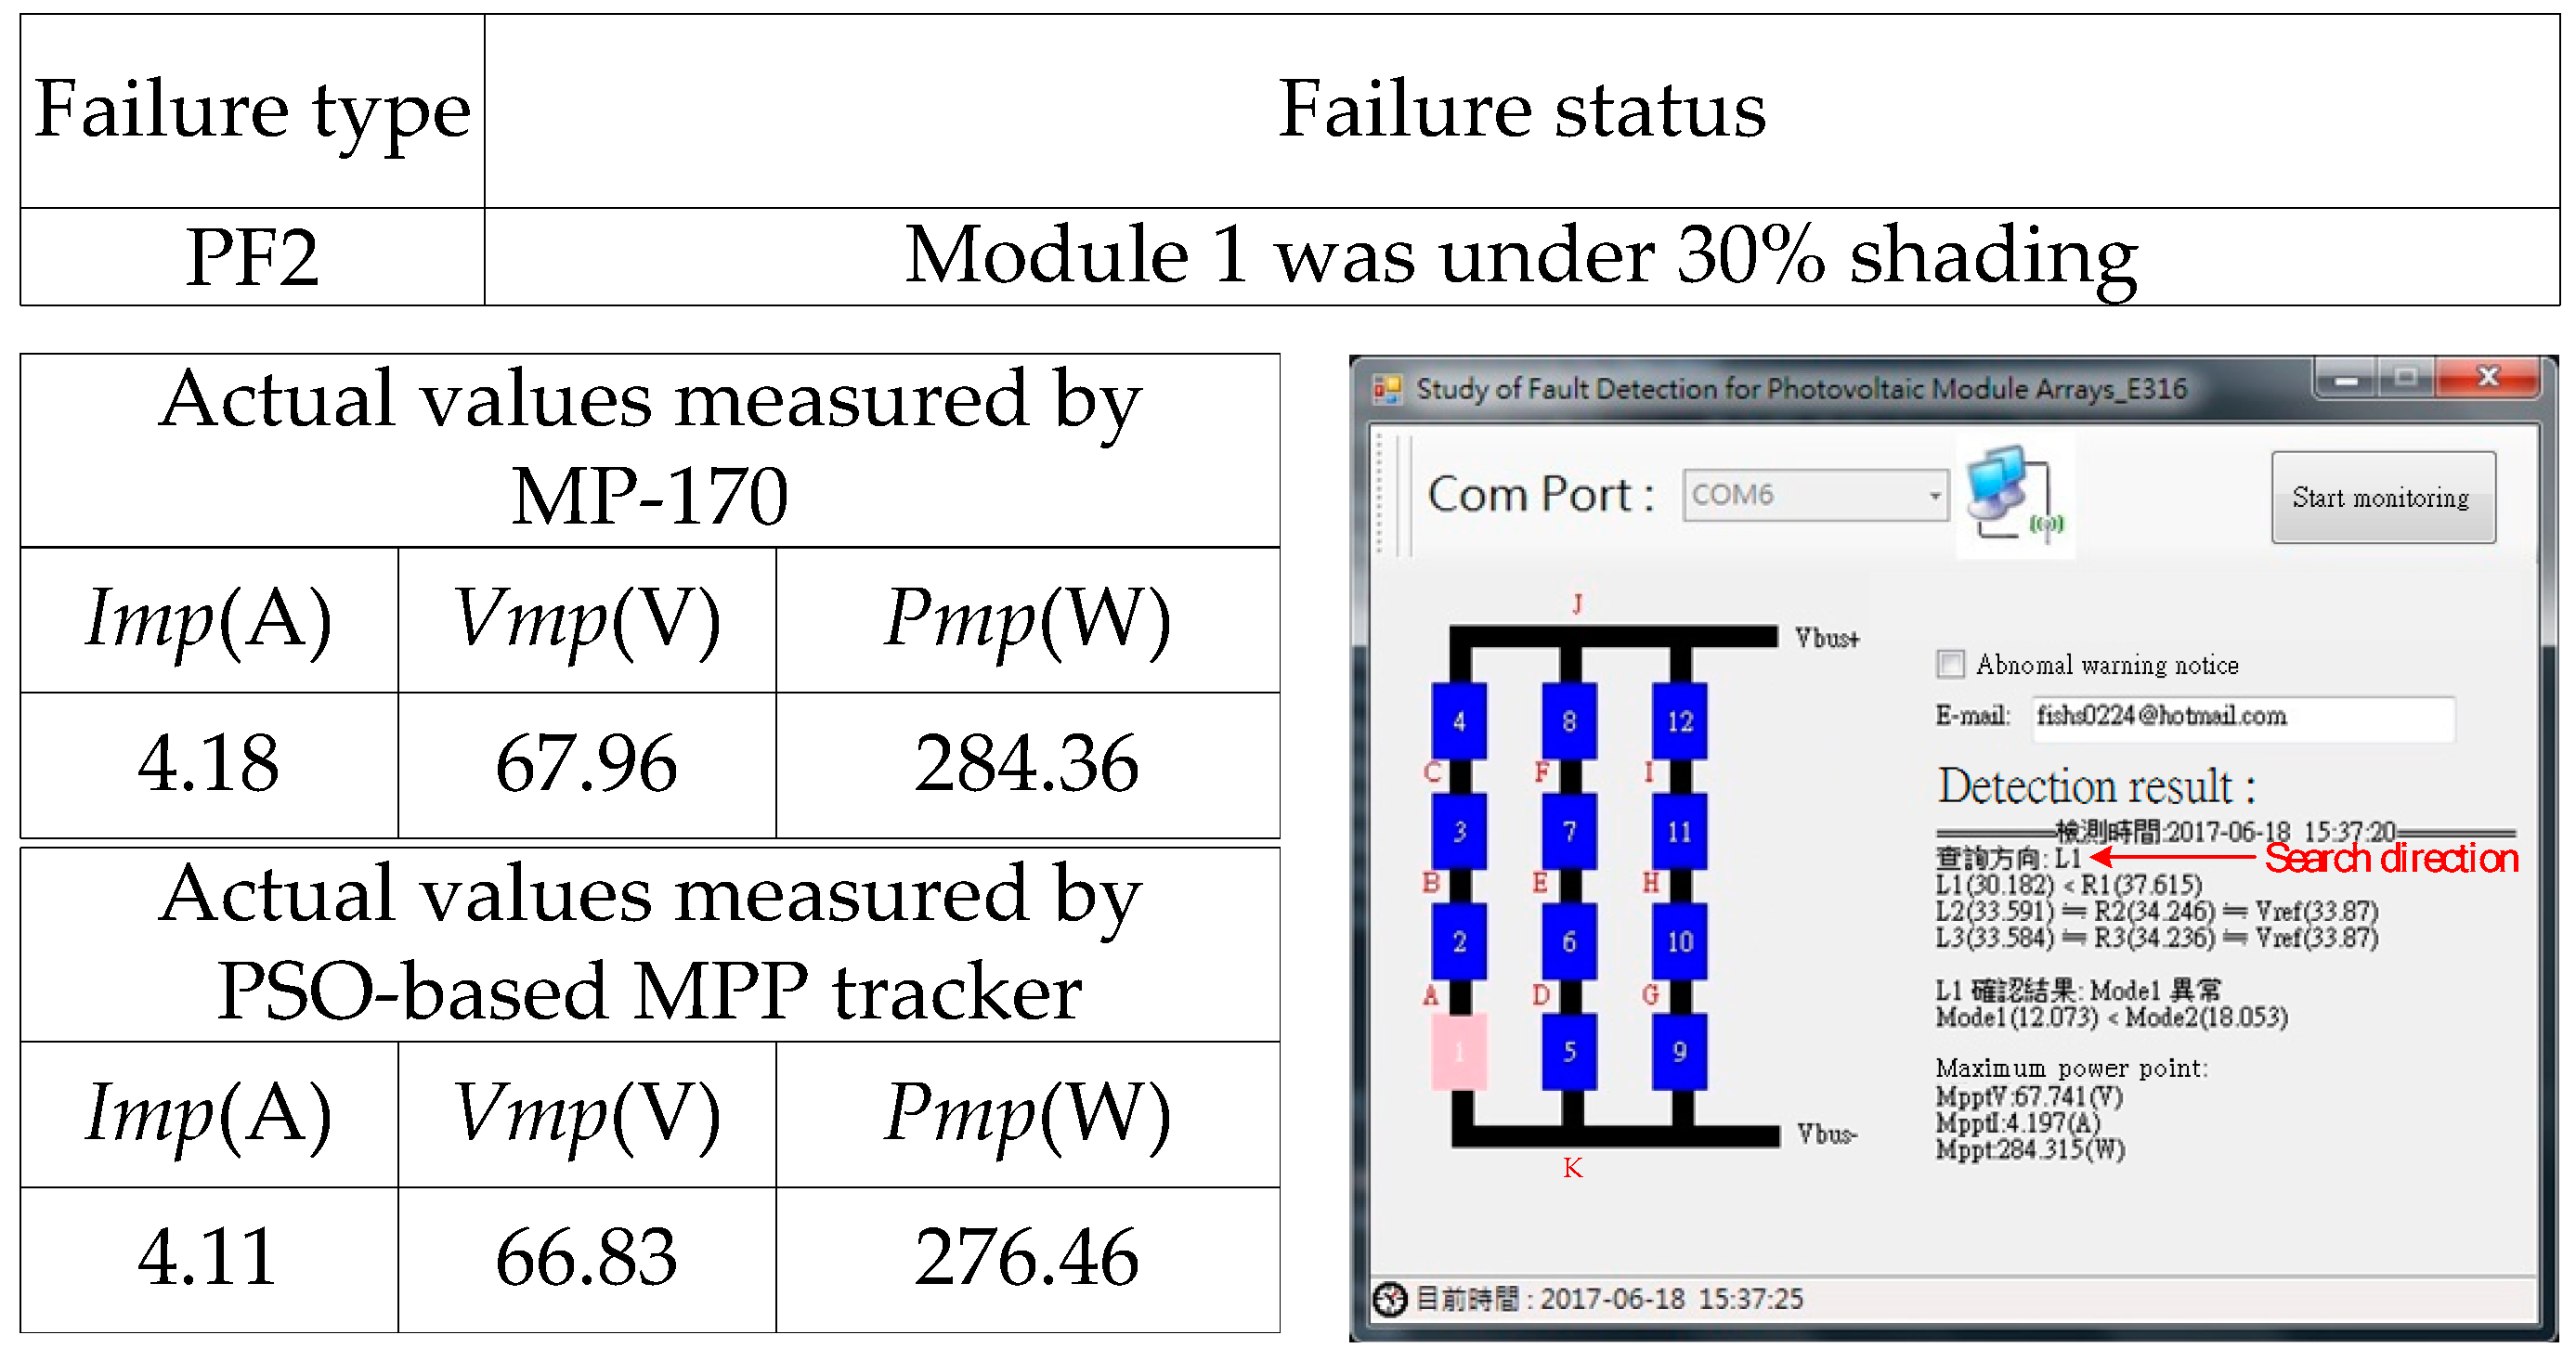
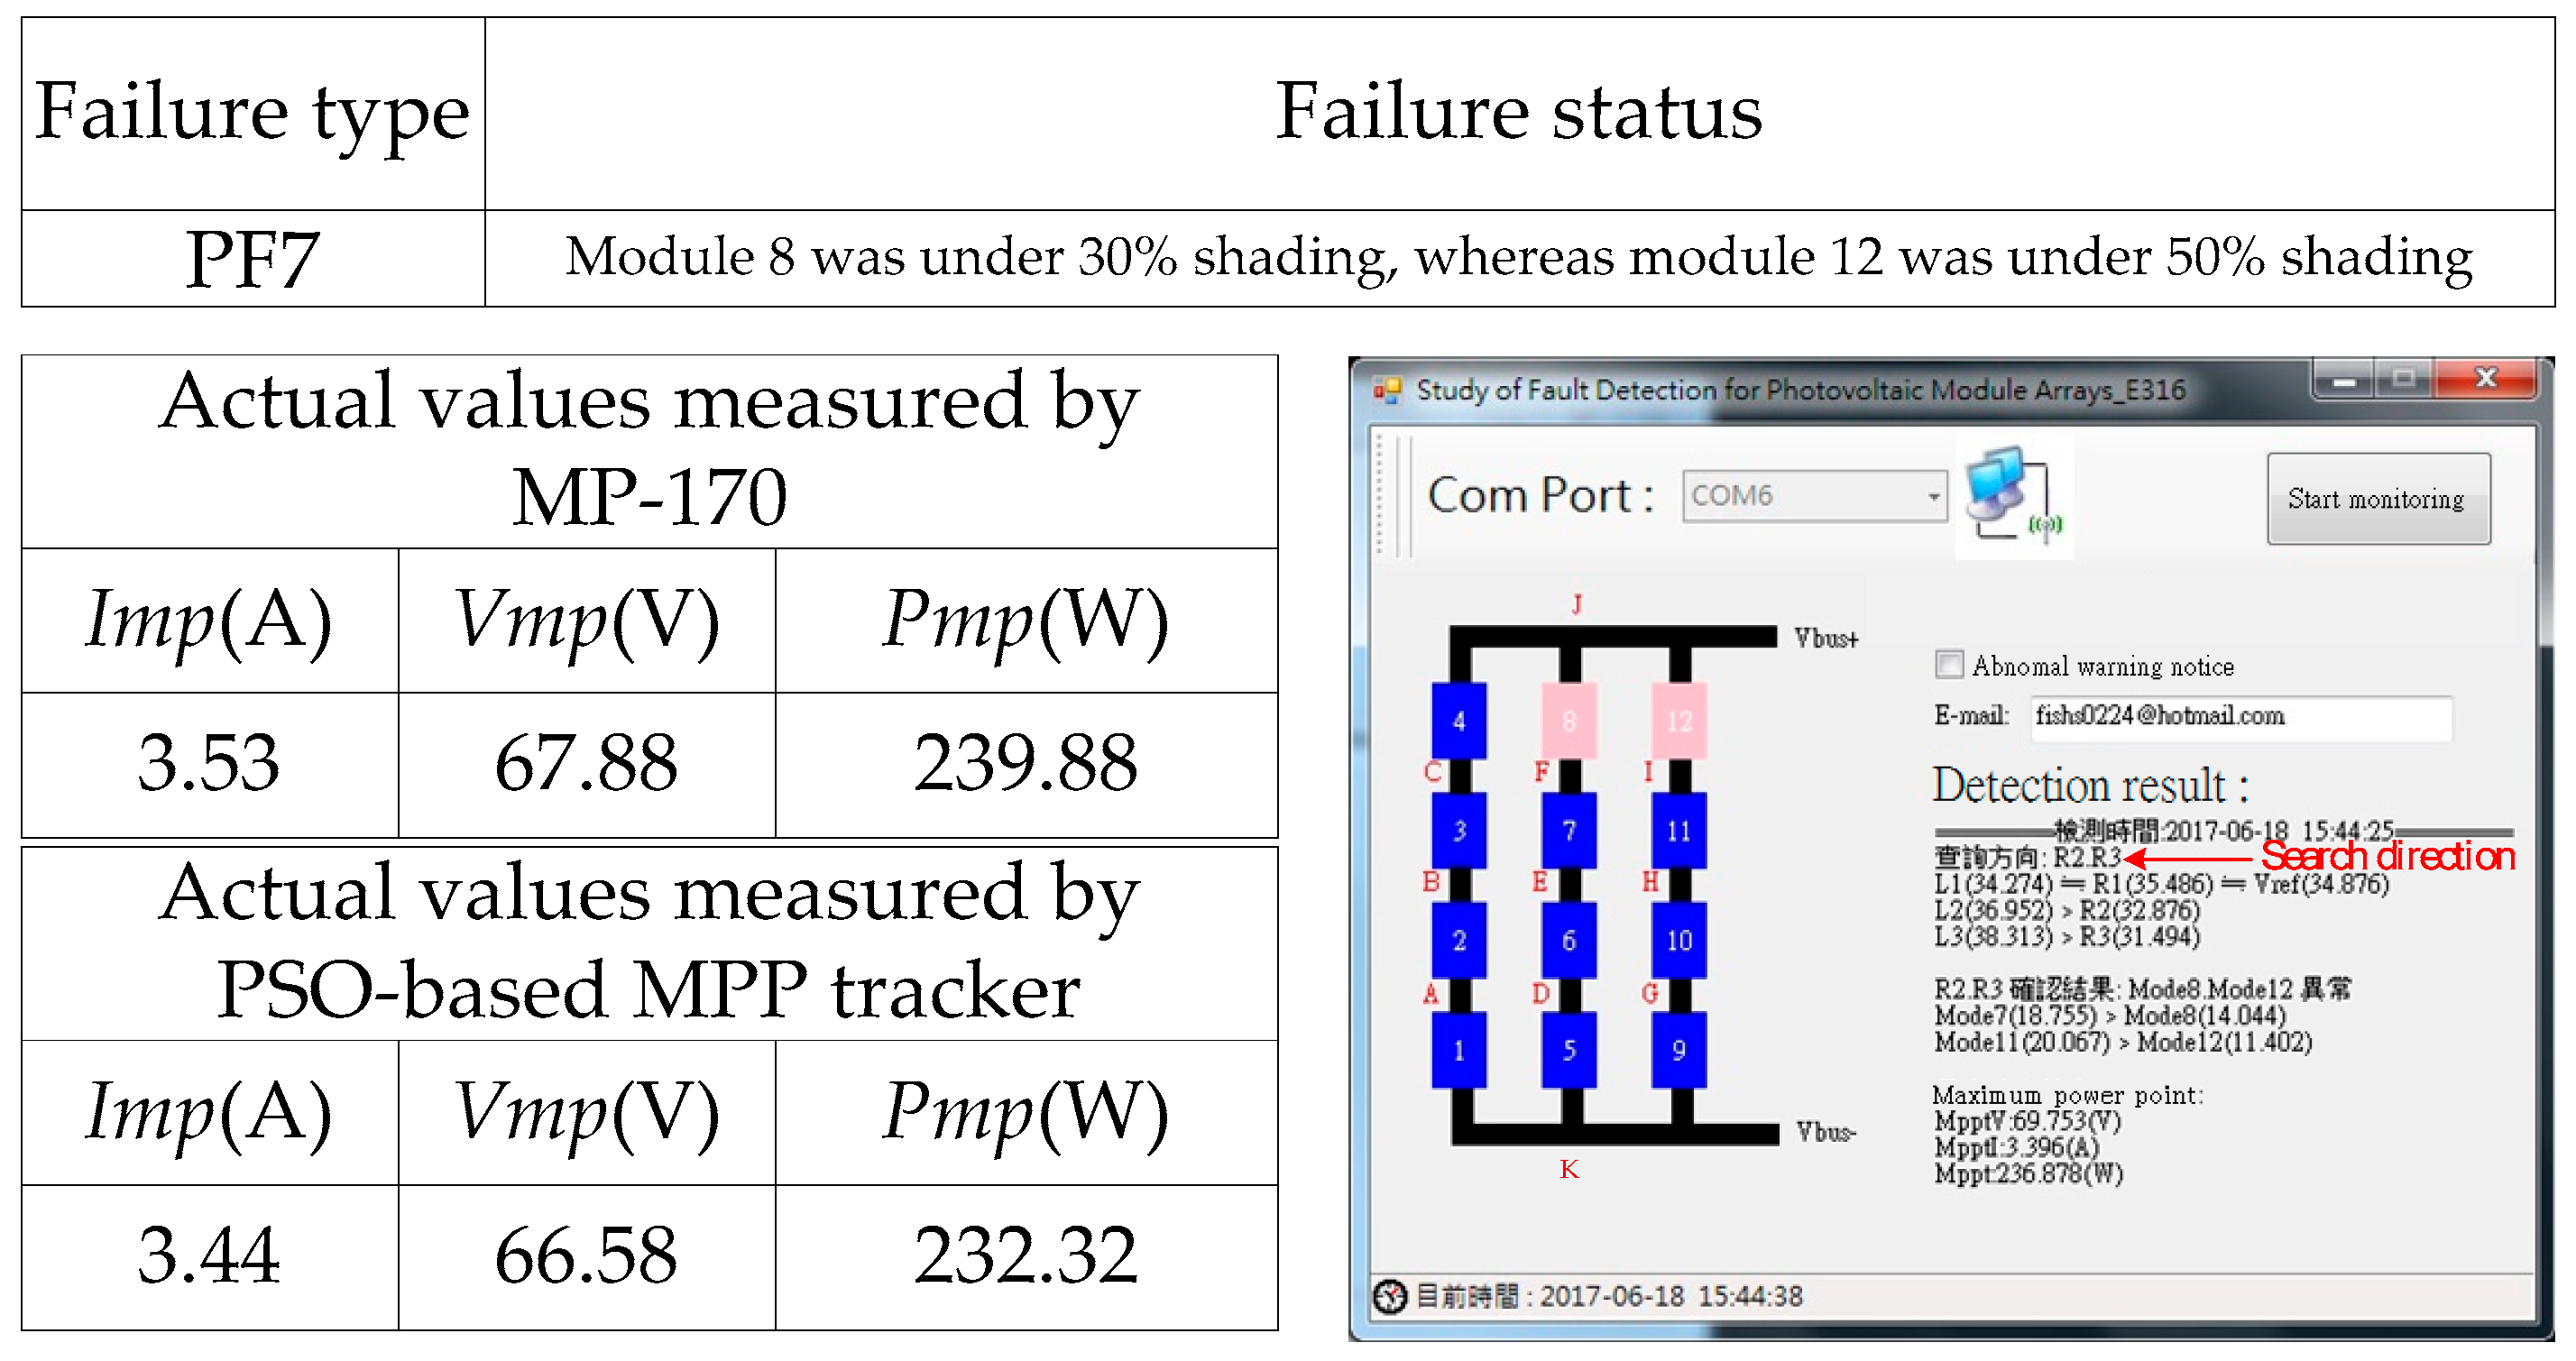
The modules of the self-made PV simulator were arranged in a 4 × 3 series-parallel configuration to form a PV module array that can adjust shading proportions and failure conditions (
Figure 15). The module array applied the PSO algorithm to conduct MPPT; thus, the PV module array operated at MPP. Subsequently, the voltage values of the related nodes in the array were extracted for fault diagnosis using the proposed fault detector. Through the communication interface, the test results were exported to the software platform developed, using Visual C# for display. The proposed software can not only accurately detect the faulty module but also provide a schematic of the module array, with the color of the faulty module being converted from blue (the original color) to pink. Such a display system enables a direct interpretation of the results. Moreover, the failure types were further divided into 14 possible states as shown in
Table 1. The experimental outcomes of these nine failure types are shown in
Figure 16,
Figure 17,
Figure 18,
Figure 19,
Figure 20,
Figure 21,
Figure 22,
Figure 23 and
Figure 24, respectively. The results indicate that the proposed fault detector can accurately locate faulty modules and let the PV module array operate at MPP.
To display the superiority of the proposed binary search-based fault detection method, the extension neural network (ENN) [
15], fuzzy neural network (FNN) [
21] and multilayer perceptrons and back propagations (MLP) [
22] with three network structures, namely 4-7-10, 4-8-10, and 4-9-10 (input layer-hidden layer-output layer) were constructed to diagnose photovoltaic module array faults. The comparison results shown in
Table 2 indicate that a binary search-based fault detection method conducting fault diagnosis is highly accurate and requires minimal iterations, and is therefore, more efficient than the existing neural network methods.
In addition, the proposed binary search-based method only needs basic computing rules such as addition and subtraction. Compared with the ENN presented in Reference [
15], MLP method presented in Reference [
21] and FNN proposed in Reference [
22], the learning and diagnosis response of the proposed binary search-based method is also faster under the same conditions. It is because more complex computing instructions such as exponential function are needed using the existing ENN, MLP and FNN methods. However, the proposed binary search-based fault detection method does not need a complex learning procedure, such that it can easily be implemented on a single-chip microcontroller. When the capacity of photovoltaic modules increases or reduces, no data should be modified to promote the diagnosis accuracy. Because the diagnosis scheme is simple, a PIC microcontroller can be utilized to implement the hardware for real-time fault diagnosis of a photovoltaic module array. There are a lot of analog and digital modules in the PIC microcontroller, so it makes the hardware circuit size very small and reduces cost.
6. Conclusions
This study examined various failure types and demonstrated that integrating PSO with the conventional perturb-and-observe method can accurately track the MPP of PV modules. The feature of the fault detector developed in this study is that the sampling channel can be switched by the analog switch for testing PV modules. Therefore, the microcontroller requires only a single set of A/D sampling pins, which can thus reduce hardware circuit construction costs. In addition, the proposed system applies a binary search algorithm to determine the search direction for locating abnormal modules in order to improve the search speed and efficiency. The diagnostic results can be displayed on a PC through a platform implemented using Visual C#. The test information can also be delivered to the designated e-mail address through the Internet. Various failure types developed by the simulator were assessed experimentally, and the results indicate that the proposed fault detector can accurately locate faulty modules.
Author Contributions
The conceptualization was proposed by K.-H.C., who also was responsible for writing—review & editing this paper. Y.-H.C. completed the formal analysis of the fault detection based on binary search algorithm. J.-H.T. carried out the data curation, software program and experimental validation. K.-H.C. was in charge of project administration.
Funding
This research was funded by the Ministry of Science and Technology, Taiwan, under the Grant Number MOST 106-2221-E-167-013-MY2.
Acknowledgments
The authors gratefully acknowledge the support of the Ministry of Science and Technology, Taiwan, under the Grant Number MOST 106-2221-E-167-013-MY2.
Conflicts of Interest
The authors of the manuscript declare that there is no conflict of interest with any of the commercial identities mentioned in the manuscript.
References
- Zhang, S. Operation and Practice of Operation and Fault Diagnosis of Solar Power System. In Proceedings of the 2015 International Conference on Operation and Maintenance of Power Generation Equipment, San Diego, CA, USA, 28 June–2 July 2015; pp. 24–35. [Google Scholar]
- Zhao, Y.; Lehman, B.; Palma, J.F.; Mosesian, J.; Lyons, R. Detecting Harmful Overcurrents in PV Arrays at Shadow Condition through Binary Coding Method. In Proceedings of the IEEE 3rd Power Electronics and Drive System Technology, Tehran, Iran, 15–16 February 2012; pp. 251–254. [Google Scholar]
- Hu, Y.; Cao, W.; Ma, J. Identifying PV Module Mismatch Faults by a Thermography-Based Temperature Distribution Analysis. IEEE Trans. Device Mater. Reliab. 2014, 14, 951–960. [Google Scholar] [CrossRef] [Green Version]
- Hachana, O.; Hemsas, K.E.; Tina, G.M. Fault Diagnosis of Building Integrated PV Generator: A Metaheuristic Technique. In Proceedings of the 6th International Renewable Energy Congress, Sousse, Tunisia, 24–26 March 2015; pp. 1–6. [Google Scholar]
- Pop-Călimanu, I.M.; Popescu, T.A.V.; Muntean, G. A Low Cost System for Testing and Monitoring the Performance of Photovoltaic Module. IEEE Adv. Electr. Comput. Eng. 2013, 13, 93–98. [Google Scholar] [CrossRef]
- Chao, K.H.; Chen, C.T. Remote Supervision Fault Diagnosis Meter for Photovoltaic Power Generation Systems. Measurement 2017, 104, 93–104. [Google Scholar] [CrossRef]
- Patel, H.; Agarwal, V. MATLAB-Based Modeling to Study the Effects of Partial Shading on PV Array Characteristics. IEEE Trans. Energy Convers. 2008, 23, 302–310. [Google Scholar] [CrossRef]
- Knuth, D. Searching an Ordered Table, Subsection Binary Search. In The Art of Computer Programming, 2nd ed.; Addison-Wesley Professional: Reading, MA, USA, 1998. [Google Scholar]
- Wang, Y.; Yang, Y.; Fang, G.; Zhang, B.; Wen, H.; Tang, H.; Fu, L.; Chen, X. An Advanced Maximum Power Point Tracking Method for Photovoltaic Systems by Using Variable Universe Fuzzy Logic Control Considering Temperature Variability. Electronics 2018, 7, 355. [Google Scholar] [CrossRef]
- Esram, T.; Chapman, P.L. Comparison of Photovoltaic Array Maximum Power Point Tracking Techniques. IEEE Trans. Energy Convers. 2007, 22, 439–449. [Google Scholar] [CrossRef] [Green Version]
- Koutroulis, E.; Kalaitzakis, K.; Voulgaris, N.C. Development of a Microcontroller-Based Photovoltaic Maximum Power Point Tracking Control System. IEEE Trans. Power Electron. 2001, 16, 46–54. [Google Scholar] [CrossRef]
- Femia, N.; Lisi, G.; Petrone, G.; Spagnuolo, G.; Vitelli, M. Distributed Maximum Power Point Tracking of Photovoltaic Arrays: Novel Approach and System Analysis. IEEE Trans. Ind. Electron. 2008, 55, 2610–2621. [Google Scholar] [CrossRef]
- Wu, L.; Zhao, Z.; Liu, J. A Single-Stage Three-Phase Grid-Connected Photovoltaic System with Modified MPPT Method and Reactive Power Compensation. IEEE Trans. Energy Convers. 2007, 22, 881–886. [Google Scholar]
- Patel, H.; Agarwal, V. Maximum Power Point Tracking Scheme for PV Systems Operating under Partially Shaded Conditions. IEEE Trans. Ind. Electron. 2008, 55, 1689–1698. [Google Scholar] [CrossRef]
- Chao, K.H.; Chen, P.Y.; Wang, M.H.; Chen, C.T. An Intelligent Fault Detection Method of a Photovoltaic Module Array Using Wireless Sensor Networks. Int. J. Distrib. Sens. Netw. 2014, 2014, e540147. [Google Scholar] [CrossRef]
- Chao, K.H.; Lai, P.L.; Liao, B.J. The Optimal Configuration of Photovoltaic Module Arrays Based on Adaptive Switching Controls. Energy Convers. Manag. 2015, 100, 157–167. [Google Scholar] [CrossRef]
- Eberhart, R.C.; Kennedy, J. A New Optimizer using Particle Swarm Theory. In Proceedings of the Sixth International Symposium on Micro Machine and Human Science, Nagoya, Japan, 4–6 October 1995; pp. 39–43. [Google Scholar]
- Chao, K.H.; Lin, Y.S.; Lai, U.D. Improved Particle Swarm Optimization for Maximum Power Point Tracking in Photovoltaic Module Arrays. Appl. Energy 2015, 158, 609–618. [Google Scholar] [CrossRef]
- PIC18Fxx20 Datasheet. Available online: http://pdf.datasheetcatalog.com/datasheet/microchip/39609b.pdf (accessed on 15 July 2018).
- Chao, K.H.; Chao, Y.W.; Chen, J.P. A Circuit-Based Photovoltaic Module Simulator with Shadow and Fault Setting. Int. J. Electron. 2016, 103, 424–438. [Google Scholar] [CrossRef]
- Oh, S.K.; Pedrycz, W.; Park, H.S. A New Approach to the Development of Genetically Optimized Multilayer Fuzzy Polynomial Neural Networks. IEEE Trans. Ind. Electron. 2006, 53, 1309–1321. [Google Scholar] [CrossRef]
- Wu, Y.; Lan, Q.; Sun, Y. Application of BP Neural Network Fault Diagnosis in Solar Photovoltaic System. In Proceedings of the 2009 International Conference on Mechatronics and Automation, Changchun, China, 9–12 August 2009; pp. 2581–2585. [Google Scholar]
Figure 1.
Schematic of PSO search approach.
Figure 1.
Schematic of PSO search approach.
Figure 2.
Illustration of 4 × 3 series-parallel PV module array.
Figure 2.
Illustration of 4 × 3 series-parallel PV module array.
Figure 3.
Regional division of 4 × 3 series-parallel PV module array.
Figure 3.
Regional division of 4 × 3 series-parallel PV module array.
Figure 4.
Flow chart of binary search algorithm.
Figure 4.
Flow chart of binary search algorithm.
Figure 5.
Framework of PSO-based MPPT system.
Figure 5.
Framework of PSO-based MPPT system.
Figure 6.
Framework of binary search-based fault diagnosis system for PV modules.
Figure 6.
Framework of binary search-based fault diagnosis system for PV modules.
Figure 7.
Interface of fault diagnosis software.
Figure 7.
Interface of fault diagnosis software.
Figure 8.
Actual detection status of the fault diagnosis software interface.
Figure 8.
Actual detection status of the fault diagnosis software interface.
Figure 9.
Automatic warning message.
Figure 9.
Automatic warning message.
Figure 10.
Circuit of the PV module simulator with adjustable settings for shading and failure.
Figure 10.
Circuit of the PV module simulator with adjustable settings for shading and failure.
Figure 11.
I-V and P-V characteristic curves of Solar Pro simulation and self-made simulator under 0% shading.
Figure 11.
I-V and P-V characteristic curves of Solar Pro simulation and self-made simulator under 0% shading.
Figure 12.
I-V and P-V characteristic curves of Solar Pro simulation and self-made simulator under 30% shading.
Figure 12.
I-V and P-V characteristic curves of Solar Pro simulation and self-made simulator under 30% shading.
Figure 13.
Signal conversion diagram.
Figure 13.
Signal conversion diagram.
Figure 14.
Circuit of signal isolation.
Figure 14.
Circuit of signal isolation.
Figure 15.
Hardware exterior of the proposed fault diagnosis system for PV module.
Figure 15.
Hardware exterior of the proposed fault diagnosis system for PV module.
Figure 16.
Experimental outcome for failure type PF1.
Figure 16.
Experimental outcome for failure type PF1.
Figure 17.
Experimental outcome for failure type PF2.
Figure 17.
Experimental outcome for failure type PF2.
Figure 18.
Experimental outcome for failure type PF3.
Figure 18.
Experimental outcome for failure type PF3.
Figure 19.
Experimental outcome for failure type PF4.
Figure 19.
Experimental outcome for failure type PF4.
Figure 20.
Experimental outcome for failure type PF5.
Figure 20.
Experimental outcome for failure type PF5.
Figure 21.
Experimental outcome for failure type PF6.
Figure 21.
Experimental outcome for failure type PF6.
Figure 22.
Experimental outcome of failure type PF7.
Figure 22.
Experimental outcome of failure type PF7.
Figure 23.
Experimental outcome for failure type PF8.
Figure 23.
Experimental outcome for failure type PF8.
Figure 24.
Experimental outcome for failure type PF9.
Figure 24.
Experimental outcome for failure type PF9.
Table 1.
Search direction conditions.
Table 1.
Search direction conditions.
| Failure Type | Voltage of Each Region | Search Direction | Failure Type | Voltage of Each Region | Search Direction |
|---|
| 1 | L1 < R1;
L2≒R2≒Vref;
L3≒R3≒Vref | Search in the direction of L1 | 8 | L1 > R1;
L2≒R2≒Vref;
L3 > R3 | Search in the direction of R1 and R3 |
| 2 | L1 > R1;
L2≒R2≒Vref;
L3≒R3≒Vref | Search in the direction of R1 | 9 | L1≒R1≒Vref;
L2≒R2≒Vref;
L3 < R3 | Search in the direction of L3 |
| 3 | L1≒R1≒Vref;
L2 < R2;
L3 < R3 | Search in the direction of L2 and L3 | 10 | L1≒R1≒Vref;
L2≒R2≒Vref;
L3 > R3 | Search in the direction of R3 |
| 4 | L1≒R1≒Vref;
L2 > R2;
L3 > R3 | Search in the direction of R2 and R3 | 11 | L1 < R1;
L2 < R2;
L3≒R3≒Vref | Search in the direction of L1 and L2 |
| 5 | L1≒R1≒Vref;
L2 > R2;
L3≒R3≒Vref | Search in the direction of R2 | 12 | L1 > R1;
L2 > R2;
L3≒R3≒Vref | Search in the direction of R1 and R2 |
| 6 | L1≒R1≒Vref;
L2 < R2;
L3≒R3≒Vref | Search in the direction of L2 | 13 | L1 < R1;
L2 < R2;
L3 < R3 | Search in the direction of L1, L2, and L3 |
| 7 | L1 < R1;
L2≒R2≒Vref;
L3 < R3 | Search in the direction of L1 and L3 | 14 | L1 > R1;
L2 > R2;
L3 > R3 | Search in the direction of R1, R2, and R3 |
Table 2.
Comparison of fault diagnosis accuracy rates when applied in a binary search-based method and the existing neural network methods.
Table 2.
Comparison of fault diagnosis accuracy rates when applied in a binary search-based method and the existing neural network methods.
| Comparison Item | Iteration Number | Learning Accuracy Rate | Diagnosis Accuracy Rate |
|---|
| Method | |
|---|
| Proposed method | 0 | 100% | 100% |
| ENN [15] | 22 | 100% | 99.43% |
| MLP(4-7-10) [21] | 8507 | 90.85% | 93.33% |
| MLP(4-8-10) [21] | 11,089 | 85.65% | 90% |
| MLP(4-9-10) [21] | 8597 | 96.64% | 93.33% |
| FNN [22] | 5584 | 98.84% | 97.70% |
© 2019 by the authors. Licensee MDPI, Basel, Switzerland. This article is an open access article distributed under the terms and conditions of the Creative Commons Attribution (CC BY) license (http://creativecommons.org/licenses/by/4.0/).


