Article

Analyzing Electrical Performance and Thermal Coupling of Supercapacitor Assembled Using Phosphorus-Doped Porous Carbon/Graphene Composite

1
State Key Laboratory of Reliability and Intelligence of Electrical Equipment, and Key Laboratory of Electromagnetic Field and Electrical Apparatus Reliability of Hebei Province, Hebei University of Technology, Tianjin 300132, China
2
College of Chemical Engineering and Technology, Tianjin University, Tianjin 300072, China
*
Authors to whom correspondence should be addressed.
Electronics 2019, 8(2), 254; https://doi.org/10.3390/electronics8020254
Submission received: 11 February 2019 / Accepted: 21 February 2019 / Published: 25 February 2019
(This article belongs to the Special Issue Innovative Technologies in Green Power Systems)

Abstract

:
A novel phosphorus-doped porous carbon/graphene composite was adopted as electrode material of super-capacitor, which showed excellent electrochemical performance compared with carbon material without phosphorus heteroatom by means of cyclic voltammetry, the charge/discharge property, impedance characteristics, cycle life, and stability. The P-enriched carbons sample offered an outstanding capacitive behavior, which had specific capacitance 277 F/g and was able to withstand at a wide voltage window of 1.6 V with 90.8% performance retention after 10,000 cycles at a current density of 10 Ag−1, providing a higher energy density 26.42 Wh/kg. In addition, because the thermal effect in charge and discharge process can make the supercapacitor temperature rise rapidly in a short time and affect the electrical performance, temperature characteristic is one of the important characteristics to be considered in practical application. In this paper, a two-dimensional thermal model for commonly used coiling supercapacitor with p-doped porous carbon/graphene composite as electrode material was established, and the temperature distribution of supercapacitor and the variation of internal temperature under different conditions were analyzed by finite element method. The results show that the maximum temperature appears near the center, and the maximum temperature is related to the applied current and the number of cycles. With the increase of the current, the maximum internal temperature is increased sharply, and it is kept constant after the number of cycles reaches a certain value. Cooling measures should be taken when the maximum temperature exceeds the allowable temperature range.

1. Introduction

With the increasing tension of petroleum resources and the increasingly serious environmental pollution, countries are forced to strive to find new energy sources and advanced energy storage technologies for sustainable development. Among them, new energy, new materials, and new energy vehicles are listed as seven strategic emerging industries in China. As the increasing demand for electrification of urban motor vehicles, especially for green electric vehicles, the urgent and specific requirements have been put forward, thus leading the research and manufacture of supercapacitors to a new climax. For example, the development and manufacturing of supercapacitors are both listed in Japan’s New Sunshine Program and the Joule-III Project sponsored by the European Community, and implemented by the European Union member states. Supercapacitor is a high-energy energy storage element between electrostatic capacitor and battery, distinguished from traditional electrostatic capacitors in the mechanism of charge storage. Electrostatic capacitors store charges through dielectric polarization which allows electrostatic capacitors rapidly accumulate or release charges, while supercapacitors store charges by means of ion migration, and their specific capacitance and power density are extremely high, which is the reason why supercapacitors are often used in short-term, high-efficiency and, high-output pulse power supply [1]. Compared with rechargeable batteries, supercapacitors have higher power density, longer cycle life and, rapid charge–discharge ability with high current which has awaken industrialist to realize their various applications including national defense, military industry, aerospace, transportation, electronic information, and instrumentation etc. Consequently, they are now one of the research hotspots in the field of new energy. However, the energy density of supercapacitor is relatively lower than that of chemical batteries. In order to enhance energy density, the effective ways are to increase the specific capacitance and window voltage range of electrode, respectively.
Carbon material is the most widely used material for supercapacitor electrodes [2,3,4]. Since carbon is the sixth most abundant element in the earth’s crust, its extensive use is cost-effective and attractive for electrochemical applications. Carbonaceous materials including activated carbons (ACs), activated carbon fibers (ACFs), carbon nanotubes (CNTs), graphene, carbon aerogels (CAGs), and so on are commonly used as electrode materials of supercapacitors. At present, the carbon materials commonly used in supercapacitors are mainly ACs (Japanese Cola Li). ACs (Japanese Cola Li) has the characteristics of high specific surface area and relatively low price, and the gram capacity of YP-50F double layer capacitor which is adopted as electrode materials is 28 F/g. Activated carbon (AC) is obtained by heat treatment of carbon-rich organic precursors in an inert atmosphere (carbonization process) and then increases its surface area by physical or chemical activation. But like batteries, the cost of materials is a limiting factor in the application of supercapacitors, thus limiting expensive synthesis processes and precursors. Compared with AC, activated carbon fibers (ACFs) or carbon nano-fiber paper does not need any binder and can be directly used as a membrane of active material. Once activated, the specific surface area of ACFs is similar to that of AC. However, the price of ACFs is higher, which limits its application in specific fields of electrochemical capacitors. Carbon nanotubes (CNTs) are considered to have potential applications in supercapacitors. CNTs are obtained by catalytic decomposition of hydrocarbons. However, the capacitance of pure CNTs is not high, only 20–80 F/g. This is mainly due to the small pore size of CNTs. Nowadays; the capacitance of commercial CNTs is only 78 F/g. Therefore, many studies focus on how to develop dense, nano-ordered carbon nanotubes arrays which are vertically oriented to the collector. Such CNTs can fine-tune the tube spacing and thus increase the capacitance. The carbon aerogels (CAGs) were obtained by sol-gel method which is condensation reaction of resorcinol with formaldehyde. The power density of capacitors based on CAGs is relatively high. However, it is reported that the specific capacitance of CAGs in organic electrolyte and aqueous electrolyte is about 50–100 F/g, which limits available energy density. On the other hand, the low density of CAGs leads to smaller volume specific capacitance, so organizations have less interest in its application and development. Graphene is a promising energy storage material, especially for high electrochemical performance of supercapacitors. It is critical for real-time and high-power applications to be capable of fast charging at high current density. The relatively mature and universal method to synthesize graphene is Hummer’s method, which produces graphite oxide followed by reduction, dispersion, microwave and, electrochemical methods. However, there exist defects i.e., stacked layer in graphene so that it used as electrode shows unsatisfactory electrical performance in its practical application. For electrodes based on carbon materials, they are capable of performing less 400 F/g capacitance to the most extent. However, metal oxide/hydroxide or conducting polymer used as supercapacitors’ electrode materials can exhibit a higher capacitance, such as Ni (OH)2, PbO2, RuO2 and MnO2 and so on. Xia adopted vegetal Co3O4 on nickel foam as electrode material and it showed 754 F/g [5]. Pu et al. found out NiCo2S4 in KOH electrolyte possesses 437 F/g capacitance [6]. Polyaniline is provided with some superior characteristics, such as electrically active, excellent stability, and it has capacitance as high as 400–500 F/g in acid electrolyte. Although they possess relatively higher capacitance, their conductivity is lower than composites. In addition, researchers use different materials at positive and negative electrodes for packaging asymmetric supercapacitors or hybrid supercapacitors in order to enhance the energy density, but in most cases, they have poor cycle stability due to faradic reaction. Therefore, our present works mainly focus on symmetric supercapacitors with carbon-based electrode. Recent years, researchers start proposing a way to making electrical characteristics better by using graphene-based materials doping heteroatom such as N, P, S and B as ultracapacitor electrode materials [7,8,9]. Guang et al. used nitrogen and phosphorus co-doped porous graphene-like carbon (N-P-PGC) for electrode material of supercapacitor at a low-cost, showing it had a large specific capacitance of 219 F/g and outstanding cycle stabilization with capacitance retention 95.6% after 10,000 cycles [10]. Dong et al. prepared N,P co-doped graphene (NPG) as electrodes, possessing a high onset potential and long term stabilization [11]. Jin et al. firstly reported nitrogen-doped graphene from dried distillers grains with soluble (DDGS) with high capacitance 324 F/g and lower internal resistance 0.1 Ω [12]. Lin et al. found graphene-wrapped nitrogen-containing carbon spheres (PLG) had a high capacitance 266.7 F/g [13], at the same time, Hao et al. made nitrogen-doped porous micropolyhedra activated with fused KOH (N-PCMPs-A) as electrodes with high specific capacitance 307 F/g as well [14]. Researchers have tried different ways to explore the electrical performance of ultracapacitors assembled with heteroatom N-doped or N-P co-doped graphene-based electrode materials [15,16,17,18,19,20]. However, few researches on investigating the supercapacitors’ electrical characteristics with phosphorus-doped graphene-based electrode materials are reported. Present examples of reported ultracapacitor performance are shown in Table 1. Although some of them possess very large surface area, the capacitances are still relatively low. Also, some of them have high capacitances, but their energy densities are still less satisfactory.
In the present work, we proposed a novel phosphorus-doped porous carbon/graphene (P-PCG) composite, which was adopted as electrode material of supercapacitor. For comparison, using porous carbon/graphene (PCG) materials without phosphorus doping as electrode material of supercapacitor was also prepared under the same conditions. The electrical properties of P-PCG and PCG were tested as the electrode of button type supercapacitor using aqueous electrolyte of 6 M KOH. The results confirmed that P-enriched carbons not only enhanced the supercapacitive properties with high capacitances, but also widened the cell potential windows in aqueous electrolytes, thus obtaining high energy densities. In order to further expand its practical application, a two-dimensional thermal model for commonly used coiling supercapacitor with P-PCG composite as electrode material was established to discuss the thermal state in the running process, which paves the way for its practical application.

2. Experiments and Electrochemical Analyses

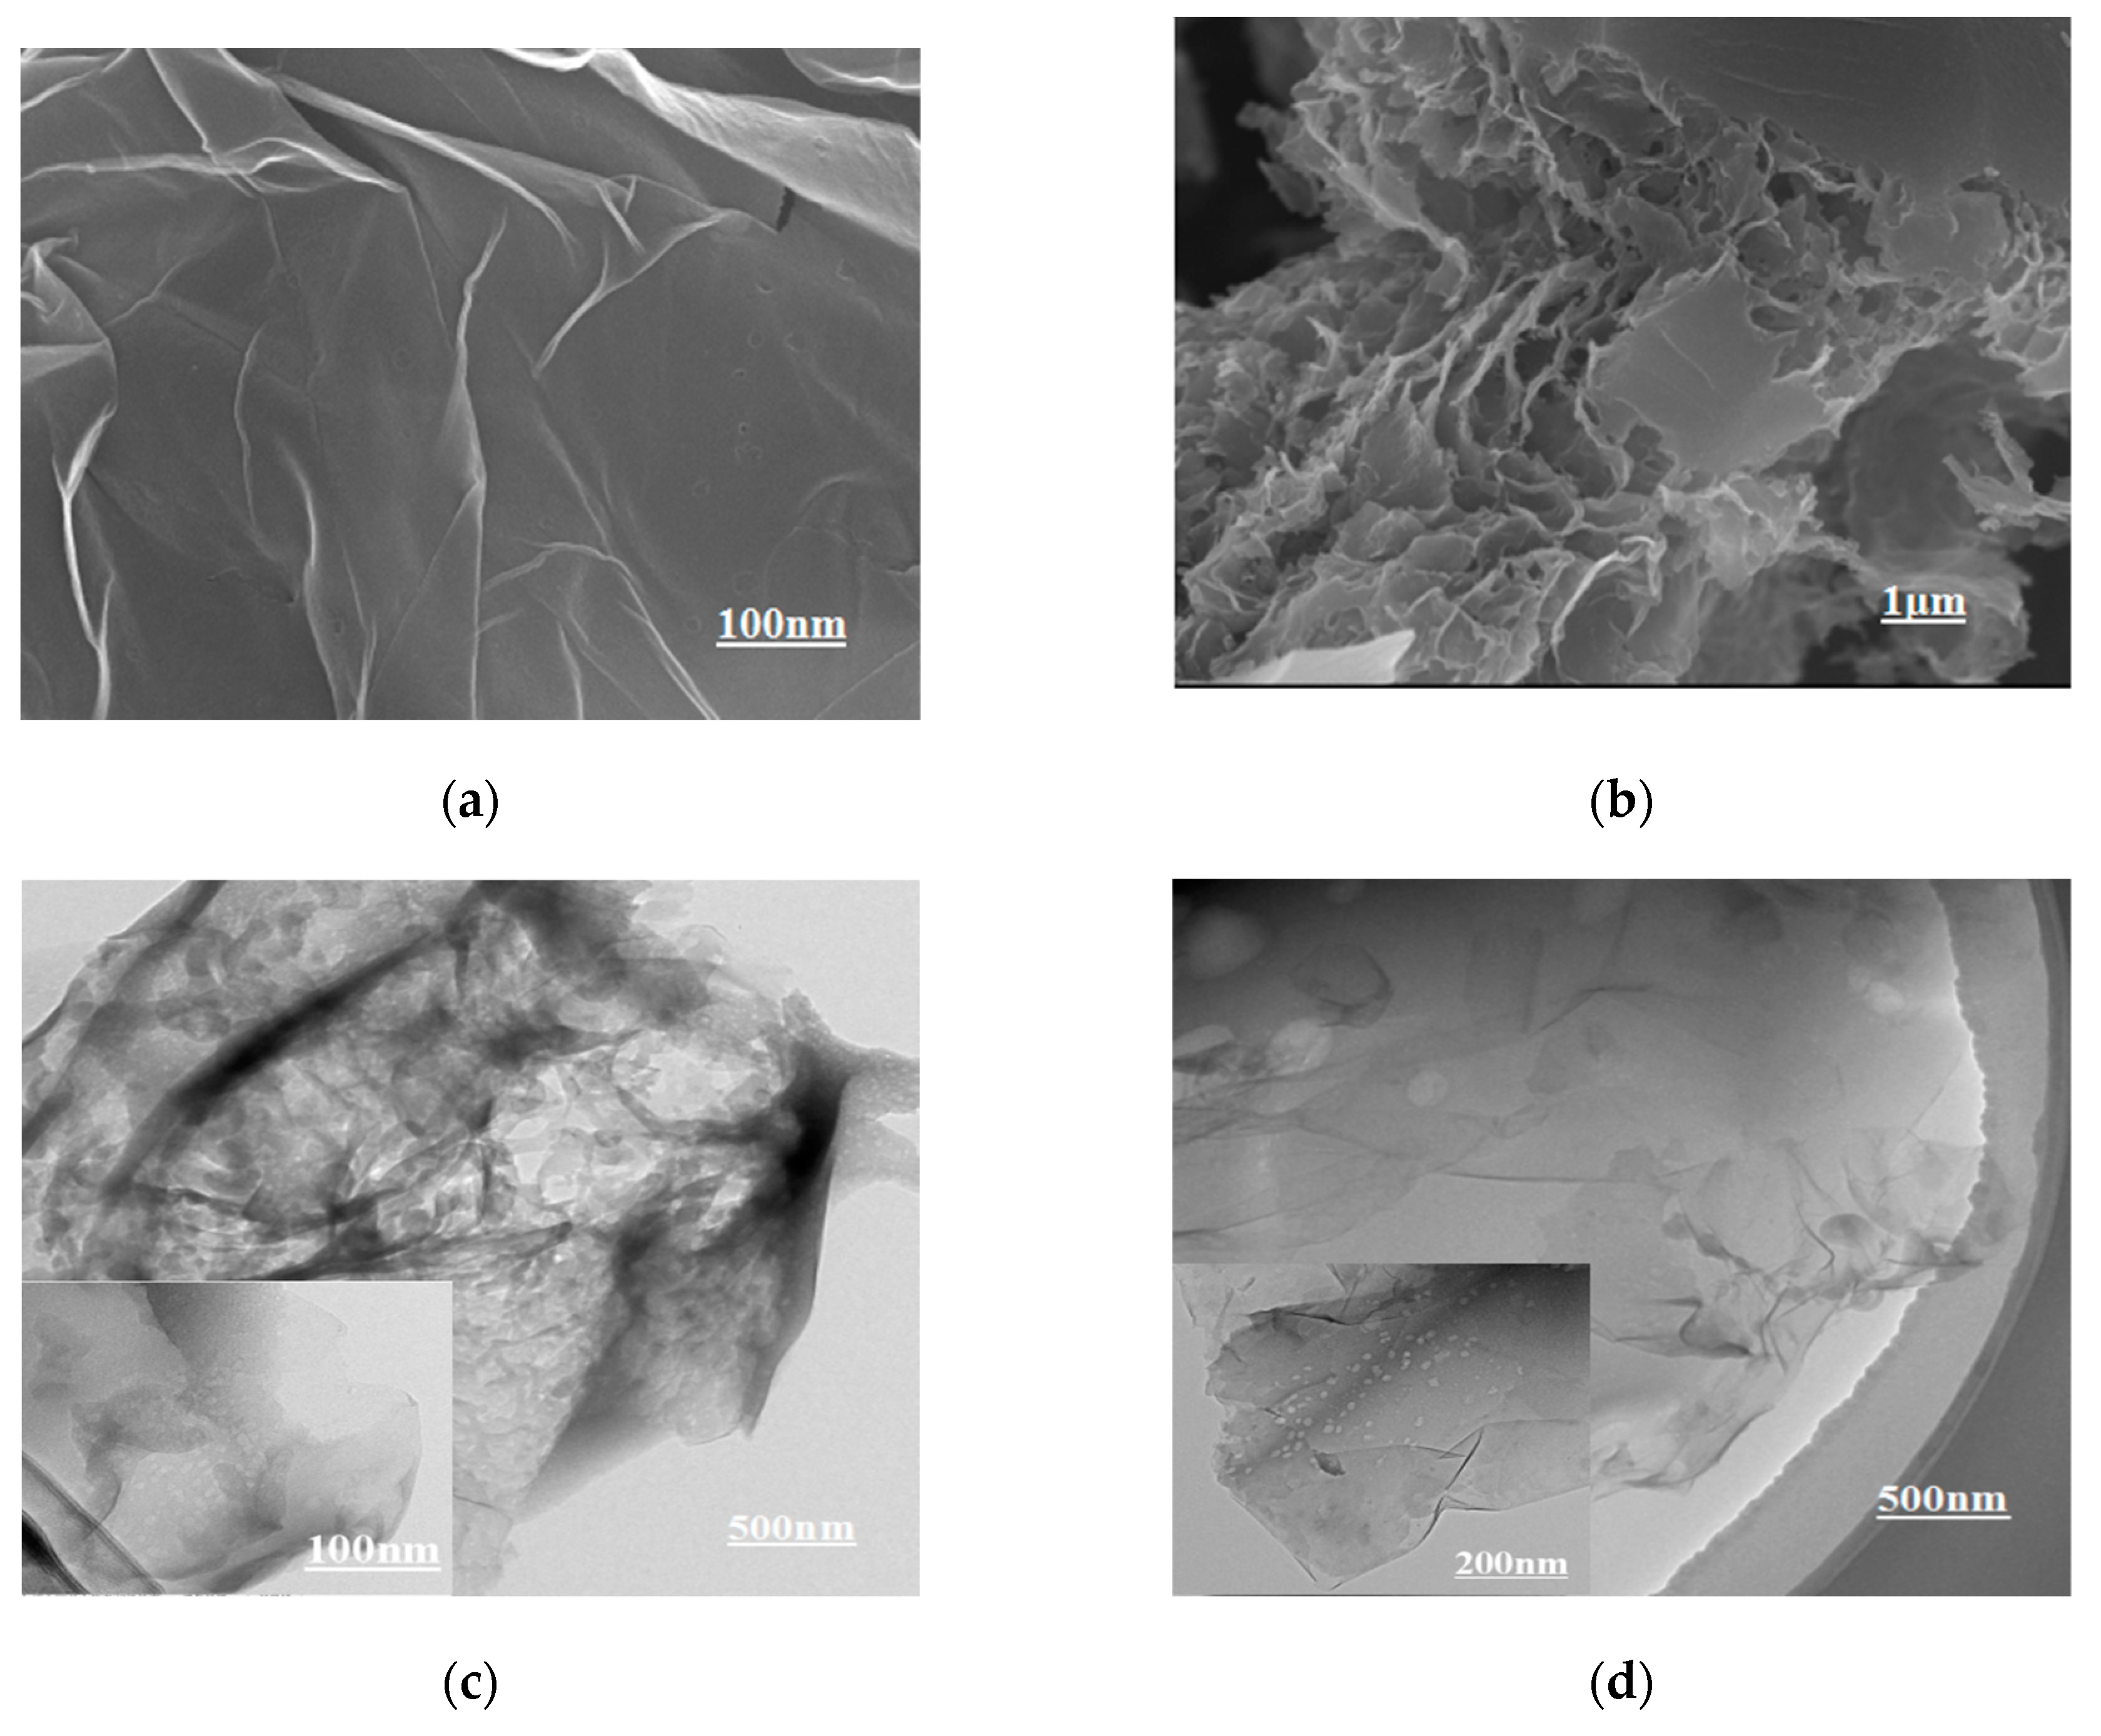
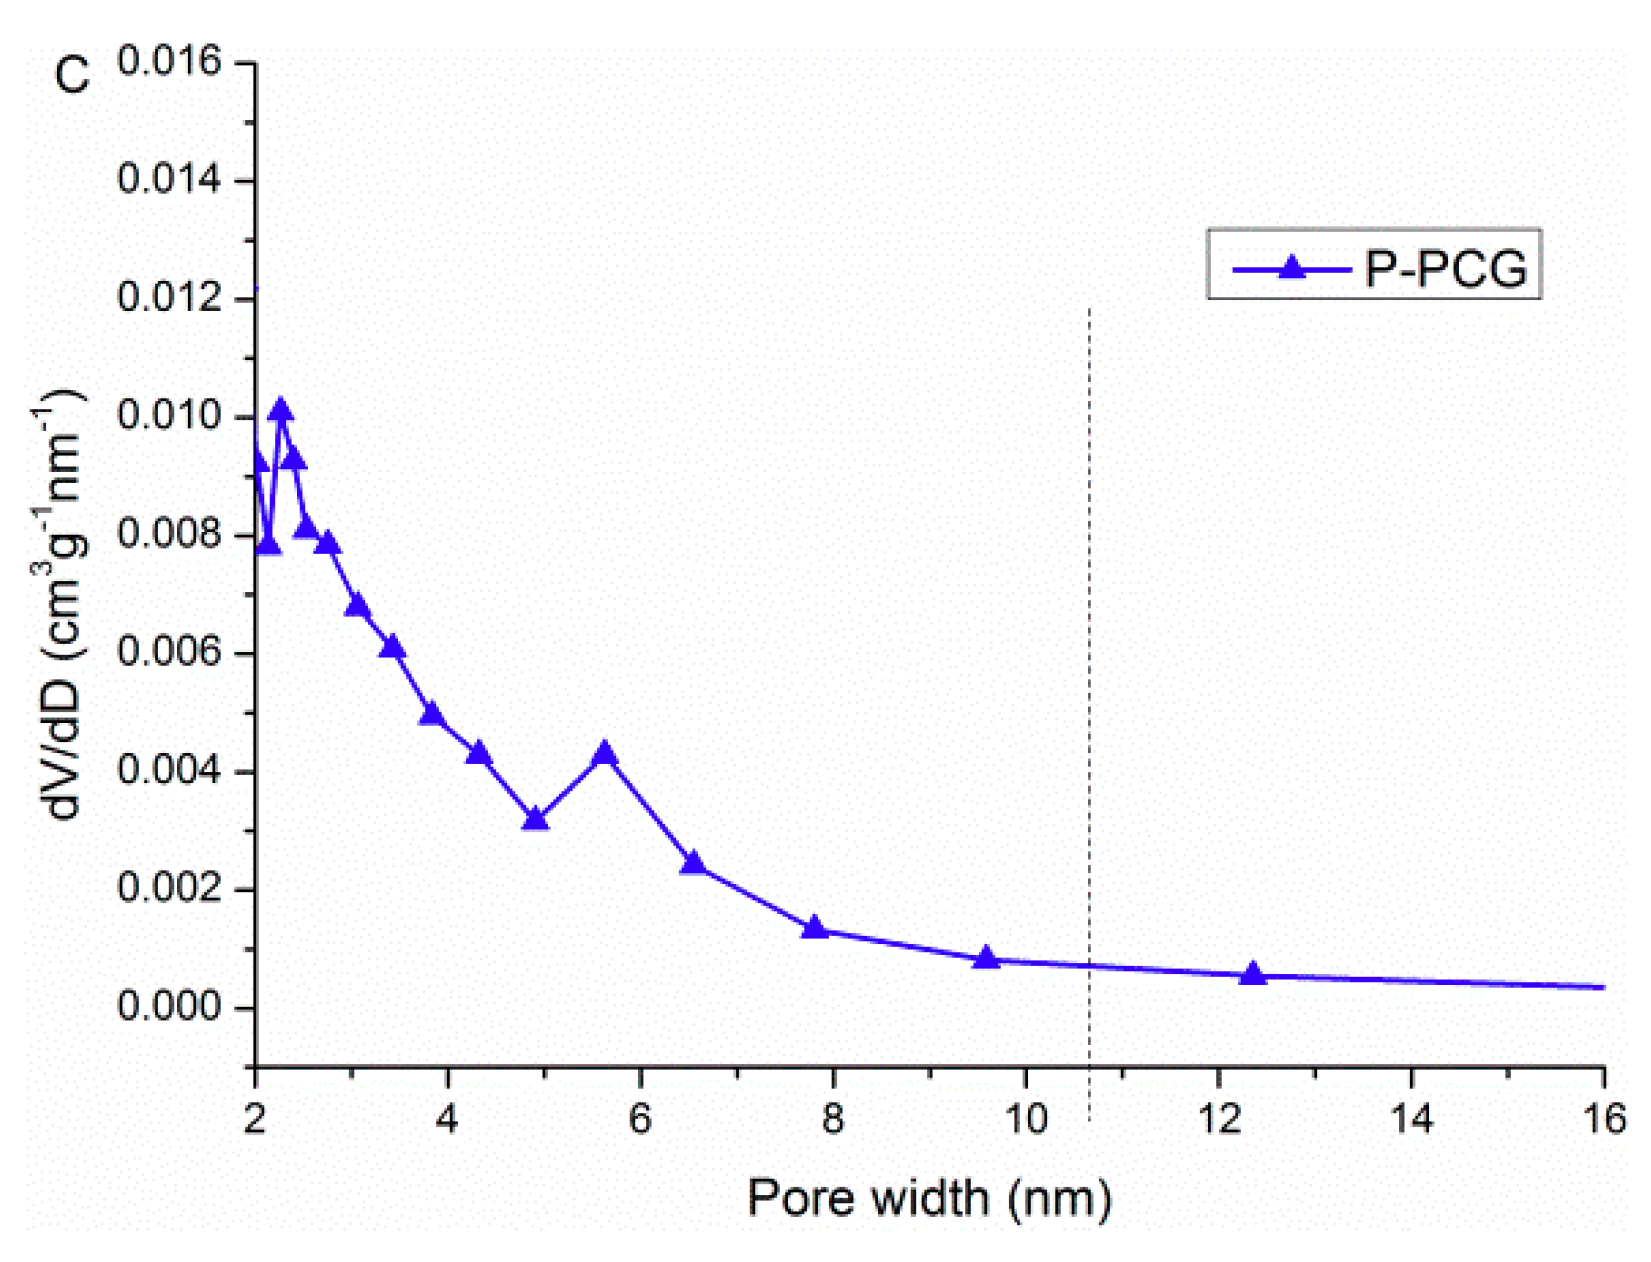
2.1. Analyses of P-PCG Material

We analyzed P-PCG material by studying crucial factors, for example, morphologies, surface functional groups, surface area and pore size. Figure 1 presents the scanning electron microscope (SEM) and transmission electron microscope (TEM) pictures of P-PCG composite. It is observed that graphene sheets with few layer folded and twisted type exist in P-PCG composite. The images in Figure 1b,c indicate that there are lots of laminated structure of graphene nano-sheets and carbon particles existing in P-PCG, which make a substantial contribution to high specific capacitance. Also, Figure 1a,d show that P-PCG possesses large transparent graphene nano-sheets with rumpled and pleated features and lots of open edge sites being twisted and scrolled. The rumples might initiate from P defects and the structural alteration originated by the upturn of bond length and declined of bond angles when P atoms were integrated into graphene nano-sheets, relieving carbon atoms. Because of the above reasons, P-PCG composite possesses pseudo-capacitive active sites and ion transport channel, which are demonstrated to enhance the capability of electrical energy storage for supercapacitors [21,22,23,24].
In order to analysis structures of P-PCG composite and electronic binding states of phosphorous doping, Fourier transform infrared spectra (FT-IR) and X-ray photoelectron spectroscopy (XPS) were conducted. Figure 2A XPS spectrum shows a predominant C1s peak at 283.7 eV, O1s peak at 532.3 eV and relatively weak P2p peak at 133.7 eV, respectively, which indicates the successful incorporation of phosphate functional groups in porous carbon/graphene composite. Figure 2B FT-IR pattern shows the phosphate functional groups exist in P-PCG sample in accord with the results of XPS. The P-OH/P-H stretching peaks emerged at 2358 cm−1 displaying the assimilation of phosphorus atoms into graphene nano-sheets, and the absorption at 1036 cm−1 due to alkoxy C-O-P stretching vibration showed phosphorus atoms were connected to carbon-oxygen bondings, which may deliver supplementary pseudo-capacitance through faradaic reactions, leading to a progressive capacitive performance [25]. The absorption band that appear around 1562 cm−1 consigned to the famished vibrations of graphene sheets was perceived as well.
Afterwards, Nitrogen adsorption/desorption isotherms of P-PCG was performed for investigating the surface area and pore size distribution of this material. As shown in Figure 3A, P-PCG shows typical Langmuir VI type curves with hysteresis loops, and the BET surface area is 1010 m2g−1. In Figure 3B,C, It can be observed that micropore and mesopore size distributions of P-PCG are calculated by Density Functional Theory (DFT) and Barrett Joyner Halenda (BJH) method respectively. The micropores are mainly located 0.5–0.7 nm, and a small amount of them are centered at 1–1.5 nm. The mesopores are distributed in the 2–10 nm region generally. The surface area and pore sizes have close relation with the electrolyte ions. However, it is still a tremendous challenge to fully understand the mechanism.

2.2. Preparation of Button Type Supercapacitors Using P-PCG as Electrode Material

The positive and negative plate where P-PCG was smeared uniformly and diaphragms were put into 6M KOH electrolyte solution and soaked in vacuum for 12 h at room temperature to eliminate the bubbles existing at the interface between the electrode and solution, then it was assembled from bottom to top in the order of negative shell, negative plate, diaphragm, positive plate, metal gasket, spring plate, and positive shell. Metal gasket and spring were added to ensure a good electrical contact between positive and negative electrode. Finally, it was put into the button battery packer and sealed into a button type supercapacitor for testing. The button type supercapacitor using PCG as electrode material was also prepared using the same procedure above for contrast.

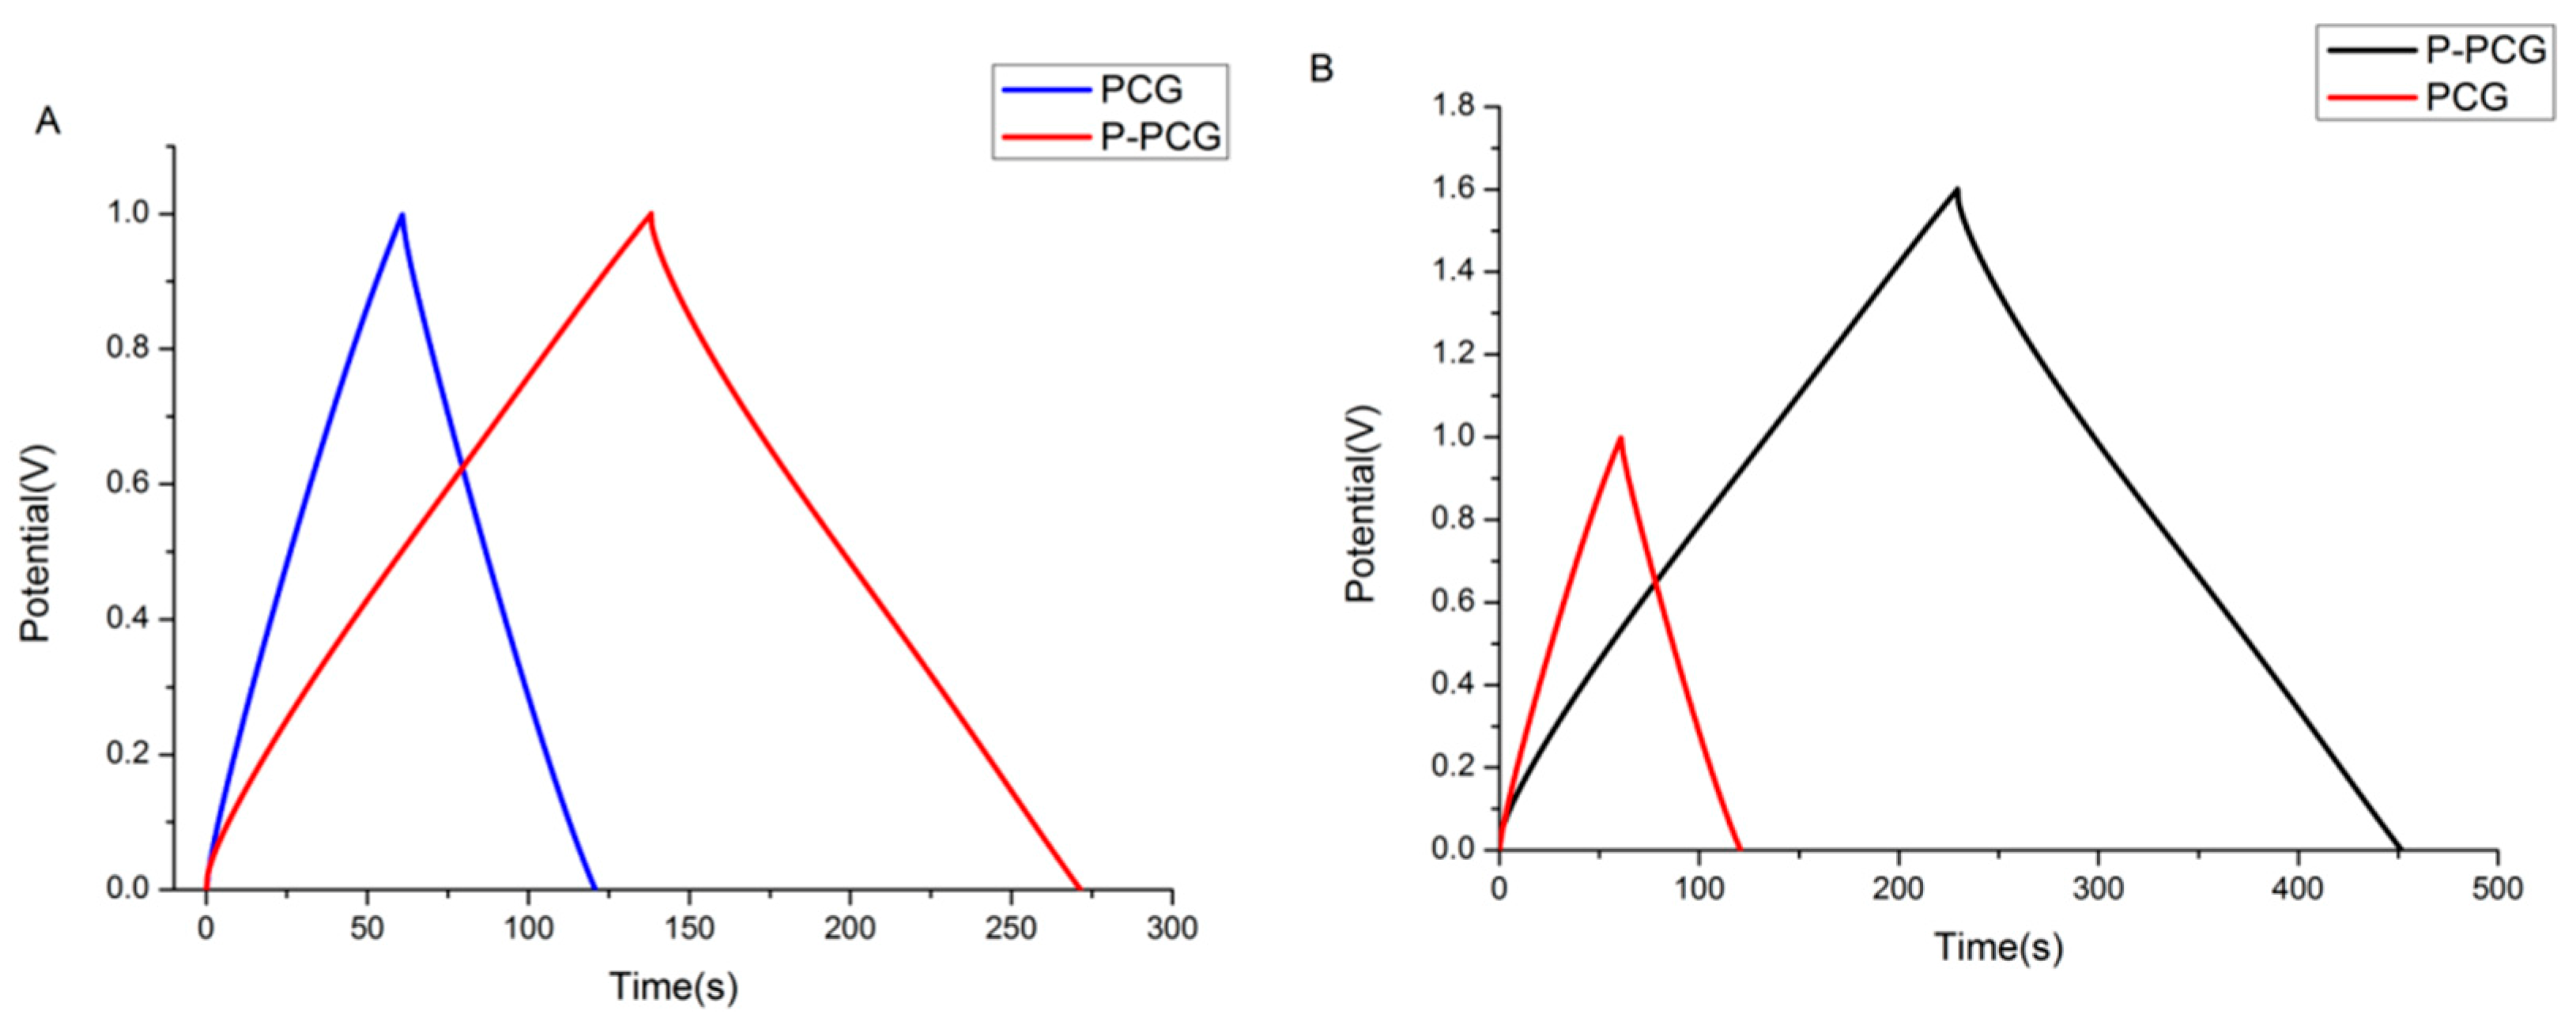
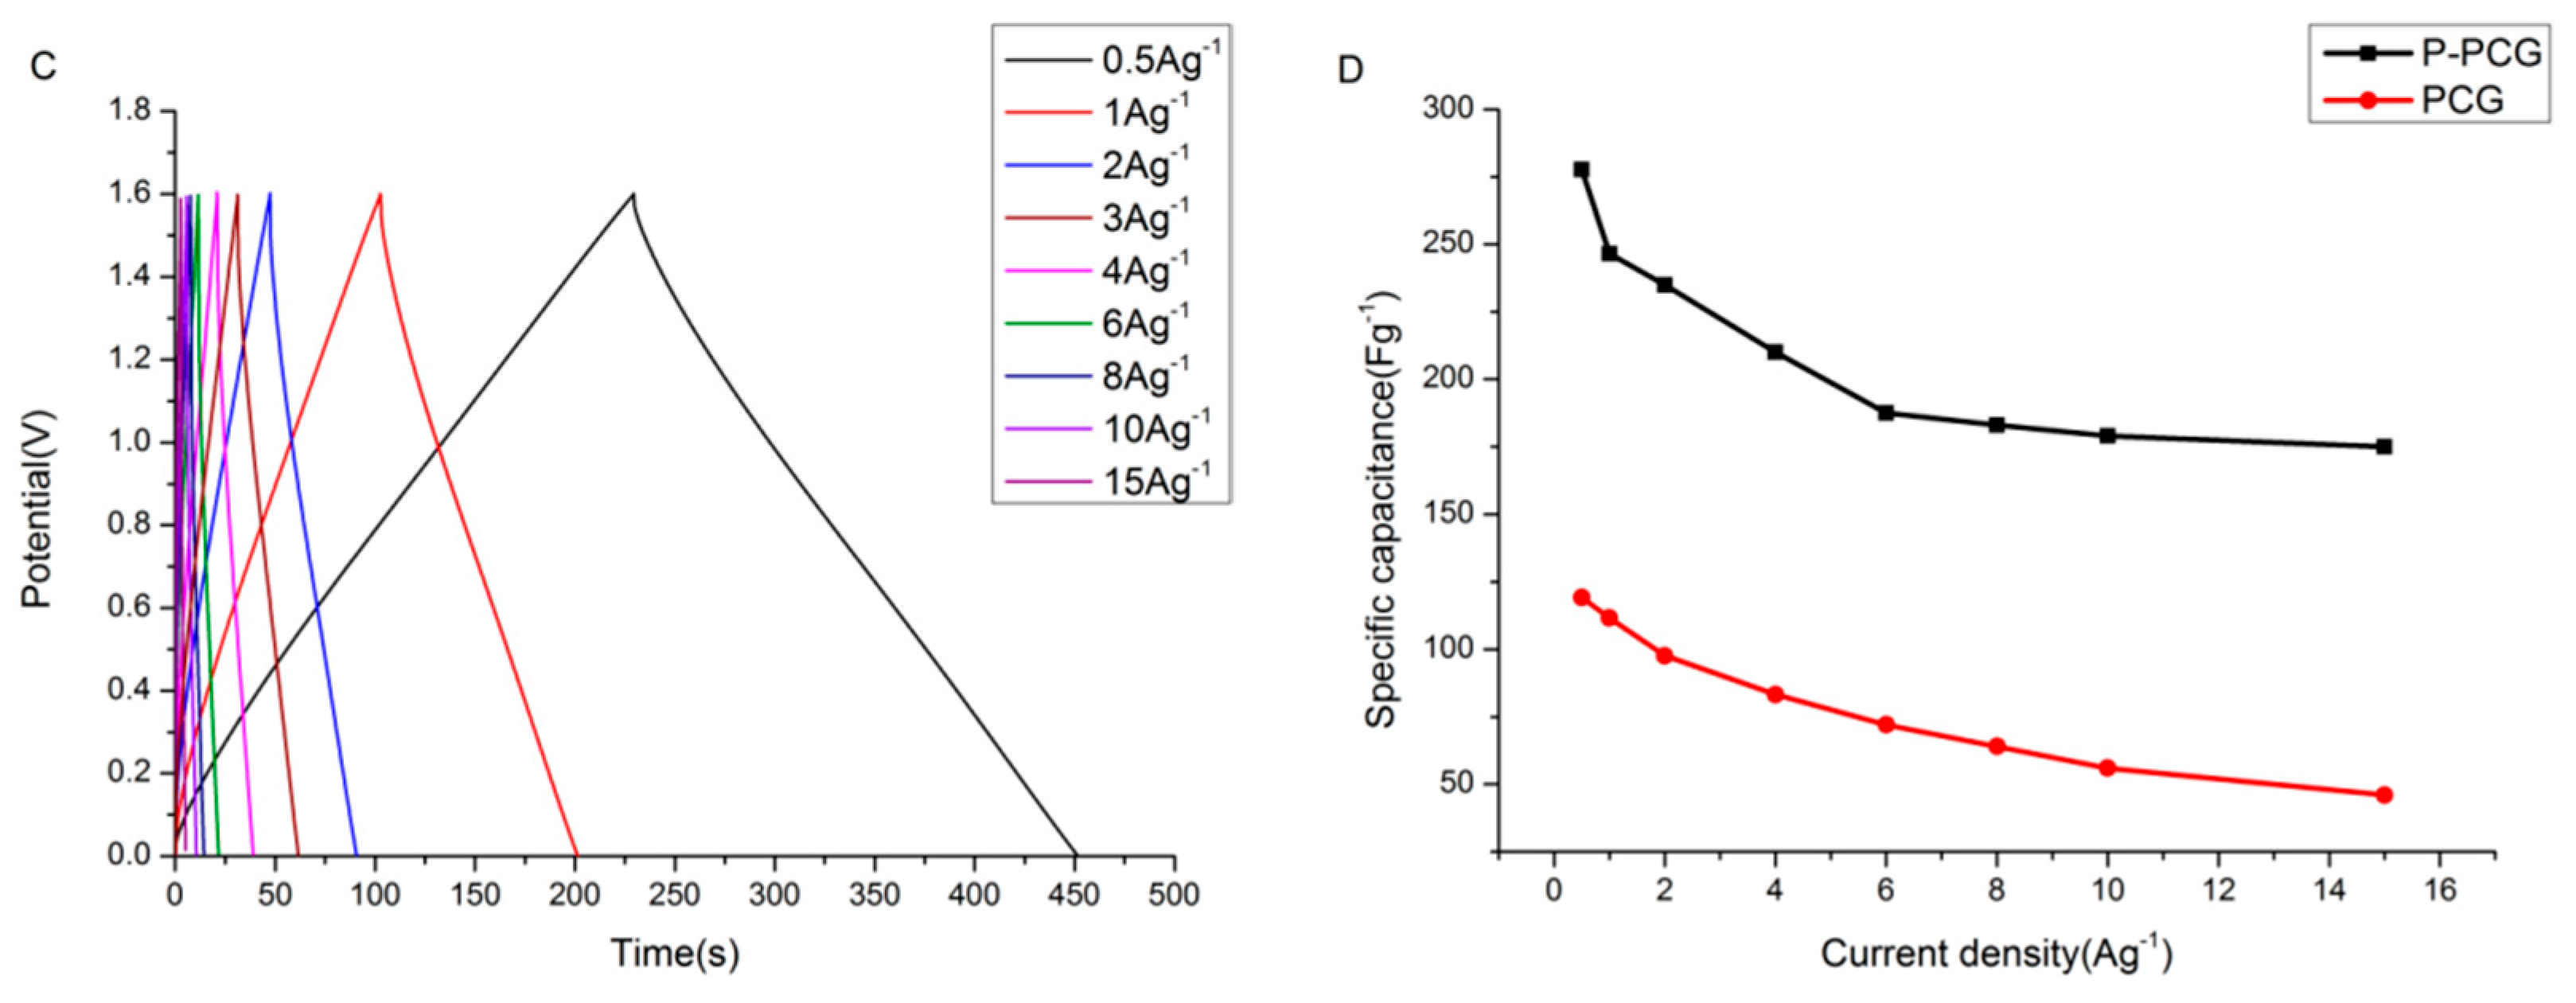
2.3. Electrochemical Measurement

The electrochemical performances of both samples were measured at a CHI6081E chemical work station (Shanghai Chenhua Co., Ltd., Shanghai, China). The properties of assembled button type supercapacitors were analyzed by the charge/discharge property, cyclic voltammetry, cycle life and stability, impedance characteristics etc.
The specific capacitance of carbon electrode could be calculated by constant current discharge process, according to the following formula: Csingle = 4Ccell = 4 × I × ∆t/∆V, where Csingle is the mass specific capacitance of single electrode (Fg−1), Ccell is the mass specific capacitance of supercapacitor unit (Fg−1), I is the discharging current (Ag−1), Δt is the discharge time (s), ΔV is the discharge voltage after removing voltage drop (V), respectively. The energy density, maximum power density and, power density of capacitors were calculated according to the following formulas: E = 0.5 × Ccell × ΔV2, Pmax = ΔV2/4R(1KHz)m, and P = 0.12ΔV2/R(DC)m, where Ccell is the mass specific capacitance of supercapacitor unit (Fg−1), ΔV is the discharge voltage after removing voltage drop (V), m is the mass of active material (g), R(DC) is the DC resistance (Ω), R(1KHz) is the AC resistance (Ω), respectively.

2.4. Result and Discussion

As shown in Figure 4A, Cyclic voltammetry (CV) curves display quasi-rectangular curves in the voltage window from 0 V to 1.0 V, suggesting that CV behaviors result from predominantly double-layer mechanism of energy storage. It is noticeable that P-PCG has larger enclosed areas of the CV curves and the voltammetric current densities of it are higher than that of PCG, thus indicating a higher specific capacitance and double-layer response in P-PCG. Further, to investigate the possibility of utilizing P-doped porous carbon/graphene in an aqueous electrolyte beyond the decomposition potential of water (1.23 V), wide potential window tests were conducted by a gradual increase in the positive potential range above 1.0 V as shown in Figure 4B, by contrast, the range of window voltage of PCG was measured with the same method as shown in Figure 4C. It can be seen from the Figure 4B that the current is not increased obviously at the potential from 1 to 1.5 V, and the CV curves retain well rectangular shapes for P-PCG at the scan rate of 5 mVs−1, exhibiting the internal resistance of the supercapacitor is not obviously increased. Obviously, CV curve still retains rectangular shape when potential window is up to a high value of 1.6 V, but the current is significantly increased and the distortion of CV curve is significantly enhanced (the two vertical lines of the rectangle become bent sloping lines), indicating that the internal resistance of the supercapacitor begins to be increased, with further increase of potential, The CV curve tends to deteriorate seriously. The results indicate that the most stable potential window for P-PCG in aqueous electrolyte is 1.6 V, which is significantly higher than the theoretical decomposition potential of water (1.23 V). Figure 4C clearly shows that a bit of distortion appears when the positive potential is 1 V, and the distortion is getting worse along with the increase of positive potential. When the voltage is up to 1.2 V, severe distortion is observed. Thus, the stability window voltage of PCG is 1 V in aqueous electrolyte, which is in sharp contrast to the stable window of P-PCG. The wide window voltage of P-PCG in aqueous electrolyte might be as a result of the reversible electrochemical hydrogen storage in composite, and one of the reasons could be also estimated that the introduction of phosphorus functional groups could make some changes on the carbon surface.
When the scan rate was increased gradually from 5 to 100 mVs−1as shown in Figure 4D, the CV curve integrated area of P-PCG electrode is increased but maintains the slightly deviated rectangular shape at high scan rate of 100 mVs−1, suggesting general rate capability performance of P-PCG. This may be due to the reversibility of the reaction that is related to the structural stability occurring on the surface of the material or the charge transport performance during the charge–discharge process.
In order to further evaluate the capacitance property, Galvanostatic charge–discharge (GC) profiles within the potential range of 0–1.0 V were performed. As shown in Figure 5A, GC curves of P-PCG and PCG were performed at a current density of 0.5 Ag−1, exhibiting triangular shape. GC curves are highly linear and symmetrically close to triangle shapes, demonstrating ideal capacitor behavior. It is obvious that P-PCG shows a longer discharge time than that of PCG, thus yielding higher specific capacitance. Because of the presence of pseudo-capacitance in P-doped porous carbon/graphene electrodes, which becomes the additional mechanism of energy storage alongside of double-layer formation, the P-doped electrodes shows higher capacitance than undoped counterpart.
The specific capacitance is calculated from the corresponding galvanostatic discharge curves. As shown in Figure 5D, the specific capacitances are listed with different current densities. It can be seen that the specific capacitances of PCG and P-PCG are 120, 277 Fg−1 at current density of 0.5 Ag−1, respectively. The specific capacitance value is decreased with the increase of the current density from 0.5 to 15 Ag−1. The specific capacitance of P-PCG still can reach 175 Fg−1 at current density of 15 Ag−1 with only 37% capacitance loss, in contrast, PCG only maintains 38.6% when the current density is increased from 0.5 to 15 Ag−1. This phenomenon states that a decrease of the capacitance at the high current density is attributed to the diffusion limitation of electrolyte ions at high current density.
The energy density is related to the cell capacitance and the square of the operating voltage. Therefore, because of the wide potential range, the energy densities of P-doped porous carbon/graphene are increased significantly compared with the value of undoped porous carbon/graphene. The Ragone plot of the P-PCG is shown in Figure 6A. The maximum energy density of 26.42 Wh/kg with a power density of 390 W/kg and power density of 6 kW/kg with energy density of 17.3 Wh/kg were achieved.
Furthermore, the long cycle life of supercapacitor is a crucial parameter for its practical application. Figure 6B shows the cycling stability of P-PCG button supercapacitor at high potential window of 1.6 V was measured by continuous GC measurement for 5000 cycles at the current density of 3 Ag−1, and the results indicate the supercapacitor maintains presentable cycling stability with 94% retention of specific capacitance after 5000 continuous cycles. In succession, the cycle performance of P-PCG capacitor cell was kept on investigating by the same method for 10,000 cycles. As shown in Figure 6C, it exhibits the capacitance still can preserve 90.8% at the current density of 10 Ag−1 under the same voltage after 10,000 cycles, which makes known that the cycle life of P-PCG button supercapacitor is generally good compared with the results of other reports. Meanwhile, this result is in keeping with rate capability performance of P-PCG capacitor cell, which is attributed to electronic transfer capability.
Electrochemical impedance spectroscopy (EIS) which was performed by using Autolab is a principal method to examine the fundamental behavior of supercapacitors. The amplitude of AC signal was 5 mV, and the frequency range was 0.01 Hz to 100 kHz. It can be seen from the Figure 7A that both of Nyquist plots are similar in shape and consist of three parts which are the semicircular arc in the high frequency region, the 45° slant in the intermediate frequency region and, the vertical line in the low frequency region. The intersection point of the curves and the solid axis is called the solution resistance (Re), which is mainly the internal resistance of the electrolyte, but also includes the internal resistance of the electrode and the contact resistance between the electrode and the collector. The increase of resistance caused by semi-circular arcs is called charge transfer resistance (Rct). Equivalent Series Resistance (ESR) is composed of charge transfer resistance and solution resistance, which reflects the resistance to the electron conduction and ionic transportation. The values of Re and Rct were calculated from impedance data in Figure 7A by using Zview computer software and presented in Table 2. The results show that P-PCG has a higher conductivity than that of PCG. Meanwhile in the low frequency region, the oblique line of P-PCG is steeper, which shows that P-PCG possesses better capacitance characteristics.
Figure 7 shows EIS curves of P-PCG at different cut-off voltages, and it is observed that with the increase of cut-off voltage, the Rct of supercapacitor increases continuously. It is mainly caused by the decomposition products of electrolyte at higher cut-off voltage. At the same time, the growth rate of Rct is also increased, which indicates that the decomposition of electrolyte of supercapacitor is accelerated.
The leakages current and self-discharge were measured as shown in Figure 8A,B. The main function of leakage current tests is to measure the insulation performance of supercapacitors. Leakage current is mainly caused by the following three aspects: microelectrochemical cell current is caused by impurities in electrodes or electrolytes; potential gradient and ion concentration difference give rise to charge diffusion current in double layer; diaphragm punctured by cell burr or collector can lead to micro-short circuit current. As shown in Figure 8A, the leakage current of P-PCG is higher than that of PCG at first, but the decreasing rate of leakage current of P-PCG is extremely fast, after around 100 s, the curves of leakage current maintain stable and the value of PCG is higher than that of P-PCG, indicating the insulation performance of P-PCG is better. The main purpose of self-discharge tests is to measure the ability of supercapacitors to store charge for a long time. The following method was used to measure self-discharge in this paper. After the leakage current tests of the supercapacitors were completed, the supercapacitors was stationed for 5 h, and then the maintained voltages of the supercapacitors were measured. As shown in Figure 8B, the voltage drop rate of PCG is very faster compared with that of P-PCG, which indicates the voltage loss of PCG is larger in contrast to that of P-PCG.

3. Thermal Coupling Analyses

3.1. Establish Simulation Model

In order to further explore the P-PCG as electrode material of supercapacitor in practical application, a two-dimensional thermal model for commonly used coiling supercapacitor was studied in this research which consists of a core region, column of air and, coating [26,27]. The size of supercapacitor is 10 mm × 65 mm, as shown in Figure 9.

3.2. Basic Assumption of Thermoanalysis

Supercapacitor generates heat effect in the process of charging and discharging. There are three basic forms of heat transfer: heat conduction, convective heat transfer, and thermal radiation [28,29]. In order to simplify analysis and save calculation time, it is necessary to give simplifications and assumptions for the model as follows:
  • Study the supercapacitor as a whole, with constant mass, volume and density during cycle life;
  • The supercapacitor’s internal heat is generated uniformly.
  • Ignoring the flow of electrolyte solution in the core area, that is to say, the heat transfer inside the supercapacitor is only conducted by heat conduction. The heat transfer on the outer surface of the supercapacitor is mainly convective heat transfer and radiation heat transfer.
  • According to the structure characteristics of coiling supercapacitor, the radial thermal conductivity of carbon electrode can be approximately equivalent to the thermal conductivity of P-PCG, and the axial thermal conductivity can be equivalent to the thermal conductivity of collector nickel foam.

3.3. Governing Equations

According to the above simplifications and assumptions, the transient two-dimensional equation of heat conduction can be written as follows [30,31]:
ρCP ∂T/∂t = λr2T/∂r2 + λr ∂T/r∂r + λz2T/∂z2 + P,
where ρ is the effective density; CP is the effective heat capacity at constant pressure; T is the temperature; t is the time; λ is the effective thermal conductivities, r is radial coordinate and z is axial coordinate; P is the heat generation rate per unit volume.
The effective density, effective heat capacity at constant pressure can be calculated as follows:
ρ = ΣρiVi/ΣVi,
CP = ΣciρiVi/ρΣVi,
where Vi is volume of different interfaces. The effective thermal conductivities of the core region can be estimated based on the principle of parallel and series equivalent thermal resistances.

3.4. The Result and Discussion of Simulation

The galvanostatic charge–discharge of the model of supercapacitor with 1.5 A current at room temperature 298.15 K was carried out by simulation. The variation of voltage with time is shown in Figure 10.
Figure 11 shows the internal temperature distribution of the model of supercapacitor after the sixtieth cycle of charge and discharge. We can observe changes in color temperature contours, in which different colors are used to represent the different temperature field. The temperature increases gradually from blue to red field.
In addition, the temperature distribution of supercapacitor is symmetrical, because we assumed that the current distribution of supercapacitor was uniform and the regions were ideal homogeneous solids. And the closer the supercapacitor is to the central region, the higher the temperature of the supercapacitor is; the closer the supercapacitor is to the surface, the lower the temperature is. This is because the heat in the central region is not easy to transmit outward, and the closer the supercapacitor is to the surface region, the easier it is to transmit heat.
Further to explore the change regulation of internal maximum temperature with the number of cycles, simulation and experiments were carried out respectively. The two curves can be divided into two stages in general: the temperature rising stage and the steady-state stage, as shown in Figure 12.
In the initial stage, the temperature rises rapidly, and with the increase number of cycles, the temperature changes tend to be gentle at about 60 cycles. Even though there exist exiguous deviations between experiment and simulation curves, they are primarily in accordance with each other. Consequently, the simulation is reliable. It can be observed that the curves gradually stabilize at 324.5 K and develop into a steady state region.
The model of the supercapacitor was performed by galvanostatic charge–discharge tests of 7 cycles with current of 5, 10, and 15 A respectively, in order to further discuss the relationship between the internal temperature and charge–discharge current in the core region. The curves of temperature change with various currents are shown in Figure 13.
As shown in Figure 13, with the increase of charging and discharging current, the internal maximum and minimum temperature rises sharply, but the temperature differences between the maximum and minimum temperature become larger as shown in Table 3. When the high charging and discharging current is supplied with the supercapacitor, some cooling measures should be taken to ensure that the supercapacitor is in good condition.

4. Conclusions

Summarizing the above content, we have successfully adopted novel phosphorus-doped porous carbon/graphene composite as electrode material of supercapacitor, which significantly enhanced the supercapacitive performance. The P-enriched carbons sample offered an outstanding capacitive behavior in 6 M KOH aqueous electrolyte at 1.6 V with higher specific capacitance (277 Fg−1 at the current density of 0.5 Ag−1), good cycling performance (90.8% retained after 10,000 cycles) and high energy densities of 26.42 Wh/kg. Meanwhile, according to thermal analysis, the internal maximum temperature keeps a small oscillation after charging and discharging of 60 cycles, and when the maximum temperature exceeds the allowable temperature range with the increase of supplied current, cooling measures should be taken into consideration. The thermal analyses of simulation for supercapacitor based on P-PCG composite as electrode material are extremely helpful to its temperature control in practical application. In short, this phosphorus-doped porous carbon/graphene composite used as electrode material of supercapacitor may make a contribution to supercapacitors’ development with new kind of electrode materials that show excellent electrical performances.

Author Contributions

Resources, S.A.; Supervision, X.T.W.; Writing—original draft, J.Y.Z.; Writing—review & editing, J.Y.Z. and F.G.L.

Funding

We gratefully acknowledge the financial supports from the National Natural Science Foundation of China (Nos. 21276190 and 20806059) and Tianjin Natural Science Foundation (15 JCYBJC20900).

Conflicts of Interest

The authors declare no conflict of interest.

References

  1. Sharma, P.; Bhatti, T.S. A review on electrochemical double-layer capacitors. Energy Convers. Manag. 2010, 51, 2901–2912. [Google Scholar] [CrossRef]
  2. Ruiz, V.; Santamaría, R.; Granda, M. Long-term cycling of carbon-based supercapacitors in aqueous media. Electrochim. Acta 2009, 54, 4481–4486. [Google Scholar] [CrossRef] [Green Version]
  3. Zhu, Y.; Murali, S.; Stoller, M.D. Carbon-based supercapacitors produced by activation of graphene. Science 2011, 332, 1537–1541. [Google Scholar] [CrossRef] [PubMed]
  4. Wang, Q.; Yan, J.; Fan, Z. Carbon materials for high volumetric performance supercapacitors: Design, progress, challenges and opportunities. Energy Environ. Sci. 2016, 9, 729–762. [Google Scholar] [CrossRef]
  5. Xia, X.; Tu, J.; Zhang, Y. Freestanding Co3O4 nanowire array for high performance supercapacitors. RSC Adv. 2012, 2, 1835–1841. [Google Scholar] [CrossRef]
  6. Pu, J.; Cui, F.; Chu, S. Preparation and electrochemical characterization of hollow hexagonal NiCo2S4 nanoplates as pseudocapacitor materials. ACS Sustain. Chem. Eng. 2014, 2, 809–815. [Google Scholar] [CrossRef]
  7. Shen, J.X.; Yao, Z. Catalyst-free Synthesis of Phosphorus-doped Graphene and its Use for Electrocatalytic Oxygen Reduction. Technol. Dev. Chem. Ind. 2016, 5, 1–6. [Google Scholar]
  8. Yi, J.; Qing, Y.; Wu, C.T. Lignocellulose-derived porous phosphorus-doped carbon as advanced electrode for supercapacitors. J. Power Sources 2017, 351, 130–137. [Google Scholar] [CrossRef]
  9. Tian, Y.; Wei, Z.; Zhang, K. Three-dimensional phosphorus-doped graphene as an efficient metal-free electrocatalyst for electrochemical sensing. Sens. Actuators B Chem. 2017, 241, 584–591. [Google Scholar] [CrossRef]
  10. Gang, L.; Sun, Z.; Zhang, Y. One-step green synthesis of nitrogen and phosphorus co-doped pitch-based porous graphene-like carbon for supercapacitors. J. Porous Mater. 2017, 24, 1–8. [Google Scholar]
  11. Dong, L.; Hu, C.; Huang, X. One-pot Synthesis of Nitrogen and Phosphorus Co-doped Graphene and Its Use as High-performance Electrocatalyst for Oxygen Reduction Reaction. Chem. Asian J. 2016, 10, 2609–2614. [Google Scholar] [CrossRef] [PubMed]
  12. Jin, H.; Wang, X.; Gu, Z. A facile method for preparing nitrogen-doped graphene and its application in supercapacitors. J. Power Sources 2015, 273, 1156–1162. [Google Scholar] [CrossRef]
  13. Lin, T.T.; Wang, W.D.; Lü, Q.F. Graphene-wrapped nitrogen-containing carbon spheres for electrochemical supercapacitor application. J. Anal. Appl. Pyrolysis 2015, 113, 545–550. [Google Scholar] [CrossRef]
  14. Hao, F.; Li, L.; Zhang, X. Synthesis and electrochemical capacitive properties of nitrogen-doped porous carbon micropolyhedra by direct carbonization of zeolitic imidazolate framework-11. Mater. Res. Bull. 2015, 66, 88–95. [Google Scholar] [CrossRef]
  15. Shirazi, S.F.; Gharehkhani, S.; Yarmand, H. Nitrogen doped activated carbon/graphene with high nitrogen level: Green synthesis and thermo-electrical properties of its nanofluid. Mater. Lett. 2015, 152, 192–195. [Google Scholar] [CrossRef]
  16. Li, Y.; Shang, T.X.; Gao, J.M. Nitrogen-doped activated carbon/graphene composites as high-performance supercapacitor electrodes. RSC Adv. 2017, 7, 19098–19105. [Google Scholar] [CrossRef] [Green Version]
  17. Zhang, J.; Zhang, Z.; Zhao, X. Graphene/Nitrogen-doped Carbon Nanofiber Composite as an Anode Material for Sodium-ion Batteries. RSC Adv. 2015, 5, 104822–104828. [Google Scholar] [CrossRef]
  18. Yang, F.; Zhang, Z.; Du, K. Dopamine derived nitrogen-doped carbon sheets as anode materials for high-performance sodium ion batteries. Carbon 2015, 91, 88–95. [Google Scholar] [CrossRef]
  19. Li, Y.F.; Liu, Y.Z.; Liang, Y. Preparation of nitrogen-doped graphene/activated carbon composite papers to enhance energy storage in supercapacitors. Appl. Phys. 2017, 123, 566. [Google Scholar] [CrossRef]
  20. Yin, Y.Y.; Li, R.Y.; Li, Z.J. A facile self-template strategy to fabricate three-dimensional nitrogen-doped hierarchical porous carbon/graphene for conductive agent-free supercapacitors with excellent electrochemical performance. Electrochim. Acta 2014, 125, 330–337. [Google Scholar]
  21. Zhang, C.; Mahmood, N.; Yin, H. Synthesis of Phosphorus/Doped Graphene and its Multifunctional Applications for Oxygen Reduction Reaction and Lithium Ion Batteries. Adv. Mater. 2013, 25, 4932–4937. [Google Scholar] [CrossRef] [PubMed]
  22. Karthika, P.; Rajalakshmi, N.; Dhathathreyan, K.S. Phosphorus-doped exfoliated graphene for supercapacitor electrodes. Nanosci. Nanotechnol. 2013, 13, 1746–1751. [Google Scholar] [CrossRef]
  23. Wen, Y.; Wang, B.; Huang, C. Corrigendum: Synthesis of Phosphorus-Doped Graphene and its Wide Potential Window in Aqueous Supercapacitors. Chemistry 2015, 21, 3520. [Google Scholar] [CrossRef]
  24. Wang, L.; Sun, L.; Tian, C. A novel soft template strategy to fabricate mesoporous carbon/graphene composites as high-performance supercapacitor electrodes. RSC Adv. 2012, 2, 8359–8367. [Google Scholar] [CrossRef]
  25. Zhang, D.; Han, M.; Li, Y. Ultra-facile fabrication of phosphorus doped egg-like hierarchic porous carbon with superior supercapacitance performance by microwave irradiation combining with self-activation strategy. J. Power Sources 2017, 372, 260–269. [Google Scholar] [CrossRef]
  26. Wang, K.; Li, L.; Yin, H. Thermal Modelling Analysis of Spiral Wound Supercapacitor under Constant-Current Cycling. PLoS ONE 2015, 10. [Google Scholar] [CrossRef] [PubMed]
  27. Wang, H. Modeling and Simulations of Electrical Energy Storage in Electrochemical Capacitors—E Scholarship. Ph.D. Thesis, University of California, Los Angeles, CA, USA, 2013. [Google Scholar]
  28. Spanik, P.; Frivaldsky, M.; Drgona, P. Design procedure of simple and accurate model of electric double layer capacitor (EDLC) targeting fast verification purposes of heat transfer simulations. Electr. Eng. 2014, 96, 121–134. [Google Scholar] [CrossRef]
  29. Zheng, M.N.; Li, Y.S.; Liu, J. Thermal Analysis on Symmetric Rectangular Stackable Supercapacitors. Adv. Mater. Res. 2015, 1092–1093, 539–542. [Google Scholar] [CrossRef]
  30. Rafik, F.; Gualous, H.; Gallay, R. Frequency, thermal and voltage supercapacitor characterization and modeling. J. Power Sources 2007, 165, 928–934. [Google Scholar] [CrossRef]
  31. Lee, J.; Yi, J.; Kim, D. Modeling of the Electrical and Thermal Behaviors of, an Ultracapacitor. Energies 2014, 7, 8264–8278. [Google Scholar] [CrossRef]
Figure 1. (a,b) SEM images of phosphorus-doped porous carbon/graphene (P-PCG); (c,d) TEM images of P-PCG.
Electronics 08 00254 g001
Figure 2. (A) XPS wide scan of P-PCG sample; (B) FT-IR pattern of P-PCG sample.
Electronics 08 00254 g002
Figure 3. (A) Adsorption/desorption isotherms of N2; (B) micropore distribution of P-PCG by Density Functional Theory (DFT) method; (C) mesopore distribution of P-PCG by Barrett Joyner Halenda (BJH) method.
Electronics 08 00254 g003aElectronics 08 00254 g003b
Figure 4. (A) Cyclic voltammetry (CV) curves of P-PCG and PCG at a scan rate of 5 mVs−1 with window voltage of 1 V; (B) P-PCG electrodes with cut-off voltages from 1 V to 1.6 V at scan rate of 5 mVs−1; (C) porous carbon/graphene (PCG) electrodes with cut-off voltages from 1 V to 1.2 V at scan rate of 5 mVs−1; (D) CV curves of P-PCG at various scan rates from 5 to 100 mVs−1.
Electronics 08 00254 g004aElectronics 08 00254 g004b
Figure 5. (A) Galvanostatic charge–discharge (GC) curves of P-PCG and PCG at current density of 0.5 Ag−1 with window voltage of 1 V; (B) GC curves of P-PCG and PCG at current density of 0.5 Ag−1 with different window voltages; (C) GC curves of P-PCG at different current density; (D) the specific capacitance of P-PCG and PCG electrodes at various current density.
Electronics 08 00254 g005aElectronics 08 00254 g005b
Figure 6. (A) Ragone plot of P-PCG at a potential window of 1.6 V; (B) Cycling tests of P-PCG at a current load of 3 Ag−1 and potential window of 1.6 V in button cell for 5000 cycles; (C) Cycling tests of P-PCG at a current load of 10 Ag−1 and window voltage of 1.6 V in button cell for 10,000 cycles.
Electronics 08 00254 g006
Figure 7. (A) Nyquist plots of the P-PCG and PCG electrodes in the frequency range 0.01–100 kHz; (B) Nyquist plots of the P-PCG electrode at various cut-off voltages.
Electronics 08 00254 g007
Figure 8. (A) Leakage current of P-PCG and PCG electrodes; (B) Self-discharge of P-PCG and PCG electrodes.
Electronics 08 00254 g008
Figure 9. The model of a coiling supercapacitor.
Electronics 08 00254 g009
Figure 10. Curve of voltage.
Electronics 08 00254 g010
Figure 11. Temperature distribution of 60 cycles.
Electronics 08 00254 g011
Figure 12. Highest temperature in core area changing with cycle times.
Electronics 08 00254 g012
Figure 13. (a) The curves of temperature change at current of 5 A; (b) The curves of temperature change at current of 10 A; (c) The curves of temperature change at current of 15 A.
Electronics 08 00254 g013aElectronics 08 00254 g013b
Table 1. Present examples of reported ultracapacitor device performances.
ElectrodeElectrolyteSBET (m2g−1)Voltage (V)C (Fg−1)Energy Density (Whkg−1)
Carbon nanosheetsBMPY TFSI22873-19
Activation of GrapheneBMIMBF4/AN24003.516620
Porous carbon nanosheetsTEABF4/AN22002.715030
N-doped carbon nanofiberKOH5621.02027.11
N-doped 3D grapheneKOH5830.829715.2
Table 2. The calculated values of Re and Rct of PCG and P-PCG composites using Zview.
ResistancePCGP-PCG
Re0.560.51
Rct0.120.08
Table 3. The temperature change with various charging and discharging currents.
Current (A)51015
Temperature T(K)
∆T_max6.7714.5025.37
∆T_min6.2913.4323.58
T_max-T_min0.481.071.79

