Article

A Wireless Sensors Network for Monitoring the Carasau Bread Manufacturing Process

1
Department of Electrical and Electronic Engineering, University of Cagliari, 09123 Cagliari, Italy
2
Department of Electrical, Electronic, Telecommunications Engineering, and Naval Architecture, University of Genoa, 16145 Genoa, Italy
3
National Institute for Astrophysics, Cagliari Astronomical Observatory, Via della Scienza 5, 09047 Selargius, Italy
*
Author to whom correspondence should be addressed.
Electronics 2019, 8(12), 1541; https://doi.org/10.3390/electronics8121541
Submission received: 30 September 2019 / Revised: 29 November 2019 / Accepted: 10 December 2019 / Published: 13 December 2019
(This article belongs to the Special Issue Application of Wireless Sensor Networks in Monitoring)

Abstract

:
This work copes with the design and implementation of a wireless sensors network architecture to automatically and continuously monitor, for the first time, the manufacturing process of Sardinian Carasau bread. The case of a traditional bakery company facing the challenge of the Food-Industry 4.0 competitiveness is investigated. The process was analyzed to identify the most relevant variables to be monitored during the product manufacturing. Then, a heterogeneous, multi-tier wireless sensors network was designed and realized to allow the real-time control and the data collection during the critical steps of dough production, sheeting, cutting and leavening. Commercial on-the-shelf and cost-effective integrated electronics were employed, making the proposed approach of interest for many practical cases. Finally, a user-friendly interface was provided to enhance the understanding, control and to favor the process monitoring. With the wireless senors network (WSN) we designed, it is possible to monitor environmental parameters (temperature, relative humidity, gas concentrations); cinematic quantities of the belts; and, through a dedicated image processing system, the morphological characteristics of the bread before the baking. The functioning of the WSN was demonstrated and a statistical analysis was performed on the variables monitored during different seasons.

1. Introduction

Industry is facing a new revolution and transition phase; i.e., the spreading of the so-called Industry 4.0 [1]. Industry 4.0 can be regarded as a complex, flexible system, which can improve the quality, efficiency and competitiveness in different sectors of industry [2]. This new economic and social paradigm manifests itself as the adoption of cyber-physical systems (CPS) to provide facilities for traceability and quality monitoring in industrial process [3]. Among the several sectors involved in this process, the most dynamic and relevant one is the agri-food production [4]. The new era of Agri-Food 4.0 is oriented towards automation, connectivity and digitalization in order to enhance systems’ efficiencies and productivity for meeting market competitiveness, while looking at the advantages offered by Internet-of-Things (IoT) solutions to meet sustainability (or waste reduction) criteria [2]. The food industry is managing critical changes related to consumer needs, to health and safety concerns and to the demand of food products which should be differentiated and high-quality [5]. However, the quality of these products can change suddenly during the production process; thus, leading to the need for ad hoc, reliable and real-time strategies to monitor the manufacturing process [5,6]. Therefore, to satisfy customer demands, the digital monitoring of the supply chain is required to provide a deep knowledge of the crucial production steps, in order to detect the weaknesses of and permit the optimization of the whole process, to reduce the maintenance difficulties and lower the costs [5,6]. Moreover, this digitalization trend in food industry can favor the automatic data collection, the lowering of paperwork and the enabling the development of real-time, robust feedback strategies [2]. Furthermore, the challenge of ensuring acceptable adoption costs of new information and communication technologies (ICT) by small and medium size activities calls for a reasonable and effective answers [4].
As a solution to these problems, the use of wireless senors networks (WSNs) was proposed [4]. WSNs are recognized as a relevant technology of the 21st century. A WSN can be defined as a low-cost platform which connects large networks of sensors [7,8,9]. They are systems which comprise radio-frequency (RF) transceivers, sensors, micro-controller or processor and power sources [5,6]. WSNs are a novel and interesting manifestation of the IoT technology [10,11,12]. With respect to the traditional wired sensors networks, the WSNs are low-cost and small size; have short deployment time; can include a higher number of sensors; ensure a robust digital transmission of the information, but also have an acceptable data rate [9,13]; and, finally, can be integrated with several different technologies and devices, such as micro electromechanical systems (MEMS) [6] or radiofrequency identification (RFID) technology [14,15]. MEMS and RFID sensors for several physical quantities such as pressure, temperature, humidity, acceleration and concentrations of chemicals and volatile compounds are currently available; thus, ensuring a multi-variable monitoring in the industrial process of interest [5,6,10,13,14,15]. WSNs can offer a more reliable and safe measuring process [6]. These advantages overcome the limitations, such as short battery lifespan, which can be enhanced using artificial neural networks (ANN) to optimize and rationalize the power usage [16,17].
Therefore, such enabling technology can be regarded as an user-centered infrastructure which can provide in situ, real-time and high-fidelity data [11,12]. WSNs are increasingly studied, while they are widely applied to several different technological and industrial fields; namely, structural health monitoring [9], machine-guidance, environmental monitoring [18], agro-industrial applications [6], machinery management, process control, food inspection and packaging [19,20]. The scenario of industrial WSN has unique features and issues. Indeed, the performances of industrial production are mainly related to technical components, monitoring and maintenance [13]. The opportunity of real-time, ubiquitous and smart sensing provided by a WNS can significantly increase the competitiveness and enhance the revenue, while permitting one to satisfy customer needs, reduce energy, limit waste production and rationalize water usage [13].
The application of WSN in Food-Industry 4.0 is still rare [2,5,6,21]. The first examples of WSNs in food production are related to the need for monitoring the minimum quality standards related to health concerns [21]. However, a WSN for the monitoring and control of the productive cycle of high-quality wine in a Sicilian winery was developed [5,22]. The nodes were set in the field and the cellar to control environmental parameters and the fermentation process [22]. In the case of a coffee factory, a multi-distributed and low-cost autonomous WSN was employed to minimize water losses [23] and to assess the product quality by monitoring the temperature during the fermentation process [24]. Additionally, the issue of waste management in food manufacturing is faced using WSN [25]. Recently, a three tier WSN was set-up to feed an ANN for the prediction and control of the manufacturing process in the pasta industry [3]. Bech et al. have demonstrated, for the case study of a Danish bakery company, that the robustness of the given existing production system can be significantly enhanced using sensors’ data [26].
From this discussion, WSN stands out as a powerful and valuable tool for production in the food industry. Therefore, the purpose of this paper is the design and implementation of a WSN to monitor the production of Carasau bread in a small-scale Sardinian bakery. To that end, a low cost, open hardware platform for multi-sensor measurements was developed [27]. The manufacturer case is a traditional and small-scale bakery in Fonni (NU, Sardinia, Italy). This type of industry is facing the challenge of supplying the market with high quality products to meet consumer needs, and therefore, the market trends impose a noticeable pressure on the existing manufacturing infrastructure [26,28]. Moreover, the demand from Italy and Europe for Sardinian bakery products is increasingly growing (73 million from 2002 to 2004) [28]. This is why the bread production has reached an impressive level of automation. However, the process has never been monitored and some of its aspects are still carried out in a manual way. Moreover, the amount of trimmings and waste has a great impact on the final product price and quality [28]. Only recently, a first-order hybrid Petri nets (FOHPNs) model investigated the possible yield improvements due to modifications in the industrial scenario of traditional bakery [29]. Therefore, to increase the overall levels of automation, ensure a high-quality product and increase the production, an engineering solution must be provided [28,30]; i.e., a smart WSN to monitor the process’s intermediates and enhance the implant yield. In this paper, the improved design, realization, deployment and functioning of a WSN for the monitoring of Carasau bread manufacturing are discussed [30].
In the following, an overview of the bakery production process is provided in Section 2. After having stressed the critical points and the aspects to be monitored, the architecture of the proposed WSN network is presented and discussed in Section 3. The physical implementation of the WSN, the network organization, the data management and the application are explained in detail in Section 4. Finally, the functioning and the results from the statistical analysis are presented in Section 5.

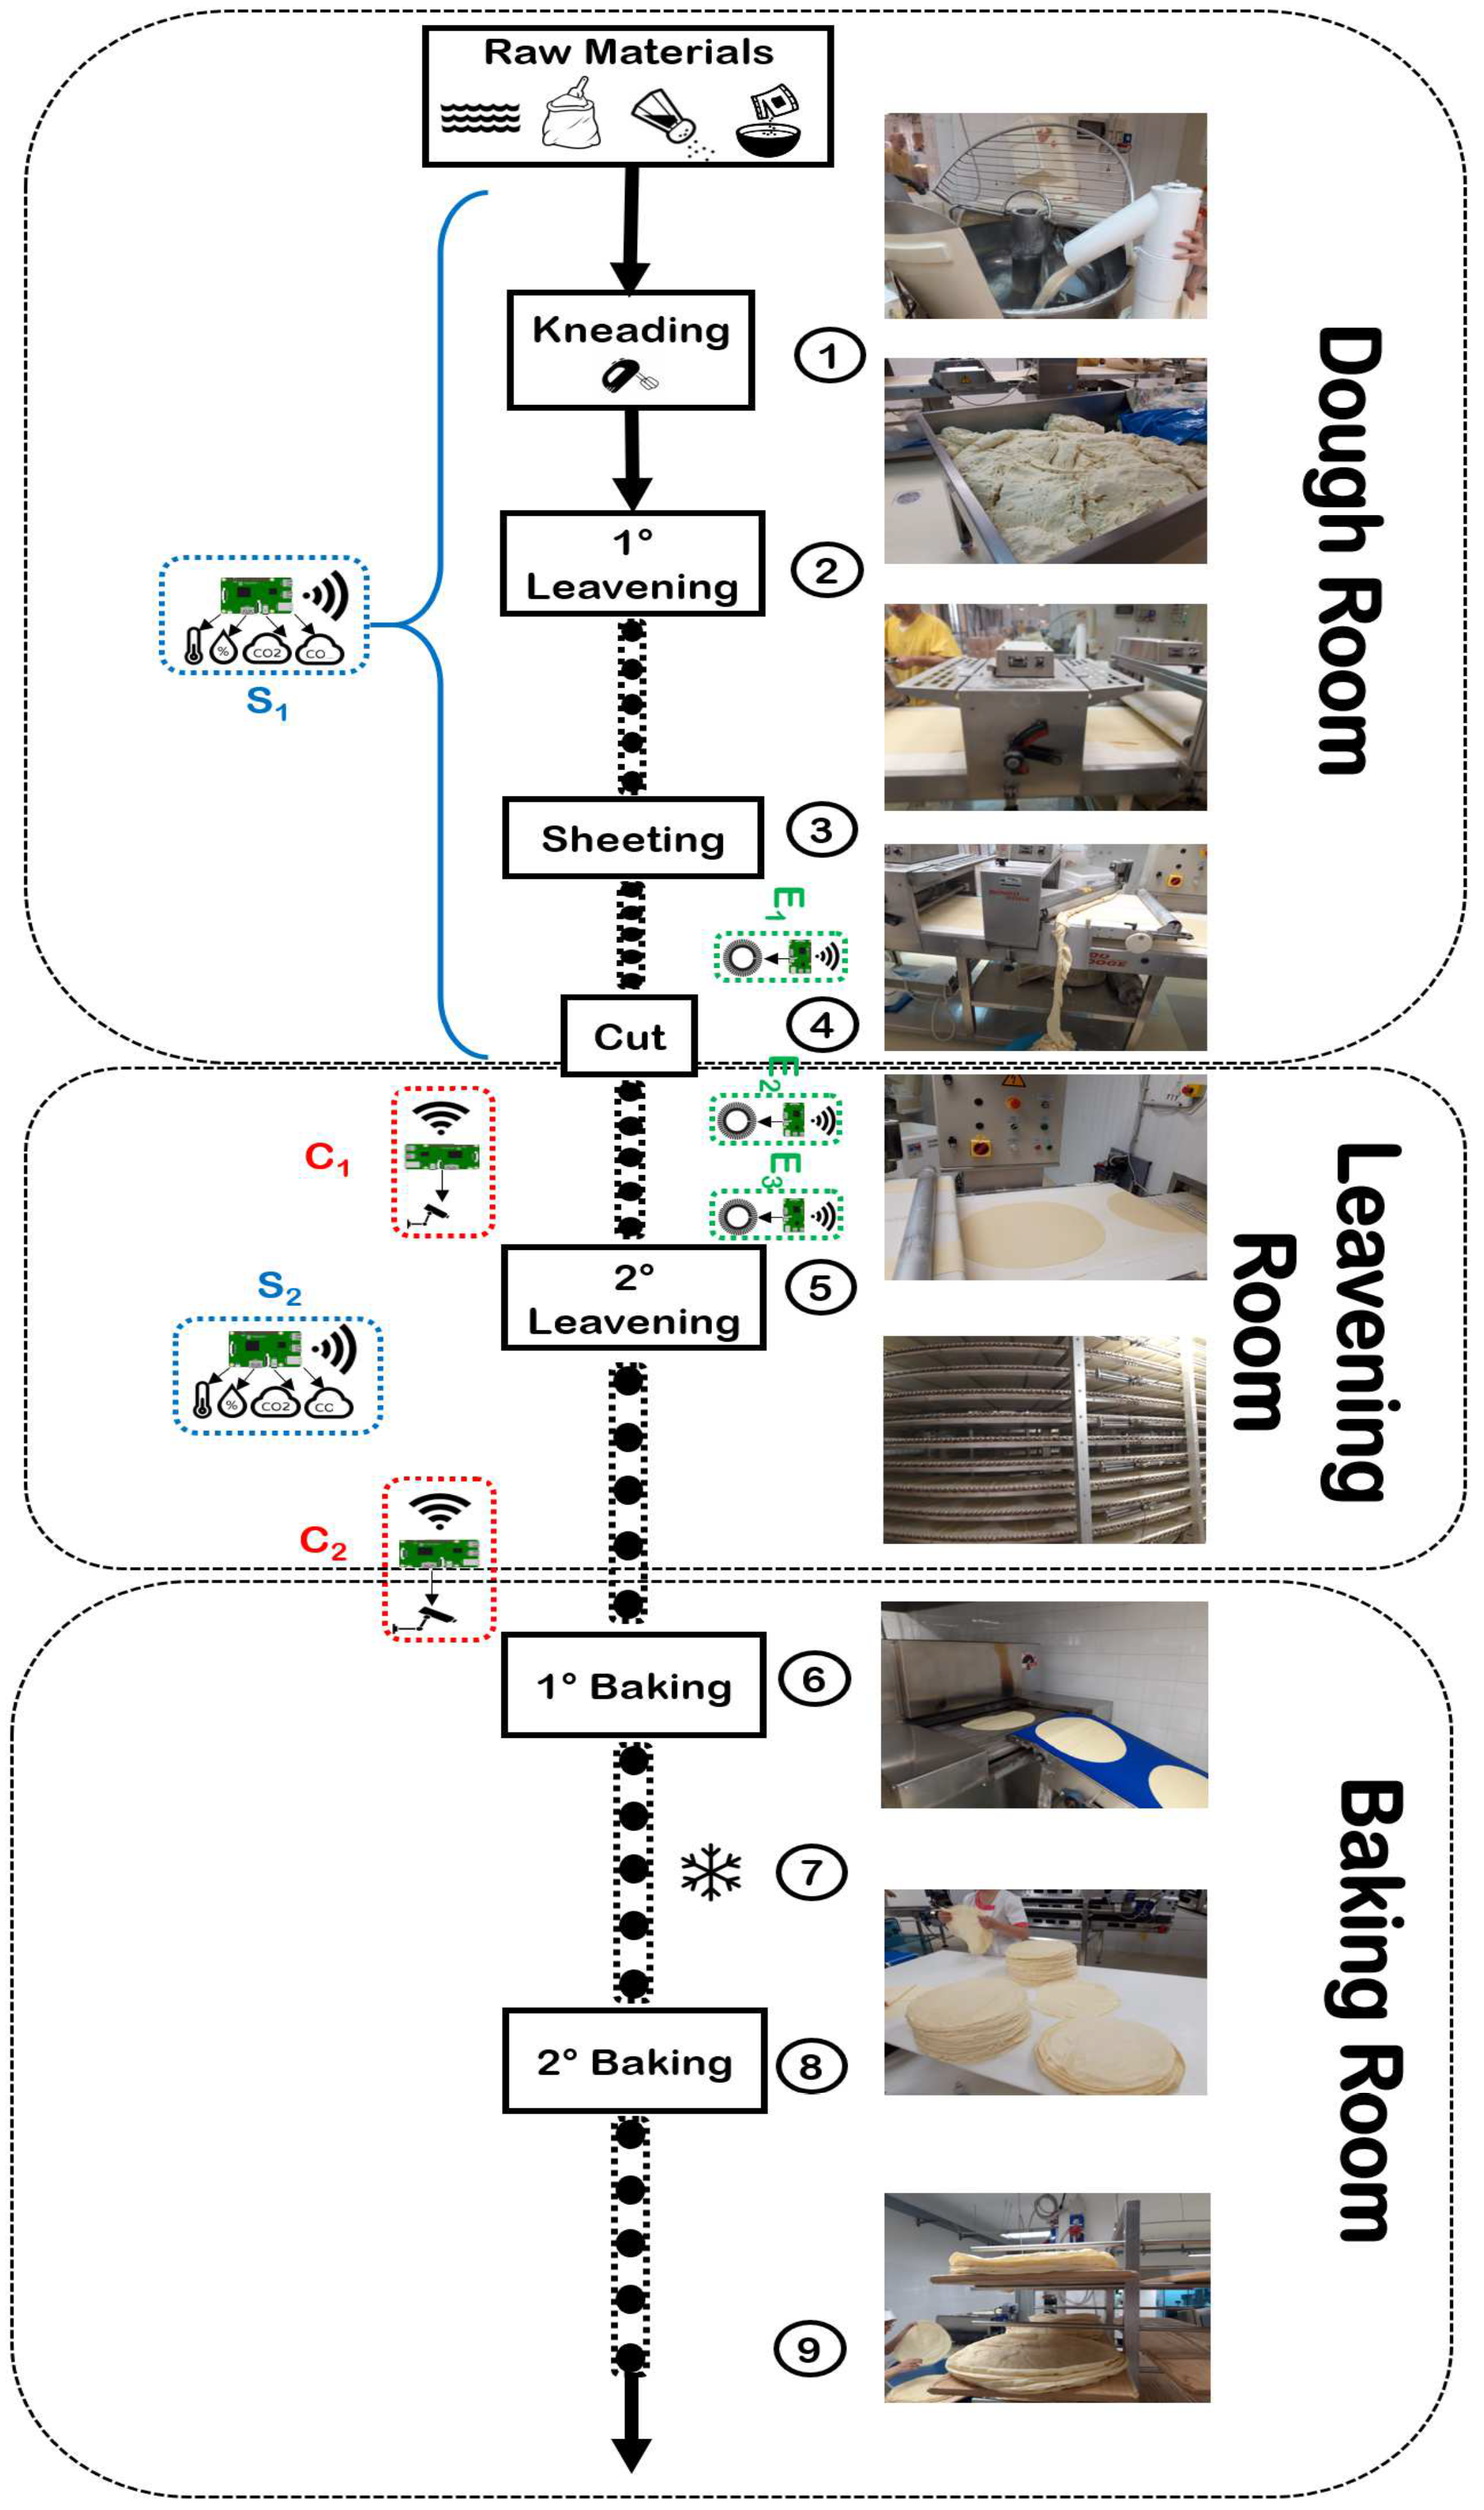
2. Monitoring the Carasau Bread Manufacturing

Carasau bread is a crisp, flat, circular bread, which can have a diameter of 18 cm to 45 cm; it is 0.7 to 1.0 mm thick and it can be stored for 4–6 months [28,30]. As represented in Figure 1, the manufacturing of Carasau bread can be briefly summarized as follows [28,29,30,31]:
  • The ingredients (i.e., water, yeast, durum wheat and salt) are mixed in a continuous dough mixer or kneading machine for about 20 min.
  • The dough undergoes a first and initial fermentation. During this step the temperature should be kept at 28–32 C for 30 min.
  • The dough is sheeted.
  • Then, the sheets are cut in disks of 18 or 36 cm of diameter by automatic machinery.
  • Moving on a conveyor belt, the disks are then transported to the leavening room for the second leavening for 40 min at 32 C.
  • Subsequently, the disks are baked, for few seconds, in a tunnel oven at the temperature of 560–580 C, which causes an immediate evaporation of water, with a loss of 2% of each disk’s weight, and inflation.
  • The disks are cooled, by natural convection, on a belt for 5–6 min. The cooled disks deflate and are positioned on a working desk to check, by visual inspection, if any creases or deformations are present. The disks are stacked in cluster of 5–6 crusts and cut along their edges by a cutting machine. Then, the puff pastries are manually separated in order to obtain two sheets.
  • The sheets are cooled for about 1 h at 4 C in a cold storage.
  • Finally, the sheets undergo a second baking for 15–20 s at 400 C and are then weighed, packed in plastic films and labeled for distribution and sale.
The work time can be divided into dough synthesis (about 20%), sheeting and cutting of the disks (circa 5%), leavening (about 60%, considering first and second steps), baking (about 5%) and separation (about 10%) [30]. In these phases, according to the operators, the critical steps are the dough synthesis and kneading, the sheeting and cutting and the leavening. In the literature it is established that the properties and quality of baked bread (e.g., crust thickness, height, volume increase and texture) are strictly related to the variations of temperature and moisture of the dough, and to the gases released during the leavening (e.g., CO and CO 2 ) [32,33,34]. The quality of the product is highly influenced by the dough properties [28,30,35]; i.e., the given, relative amounts of raw materials employed during the kneading (water, flour, salt and yeast, as in Step 1 in Figure 1).
For other types of bread, several optimization strategies were carried out to select the best kneading, leavening or baking parameters. These optimizations employed an extensive mathematical modeling, genetic algorithms or ANN [34,35,36,37,38,39]. Therefore, to the wealth of the Carasau bread manufacturing process, the industrial bread production must be supplied with an ICT, cost-effective tool capable of allowing a real-time, continuous monitoring of the main process parameters. This is why an industrial WSN was developed to permit the successive automation and digitalization of the system in Figure 1, while forecasting the enhancement of its efficiency and productivity; thus, meeting the actual market pressure and competitiveness [2,26,29,30].

3. The Wireless Sensors Network Architecture

Given the needs, issues and challenges of Food-Industry 4.0, and the peculiar context of the case study presented, in the following, the problem of designing the WSN is faced [10]. Moreover, it should be pointed out that the design space of WSN is complex and should meet the specific application requirements [40,41].
In general, a wireless sensors network architecture can be divided in different layers, typically, the sensing, the network, the service and the application Layer [25]. The sensing layer, where the data are acquired and digitized, is the set of physical and hardware elements which form the nodes of the WSN [5]. In a WSN scenario, a node in the network consists of a sensor acquisition board and a processor with a radio unit [6]. These nodes can transmit the information with a gateway unit to other computers and to the Internet (e.g., via WLAN) [6]. This is the network level [5,6,25]. The information is managed by the service layer and is finally reported as output to the user via graphic user interface (GUI) by the application layer [5,6,13,25].
In this framework, the fundamental requirements for an industrial WSN are [6,7,10,15,40,41,42]:
  • Be composed of small sensor nodes for high density deployment;
  • Be low cost and be affordable to small-medium sized industries;
  • Present a robust radio technology in order to ensure variable-link capacity with a suitable packet error rate to guarantee a continuous flow of elaborated data;
  • Have a flexible I/O for various sensors, in order to ensure high modularity;
  • Be resistant to harsh environments; e.g., to dirt, dust and humidity;
  • Use a flexible, open source development platform for portability;
  • Ensure a high quality-of-service (QoS); e.g., through an accurate and reliable time synchronization between nodes;
  • Have an energy-efficient processor to ensure long-lifetime;
  • Have an easy to use GUI;
  • Be scalable or allow a dynamic reconfiguration of network topology;
  • Be safe and secure; i.e., guarantee the integrity and the authentication of messages.
For the case of Carasau bread manufacturing in a traditional Sardinian bakery, a stationary, heterogeneous multi-tier architecture was selected. The concept is explained in Figure 2. At the sensing layer, the fixed sensor nodes consist of an embedded multi-chips type (i.e., the given sensors are mounted and integrated on an in-house board). As shown in Figure 1, three type of nodes are developed:
  • S 1 , S 2 : nodes for the monitoring of temperature, relative humidity, CO and CO 2 levels;
  • C 1 , C 2 : nodes equipped with optical cameras for the image processing system;
  • E 1 , E 2 , E 3 : encoders for the measurements of the cinematic parameters of the belt.
Each of these nodes directly communicate their data to a Raspberry Pi 3 B+ (Raspberry Pi, UK). This commercially available device was selected to act as a processing unit, which, at the same time, can work as sink node, store the information in a memory (see Figure 3) and elaborate the data. For each node a Raspberry unit was used, for a total of seven devices. Moreover, these units’ contemporaries serve as gateway units; thus, linking the sensing layer with the network and service layer, as shown in Figure 2. Indeed, the Raspberry units transmit via Wi-Fi, the data collected, to a server. To organize and manage the rather different type of data acquired, the open-source database Elasticsearch (Elasticsearch, US) was employed. At the network level, the data (.json format) are organized and made available to the application layer (Figure 2). Finally, using the free tool called Kibana (Elasticsearch, US), a GUI was developed to present the data to the user on different devices (e.g., computer, tablet or, possibly, a mobile phone).
In the following the specifications and details of each layers of the WSN architecture are provided.

4. The Sensing, Network, Service and Application Layers of the WSN

4.1. Parameters and Sensors

4.1.1. Process Parameters

As discussed in Section 1 and Section 2, in the bread baking industry there are several environmental and operative parameters which can influence the outcome of the process [34]. For any engineered and optimal decision making process, such as in the case of ANN trained for the kneading enhancing [36], the set of information to gather from the industrial workflow (see Figure 1) must be established by addressing the company and operators [26].
This task was performed in the preliminary part of the industrial project “UniCarasau”, and hence, technicians, engineers and data analysts converged on the information derived from the experts [2]. From the discussion in Section 2, the dough production, the kneading, the following sheeting and the leavenings are the most critical steps for the quality of the product. Therefore, implanting a WSN to monitor these phases is supposed to avoid errors at these initial step, but, also, to lower the trimmings and amount of waste, while enhancing the yield, probably allowing for a maximization [29]. The dough is a mixture of flour, water, yeast and salt [28]. The kneading should occur at temperature between 24 and 27 C, for 20 min, with an amount of water strictly specified by the baking recipe. From this discussion, the first two parameters which must be measured and controlled are temperature and relative humidity in the preparation room. During the kneading, the fermentation process occurs; therefore, CO and CO 2 levels must be monitored to detect if anomalous events are occurring [43]. The literature on automatic systems for controlling fermentation based on wireless sensors is mostly focused on wine and coffee [23,24]. Hence, the main four parameters are dough temperature, humidity content and CO and CO 2 concentrations in air. Since the aim of this paper was to improve the bakery plant’s production, it was decided to evaluate the outcome of the fermentation relying on the geometry of the sourdough, which was acquired by an optical camera; and, to develop an intelligent feedback strategy, the speed of the conveyor belt was measured: it could be increased or decreased to adjust the processing steps.

4.1.2. The Sensing Layer: Hardware Platforms

As regards the sensing layer, three types of nodes were designed. Firstly, the following environmental parameters, relevant to the bread process and quality, were monitored and the following commercial sensors were employed:
  • Temperature: the DS18B20 (AZDelivery, Deggendorf, De) temperature sensor was chosen for its accuracy (±0.1 C) and for the ease of connection with platforms such as Arduino or Raspberry. Prior to this project, only the initial temperature of the dough was measured by a manual, discontinuous and off-line test. One operator was in control of mixing the dough and had a proprietary recipe defining guidelines for the temperature of the dough. However, the manually measured values varied from 4 C to 7 C regardless of the ambient temperature in the factory. Therefore, an alternative, more reliable and accurate monitoring strategy must be provided.
  • Relative humidity: the SHT10 (Sensirion, Switzerland) low-cost, digital and capacitive humidity sensor was employed to quantify the relative water content in air during the dough preparation, kneading, sheeting, cutting and leavening (as shown in Figure 1). The sensor is contained in the SLHT5 (SONBEST, China) component. The sensor has a 3% accuracy and a ±1.8% precision. As discussed in Section 2, the monitoring of the humidity can help in discriminating the correct water usage for a suitable and sustainable productivity [22,23]. Previously the DHT22 (Adafruit, US) sensor was employed [30]. However, this device could not withstand the harsh environment of the leavening room and was substituted.
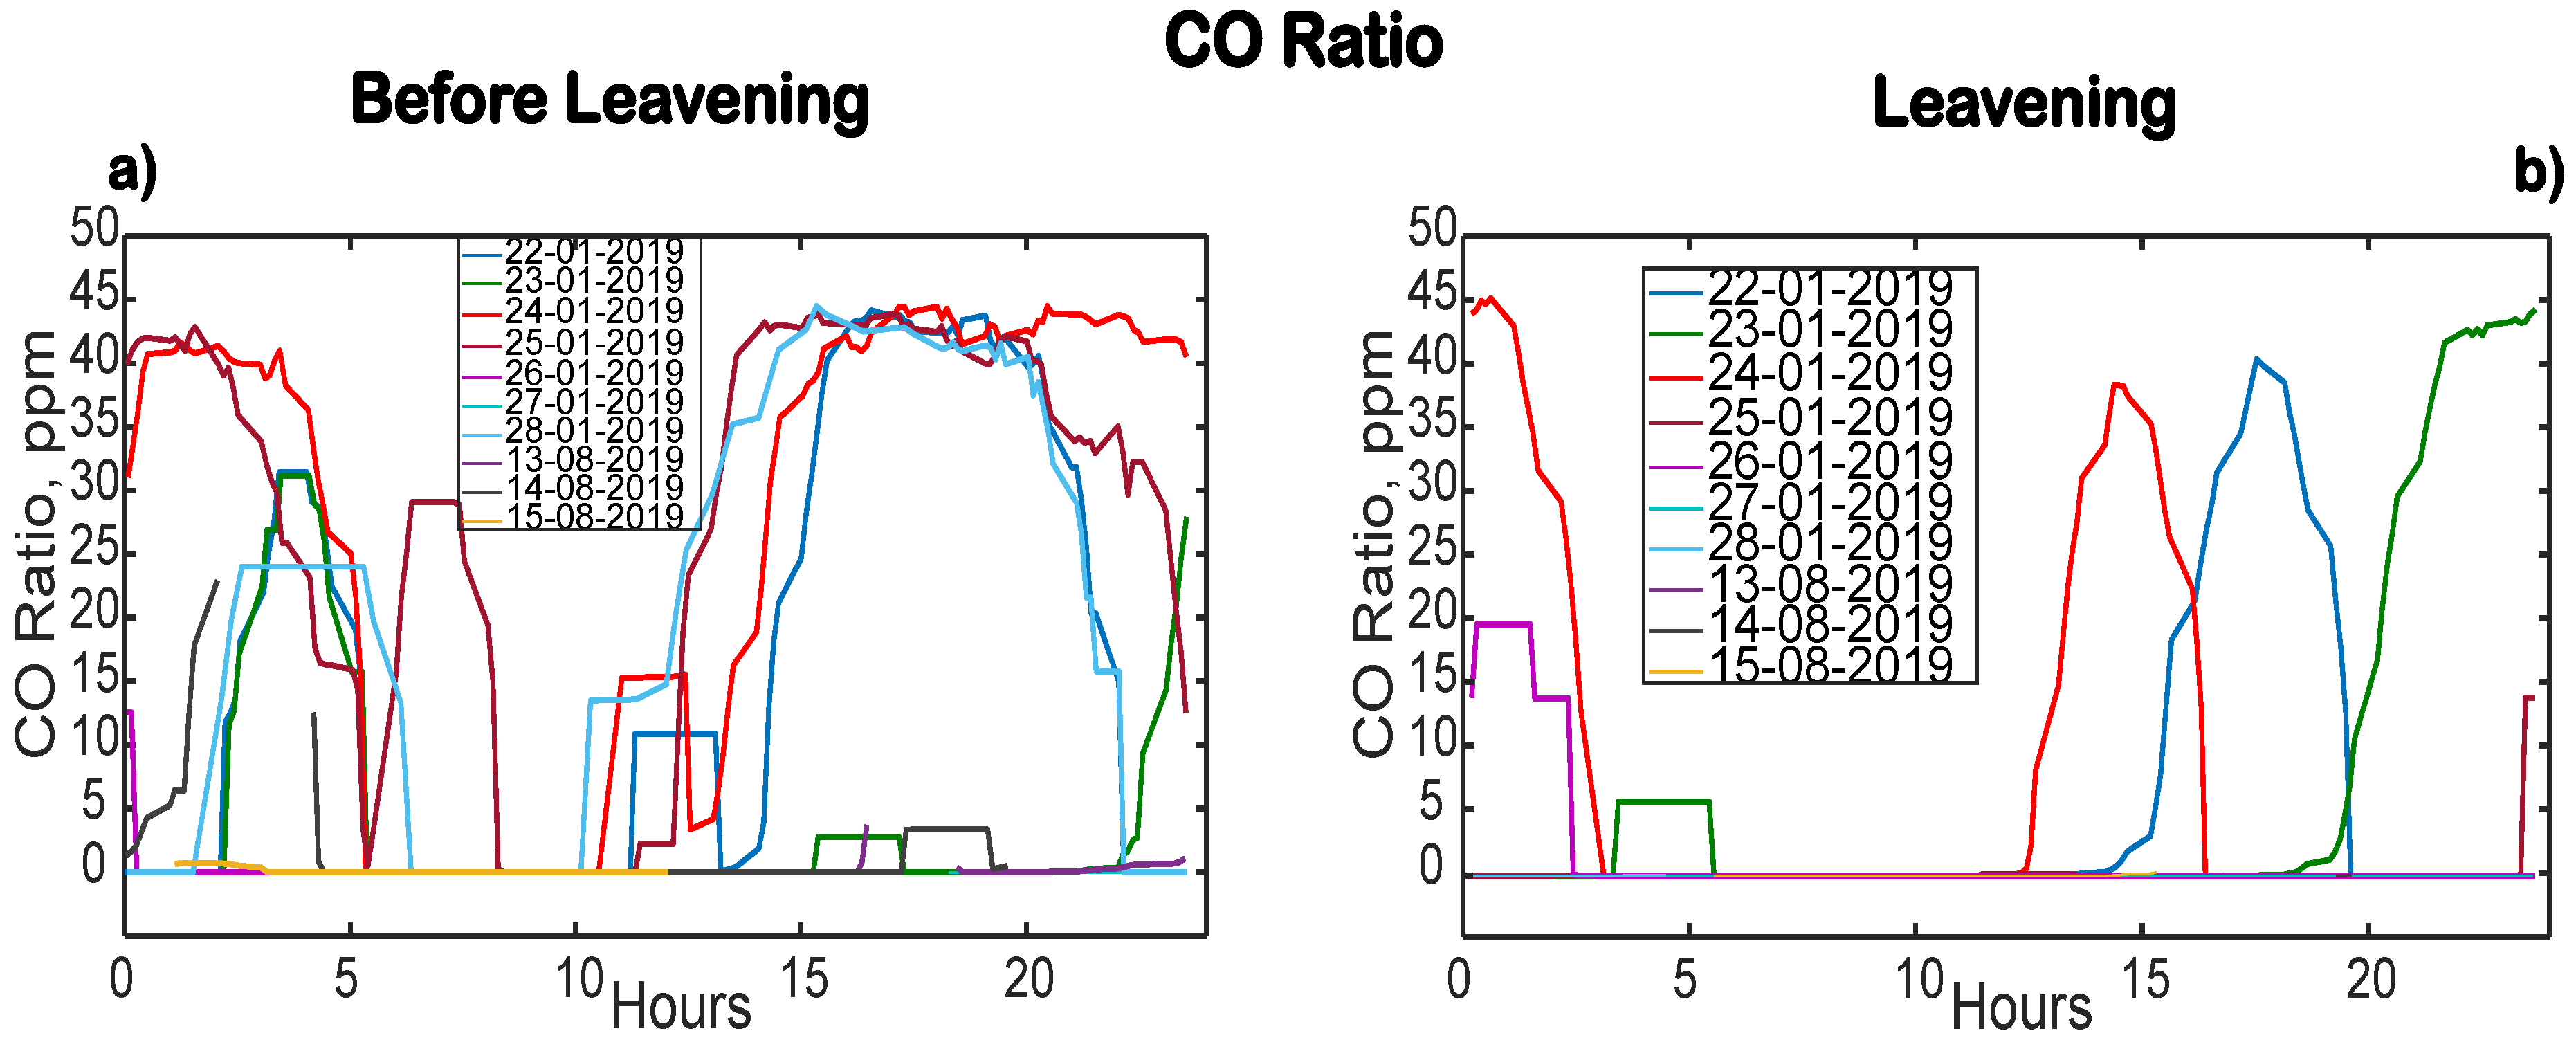
  • CO sensor: the MQ-7 from SparkFun Electronics (US) was selected to quantify CO-gas concentrations in air from 20 ppm to 2000 ppm. The analog signal is converted using a 10-bit ADC (MCP3008, Microchip Technology Inc.). During the leavening this gas can arise in different concentrations, being possibly related to the correct bread production [32,33,34,43]. Moreover, carbon monoxide is known to be a colorless, odorless, insipid and very toxic gas [23]. This gas can replace the oxygen in the hemoglobin, is extremely dangerous and causes what is commonly called the “sweet death” [23]. The limit value set by the regulation is 500 ppm [23]. The concentration of this species is continuously monitored for quality and safety reasons.
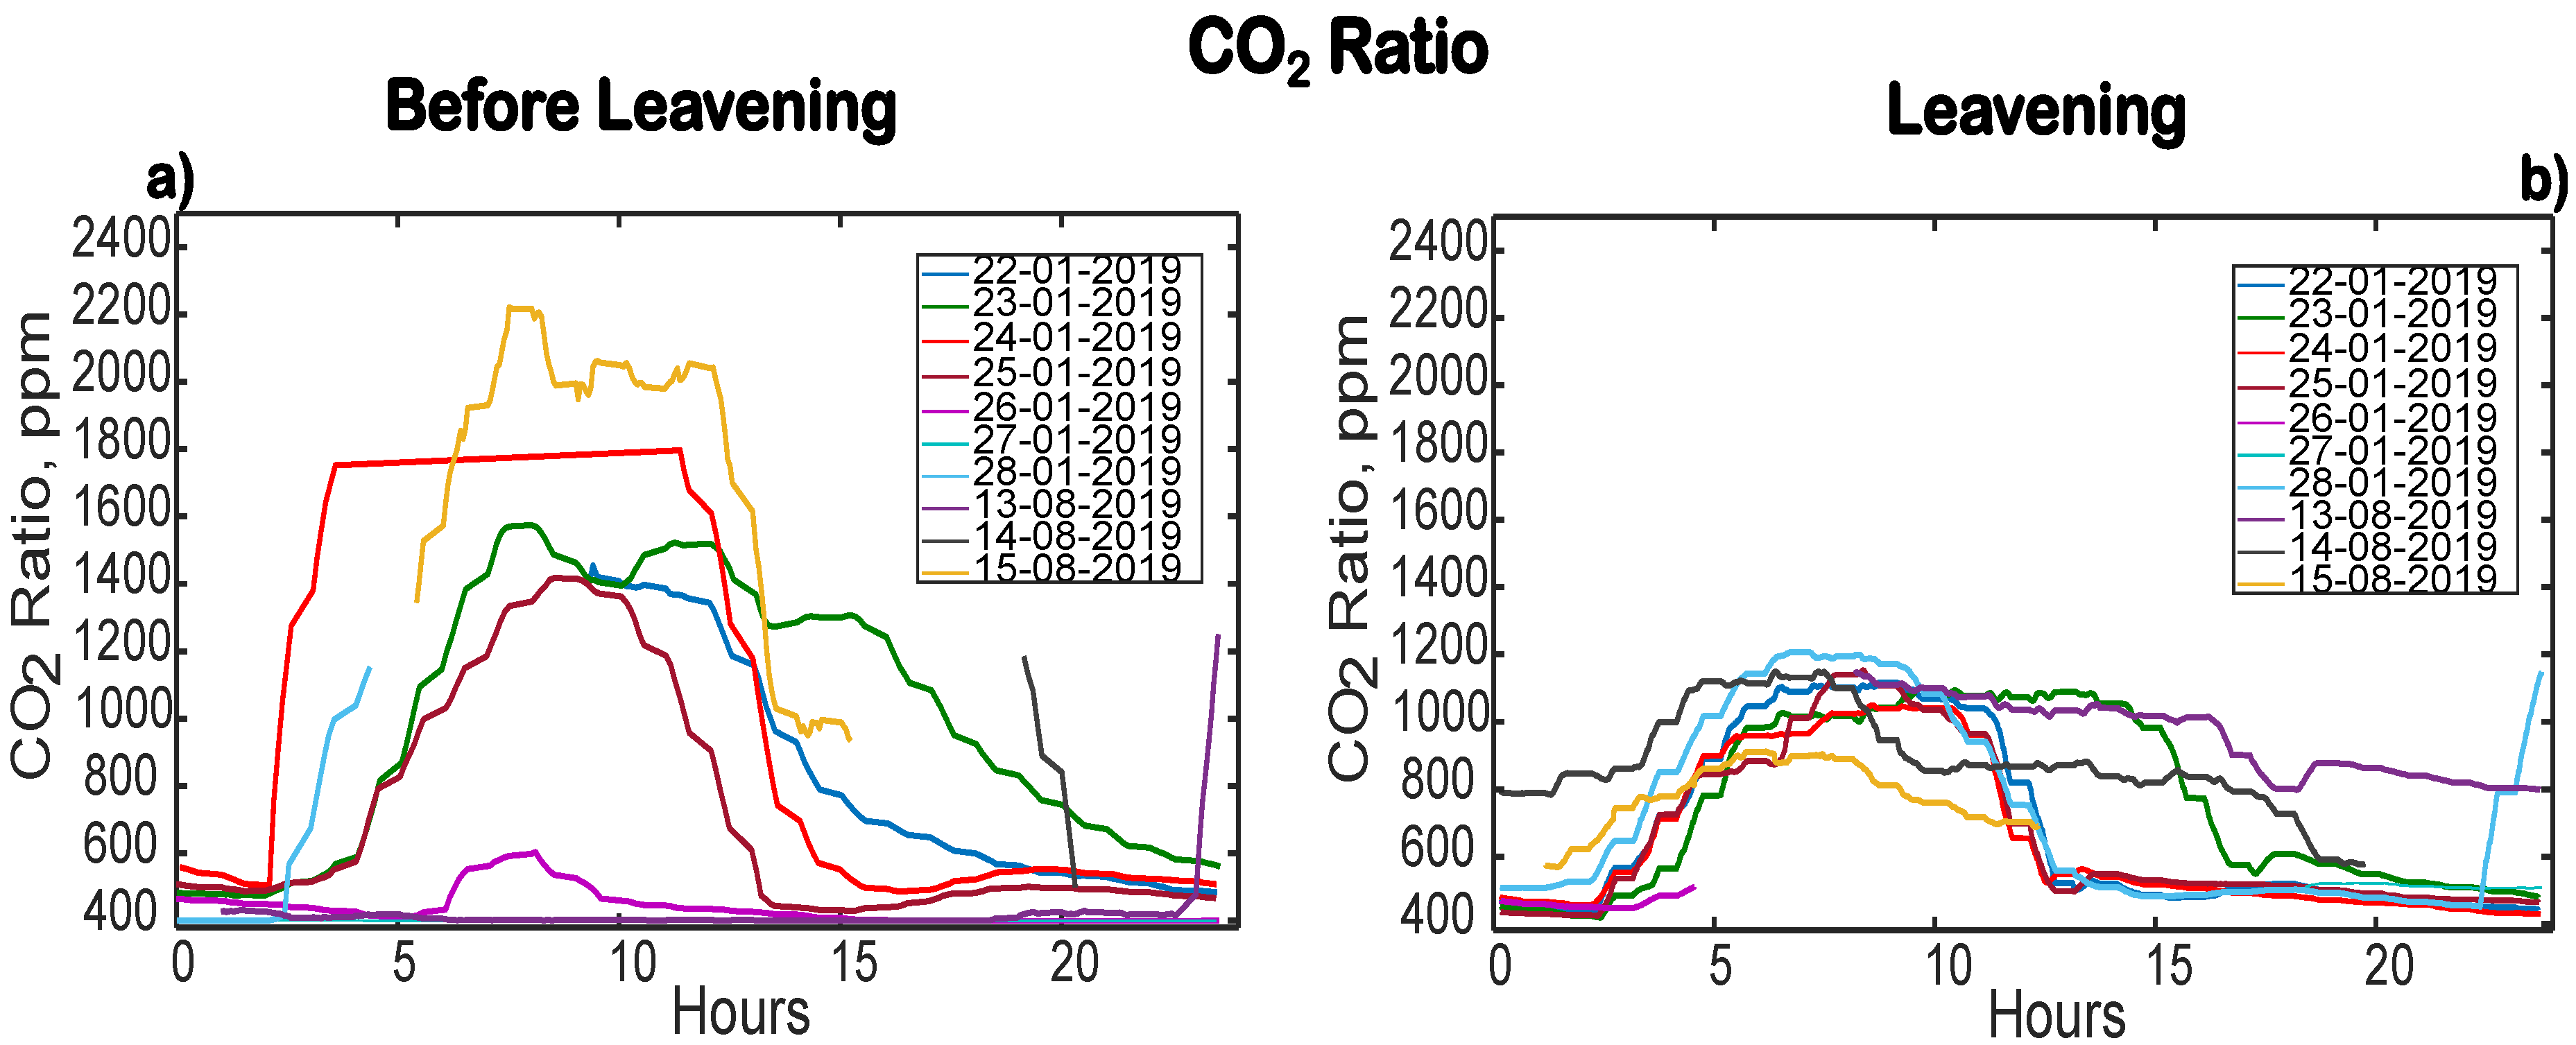
  • CO 2 sensor: the carbon dioxide released during the two leavening steps was measured using the infrared sensor MHZ19 (Winsen Ltd, China). It possess a ±50 ppm accuracy. During the drying and baking, other gases are released in the air; e.g., CO 2 , O 2 , CO x and several volatile organic compounds (VOCs) can be released [23]. The main targets for this study were CO and CO 2 .
The environmental parameters are measured by combining and integrating all these sensors in a dedicated printed circuit board (PCB). The acquired data are all digital and can be easily handled by the Raspberry unit. The PCB is equipped with a logical level converter 5–3.3 V. The boards are designed using Eagle Autodesk (EDA Solutions, UK). Two identical boards were manufactured using FR4 board and employing the LPKF Protomat C100 HF (Germany) prototyping machine and cutter. A prototype of the realized board is shown in Figure 3. These boards are the nodes S 1 and S 2 in Figure 1. Each board is connected to a dedicated Raspberry unit, and thus integrated in the WSN.
As previously discussed in Section 3, the second type of nodes (E 1 , E 2 and E 3 ) are dedicated to the monitoring of the conveyor belt velocities. Therefore, the translational velocity of the belt (and the bread, in a local reference system), after the sheeting, and the rotational velocity of the belts before sheeting and after cutting are measured. These three kinematic parameters can be tuned to regulate the shape and height of the disks (see Figure 1). Three incremental encoders, DBV50-22ALA2500 Core (Sick, IT), were employed. The devices uses 2500 pulses, with a ratio of 12.5 pulses·mm 1 , allowing one to measure ±18 per pulse; i.e., circa ±4 mm/m, referred to the measuring circle. For the encoders, two different boards were manufactured, as shown in Figure 3.
Finally, the nodes C 1 and C 2 , respectively, were deployed at the entrance and at the exit of the leavening room, as shown in Figure 1, to evaluate and quantify some morphological parameters, along with color and textural information of the bread disks. To that end, two optical cameras Raspberry Pi Official Camera Vs, with 8 Mp of resolution and a frame rate of 30 Hz, were employed to monitor the disks after the cutting and the second leavening stage (see Figure 1). These cameras did not require the design and realization of a dedicated board, since the connection to the Raspberry units was immediate.
Low-cost and open-hardware solutions were employed for the sensing layer of the proposed WSN. In total, seven Raspberry Pi units were employed, one for each node.

4.2. Data Elaboration

The data from the seven nodes were collected in a time-span of one week during January 2019 to assess and evaluate the functioning of the WSN, while conducting preliminary elaboration and analysis on the data, similarly to [26].

4.2.1. Image Processing System

In a way similar to [3], the software module developed for the case industry includes an image processing system capable of extracting a number of quantitative parameters to identify eventual defects, allowing us to establish a causal relationship between the initial dough composition, the bread morphology and the final product quality [39].
The defects and unwanted shapes of Carasau bread due to inadequate processing parameters are quantities monitored by the two optical cameras (C 1 , C 2 in Figure 1, or see Section 4.1.2) which were deployed after the disk sheeting and cutting and set after the second leavening step, as shown in Figure 1. The estimation of the morphological and textural characteristics of the disks before and after the leaving is carried out following the processing steps summarized in Figure 4. Firstly, the optical images acquired by the Raspberry cameras (.jpeg format, 1024 × 768) are sent to the server by the web service of the Raspberry units (see network layer in Figure 2). A Python application carries out two processing steps, as reported in Figure 4. The original and processed images are saved to an on-line storage system, whereas the processing of the results are saved in the Elasticsearch database.
A reference situation for a given disk is defined before the leavening. The background (i.e., the belt and its surrounding region) is first subtracted to reduce the image noise [44]. Then, the image is cropped to the area of interest containing the dough disks. After a thresholding step using Otsu method [45], the image is segmented and the geometrical parameters are extracted [39,46]. An example of the elaboration steps for the disks entering the leavening room is reported in Figure 4a. In particular, the bread disks are treated as ellipses, in order to assess the deviations from the ideal circular shape. Indeed, the major and minor axes (in pixels) of the ellipse, and the eccentricity, orientation, the roundness, compactness, solidity and convexity of the ellipse, are derived. Moreover, a 256-bit RGB histogram and the local binary pattern (LBP) descriptor are extracted from the segmented bread disk image to characterize, respectively, color and texture information [47].
Since the structure and type of belt at the exit of the leavening room is rather different from the conveyor belt at its entrance, the processing steps for the images related to this stage are rather different. Indeed, since the belt is highly textured, with a non-uniform pattern on its surface, the elaboration is adapted for this case, as shown in the examples of Figure 4b. In a way different from the previous case, the image is firstly cropped; then, thresholded; and finally, the morphological operators for dilation and erosion are applied (3 × 3 cross element) to extract the same aforementioned geometrical, texture and color parameters. In this way it is possible to perform a direct and quantitative comparison of the possible effects of leavening.
For the aforementioned purposes, the C/C++ library OPENCV (http://opencv.org) was used. The commands were wrapped in Python and the actual elaborations were performed by the processing unit of the two different Raspberry Pis. A small subset of images during one of the monitored working days was analyzed in this work.

4.2.2. Statistical Analysis

The statistical toolbox of Matlab 2019b (The Mathworks Inc., USA) was used to compute the basic statistics, including the means and standard deviations of the temperature, humidity and the CO and CO 2 concentrations [24]. Moreover, a Mann–Whitney U test was performed between several process variables at different manufacturing stages for all days of interest (see Figure 4), in a way similar to [13]. The Mann–Whitney U test is the non-parametric equivalent of the Student’s t test for any variables distributed in a non-normal, non-Gaussian way. The test evaluates the differences between the data of two sets. The differences are sorted counted, taking into account the sign, and compared to the reference tables, in order to assess the level of significance. In this way the final p-value was computed. If the p-value was below the significance threshold (typically set to 0.05, as done in this work), then a statistical relationship between the test variables existed. For further details about the Mann–Whitney U test, see Chapter 6 of [48].
The statistical relationships between the initial ambient temperature measured during dough production, kneading and first leavening, and the temperatures further along the process chain were investigated for each day. The Mann-Whitney U test was performed on the relative humidity, CO and CO 2 signals at these two stages.

4.3. The Network Layer

Given the requirements for the WSN design (see Section 3) and as discussed in Section 4.1.2, the wireless sensors network was designed and developed using low-cost and open-hardware platforms to be a cost-effective solution for the monitoring of industrial applications [27], such as, in this case, the Carasau bread manufacturing. Despite the type and number of sensors, the advantage of using Raspberry Pi is due to the large access to available libraries (thanks to the open hardware philosophy), but also to the concept of open source software, which aims to provide a free access to hardware design, projects and code. This allows one to customize and upgrade the WSN system if required, permitting the company in question to develop alternative strategies if required [27].
The choice of the Raspberry Pi was due to the comparison with other devices, such as Arduino modules [49]. Indeed, the Raspberry Pi 3 B+ (Raspberry Pi, UK) has a 64-bit and 1.4 GHz processor (versus 16 MHz) and a high number of GPIO, UART and IPQ ports, which makes this commercially available system a cost-effective solution for the core of a general-purpose node [50]. Furthermore, pointing out that it is possible to create a WSN using Wi-Fi [5], in this work the native Wi-Fi module of the Raspberry units was exploited to link the nodes and to transfer the data. In this way the Raspberry was exploited as a gateway unit, as shown in Figure 3.
This technology allows a suitable communication range, i.e., about 20 m in an indoor environment, with a high data transmission rate in the order of 2–54 Mbps (2.4 GHz, ISM band, IEEE 802.11b standard) [5,6,13].
The Wi-Fi network (i.e., the wireless local area network (WLAN)) of the bakery industry was employed. In this way, the data could be transferred with an average rate of about 28 Mbps while allowing functionality within a circle of 10 m from the each Raspberry. These features are sufficient for the case under analysis [13]. The Wi-Fi standard was selected because other wireless technologies such as ZigBee, present low and scarce performance, e.g., very low data rate and operating distances (less than a 1 Mbps in 1m) [5,6,13]. The data-stream of the images acquired by nodes C 1 and C 2 in Figure 1 requires a higher transfer rate. Alternatively, the information must be elaborated to thoroughly reduce the dimensionality of the problem [51]. It is worth stressing the fact that the effect of the air temperature and humidity on the wireless communications can be relevant during the transmission, as found in [23]. Therefore, in the leavening room, where the relative humidity is significantly higher, a Wi-Fi repeater was deployed. Thanks to this preventive solution, no problem occurred during the data transission.
Therefore, the Raspberry sends the collected data (e.g., temperature, relative humidity, gas concentrations, cinematic parameter and bread images) to a server (see Figure 3). The data are organized in a database using the open-source software Elasticsearch (Elasticsearch, US). The files are converted and stored in the “.json” format. The database acts as coordinator between the seven different gateways, which are labeled (see Figure 5) and sorted according to the time-stamp assigned by a unique web-service of the Raspberry software. This allows one to synchronize the acquisition while rationalizing and discriminating their provenience (i.e., perform the node identification). With this rules the log files are created.

4.4. The Application Layer

As presented in Figure 2, the data collected and managed by the Elasticsearch database are then presented to the user, exploiting the open-source tool Kibana version 6.4.0 (Elasticsearch, US). The use of a GUI is a real and underestimated need. The fast digitalization trend of Industry 4.0 must cope with the fact that, firstly, some basic in-house competencies may be lacking; e.g., installing the setup of sensors or structuring/interrogating a database with a big amount of data [26]. Furthermore, the post-processing and statistical elaboration for the heterogeneous ensemble of information derived from the WSN is not trivial [51]. This is why a simple, but rather effective open-source tool can be used to inform the stakeholders about the monitored parameters, while informing them about statistics or detected events.

5. Results

In order to test different parameters of the WSN platform, the deployment was carried out in a series of tests. Firstly, the prototypes of the designed boards were test on a breadboard in our laboratory [30]. After having assessed the correct functioning of the dedicated PCBs shown in Figure 3, the integration and working with the Raspberry unit was verified. The data transfer, management and visualization was assessed [30].
Given these preliminary, but successful, laboratory tests, the nodes were deployed in the traditional Sardinian bakery, as shown in Figure 1. The system was employed to monitor the bread manufacturing process from January and August 2019. The measurements acquired by the nodes S 1 and S 2 are shown in Figure 6, Figure 7, Figure 8 and Figure 9. It can be noticed that during the dough preparation, kneading, sheeting and cutting, the patterns of the four physical quantities may appear very similar across the working days (Figure 6, Figure 7, Figure 8 and Figure 9), in both the kneading and the leavening room. However, comparing each monitored variable, some interesting differences and features can be noticed. In particular, as regards the air temperature, it can be noticed that the average daily values is 19.32 ± 1.033 C from Figure 6a. There was a 16.67% variation between the temperature levels recorded in August and January. It should be pointed out that the temperature during the kneading and first leavening is far from the recommended value of 28 C. From the data shown in Figure 6b it is evident that the average temperature in the leavening room is higher; i.e., 28.62 ± 1.74 C (about the 32% higher). Differently from the previous case, the temperature values in this step of the process are closer to the prescribed value of 32 C (see Section 2) for almost every day of processing, expect for the 27/01/2019, when the plant did not work. It is worth noting that during some days, some curves were interrupted suddenly. This was due to the fact that the plant’s operations were stopped. From the data collected with the WSN, it is possible to infer that the temperature in the kneading and the leavening rooms can be potential sources of errors in the bread manufacturing process. Moving from these findings, a suitable control strategy for the temperature could be devised in future.
Different considerations hold for the relative humidity data from Figure 7. In the kneading room (Figure 7a), the humidity curves show a lower onset time and areas under curves smaller than those measured in the leavening room (Figure 7b). The average value of relative humidity in the kneading room is 59.98% ± 6.10%, whilst in the leavening room it is 61.26% ± 12.82%. The average humidity values during these phases are about the 50% higher than the prescribed level. Hence, during the crucial phase of second leavening, the standard deviation of water content in air, across days, is two times higher than the value calculated for the initial steps of the process. Provided that the mean values are similar, it should be stressed that during the leavening the behavior of this physical quantity is more variable. Further analyses are required to assess if and in which measure this variation could be significant. However, from the process point of view, the analysis of the WSN data has already allowed to identify another possible cause of interference and disturbance in the bread manufacturing.
The designed WSN nodes S1 and S2 were equipped with sensors to monitor the release of CO and CO 2 during the first and second leavening. The CO curves in Figure 8, recorded during different days, in January and August, present very different values (30.42 ppm ± 8.43 ppm versus 9.29 ppm ± 5.33 ppm) and their the patterns are rather different. Indeed, the dynamic of the CO during kneading, first leavening, sheeting and cutting can be approximated to a square-wave like envelope (Figure 8a), whilst, during the second leavening in the dedicated room, this gas was released for shorter time and the curves present a gaussian-like trend with a narrow variation (Figure 8b). These differences may be a starting point to further analyzing and investigating the physics of Carasau bread production.
With respect to the CO2 signals, from Figure 8 clear differences can be observed between the two ambients of the plant and stages of the process. In particular, during the leavening, the daily average is 620.26 ppm ± 189.39 ppm, whilst, before, the CO 2 varies around the value of 813.257 ppm, considering a standard deviation of ± 232.74 ppm across the different days of monitoring. Furthermore, when observing the CO 2 signal, in Figure 9a, it is possible to track the interval of activity of the company. Of course this signal arises by two sources: the humans and the dough/bread. The separation of the contribution is not trivial, but it may be an interesting point to investigate in order to gain further knowledge about the first leavening and its final impact in the product quality.
This very simple analysis indicates that in the two processing stages it could be a statistically significant difference. This is why the data collected by the WSN were further analyzed performing the Mann–Whitney U test. When analyzing the quantities in the kneading room and the leavening room during each day of monitoring (during January and August), it is possible to notice in Table 1 that two strongly significant parameters are temperature and CO concentration between the two processing stages. The temperature between the two manufacturing stages stands out as a distinct feature. This is due to the average difference of about 54% in the air temperatures shown in Figure 6a,b. From these findings it is possible to infer that the temperature can be one of the most relevant parameters in the development of an optimized decision process or for any machine learning approach to investigate, as confirmed by [28,29,30,32,33,34,36,37,38,39,43]. The role of CO concentration in the process needs to be clarified, and, probably, integrated with other physical measurements, such as the rheological characteristics and/or the dielectric properties of the dough [52,53,54].
However, we deepened the statistical analysis and considered if, for all days of monitoring, the statistically significant relationship between the dynamic of the four variables in the kneading and the leavening room was confirmed. As can be noticed in Table 2, the temperature and the CO concentration are two very relevant variables. However, despite what emerged from Figure 6, Figure 7, Figure 8 and Figure 9, the p-values for the relative humidity and CO 2 levels were still below the significance threshold. Hence, the selection of the features which characterize the bread manufacturing process should be further refined.
More than just these findings would be integrated with the information collected with the other nodes. Indeed, together with the signals derived from nodes S 1 and S 2 , the data gathered by the nodes C 1 , C 2 can be exploited in a predictive model of the process [29].
A list of the features derived from the optical images (i.e., morphological and texture parameters) before and after the leavening are shown in Table 3. A relatively wide variation of each geometric feature in each monitored phase can be observed. In particular, the solidity, the rotation angle, the major and minor axes are the most variable parameters. The variations of these three morphological quantities is about ten times smaller for the disks which come from the leavening room. Furthermore, it is possible to notice a few percent of a difference between the average values of the features across the two stages in Table 3. However, when performing a Mann–Whitney U test on these data, all the features present a statistically significant (p < 0.05) relationship. Since the morphological parameters of the disks are strictly related to the final bread quality, this investigation allows one to establish a route to identify and track the distinctive aspects of the process outcomes in a quantitative way. However, the problem of how to link and relate the quantities derived from the images with the monitored variables is still an open issue.
All these findings suggest that quantifiable differences between the processing parameters exist during the manufacturing process, even for different days. Therefore, the WSN designed for the monitoring of Carasau bread monitoring is a suitable engineering tool for the real-time, continuous monitoring of this peculiar process of food industry. Moreover, the deployed system can serve as a powerful instrument capable of driving a more sophisticated and rigorous analysis, gaining a deep knowledge about the bread manufacturing and optimizing the productive process in order to allow the case company to face the challenges of Food-Industry 4.0.

6. Conclusions

This work dealt with the design, functioning and characterization of a WSN to allow, for the first time, the real-time monitoring of the processing parameters of the Carasau bread manufacturing. On-the-shelf, low-cost and open hardware electronics were employed for both the heterogeneous nodes and network implementation. This choice is cost-effective and permitted to set-up a multi-tier WSN in a small, traditional bakery industry which is facing the pressure of market and of the Food-Industry 4.0 trend [2,26]. Furthermore, the low-to-moderate cost of investments for the proposed WSN (e.g., sensors, installation, documentation and connection to a database; development of the interface) can be assumed to be repaid by a future benefits of improved processing parameters, enhanced product quality and fewer production stops, with reduced product waste [26]. The single nodes were constructed using a Raspberry Pi as the processing unit, temporary storage and gateway. The data, acquired in different points of the plant and collected at different stages of the process, are transmitted to a dedicated server using Wi-Fi. The open source database Elasticsearch is employed to manage and organize the data coming from the different nodes. Finally, the information gathered during the processing steps of kneading, sheeting, cutting and leavening are made available to the user via a GUI developed using Kibana. This engineering strategy, empowering the in house competences of the company in question [26], can lead to the enhancement of bread production of a small-scale traditional Sardinian bakery industry.
This study, developed under the umbrella of the “UniCarasau” research industry project, could be a starting point for further advances in the monitoring of the food industry, especially bakeries. Moreover, the proposed WSN can be an interesting solution applicable to several other industrial scenarios and in many installations worldwide. However, given this simple WSN architecture, to satisfy the need of the case company of an optimized manufacturing process, the huge amount of data collected should be integrated in a mathematical model which can correct and act on the industrial production with a direct and real-time feedback loop [29].
However, from the critical aspects and open issues discussed in this paper, the proposed WSN can be improved by relying on a standardization, which, unfortunately, is still lacking, in a general sense [6,55]. Moreover, the security aspects need to be carefully investigated [7,10].

Author Contributions

Conceptualization, A.F., G.F., T.P. and G.M.; hardware design and realization: A.M.; software, M.B. and P.T.; validation, M.B., A.M., P.T., C.D. and M.B.L.; statistical analysis, A.M., C.D. and M.B.L.; data curation, M.B., A.M. and M.S.; writing—original draft preparation, M.B.L.; writing—review and editing, M.B., A.M., T.P., C.D., M.S., M.B.L, G.F. and G.M.; supervision, A.F., G.F., T.P. and G.M.

Funding

This paper was written in the framework of the project “UniCarasau” within the program “POR FESR Sardegna 2014-2020 Asse 1 Azione 1.1.3—Aiuti per progetti di ricerca e sviluppo, 2017”. This work was partially supported by Sardegna Ricerche- Regione Autonoma della Sardegna—R\&D Program Agroindutria—POR FESR Sardegna 2014-2020—Azione 1.2.2—under contract “Crunch-Sunalle” (grant number CUP F26C18000350006).

Acknowledgments

Moreover, the authors would like to express their thanks Fabrizio Di Napoli e Antonio Loddo from the M.F.M. of Urrai Salvatora & C. S.N.C to for participating in this study and for the information they freely provided.

Conflicts of Interest

The authors declare no conflict of interest.

Abbreviations

The following abbreviations are used in this manuscript:
ANNartificial neural networks
CPScyber-physical systems
FOHPNsfirst-order hybrid Petri nets
ICTinformation and communication technology
LBPlocal binary pattern
MEMSmicro electro-mechanical systems
PCBprinted circuit board
RFIDradio-frequency identifier
RGBred green blue
VOCsvolatile organic compounds
Wi-Fithree letter acronym
WLANwireless local area network
WSNwireless sensors network
WSTwireless sensors technology

References

  1. Tortorella, G.L.; Fettermann, D. Implementation of Industry 4.0 and lean production in Brazilian manufacturing companies. Int. J. Prod. Res. 2018, 56, 2975–2987. [Google Scholar] [CrossRef]
  2. Demartini, M.; Pinna, C.; Tonelli, F.; Terzi, S.; Sansone, C.; Testa, C. Food industry digitalization: From challenges and trends to opportunities and solutions. IFAC-PapersOnLine 2018, 51, 1371–1378. [Google Scholar] [CrossRef]
  3. Massaro, A.; Manfredonia, I.; Galiano, A.; Pellicani, L.; Birardi, V. Sensing and Quality Monitoring Facilities Designed for Pasta Industry Including Traceability, Image Vision and Predictive Maintenance. In Proceedings of the 2019 II Workshop on Metrology for Industry 4.0 and IoT (MetroInd4. 0&IoT), Naples, Italy, 4–6 June 2019; pp. 68–72. [Google Scholar]
  4. Miranda, J.; Ponce, P.; Molina, A.; Wright, P. Sensing, smart and sustainable technologies for Agri-Food 4.0. Comput. Ind. 2019, 108, 21–36. [Google Scholar] [CrossRef]
  5. Ruiz-Garcia, L.; Lunadei, L.; Barreiro, P.; Robla, I. A review of wireless sensor technologies and applications in agriculture and food industry: State of the art and current trends. Sensors 2009, 9, 4728–4750. [Google Scholar] [CrossRef] [Green Version]
  6. Wang, N.; Zhang, N.; Wang, M. Wireless sensors in agriculture and food industry—Recent development and future perspective. Comput. Electron. Agric. 2006, 50, 1–14. [Google Scholar] [CrossRef]
  7. Güngör, V.Ç.; Hancke, G.P. Industrial Wireless Sensor Networks: Applications, Protocols, and Standards; CRC Press: Boca Raton, FL, USA, 2013. [Google Scholar]
  8. Ammari, H.M. The Art of Wireless Sensor Networks; Springer: New York, NY, USA, 2014; Volume 47. [Google Scholar]
  9. Noel, A.B.; Abdaoui, A.; Elfouly, T.; Ahmed, M.H.; Badawy, A.; Shehata, M.S. Structural health monitoring using wireless sensor networks: A comprehensive survey. IEEE Commun. Surv. Tutor. 2017, 19, 1403–1423. [Google Scholar] [CrossRef]
  10. Gungor, V.C.; Hancke, G.P. Industrial wireless sensor networks: Challenges, design principles, and technical approaches. IEEE Trans. Ind. Electron. 2009, 56, 4258–4265. [Google Scholar] [CrossRef] [Green Version]
  11. Atzori, L.; Iera, A.; Morabito, G. The internet of things: A survey. Comput.Netw. 2010, 54, 2787–2805. [Google Scholar] [CrossRef]
  12. Da Xu, L.; He, W.; Li, S. Internet of things in industries: A survey. IEEE Trans. Ind. Inform. 2014, 10, 2233–2243. [Google Scholar]
  13. Ehrlich, M.; Wisniewski, L.; Jasperneite, J. State of the art and future applications of industrial wireless sensor networks. In Kommunikation und Bildverarbeitung in der Automation; Springer: New York, NY, USA, 2018; pp. 28–39. [Google Scholar]
  14. Costa, C.; Antonucci, F.; Pallottino, F.; Aguzzi, J.; Sarriá, D.; Menesatti, P. A review on agri-food supply chain traceability by means of RFID technology. Food Bioprocess Technol. 2013, 6, 353–366. [Google Scholar] [CrossRef]
  15. Kumar, S.A.; Ilango, P. The impact of wireless sensor network in the field of precision agriculture: A review. Wirel. Pers. Commun. 2018, 98, 685–698. [Google Scholar] [CrossRef]
  16. Mesin, L.; Aram, S.; Pasero, E. A neural data-driven approach to increase Wireless Sensor Networks’ lifetime. In Proceedings of the 2014 World Symposium on Computer Applications & Research (WSCAR), Sousse, Tunisia, 18–20 January 2014; pp. 1–3. [Google Scholar]
  17. Aram, S.; Mesin, L.; Pasero, E. Improving lifetime in wireless sensor networks using neural data prediction. In Proceedings of the 2014 World Symposium on Computer Applications & Research (WSCAR), Sousse, Tunisia, 18–20 January 2014; pp. 1–3. [Google Scholar]
  18. Buratti, C.; Conti, A.; Dardari, D.; Verdone, R. An overview on wireless sensor networks technology and evolution. Sensors 2009, 9, 6869–6896. [Google Scholar] [CrossRef] [Green Version]
  19. Aqeel-ur-Rehman; Abbasi, A.Z.; Islam, N.; Shaikh, Z.A. A review of wireless sensors and networks’ applications in agriculture. Comput. Stand. Interfaces 2014, 36, 263–270. [Google Scholar]
  20. Ojha, T.; Misra, S.; Raghuwanshi, N.S. Wireless sensor networks for agriculture: The state-of-the-art in practice and future challenges. Comput. Electron. Agric. 2015, 118, 66–84. [Google Scholar] [CrossRef]
  21. Connolly, M.; O’Reilly, F. Sensor networks and the food industry. In Proceedings of the Workshop on Real-World Wireless Sensor Networks, Stockholm, Sweden, 20–21 June 2005; pp. 20–21. Available online: http://citeseerx.ist.psu.edu/viewdoc/download?doi=10.1.1.123.5730&rep=rep1&type=pdf (accessed on 12 December 2019).
  22. Anastasi, G.; Farruggia, O.; Re, G.L.; Ortolani, M. Monitoring high-quality wine production using wireless sensor networks. In Proceedings of the 2009 42nd Hawaii International Conference on System Sciences, Big Island, HI, USA, 5–8 January 2009; pp. 1–7. [Google Scholar]
  23. Valverde, J.; Rosello, V.; Mujica, G.; Portilla, J.; Uriarte, A.; Riesgo, T. Wireless sensor network for environmental monitoring: Application in a coffee factory. Int. J. Distrib. Sens. Netw. 2011, 8, 638067. [Google Scholar] [CrossRef] [Green Version]
  24. Correa, E.; Jiménez-Ariza, T.; Díaz-Barcos, V.; Barreiro, P.; Diezma, B.; Oteros, R.; Echeverri, C.; Arranz, F.; Ruiz-Altisent, M. Advanced characterisation of a coffee fermenting tank by multi-distributed wireless sensors: Spatial interpolation and phase space graphs. Food Bioprocess Technol. 2014, 7, 3166–3174. [Google Scholar] [CrossRef] [Green Version]
  25. Jagtap, S.; Rahimifard, S. The digitisation of food manufacturing to reduce waste–Case study of a ready meal factory. Waste Manag. 2019, 87, 387–397. [Google Scholar] [CrossRef]
  26. Bech, S.; Brunoe, T.D.; Nielsen, K. Process for Enhancing the Production System Robustness with Sensor Data—A Food Manufacturer Case Study. In IFIP International Conference on Advances in Production Management Systems; Springer: New York, NY, USA, 2019; pp. 405–412. [Google Scholar]
  27. Bitella, G.; Rossi, R.; Bochicchio, R.; Perniola, M.; Amato, M. A novel low-cost open-hardware platform for monitoring soil water content and multiple soil-air-vegetation parameters. Sensors 2014, 14, 19639–19659. [Google Scholar] [CrossRef] [Green Version]
  28. Paschino, F.; Gabella, F.; Giubellino, F.; Clemente, F. The level of automation of “carasau” bread production plants. J. Agric. Eng. 2007, 38, 61–64. [Google Scholar] [CrossRef] [Green Version]
  29. Cavone, G.; Dotoli, M.; Epicoco, N.; Franceschelli, M.; Seatzu, C. Hybrid Petri Nets to Re-design Low-Automated Production Processes: The Case Study of a Sardinian Bakery. IFAC-PapersOnLine 2018, 51, 265–270. [Google Scholar] [CrossRef]
  30. Baire, M.; Melis, A.; BrunoLodi, M.; Fanti, A.; Mazzarella, G. Study and Design of a Wireless Sensors Network for the Optimization of Bread Manufacturing Process. In Proceedings of the 2018 26th Telecommunications Forum (TELFOR), Belgrade, Serbia, 20–21 November 2018; pp. 1–4. [Google Scholar]
  31. Qarooni, J. Flat Bread Technology; Springer Science & Business Media: Berlin, Germany, 1996. [Google Scholar]
  32. Zanom, B.; Peri, C.; Pierucc, S. A study of the bread-baking process. I: A phenomenological model. J. Offood Eng. 1993, 19, 389–398. [Google Scholar]
  33. Zanoni, B.; Pierucci, S.; Peri, C. Study of the bread baking process—II. Mathematical modelling. J. Food Eng. 1994, 23, 321–336. [Google Scholar] [CrossRef]
  34. Mondal, A.; Datta, A. Bread baking—A review. J. Food Eng. 2008, 86, 465–474. [Google Scholar] [CrossRef]
  35. Tebben, L.; Shen, Y.; Li, Y. Improvers and functional ingredients in whole wheat bread: A review of their effects on dough properties and bread quality. Trends Food Sci. Technol. 2018, 81, 10–24. [Google Scholar] [CrossRef]
  36. Lamrini, B.; Della Valle, G.; Trelea, I.C.; Perrot, N.; Trystram, G. A new method for dynamic modelling of bread dough kneading based on artificial neural network. Food Control 2012, 26, 512–524. [Google Scholar] [CrossRef]
  37. Fravolini, M.; Ficola, A.; La Cava, M. Optimal operation of the leavening process for a bread-making industrial plant. J. Food Eng. 2003, 60, 289–299. [Google Scholar] [CrossRef]
  38. Paton, J.; Khatir, Z.; Thompson, H.; Kapur, N.; Toropov, V. Thermal energy management in the bread baking industry using a system modelling approach. Appl. Therm. Eng. 2013, 53, 340–347. [Google Scholar] [CrossRef]
  39. Baravalle, R.; Patow, G.A.; Delrieux, C. Procedural bread making. Comput. Graph. 2015, 50, 13–24. [Google Scholar] [CrossRef]
  40. Romer, K.; Mattern, F. The design space of wireless sensor networks. IEEE Wirel. Commun. 2004, 11, 54–61. [Google Scholar] [CrossRef] [Green Version]
  41. Ovsthus, K.; Kristensen, L.M. An industrial perspective on wireless sensor networks—A survey of requirements, protocols, and challenges. IEEE Commun. Surv. Tutor. 2014, 16, 1391–1412. [Google Scholar]
  42. Pathan, A.S.K.; Lee, H.W.; Hong, C.S. Security in wireless sensor networks: Issues and challenges. In Proceedings of the 2006 8th International Conference Advanced Communication Technology, Phoenix Park, Korea, 20–22 February 2006; Volume 2, p. 6. [Google Scholar]
  43. Martínez-Anaya, M.A. Enzymes and bread flavor. J. Agric. Food Chem. 1996, 44, 2469–2480. [Google Scholar] [CrossRef]
  44. Davies, E.R. Image Processing for the Food Industry; World Scientific: Singapore, Singapore, 2000; Volume 37. [Google Scholar]
  45. Otsu, N. A threshold selection method from gray-level histograms. IEEE Trans. Syst. Man Cybern. 1979, 9, 62–66. [Google Scholar] [CrossRef] [Green Version]
  46. Bertrand, D.; Le Guerneve, C.; Marion, D.; Devaux, M.; Robert, P. Description of the textural appearance of bread crumb by video image analysis. Cereal Chem. 1992, 69, 257–261. [Google Scholar]
  47. Guo, Z.; Zhang, L.; Zhang, D. A completed modeling of local binary pattern operator for texture classification. IEEE Trans. Image Process. 2010, 19, 1657–1663. [Google Scholar]
  48. Gibbons, J.D.; Chakraborti, S. Nonparametric Statistical Inference; CRC Press: Boca Raton, FL, USA, 2011. [Google Scholar]
  49. Ferdoush, S.; Li, X. Wireless sensor network system design using Raspberry Pi and Arduino for environmental monitoring applications. Procedia Comput. Sci. 2014, 34, 103–110. [Google Scholar] [CrossRef] [Green Version]
  50. Vujović, V.; Maksimović, M. Raspberry Pi as a Wireless Sensor node: Performances and constraints. In Proceedings of the 2014 37th International Convention on Information and Communication Technology, Electronics and Microelectronics (MIPRO), Opatija, Croatia, 26–30 May 2014; pp. 1013–1018. [Google Scholar]
  51. Raptis, T.P.; Passarella, A.; Conti, M. Data Management in Industry 4.0: State of the Art and Open Challenges. IEEE Access 2019, 7, 97052–97093. [Google Scholar] [CrossRef]
  52. Liu, Y.; Tang, J.; Mao, Z. Analysis of bread dielectric properties using mixture equations. J. Food Eng. 2009, 93, 72–79. [Google Scholar] [CrossRef]
  53. Fanari, F.; Carboni, G.; Grosso, M.; Desogus, F. Thermogravimetric Analysis of Different Semolina Doughs: Effect of Mixing Time and Gluten Content. Chem. Eng. Trans. 2019, 75, 343–348. [Google Scholar]
  54. Fanaria, F.; Fraua, I.; Desogusa, F.; Scanob, E.A.; Carbonic, G.; Grossoa, M. Influence of Wheat Varieties, Mixing Time and Water Content on the Rheological Properties of Semolina Doughs. Chem. Eng. 2019, 75. [Google Scholar] [CrossRef]
  55. Baire, M.; Melis, A.; Lodi, M.B.; Dachena, C.; Fanti, A.; Farris, S.; Pisanu, T.; Mazzarella, G. WSN Hardware for Automotive Applications: Preliminary Results for the Case of Public Transportation. Electronics 2019, 8, 1483. [Google Scholar] [CrossRef] [Green Version]
Figure 1. Sketch of Carasau bread production: (1) Raw materials are kneaded to produce the dough, which, after a first leavening (2) is shaped, sheeted (3) and cut into disks (4). Then, following a second leavening in a dedicated room (5), the disks are baked once (6), controlled by operators, re-cut and separated to obtain two sheets (7). Finally, after a second baking (8), the flat breads are weighted, packed, labeled and sold (9). In the figure the seven nodes of the network are represented: two nodes, S 1 and S 2 , for the monitoring of environmental parameters (temperature and relative humidity in air, and concentrations of CO and CO 2 ), three nodes (E 1 , E 2 and E 3 ) for the monitoring of the belt cinematic parameters, and two nodes (C 1 and C 2 ) for the optical monitoring of bread’s morphological parameters at the entrance and at the exit of the leavening room.
Electronics 08 01541 g001
Figure 2. Fixed and heterogeneous node single-tier architecture of a wireless senors network (WSN) for the Carasau bread manufacturing process optimization.
Electronics 08 01541 g002
Figure 3. Prototypes of the WSN nodes S 1 and S 2 ; and E 1 , E 2 and E 3 . (a1,a2,a3) Schematic of the connections and (b1,b2,b3) snapshots of the designed printed circuit boards (PCBs), from Eagle Autodesk. (c1,c2,c3) Realized PCBs.
Electronics 08 01541 g003
Figure 4. Workflow of the software for the elaboration of the bread images at the entrance and at the exit of the leavening room. (a) Processing steps for the bread disk image at the entrance of the leavening room. (i) Original image. (ii) Image after crop and background subtraction. (iii) Final image after thresholding and segmentation. (b) Processing for the bread disk image at the exit of the leavening room. (i) Original image. (ii) Image after crop and thresholding. (iii) Final image after the application of morphological operators.
Electronics 08 01541 g004
Figure 5. Screenshot of the Kibana (Elasticsearch, US) interface for accessing the database in order to administer and visualizing the data. An example of the heterogeneous information collected in the kneading room during August is shown.
Electronics 08 01541 g005
Figure 6. Examples of the data collected during January and August 2019. (a) Temperature, in C, versus time, before leavening, in the dough room. (b) Temperature, in C, versus time, before leavening, in the leavening room.
Electronics 08 01541 g006
Figure 7. Examples of the data collected during January and August 2019. (a) Relative humidity, in percent, versus time, before leavening, in the dough room. (b) Relative humidity, in percent, versus time, before leavening, in the leavening room.
Electronics 08 01541 g007
Figure 8. Examples of the data collected during January and August 2019. (a) CO, in ppm, versus time, before leavening, in the dough room. (b) CO, in ppm, versus time, before leavening, in the leavening room.
Electronics 08 01541 g008
Figure 9. Examples of the data collected during January and August 2019. (a) CO 2 , in ppm, versus time, before leavening, in the dough room. (b) CO 2 , in ppm, versus time, before leavening, in the leavening room.
Electronics 08 01541 g009
Table 1. p-values from the Mann–Whitney U test performed on the processing parameters measured day per day. The significance threshold was set to 0.05.
DaysTemperatureRelative HumidityCO conc.CO 2 conc.
22 January 20191.04 × 10 27 0.4780.8310.300
23 January 20192.74 × 10 36 0.8915.160 × 10 5 0.961
24 January 20191.93 × 10 29 0.1356.422 × 10 8 0.944
25 January 20192.71 × 10 36 0.0401.161 × 10 34 0.260
26 January 20192.80 × 10 11 0.7120.00151
27 January 20192.69 × 10 13 0.392/0.753
28 January 20196.15 × 10 12 0.6026.422 × 10 8 0.8138
13 August 20197.33 × 10 40 0.0162.18 × 10 47 0.143
14 August 20192.14 × 10 14 1.97 × 10 5 4.32 × 10 5 0.877
15 August 20192.57 × 10 30 0.4246.26 × 10 26 0.905
Table 2. Results from the Mann–Whitney U test performed on the measured processing parameters. The significance threshold was set to 0.05.
p-Value
Temperature3.30 × 10 285
Relative Humidity0.125
CO ratio7.85 × 10 33
CO 2 ratio0.092
Table 3. Comparison of the geometric and morphological features extracted from bread images before and after the leavening. The quantities are dimensionless or given in pixels.
Before LeaveningAfter Leaveningp-Value
Roundness0.757 ± 0.1640.389 ± 0.0954.07 ×10 56
Convexity0.678 ± 0.2010.591 ± 0.0633.43 × 10 6
Solidity0.893 ± 0.1130.489 ± 0.11941.91 × 10 58
Angle82.687 ± 77.82074.344 ± 71.2190.798
Compactness0.135 ± 0.3100.1421 ± 0.0711.74 × 10 65
Major Axis744.34 ± 634.608654.630 ± 89.1572.64 × 10 5
Minor Axis473.473 ± 142.50499.757 ± 26.0232.26 × 10 21
Eccentricity0.615 ± 01890.777 ± 0.1122.24× 10 17

