Article

Fake News Analysis Modeling Using Quote Retweet

Department of Computer Engineering, Yeungnam University, Gyeongsan 38541, Korea
*
Author to whom correspondence should be addressed.
Electronics 2019, 8(12), 1377; https://doi.org/10.3390/electronics8121377
Submission received: 30 October 2019 / Revised: 16 November 2019 / Accepted: 17 November 2019 / Published: 20 November 2019
(This article belongs to the Special Issue Electronic Solutions for Artificial Intelligence Healthcare)

Abstract

:
Fake news can confuse many people in the area of politics, culture, healthcare, etc. Fake news refers to news containing misleading or fabricated contents that are actually groundless; they are intentionally exaggerated or provide false information. As such, fake news can distort reality and cause social problems, such as self-misdiagnosis of medical issues. Many academic researchers have been collecting data from social and medical media, which are sources of various information flows, and conducting studies to analyse and detect fake news. However, in the case of conventional studies, the features used for analysis are limited, and the consideration for newly added features of social media is lacking. Therefore, this study proposes a fake news analysis modelling method by identifying a variety of features and collecting various data from Twitter, a social media outlet with a good deal of power in terms of spreading information. The method proposed in this study can increase the accuracy of fake news analysis by acquiring more potential information from the Quote Retweet feature added to Twitter in 2015, compared to the more conventional and common Retweet only. Furthermore, fake news was analysed through neural network-based classification modelling by using the preprocessed data and the identified best features in the learning data. In the performance results, using the neural network-based classifier, the classification model that also used Quote Retweet, showed an improvement in performance over the conventional methods, and it was confirmed that the identified best features had a significant impact on increasing the classification accuracy of fake news.

Graphical Abstract

1. Introduction

In accordance with the progress of smart devices and information technology, the potential and popularity of social (and medical) media have increased, and they have become powerful instruments of information delivery, for not only journalists, but also experts in diverse areas and citizens [1,2,3,4,5]. Social media facilitates the real-time composition and query of not only text data, but also multimedia data, such as photos and videos, and are used as instruments for collecting information regarding social issues [6]. Sometimes, the information delivery power of social media exceeds the delivery power of news media that specialise in breaking news [7]. Particularly, social media’s ability to gather information is very useful in emergency situations such as natural disasters [8], and the number of users obtaining real-time observation information of emergency situations from social media has dramatically increased [9,10,11,12].
According to a survey conducted in 2008, social media and Internet news were the most influential news media for Americans under the age of 30 [13], and according to research, many people trust social media as news media [14]. Particularly, a post is highly trusted when it is written by a highly influential user with a considerable interest in politics [15].
However, if the spread of information in social media is not systematically controlled, there is a risk that incorrect information will spread [16]. Even at this very moment, countless amounts of data are being produced on social media, and because of this, a large amount of information is exposed to many people through social media with no restriction. Among such information are many rumours whose source is unclear and veracity is difficult to determine [17]. For example, when there was almost no news or information right after the earthquake in Chile in 2010, many rumours posted on social media increased the confusion and anxiety among the local people [18]. Rumours have a strong influence not only on individuals, but also on groups, and spread continuously through a simple and common method [19]. Furthermore, a rumour is sometimes produced intentionally when people feel the urgent need for security [20].
In general, social media outlets are used for conversation and chitchat, but sometimes are used for sharing information with the community or to report news [21]. It has been confirmed that they have great influence in politics, economy, culture, and healthcare [22,23,24,25]. Twitter is one of the social media services that are commonly used for sharing information and building rapport, and a considerable part of Twitter is also used for the delivery of newsflashes or headlines [7]. This characteristic of Twitter creates a sufficiently favourable environment for using it as a tool for political propaganda [26]. However, it has been observed that a rumour without an official statement is questioned by people, and the users who encounter such rumours often tweet, asking about the veracity and share their own thoughts [27,28]. Recently, false information, also known as fake news, has been causing a lot of confusion among people [29] and attracting a great deal of attention since the 2016 United States presidential election, as shown in Figure 1.
Fake news refers to untrue information that has a format like real news reports; it spreads usually through social media for political or economic gains. Such fake news can stir confusion in people and exerted significant influence on the maximisation of political polarisation in the 2016 US presidential election [30]. According to the studies of Lukasik et al. [31] and Schwarz et al. [32], topics such as politics, economics, and health contain a great deal of misinformation, which is highly likely to cause serious confusion for those who rely on it through Internet searches.
As a result, more and more countries are pushing legislation to counter fake news [33], and many studies have been actively carried out for detecting false rumours or fake news [33]. These studies investigated the characteristics and patterns of rumours and fake news by collecting information and posts of Twitter users around the world [17].
This study proposes an analysis model to identify the best features of fake news by using the information of Quote Retweet (Quote RT) as well as conventional Tweets. Quote RT, which is an added feature of Twitter in 2015, facilitates retweeting to add a comment to a previously written Tweet. Based on this, there is an advantage that not only more text information can be collected compared to conventional Retweets, but also the depth of propagation can be easily measured because the parent Tweets can be tracked.
The contributions of this study are as follows.
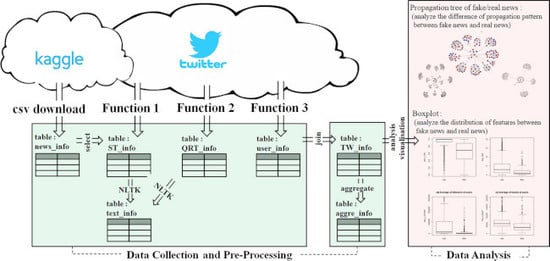
  • A novel fake news analysis modelling system was built by analysing Twitter’s Tweets and Quote RT together.
  • A method was proposed to conveniently collect numerous Twitter data (tweets, Quote RT, user information) in stages for fake news analysis.
  • Best features that could directly (effectively) affect fake news were identified through highly reliable statistical analysis and visualisation method.
  • A novel visualisation method was applied for fake news phenomenon analysis and trend identification so that their characteristics could be easily investigated.
  • For the evaluation of fake news classification function based on the method proposed in this study, comparative analysis was conducted using conventional studies by applying neural network, one of the artificial intelligence (AI) technologies, and its superiority was demonstrated.
This study is organised as follows. The introduction is in Section 1; the background of tweeting and Quote RT described in Section 2; related work is outlined in Section 3; the collection and preprocessing of Quote RT data is described in Section 4; the statistical analysis, visualization and discussion of characteristics of fake news based on the analyzed results is in Section 5; and the conclusion is in Section 6.

2. Background

2.1. Twitter

The name Twitter originated from the word ‘tweet’, a bird’s chirping sound. Its service was launched in 2006, and it has become a highly recognised global social media platform, along with Facebook. As of the second quarter of 2019, the number of daily active users is about 139 million and the generated amount of data is almost uncountable. The reason why Twitter is highly popular is because users communicate on equal terms. Using the convenient features of Twitter, the users can converse freely and openly with celebrities, such as movie actors and sport athletes, and exchange opinions with various people around the world in real-time.
A Twitter user can become a follower of a certain user, and based on this feature, a person’s social recognition, status, and influence in a certain area can be checked. When a Twitter user has many followers, it means that the user is highly recognised in the area he/she belongs to. Tweets by an influential Twitter user have strong influence in terms of information delivery in Twitter because they are highly likely to be read by many people.
However, Twitter is not only personal opinions and observations, but also for official information of a certain organisation can be delivered, as an organisation can use Twitter like an individual user. This characteristic allows Twitter to be used as a marketing tool for companies and an information delivery medium for news media companies. Furthermore, users who have interest in a certain area—such as health, medical treatment, leisure, or a particular hobby—can gather and conveniently post informative contents. Thus, Twitter can be used in a variety of ways, and its potential value is infinite in the future.

2.2. Major Functions of Twitter

In Twitter, a user can follow a certain user using the Follow button, and convey or share opinions with followers through features such as Tweet, Retweet, and Mention, and express interest in a certain Tweet using the Like button.

2.2.1. Follow

In Twitter, a relationship between each user is made through a feature called Follow. When user A follows user B, A becomes a follower of B, and B becomes a part of A’s following. When A and B follow each other, they become virtual friends. In another popular social media platform, Facebook, users have to build friendship with each other in order to exchange information, but in Twitter, information can be shared by a certain user by simply following that user. When following, a special qualification or permission from a corresponding user is not required. Twitter users can continue to receive information from each following user unless they are blocked by their following users. In addition, on Twitter, like other social media, it is possible to socialize and share information through each other.

2.2.2. Tweeting

Tweeting refers to sharing one’s thoughts or opinions with their followers. Figure 2 shows a written Tweet and its additional functions. A text message of up to 280 characters can be posted, and in addition, links, photos, and videos can be uploaded. The followers who see a Tweet of a user can use additional features such as Like (heart), Retweet, and Reply. Furthermore, special tasks such as a hashtag or mention, can be processed by using the following special symbols in a Tweet text.
  • Hashtag (#): it is usually used when mentioning keywords related with a Tweet. A link is added to the texts prefixed with a ‘#’ sign, and when it is clicked, search results for the pertinent keyword are shown.
  • Mention (@): it is used for the purpose of mentioning a certain user by writing the user’s name after @. A Tweet notification is sent to the mentioned user. Mention is usually used for the purpose of conversation or question and answer (Q&A) between certain users, and the content of conversation may be disclosed to other users.

2.2.3. Retweet

A Retweet is often expressed as the term RT, and its purpose is to re-share an already-shared Tweet to one’s followers while maintaining the original writer and content. In general, followers who have accessed a Tweet express their interest in the information to other people through Retweets. As Retweets do not contain one’s own comments and are usually used when expressing agreement with or interest in the original Tweets, users do not usually Retweet when a Tweet contains information they do not like or are not interested in. Information is generated through Tweets, but in general, information is spread using Retweets. Therefore, a Retweet plays a much larger role in spreading information than any other feature, and because of this characteristic, it can sometimes create serious, as well as trivial, social issues by exercising powerful influence in the political arena, especially during electoral activities. Hence, Retweet has become a research topic for many researchers.

2.2.4. Quote Retweet

Quote Retweet is an added feature of Twitter that was introduced in 2015. The conventional Retweet only posts an original Tweet a follower read to his/her own followers without writing any comment. In contrast, Quote Retweet lets a follower post an original Tweet to his/her own followers and at the same time, write his/her comment regarding the original Tweet, as shown in Figure 3. While Retweet helps in sharing the information a user is interested in, Quote Retweet lets the followers share a post by adding their comments regarding the information they are interested in. A composed Quote Retweet is shown like a Tweet and sports the same features as that of a Tweet, such as Retweet, Reply, and Like. Furthermore, a Quote Retweet can also be quoted by other followers. Twitter users can use Quote Retweet to express their official replies for a certain Tweet to their followers by commenting or reacting (agree, oppose, and neutral) on the original Tweet, which could not be done via conventional Retweets. The trend of using Quote Retweet is continuously increasing, and according to a research, the reason is because the users of conventional Retweets are switching to Quote Retweets [34]. Since Quote Retweets not only play the role of spreading information but also contain the quoted Tweet information and the users’ reaction information, it is expected that they will be much more useful than the conventional Retweets in terms of this research topic.

2.3. Fake News

Yellow journalism has existed for a long time. When social media was advancing rapidly in the 2010s, it was exploited to distribute completely fabricated information, which was disguised in the form of journalism.
Recently, the use of the expression ‘fake news’ has also sharply increased, as the acts of spreading unverified, inaccurate ‘news’ or maliciously distorted information have been prevalent in the form of news/newspaper articles through social media. Fake news became a widespread expression familiar to even ordinary people especially after Donald Trump, who was elected the 45th US president in 2016, claimed that some news reports were fake news.
Fake news and yellow journalism have some similarities; they use news report formats to spread information and gain public trust. However, while yellow journalism has a formal organisation and characteristics of a press, such as news reporters and editors, fake news is spread based on the information fabricated by an individual or organisation unrelated to the press, whereby the format of news report is disguised with the characteristics of conventional press.
People tend to accept only what they want to believe, and if they repeatedly exposed to the wrong information, they are very likely to accept it [21]. Generally, materials related to fake news spreading in social media have the following commonalities: satire, parody, misinterpretation, foment, and heavily biased contents [35,36,37,38].
In the 2016 US presidential election, fake news had enormous impact on the election, and at the time, a large fraction of the news reports mentioned in social media were proven to be fake news [39]. Fake news has become a serious issue globally, and many countries are taking measures to introduce laws and countermeasures against fake news, but effective solutions have yet to be presented [40]. Furthermore, the providers of social media, such as Twitter and Facebook, that are agents of information spread have endeavoured to minimise the problem through a reporting feature, but there is a fairly high possibility that the reporting function can be misused. Furthermore, it has become increasingly more difficult to identify fake news because the ways of spreading fake news is evolving every day. Therefore, there is a growing need for studies on detection and regulation of fake news.

3. Related Work

In many previous studies on analysis and detection of fake news, data were collected from Twitter, a representative social media platform. Furthermore, crowdsourcing platforms such as Amazon Mechanical Turk (AMT) [41], were used to investigate whether news reports were true or false. Castillo et al. [42] confirmed that important or beneficial information was actively spread on Twitter and the users had a tendency of showing a more positive reaction to true information than false information. Based on these facts, Castillo et al. proposed a method to evaluate the reliability of the information using Tweet data. For this, Castillo et al. collected over 2500 Tweets and used the AMT to determine whether the rumours were true or false. Furthermore, using the collected Tweet data, analysis was performed for message, user, topic, and propagation features. By using these features in the learning data, a decision-making, tree-based rumour classification model was created. The feature selected as the root in the decision-making tree was the existence/absence of a URL, and this meant that the existence/absence of the source of information had a significant impact on distinguishing true/false information.
Kwon et al. [43] confirmed that in a network having a low density, a rumour thrives for a short time and spreads ceaselessly but gradually over a long period of time [44]. Kwon et al. collected the data of 54 million users, 1.9 billion links between them, and 1.7 billion Tweets posted by these users over a three-year period in order to analyse the features of rumours. Temporal propagation features, user features, and linguistic features were extracted from the collected data, and using them as learning data, a rumour detection and classification model was created through machine learning. Furthermore, various types of machine learning models were applied and compared for the performance evaluation of rumour detection and classification model.
Jin et al. [45] conducted a study based on a fact that news-related Tweet had two responses, support or against [45]. Jin et al. mentioned that a user posted his/her opinion and emotion after reading the tweeted news and was highly likely to post a negative comment when he/she read a Tweet questionable as fake news. Therefore, the corresponding study proposed to build a reliability network of Twitter by using opinions on news. To this end, <topic, viewpoint> pairs were made by using LDA (Latent Dirichlet Allocation) [46], and Support and Against Tweets were classified by using a K-means algorithm. Afterwards, comparative performance evaluation was conducted using the methods of Castillo et al. [42] and Kwon et al. [43], and approximately 5–8% higher classification accuracy was demonstrated.
In addition, many studies were conducted with respect to rumours. Yang et al. [47] included type and location information of clients in the features of rumours explained by Castillo et al. [42], thereby improving the performance of rumour detection model by a small margin (about 5%), and Liu et al. [48] analysed rumours based on the insights of journalists. Maddock et al. [49] defined the social media user reactions into seven types (misinformation, speculation, correction, question, neutral, hedge, and other), and Procter et al. [16] categorised them into four types (support, denial, appeal, and comment). Furthermore, Zubiaga et al. [50] investigated the initial reactions on rumours and classified the user groups into three types: supporting false rumours, discussing false rumours, and ridiculing false rumours. Mendoza et al. [51] discovered that there was a strong correlation between rumour support and veracity, and a large number of users denied rumours revealed as false. Cheng et al. [52] demonstrated that rumours were highly likely to be spread in a network having strong ties. Chua et al. [53] discovered that the spreading power of rumour was large in a network having influential users. Vosoughu [54] evaluated the rumours classification performance of machine learning techniques, dynamic time wrapping (DTW) and Hidden Markov models (HMMs), based on the defined three categories: linguistic, user-oriented, and temporal propagation. Giasemidis et al. [55] discovered eight key features to identify rumours through various machine learning techniques (logistic regression, random forest, decision tree, support vector machine, and naïve Bayes) based on approximately 100 million tweets for the data.
Garimella et al. [34] mentioned that since 2015, the users who had been using Retweets and comments were switching to Quote RT. It was found that longtime users used Quote RT more frequently and felt that Quote RT performed the function of official reaction or answer for an existing Tweet. Therefore, it was concluded that Quote RT would have large impact on the spread of political discourse in social media. The conventional studies explained above identified the characteristics of rumours using only Tweets, which is a conventionally provided feature, and other information related to Tweets. It was determined that the spreading patterns of news and even more information on user reaction could be investigated if Quote Retweets were also collected to analyse the data in addition to the results of previous studies.

4. Data Collection and Preprocessing

This section describes the data collection method and preprocessing. Figure 4 displays an overview of fake news analysis modelling using Twitter data. It shows a method of collecting Twitter data, including news reports, for which the veracity has been confirmed, Tweets, Quote Retweets, and user information. In addition, Figure 4 shows the preprocessing, visualisation, and statistical analysis for data analysis. A Tweet that mentioned a news directly was called ST (Seed Tweet) and a Quote Retweet was called QRT (Quote ReTweet). Moreover, Tweets, including both ST and QRT, were called TW (Tweets). Information of ST that had mentioned respective collected news was saved in the ‘ST_info’ table, QRT information in the ‘QRT_info’ table, and user information in the ‘user_info’ table. The ST collection method was described in Function 1, the QRT collection method in Function 2, and the user information collection method in Function 3.
Furthermore, to extract a variety of additional information from ‘ST_info’ and ‘QRT_info’, information such as URL, special characters, emphasised words, and emotional score, were extracted by using the Natural Language Toolkit (NLTK) package [56] and stored in the ‘text_info’ table. ‘ST_info’, ‘QRT_info’, ‘user_info’, and ‘text_info’ were merged as one data and saved in the ‘TW_info’ table. ‘TW_info’ was aggregated by news and saved in the ‘aggre_info’ table. The data of ‘TW_info’ and ‘aggre_info’ were used as statistical and visualisation data for data analysis (The datasets are available as Supplementary Material in the text).

4.1. Data Collection

For the fake news and real news to be used in the analysis, data provided by Kaggle were used [57,58]. Kaggle provides global open data for various areas in the csv or JSON format and provides data for already-confirmed fake news and real news. The collected information consisted of the news article’s headline, writer, date of the Tweet, and real/fake news status, and was stored in the ‘news_info’ table in the database. For data analysis, the news released after 2015 were used; this was the timepoint when the Quote Retweet function was added.
Tweepy [59] and Selenium, a Web-scraping tool, were used [60] to collect the ST that mentioned each news, QRT that quoted it, and information of user who wrote the TW. ST and QRT that had mentioned certain news from January 2015 to April 2019 were collected using Selenium.
Function 1 expressed pseudocodes for collecting ST that mentioned news for a certain period (startDate, endDate). By using the Selenium driver, ST that mentioned certain news was searched (lines 1–2). Moreover, to fetch all ST information in a Web page, the page was scrolled through until the end of the Web page was reached (lines 3–7). This was done because only partial content was shown when the output content of ST was large. When all ST information was displayed on one page, the respective Tweet information was parsed using the tagged keywords from HTML codes of Webpage and then read into a list (lines 8–23). Respective information of list was merged into one data frame and saved in the ‘ST_info’ table (lines 24–25).
Function 2 showed the pseudocodes for receiving the ID of the collected ST and collecting QRT that quoted it. QRT had depth information (lines 1–2), and the ID of TW was used to search QRT that quoted the TW (lines 3–4). Afterwards, the process proceeded following the same method as that of Function 1 (lines 7–26), and the added QRT information was saved in ‘QRT_info’ (line 27). If QRT that quoted a QRT existed, the QRT information could also be collected using a recursive call (line 28).
Function 3 showed the pseudocodes for collecting the user information. For the user information, the user’s followers, following, number of Tweets, user’s URL, user-account creation date, and bio were collected using Tweepy and the ID of the user who wrote the TW. The collected user information was saved in the ‘user_info’ table.
Based on this method, information was collected for 16,453 cases of TW related to 1387 fake news and 56,651 cases of TW related to 2085 real news, and 65,405 cases of users who wrote the TWs.
Function 1: CollectSeedTweets
input: startDate, endDate, news, isFake
1driver = createSeleniumDriver()
2searchPage(driver, new, startDate, endDatae)
3newBottom = 0
4lastBottom = scrollDown(driver)
5while newBottom != lastBottom
6 preBottom = newBottom
7 newBottom = scrollDown(driver)
8parser = createParser(driver.page_source)
9userList = parser.find(“username”)
10cnt = len(userList)
11if(cnt == 0) return
12id_time = parser.find(“tweet-timestamp”)
13twidList, timeList = split(id_time)
14txtList = parser.find(“tweettextsize”)
15replycntList = parser.find(“action—reply”)
16rtcntList = parser.find(“action—retweet”)
17favocntList = parser.find(“action—favorite”)
18imgList = parser.find(“adaptive-photo”)
19videoList = parser.find(“playablemedia-player”)
20newsList = createList(cnt, news)
21parentList = createList(cnt, news)
22isfakeList = createList(cnt, isFake)
23depthList = createList(cnt, 0)
24df = createDataframe(
 newsList, parentList, twidList, userList,
 timeList, txtList, replycntList, rtcntList,
 favocntList, imgList, videoList, isFake, depthList
)
25InsertTable(df, “ST_info”)
Function 2: CollectQuoteRTs
input: parentID, news, isFake
1global depth // initialize 0
2depth = depth + 1
3driver = createSeleniumDriver()
4searchPage(driver, parentID)
5newBottom = 0
6lastBottom = scrollDown(driver)
7while newBottom != lastBottom
8 preBottom = newBottom
9 newBottom = scrollDown(driver)
10parser = createParser(driver.page_source)
11userList = parser.find(“username”)
12cnt = len(userList)
13if(cnt == 0) return
14id_time = parser.find(“tweet-timestamp”)
15twidList, timeList = split(id_time)
16txtList = parser.find(“tweettextsize”)
17replycntList = parser.find(“action—reply”)
18rtcntList = parser.find(“action—retweet”)
19favocntList = parser.find(“action—favorite”)
20imgList = parser.find(“adaptive-photo”)
21videoList = parser.find(“playablemedia-player”)
22depthList = createList(cnt, depth)
23newsList = createList(cnt, news)
24parentList = createList(cnt, parentID)
25isfakeList = createList(cnt, isFake)
26df = createDataframe(
 newsList. parentList, twidList, userList,
 timeList, txtList, replycntList, rtcntList,
 favocntList, imgList, videoList, isFake, depthList
)
27insertTable(df, “QRT_info”)
28for id in idList:
 CollectQuoteRTs(id, new, isFake)
29depth = depth − 1
Function 3: CollectUserinfo
input: userID, tweepyAPI
1info = tweepyAPI.get_user(userID)
2df = createDataframe(
 userID,
 info.followers,
 info.followings,
 info.statuses, // tweet cnt
 info.created_at, // age
 info.description, // bio
 info.url
)
3InsertTable(df, “user_info”)

4.2. Preprocessing

This section describes the preprocessing of the collected data for data analysis. As TW’s text information contained a variety of information, information extraction through text analysis was required. Therefore, URL information, special characters (hashtag, mention, question, emphasis), emphasised words, emotion information (number of positive/negative words, emotional score) were extracted from the TW text information, and the extracted information was saved in ‘text_info’. The NLTK package was used for the words and sentences expressing emotions in texts. For the emotional score, a method used by Castillo et al. [42] was used, that is, 1 point was assigned whenever a strong positive word was present in the text information and 0.5 point in the case of weak positive word. Likewise, −1 point was assigned for a strong negative word and −0.5 point for a weak negative word.
A process was required to merge the information scattered across different tables for convenient data analysis. Since the schema of ‘ST_info’ was consistent with that of ‘QRT_info’, the two tables were merged. That table was then merged with ‘text_info’ and ‘user_info’ using TW ID as a key, and the result was saved in the ‘TW_info’ table. The schema of ‘TW_info’ is defined in Table 1, and each record contains the status information of the TW related to certain news, information extracted from the text of TW, the information about the user who wrote the TW, and the status of real/fake news. ‘TW_info’ contained more information than the information collected using only conventional ST. Furthermore, because the status information of TW included the ID information of the parent TW of TW, it was easy to express the propagation pattern of TW and the depth of propagation tree by tracing the parent TW ID.
The information of ‘TW_info’ was aggregated by news in order to show TW information for each news, and this information was saved in the ‘aggre_info’ table. Here, 405 cases of fake news and 2085 cases of real news, for which ten or more STs were registered, were used. Table 2 defines the schema of ‘aggre_info’ table, and each record of ‘aggre_info’ shows the average value of TW information and the status of real/fake news for each news.

5. Data Analysis

5.1. Statistics and Visualisation

By using the information collected and preprocessed (Table 1 and Table 2) in the previous chapter, statistical analysis was performed to find the best features of fake news, and the results were visualised in boxplots, as shown in Figure 5. Figure 5 shows the features representing the differences visually between the fake news and the real news by using the boxplots. In Figure 5, the x-axis of each boxplot shows the status of real/fake news (0: real news, 1: fake news), and the y-axis indicates the value range of each feature. Table 3 presents the average of each feature shown in Figure 5. The features not expressed in Figure 5 and Table 3 had very similar averages and proportions, thereby showing not much difference in visualisation of distribution.
The attributes that showed significant differences between fake news TW and real news TW were the average number of replies, average depth of propagation tree, proportion of including URL, user’s influence/activeness/active period, QRT’s proportion, proportion of including multimedia, etc. Figure 5a compares the proportion distribution of URLs in TW, and it was confirmed that for real news, majority of TWs mentioned the URL. Figure 5b compares the average number of replies for TW written. It confirms that the average number of replies is lower for the TW of fake news than that of the TW of real news. Figure 5c shows the average depth of TW propagation tree, and confirms that real news is propagated slightly more deeply. This means that there are more users who come to know about the news indirectly via propagation compared to users who encounter the news directly, and it was confirmed that fake news had relatively lower spreading power. Figure 5d compares the average number of followers, that is, influencing power of TW users, and confirms that the distribution of users having a relatively larger influence is high for the real news TW. Figure 5e shows the TW users’ average number of TWs, and confirms that the average number of writing TWs is slightly higher for the real news TW users. Figure 5f shows the user account age (days) of TW writers, and confirms that the account age of fake news TW writers is slightly lower. Figure 5g compares the rate of using QRT between real news and fake news, and confirms that the QRT is used more frequently for real news. Figure 5h shows the proportion of pictures included in the TW, and Figure 5i shows the proportion of multimedia contents (picture or video) included in the TW. It was confirmed that the proportion of including pictures and videos was relatively higher for fake news.
Figure 6 expresses the propagation patterns of real news and fake news based on the information of Table 1. In the propagation tree, the centre Root node indicates a news report, and child nodes consist of TWs that mentioned the news report (the nodes with the tree level of 1 are ST, and the nodes with higher number than 1 are QRT). The nodes expressed in black indicate the highly influential users.
In this study, having 200,000 followers was assigned as the threshold of high influential power. As shown in Figure 6, the real news propagation tree has a higher proportion of highly influential followers compared to the fake news propagation tree. Moreover, it was confirmed that more QRTs were used for real news, and more TWs were propagated from influential users. Table 4 shows the result of the t-test for each feature of Figure 5. Every feature, excluding the average number of replies, shows that the p-value is less than 0.05. It means that the difference between fake news and real news is statistically significant for every feature excluding the average number of replies in Figure 5.
Table 5 compares the average propagation period between the fake news TW and the real news TW using the registered time of TW. The fake news TWs were propagated for 703.61 days on an average, and the real news TW were propagated for 107.72 days on an average. Figure 7 shows the propagation tree based on the time the TW mentioned the real news, and Figure 8 shows the propagation tree based on the time the TW mentioned the fake news.
Each propagation tree was additionally drawn for only the registered date of TW. For the fake news, it was confirmed that the propagation period of TW was long although the propagation depth was low.

5.2. Best Features

Based on the results of checking the distribution and average value of each feature of TW information through Figure 5 and Table 4, the value of fake news TW was lower than that of real news TW for the rate of mentioning URLs (Figure 5a), average number of replies (Figure 5b), average depth (Figure 5c), average number of followers (Figure 5d), average number of Tweets (Figure 5e), average age of user account (Figure 5f), and the rate of using QRT (Figure 5g). A low rate of mentioning URLs indicated that the source of information was not provided in many cases. A low average number of replies indicated that the Twitter users had less interest in fake news than in real news. Furthermore, when the average number of Tweets, average number of followers, and average age of accounts were low, in general, the users spreading the fake news had low Tweet activities and consisted of people having less influence. Moreover, it can be suspected that the user accounts were temporarily created for the purpose of spreading fake news. Particularly, the average number of followers of users was distributed much lower in the fake news side; hence, it was interpreted that the influential people reacted cautiously to fake news. The rate of using QRT was also lower for fake news, and based on a viewpoint that QRT expresses official reaction, it seemed that people generally showed a reserved reaction to fake news. Furthermore, when the proportion of QRT for fake news was low, the proportion of ST was relatively higher. Therefore, it was determined that people spread fake news usually by writing ST rather than QRT. When the average depth for QRT was low, it indicated that the propagation power of information was low. Thus, it can be interpreted that fake news had relatively low propagation power. However, according to Table 5, the average propagation period of fake news was longer than that of real news. Based on the analysis of the phenomenon that fake news spread for a longer period and had lower propagation power, it can be deduced that someone keeps tweeting fake news constantly and gradually.
In contrast, the fake news TW had higher rate of including multimedia contents (pictures/videos) (Figure 5h,i). Considering that nowadays it has become easy to spread fake photos with the help of image synthesis technologies such as deepfake [61], it can be assumed that synthesised photos and videos were intentionally added and spread to increase the reliability of fake news.
From Table 5 and Figure 7 and Figure 8, we can analyze that fake news propagates longer than real news. This result shows similar patterns to characteristics of rumours investigated in Kwon et al. [43]. As shown in Figure 7, overall, the propagation trend is more concentrated on QRT (more than 2 depths) than ST. Compared with the propagation tree of fake news in Figure 8, real news relatively spreads in a short time, and it is not mentioned well when people are not interested. However, as presented in Figure 8, in general, the propagation trend tends to be focused on ST rather than QRT, and the depth of the propagation tree is relatively shallow. Compared with the propagation tree of real news in Figure 7, it is confirmed that a small number of Tweets spreads from time to time for a long time, and the participation rate of influential users (nodes expressed in black) is low. Please note that as shown in the propagation tree from October 02, 2016 to Mar. 23, 2019, the overall shape is similar, but the small number of ST and QRT are continuously generated by a few users. This suggests that fake news is constantly mentioned by someone with a malicious purpose.

5.3. Neural Network-Based Fake News Classifier

This section discusses the comparative experiment performed using Castillo’s method [42] to verify the performance of the fake news analysis modelling method proposed in this study using neural network, which is one of the machine learning techniques. Furthermore, classification models were compared by using all features as learning data to verify the best variables confirmed earlier. For this, the classification model was defined according to the range and combination of data used for three types of learning, as shown in Table 6. Classification Model 1 used the best features proposed by Castillo et al. [42] as learning data. The best features confirmed by Castillo et al. [42] were topic-based features (rate of url, avg of senti, rate of exclam), user-based features (avg of Tweets, avg of friend), and propagation-based features (avg of rtcnt), and only the data of ST (depth is 0) were used. Classification Model 2 used all features of TW, including both ST and QRT, for the learning data. Classification Model 3 used only the best features of TW, including both ST and QRT, for the learning data. As the experimental tools of the performance evaluation, the neural network model of R nnet package [62,63] provided as open source was used, and training and validation was performed by classifying it into 70% training data and 30% valid data [64].
Table 7 shows the results of evaluating each classification model for 405 cases of fake news and 2085 cases of real news where ten or more STs were registered; the classification accuracy was shown for fake news, real news, and total, respectively. When Classification Model 1, which was based on Castillo’s method [42], was compared with Classification Model 2, in which all features of ST and QRT were learned, Classification Model 2 showed 4.57%, 10.51%, and 9.79% higher classification accuracy for the fake news, real news, and total, respectively. These results implied that newly added features and a larger amount of data acquired using QRT had contributed greatly to increase the classification accuracy.
When Classification 2 was compared with Classification 3, which used the best features of TW only, the classification accuracy of Classification Model 3 was 8.48% higher for fake news, 6.52% lower for real news, and 4.15% lower for the total. These results implied that the best features reflected the characteristics of fake news well, and the effect of improving the classification accuracy of fake news was produced by slightly decreasing the classification accuracy of real news. It was interpreted that the total classification accuracy decreased a little because the number of real news (2085 cases) was about five times larger than the number of fake news (405 cases), and the decreased classification accuracy of real news led to the decreased total accuracy. Therefore, it was confirmed that using only the best features would contribute to improving the classification accuracy compared to using all features in a system focusing more on the detection of fake news.

6. Conclusions

In the present era, numerous amounts of information are generated every day amid advancement of electronic devices and social media, and among such information, false information, called fake news, exists as well. Fake news creates various problems in our society, and endeavours are required to solve them. Accordingly, many researchers have conducted studies to detect rumours and fake news by using Twitter data, one of the popular social media outlets. However, Twitter has added new features over time, and consequently, additional studies are required to consider them.
In 2015, Quote Retweet was added as a feature in Twitter. It contains more information than the conventional Retweet, and has an advantage that the propagation path of information can be easily identified since the parent Tweet can be easily found. Furthermore, the users are switching from conventional Retweets to Quote Retweet. Therefore, this study proposed a fake news analysis modelling method to acquire more data by collecting Quote Retweets and identify the best features that would have positive impact on fake news detection. The proposed fake news analysis modelling method provided a method to conveniently collect Tweets, Quote Retweets, and user information from Twitter and to preprocess the collected data into a format that could be easily used in data analysis. Furthermore, the best features having influence on fake news were identified through effective visualisation and results of statistical analysis obtained from the preprocessed data.
The data containing news and veracity information of news were collected from Kaggle, an open data analysis platform. Furthermore, Selenium was used as a tool for collecting the information of Tweets and Quote Retweets from Twitter, and Tweepy was used to collect the information of users who had written the Tweets. In addition, the NLTK package was used to extract the emotion information, emphasized words, special characters, and URLs from the texts of collected Tweets and Quote Retweets.
The results of visualisation and statistical analysis to investigate the best features from the collected data indicated significant differences between fake news and real news in terms of existence/absence of information source, replies for Tweets, influencing power of Tweets, rate of using Quote Retweet, depth of Tweet propagation tree, and rate of quoting picture/video. Furthermore, the results of propagation period confirmed that fake news was propagated for a longer period gradually but constantly compared to real news.
Performance evaluation was performed using the neural network-based fake news classifier to investigate whether the best features identified through the proposed method really had a positive impact on the fake news classification accuracy. In the results, the classification model that added Quote Retweet information showed 4.57%, 10.51%, and 9.79% higher classification accuracy for fake news, real news, and total, respectively, compared to the classification model using the conventional Tweet information only. Furthermore, in the performance comparison between the classification model using all features and the classification model using the best features only, the classification model that learned the best features only showed 8.48% higher classification accuracy for fake news, thereby confirming that the best features had a positive impact on fake news classification.
There is still room for improving the quality of text information by applying more detailed text analysis on Tweets. If the user reaction information and emotion information of a much higher quality can be used through this process, it is expected that the fake news classification performance can be further increased. This will be left for future work.

Supplementary Materials

The following are available online at https://www.mdpi.com/2079-9292/8/12/1377/s1, the dataset is available as supplementary material in the text.

Author Contributions

Conceptualization, Y.-S.S.; Data curation, Y.J.; Formal analysis, C.-H.P.; Funding acquisition, Y.-S.S.; Investigation, Y.J. and Y.-S.S.; Methodology, Y.J., C.-H.P., and Y.-S.S.; Project administration, C.-H.P., and Y.-S.S.; Software, Y.J. and C.-H.P.; Supervision, C.-H.P. and Y.-S.S.; Validation, Y.J. and Y.-S.S.; Visualization, Y.J.; Writing—original draft, Y.J., C.-H.P., and Y.-S.S.; Writing—review & editing, Y.J., C.-H.P., and Y.-S.S.

Funding

This work was supported by the 2018 Yeungnam University Research Grant.

Conflicts of Interest

The authors declare no conflicts of interest.

References

  1. Hermida, A. Twittering the news: The emergence of ambient journalism. Journal. Pract. 2010, 4, 297–308. [Google Scholar] [CrossRef]
  2. Procter, R.; Crump, J.; Karstedt, S.; Voss, A.; Cantijoch, M. Reading the riots: What were the police doing on Twitter? Polic. Soc. 2013, 23, 413–436. [Google Scholar] [CrossRef]
  3. Van Dijck, J. The Culture of Connectivity: A Critical History of Social Media; Oxford University Press: New York, NY, USA, 2013; pp. 3–18. [Google Scholar]
  4. Fuchs, C. Social Media: A Critical Introduction, 2nd ed.; SAGE Publications Ltd.: London, UK, 2017; pp. 33–61. [Google Scholar]
  5. Jeong, S.S.; Seo, Y.S. Improving response capability of chatbot using twitter. J. Ambient Intell. Humaniz Comput. 2019, 1–14. [Google Scholar] [CrossRef]
  6. Phuvipadawat, S.; Murata, T. Breaking news detection and tracking in Twitter. In Proceedings of the 2010 IEEE/WIC/ACM International Conference on Web Intelligence and Intelligent Agent Technology, Toronto, ON, Canada, 31 August–3 September 2010; pp. 120–123. [Google Scholar]
  7. Kwak, H.; Lee, H.; Park, H.; Moon, S. What is Twitter, a social network or a news media? In Proceedings of the 19th International Conference on World Wide Web, Raleigh, NC, USA, 26–30 April 2010; pp. 591–600. [Google Scholar]
  8. Yates, D.; Paquette, S. Emergency knowledge management and social media technologies: A case study of the 2010 Haitian earthquake. Int. J. Inf. 2011, 31, 6–13. [Google Scholar] [CrossRef]
  9. Yin, J.; Karimi, S.; Lampert, A.; Cameron, M.; Robinson, B.; Power, R. Using social media to enhance emergency situation awareness. In Proceedings of the Twenty-Fourth International Joint Conference on Artificial Intelligence, Buenos Aires, Argentina, 25–31 July 2015; pp. 4234–4238. [Google Scholar]
  10. Imran, M.; Castillo, C.; Diaz, F.; Vieweg, S. Processing social media messages in mass emergency: A survey. ACM Comput. Surv. 2015, 47, 1–38. [Google Scholar] [CrossRef]
  11. Huh, J.H. PLC-based design of monitoring system for ICT-integrated vertical fish farm. Hum. Centric Comput. Inf. Sci. 2017, 7, 1–19. [Google Scholar] [CrossRef]
  12. Sakaki, T.; Makoto, O.; Yutaka, M. Tweet analysis for real-time event detection and earthquake reporting system development. IEEE Trans. Knowl. Data Eng. 2012, 25, 919–931. [Google Scholar] [CrossRef]
  13. Internet Overtakes Newspapers As News Outlet. Available online: t.ly/2l7jR (accessed on 16 November 2019).
  14. Flanagin, A.J.; Miriam, M.J. Perceptions of Internet information credibility. Journal. Mass Commun. Q. 2000, 77, 515–540. [Google Scholar] [CrossRef]
  15. Johnson, T.J.; Kaye, B.K.; Bichard, S.L.; Wong, W.J. Every blog has its day: Politically-interested Internet users’ perceptions of blog credibility. J. Comput. Mediat. Commun. 2007, 13, 100–122. [Google Scholar] [CrossRef]
  16. Procter, R.; Vis, F.; Voss, A. Reading the riots on Twitter: Methodological innovation for the analysis of big data. Int. J. Soc. Res. Methodol. 2013, 16, 197–214. [Google Scholar] [CrossRef]
  17. Zubiaga, A.; Aker, A.; Bontcheva, K.; Liakata, M.; Procter, R. Detection and Resolution of Rumours in Social Media: A Survey. ACM Comput. Surv. 2018, 51, 1–36. [Google Scholar] [CrossRef]
  18. Starbird, K.; Maddock, J.; Orand, M.; Achterman, P.; Mason, R.M. Rumors, false flags, and digital vigilantes: Misinformation on twitter after the 2013 boston marathon bombing. In Proceedings of the iConference 2014, Berlin, Germany, 4–7 March 2014; pp. 654–662. [Google Scholar]
  19. DiFonzo, N.; Bordia, P. Rumor Psychology: Social and Organizational Approaches; American Psychological Association: Washington, DC, USA, 2007; pp. 5–15. [Google Scholar]
  20. DiFonzo, N.; Bordia, P.; Rosnow, R.L. Reining in rumors. Organ. Dyn. 1994, 23, 47–62. [Google Scholar] [CrossRef]
  21. Java, A.; Song, X.; Finin, T. Why we twitter: Understanding microblogging usage and communities. In Proceedings of the 9th WebKDD and 1st SNA-KDD 2007 Workshop on Web Mining and Social Network Analysis, San Jose, CA, USA, 12 August 2007; pp. 56–65. [Google Scholar]
  22. Robertson, S.P.; Vatrapu, R.K.; Medina, R. Off the wall political discourse: Facebook use in the 2008 US presidential election. Inf. Polity 2010, 15, 11–31. [Google Scholar] [CrossRef]
  23. Kushin, M.J.; Kitchener, K. Getting political on social network sites: Exploring online political discourse on Facebook. First Monday 2009, 14. [Google Scholar] [CrossRef]
  24. Halpern, D.; Gibbs, J. Social media as a catalyst for online deliberation? Exploring the affordances of Facebook and YouTube for political expression. Comput. Hum. Behav. 2013, 29, 1159–1168. [Google Scholar] [CrossRef]
  25. Pershad, Y.; Hangge, P.T.; Albadawi, H.; Oklu, R. Social medicine: Twitter in healthcare. J. Clin. Med. 2018, 7, 121. [Google Scholar] [CrossRef]
  26. Mustafaraj, E.; Metaxas, P.T. From obscurity to prominence in minutes: Political speech and real-time search. In Proceedings of the WebSci10: Extending the Frointer of Society On-Line, Raleigh, NC, USA, 26–27 April 2010; pp. 1–7. [Google Scholar]
  27. Tolmie, P.; Procter, R.; Rouncefield, M.; Liakata, M.; Zubiaga, A. Microblog Analysis as a Program of Work. ACM Trans. Soc. Comput. 2018, 1, 1–40. [Google Scholar] [CrossRef]
  28. Zhao, Z.; Resnick, P.; Mei, Q. Enquiring minds: Early detection of rumors in social media from enquiry posts. In Proceedings of the 24th International Conference on World Wide Web, Florence, Italy, 18–22 May 2015; pp. 1359–1405. [Google Scholar]
  29. Lazer, D.M.J.; Baum, M.A.; Benkler, J.; Berinsky, A.J.; Greenhill, K.M.; Menczer, F.; Metzger, M.J.; Nyhan, B.; Pennycook, G.; Rothschild, G.; et al. The science of fake news. Science 2018, 359, 1094–1096. [Google Scholar] [CrossRef]
  30. Allcott, H.; Gentzkow, M. Social Media and Fake News in the 2016 Election. J. Econ. Perspect. 2017, 31, 211–236. [Google Scholar] [CrossRef]
  31. Lukasik, M.; Srijith, P.K.; Vu, D.; Bontcheva, K.; Zubiaga, A.; Cohn, T. Hawkes processes for continuous time sequence classification: An application to rumour stance classification in twitter. In Proceedings of the 54th Annual Meeting of the Association for Computational Linguistics, Berlin, Germany, 7–12 August 2016; pp. 393–398. [Google Scholar]
  32. Schwarz, J.; Morris, M. Augmenting web pages and search results to support credibility assessment. In Proceedings of the SIGCHI Conference on Human Factors in Computing Systems, Vancouver, BC, Canada, 7–12 May 2011; pp. 1245–1254. [Google Scholar]
  33. Haciyakupoglu, G.; Hui, J.Y.; Suguna, V.S.; Leong, D.; Rahman, M.F.B.A. Countering Fake News: A Survey of Recent Global Initiatives; RSIS: Singapore, 2018; pp. 1–22. [Google Scholar]
  34. Garimella, K.; Weber, I.; De Choudhury, M. Quote RTs on Twitter: Usage of the new feature for political discourse. In Proceedings of the 8th ACM Conference on Web Science, Hannover, Germany, 22–25 May 2016; pp. 200–204. [Google Scholar]
  35. Del Pilar Salas-Zárate, M.; Paredes-Valverde, M.A.; Rodriguez-García, M.Á.; Valencia-García, R.; Alor-Hernández, G. Automatic detection of satire in Twitter: A psycholinguistic-based approach. Knowl. Based Syst. 2017, 128, 20–33. [Google Scholar] [CrossRef]
  36. Berghel, H. Lies, damn lies, and fake news. Computer 2017, 50, 80–85. [Google Scholar] [CrossRef]
  37. Tan, E.E.G.; Ang, B. Clickbait: Fake News and Role of the State. RSIS Comment. 2017, 26, 1–4. [Google Scholar]
  38. Klünder, J.; Schmitt, A.; Hohl, P.; Schneider, K. Fake news: Simply agile. In Projektmanagement und Vorgehensmodelle 2017-Die Spannung Zwischen dem Prozess und den Mensch im Projekt; Gesellschaft für Informatik: Bonn, Germany, 2017; pp. 187–192. [Google Scholar]
  39. Bessi, A.; Ferrara, E. Social bots distort the 2016 US Presidential election online discussion. First Monday 2016, 21, 1–14. [Google Scholar] [CrossRef]
  40. Kraski, R. Combating Fake News in Social Media: US and German Legal Approaches. St. John’s Law Rev. 2018, 91, 923–955. [Google Scholar]
  41. Buhrmester, M.; Kwang, T.; Gosling, S.D. Amazon’s Mechanical Turk: A new source of inexpensive, yet high-quality, data? Perspect. Psychol. Sci. 2011, 6, 3–5. [Google Scholar] [CrossRef]
  42. Castillo, C.; Mendoza, M.; Poblete, B. Information credibility on twitter. In Proceedings of the 20th International Conference on World Wide Web, Hyderabad, India, 28 March–1 April 2011; pp. 675–684. [Google Scholar]
  43. Kwon, S.; Cha, M.; Jung, K. Rumor detection over varying time windows. PLoS ONE 2017, 12, 1–19. [Google Scholar] [CrossRef]
  44. Foster, E.K.; Rosnow, R.L. Gossip and network relationships. Relating difficulty. Routledge 2013, 37, 177–196. [Google Scholar]
  45. Jin, Z.; Cao, J.; Zhang, Y.; Luo, J. News verification by exploiting conflicting social viewpoints in microblogs. In Proceedings of the Thirtieth AAAI Conference on Artificial Intelligence, Phoenix, AZ, USA, 12–17 February 2016; pp. 2972–2978. [Google Scholar]
  46. Blei, D.M.; Ng, A.Y.; Jordan, M.I. Latent dirichlet allocation. J. Mach. Learn. Res. 2003, 3, 993–1022. [Google Scholar]
  47. Yang, F.; Liu, Y.; Yu, X.; Yang, M. Automatic detection of rumor on sina weibo. In Proceedings of the ACM SIGKDD Workshop on Mining Data Semantics, Beijing, China, 12–16 August 2012; pp. 1–7. [Google Scholar]
  48. Liu, X.; Nourbakhsh, A.; Li, Q.; Fang, R.; Shah, S. Real-time rumor debunking on twitter. In Proceedings of the 24th ACM International on Conference on Information and Knowledge Management, Melbourne, Australia, 18–23 October 2015; pp. 1867–1870. [Google Scholar]
  49. Maddock, J.; Starbird, K.; Al-Hassani, H.J.; Sandoval, D.E.; Orand, M.; Mason, R.M. Characterizing online rumoring behavior using multi-dimensional signatures. In Proceedings of the 18th ACM Conference on Computer Supported Cooperative Work & Social Computing, Vancouver, BC, Canada, 14–18 March 2015; pp. 228–241. [Google Scholar]
  50. Zubiaga, A.; Liakata, M.; Procter, R.; Hoi, G.W.S.; Tolmie, P. Analysing how people orient to and spread rumours in social media by looking at conversational threads. PLoS ONE 2016, 11, 1–29. [Google Scholar] [CrossRef]
  51. Mendoza, M.; Poblete, B.; Castillo, C. Twitter under crisis: Can we trust what we RT. In Proceedings of the First Workshop on Social Media Analytics, Washington, DC, USA, 25–28 July 2010; pp. 71–79. [Google Scholar]
  52. Cheng, J.J.; Liu, Y.; Shen, B.; Yuan, W.G. An epidemic model of rumor diffusion in online social networks. Eur. Phys. J. B 2013, 86, 1–7. [Google Scholar] [CrossRef]
  53. Chua, A.Y.; Tee, C.Y.; Pang, A.; Lim, E.P. The retransmission of rumor-related tweets: Characteristics of source and message. In Proceedings of the 7th 2016 International Conference on Social Media & Society, London, UK, 11–13 July 2016; pp. 1–10. [Google Scholar]
  54. Vosoughi, S. Automatic Detection and Verification of Rumors on Twitter. Ph.D. Thesis, Massachusetts Institute of Technology, Cambridge, MA, USA, 7 May 2015. [Google Scholar]
  55. Giasemidis, G.; Singleton, C.; Agrafiotis, I.; Nurse, J.R.; Pilgrim, A.; Willis, C.; Greetham, D.V. Determining the veracity of rumours on Twitter. In Proceedings of the International Conference on Social Informatics, Bellevue, WA, USA, 11–14 November 2016; pp. 185–205. [Google Scholar]
  56. Loper, E.; Bird, S. NLTK: The Natural Language Toolkit. In Proceedings of the ACL-02 Workshop on Effective Tools and Methodologies for Teaching Natural Language Processing and Computational Linguistics, Philadelphia, PA, USA, 7 July 2002; pp. 63–70. [Google Scholar]
  57. Getting Real about Fake News. Available online: https://www.kaggle.com/mrisdal/fake-news (accessed on 16 November 2019).
  58. News Category Dataset. Available online: https://www.kaggle.com/rmisra/news-category-dataset (accessed on 16 November 2019).
  59. Tweepy Documentation. Available online: https://buildmedia.readthedocs.org/media/pdf/tweepy/v3.6.0/tweepy.pdf (accessed on 16 November 2019).
  60. Avasarala, S. Selenium WebDriver Practical Guide; Packt Publishing Ltd.: Birmingham, UK, 2014; pp. 7–10. [Google Scholar]
  61. Güera, D.; Delp, E.J. Deepfake video detection using recurrent neural networks. In Proceedings of the 2018 15th IEEE International Conference on Advanced Video and Signal Based Surveillance, Auckland, New Zealand, 27–30 November 2018; pp. 1–6. [Google Scholar]
  62. Package ‘nnet’. Available online: http://brieger.esalq.usp.br/CRAN/web/packages/nnet/nnet.pdf (accessed on 16 November 2019).
  63. Huh, J.H. Big data analysis for personalized health activities: Machine learning processing for automatic keyword extraction approach. Symmetry 2018, 10, 93. [Google Scholar] [CrossRef]
  64. Seo, Y.S.; Bae, D.H. On the value of outlier elimination on software effort estimation research. Empir. Softw. Eng. 2013, 18, 659–698. [Google Scholar] [CrossRef]
Figure 1. Search amount of fake news over time in Google Trend.
Electronics 08 01377 g001
Figure 2. A Tweet and major features of Twitter.
Electronics 08 01377 g002
Figure 3. An example of using Quote Retweet.
Electronics 08 01377 g003
Figure 4. The overview of the fake news analysis model.
Electronics 08 01377 g004
Figure 5. Data distribution boxplot of respective best features.
Electronics 08 01377 g005
Figure 6. The TW propagation trees of fake news and real news.
Electronics 08 01377 g006
Figure 7. The Tweet (TW) propagation tree of real news over time.
Electronics 08 01377 g007
Figure 8. The TW propagation tree of fake news over time.
Electronics 08 01377 g008
Table 1. The schema of TW_info.
RangeFieldsDescriptionType
Prime informationnewsTitle of mentioned news by tweetvarchar
parent_idParent tweet id of tweetvarchar
tweet_idTweet idvarchar
user_idWriter of tweetvarchar
uptimeUpload date and time of tweetdatetime
textText of tweetvarchar
rt_cntCount of tweetint
rep_cntCount of replyint
fav_cntCount of favoriteint
isQrtIs quote retweet? or not (1 or 0)int
hasImgInclude image in tweet?(1 or 0)int
hasVideoInclude video in tweet?int
isFakeIs fake news? or notint
depthDepth of tweet propagation treeint
Information of text in tweett_hasURLInclude URL in text of tweet?(1 or 0)int
t_hasAtInclude ‘@’ in text of tweet?int
t_hasSharpInclude ‘#’ in text of tweet?int
t_hasExclamInclude ‘!’ in text of tweet?int
t_hasQuestInclude ‘?’ in text of tweet?int
t_pos_cntCount of positive words in text?(1 or 0)int
t_neg_cntCount of negative words in text?int
t_bigword_cntCount of uppercase words in text?int
t_senti_scoreScore of sentiment of textfloat
User information of writer of tweetu_follower_cntCount of followers of writerint
u_following_cntCount of followings of writerint
u_tweet_cntCount of tweets(status) of writerint
u_createtimeCreated time of account of writerdatetime
u_hasBioInclude bio in profile of writer?(1 or 0)int
u_hasURLInclude URL in profile of writer?int
Table 2. Aggregation of variables by news (the schema of aggre_info).
FieldsDescriptionType
newsNews titlevarchar
avg_rt_cntAverage of count of retweetsfloat
avg_rep_cntAverage of count of repliesfloat
avg_fav_cntAverage of count of favoritesfloat
avg_depthAverage of depth of tweet propagation treefloat
rate_QrtRate of included quote retweetfloat
rate_imgRate of included imagefloat
rate_multiRate of included multimediafloat
rate_t_atRate of included ‘@’float
rate_t_sharpRate of included ‘#’float
rate_t_urlRate of included URL(in text of tweet)float
rate_t_exclamRate of included ‘!’float
rate_t_questRate of included ‘?’float
avg_t_pos_cntAverage of count of positive wordsfloat
avg_t_neg_cntAverage of count of negative wordsfloat
avg_t_bigword_cntAverage of count of uppercase wordsfloat
avg_t_senti_scoreAverage of score of sentimentfloat
avg_u_followersAverage of followers(of writer)float
avg_u_followingsAverage of followingsfloat
avg_u_tweetsAverage of tweetsfloat
avg_u_acc_ageAverage of age(day) of accountfloat
rate_u_bioRate of included biofloat
rate_u_URLRate of included URL(in profile of writer)float
isFakeIs fake? or notint
Table 3. Average value of best features.
URLReplyDepthFollowersTweetsAccountQrtImageMultimedia
Fake0.6495.240.33765,905.1248,033.72203.10.3150.1940.297
Real0.9166.750.656282,666.762,391.92450.70.6200.1480.253
Table 4. The t-test results of features.
Variablesp-Value
rate _t_URL2.2 × 10−16
avg_reply_cnt0.426
avg_depth2.2 × 10−16
avg_u_follower_cnt2.2 × 10−16
avg_u_tweets_cnt1.841 × 10−9
avg_u_acc_age2.2 × 10−16
rate_Qrt2.2 × 10−16
rate_img9.968 × 10−6
rate_multi0.032
Table 5. The t-test results of features.
Fake NewsReal News
average propagation period (days)706.61107.72
Table 6. Definition of classification modes by Learning features.
Classification ModelsTweet RangeLearning Features
Model 1only STCastillo’s best features.
Model 2ST + QRTAll features. (in Table 2)
Model 3ST + QRTBest features. (in Table 3)
Table 7. Classification accuracy by classification model.
TargetFake NewsReal NewsTotal (Fake + Real)
Models
Model 170.09%71.36%70.93%
Model 274.57%81.87.%80.72%
Model 383.05%75.3576.57%

