Article

A Computationally Efficient Mean Sound Speed Estimation Method Based on an Evaluation of Focusing Quality for Medical Ultrasound Imaging

1
Department of Electronic Engineering, Sogang University, Seoul 04107, Korea
2
Interdisciplinary Program of Integrated Biotechnology, Sogang University, Seoul 04107, Korea
3
Department of Biomedical Engineering, Inje University, Kimhae 50834, Korea
*
Authors to whom correspondence should be addressed.
Electronics 2019, 8(11), 1368; https://doi.org/10.3390/electronics8111368
Submission received: 4 October 2019 / Revised: 15 November 2019 / Accepted: 16 November 2019 / Published: 18 November 2019
(This article belongs to the Special Issue Design and Application of Biomedical Circuits and Systems)

Abstract

:
Generally, ultrasound receive beamformers calculate the focusing time delays of fixed sound speeds in human tissue (e.g., 1540 m/s). However, phase distortions occur due to variations of sound speeds in soft tissues, resulting in degradation of image quality. Thus, an optimal estimation of sound speed is required in order to improve image quality. Implementation of real-time sound speed estimation is challenging due to high computational and hardware complexities. In this paper, an optimal sound speed estimation method with a low-cost hardware resource is presented. In the proposed method, the optimal mean sound speed is determined by measuring the amplitude variance of pre-beamformed radio-frequency (RF) data. The proposed method was evaluated with phantom and in vivo experiments, and implemented on Virtex-4 with Xilinx ISE 12.4 using VHDL. Experiment results indicate that the proposed method could estimate the mean optimal sound speed and enhance spatial resolution with a negligible increase in the hardware resource usage.

1. Introduction

Digital dynamic receive beamforming has been adopted for improving spatial resolution and contrast-to-noise ratios (CNRs) in medical ultrasound imaging [1,2,3]. In digital receive beamforming, a constant sound speed in human tissue (e.g., 1540 m/s) is typically assumed when generating dynamic receive focusing phase delays. However, phase distortions are introduced due to the variations of sound speeds that occur in soft tissue, leading to defocusing and consequent degradations in image quality [4]. Moreover, the degradation of image quality can significantly reduce diagnostic capability in breast or obese patient imaging, since the sound speed in fatty tissues (e.g., 1450 m/s) is lower than assumed value (e.g., 1540 m/s) [5].
Various phase aberration correction methods have previously been proposed to compensate for the phase distortions [6,7,8,9,10,11,12,13]. Representatively, cross-correlation-based [6,7,8,9] and speckle-brightness-based [10] phase aberration correction methods have been proposed. Recently, methods combined with adaptive beamforming methods have been proposed [11,12,13] that can improve the quality of whole images, but the implementation of these methods is still challenging due to their high computational complexity [13,14]. In the nearest-neighbor cross-correlation (NNCC) method [6,12,13], the number of multiplications is expressed approximately as N m u l t = N 1 × K i m a g e × L i m a g e × M , where N, Limage and Kimage are the number of channels, scanlines and samples per a scanline in the whole image, respectively, and M is the total number of samples that contribute to the cross-correlation function. For an abdominal image with depth of 160 mm, the number of multiplications is approximately 1.3 billion ×   M when N =128, Limage = 256 and Kimage = 4k; thus, the implementation of these methods in real time would be challenging.
Using the correct mean sound speed can be an alternative solution for minimizing the phase distortions and enhancing the image quality in medical ultrasound imaging. Various algorithms for estimating sound speed have been proposed [14,15,16,17,18,19,20], and beam-tracking-based sound speed estimation methods using two transducers has been proposed [15,16]. This method can provide accurate local sound speeds; however, its clinical application is limited since the method uses two transducers. A direct estimation method that estimates the sound speed based on best-fit of one-way geometric delay patterns from the pre-beamformed radio-frequency (RF) channel data has also been proposed [17,18]. However, the performance of this method is sensitive to the transducer array geometry (i.e., the transducer’s position) [18].
More recently, region-of-interest (ROI)-based optimal mean sound speed estimation methods have been proposed as a viable solution [14,19,20]. In these methods, the optimal mean sound speed that can produce the best focusing performance in the ROI is estimated rather than the actual sound speed in specific tissue type. The optimal mean sound speed is estimated using a lateral spatial fast Fourier transform (FFT) magnitude of beamformed data as the focusing quality factor [19]. Phase variations at each pre-beamformed RF channel data and coherent factors have been proposed as focusing quality factors to estimate the mean sound speed [14,20]. These methods have shown that image quality in the ROI can be improved by using optimal the mean sound speed in beamforming.
In this paper, we present a hardware-efficient optimal mean sound speed estimation method in which the focusing quality factor is measured by computing the minimum average sum of the absolute difference (MASAD) of pre-beamformed RF channel data, and thus enhance the spatial resolutions in medical ultrasound imaging. The proposed method estimates the mean sound speed that can provide improved image quality in the ROI for real-time imaging rather than full phase aberration correction. The proposed method was evaluated with phantom and in vivo experiments, and was implemented on a Virtex-4 FPGA (Field Programmable Gate Array) chip (Xilinx Instrument, San Jose, CA) with Xilinx ISE 12.4 using VHDL.

2. Materials and Methods

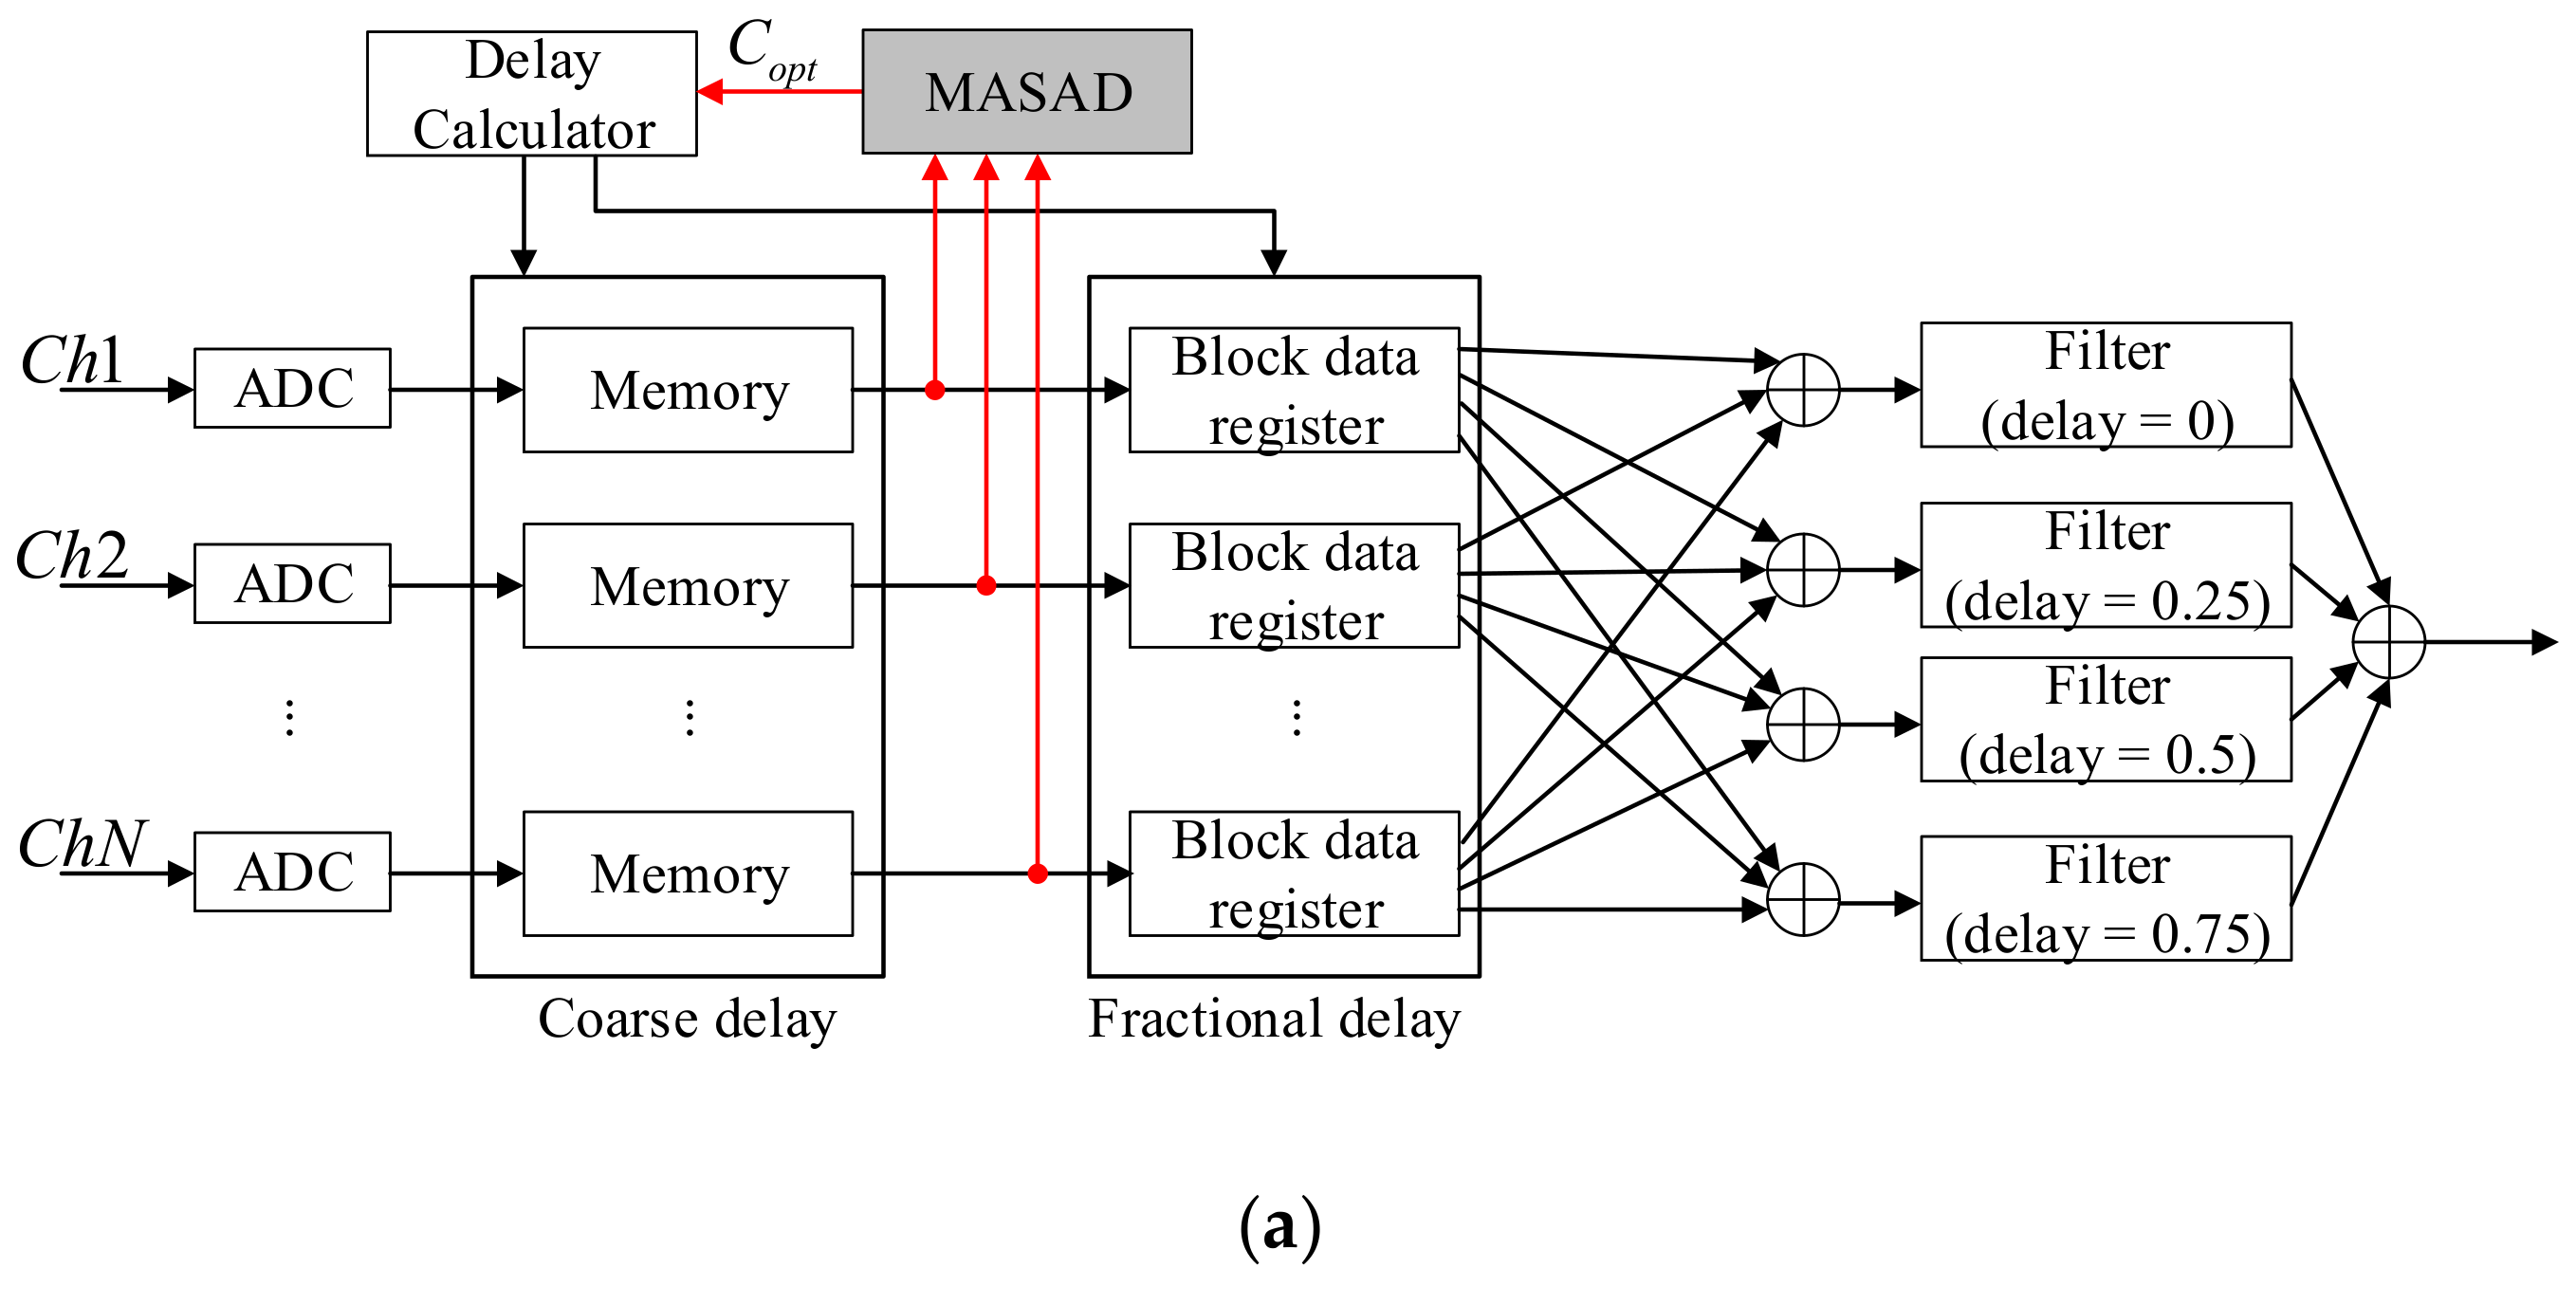
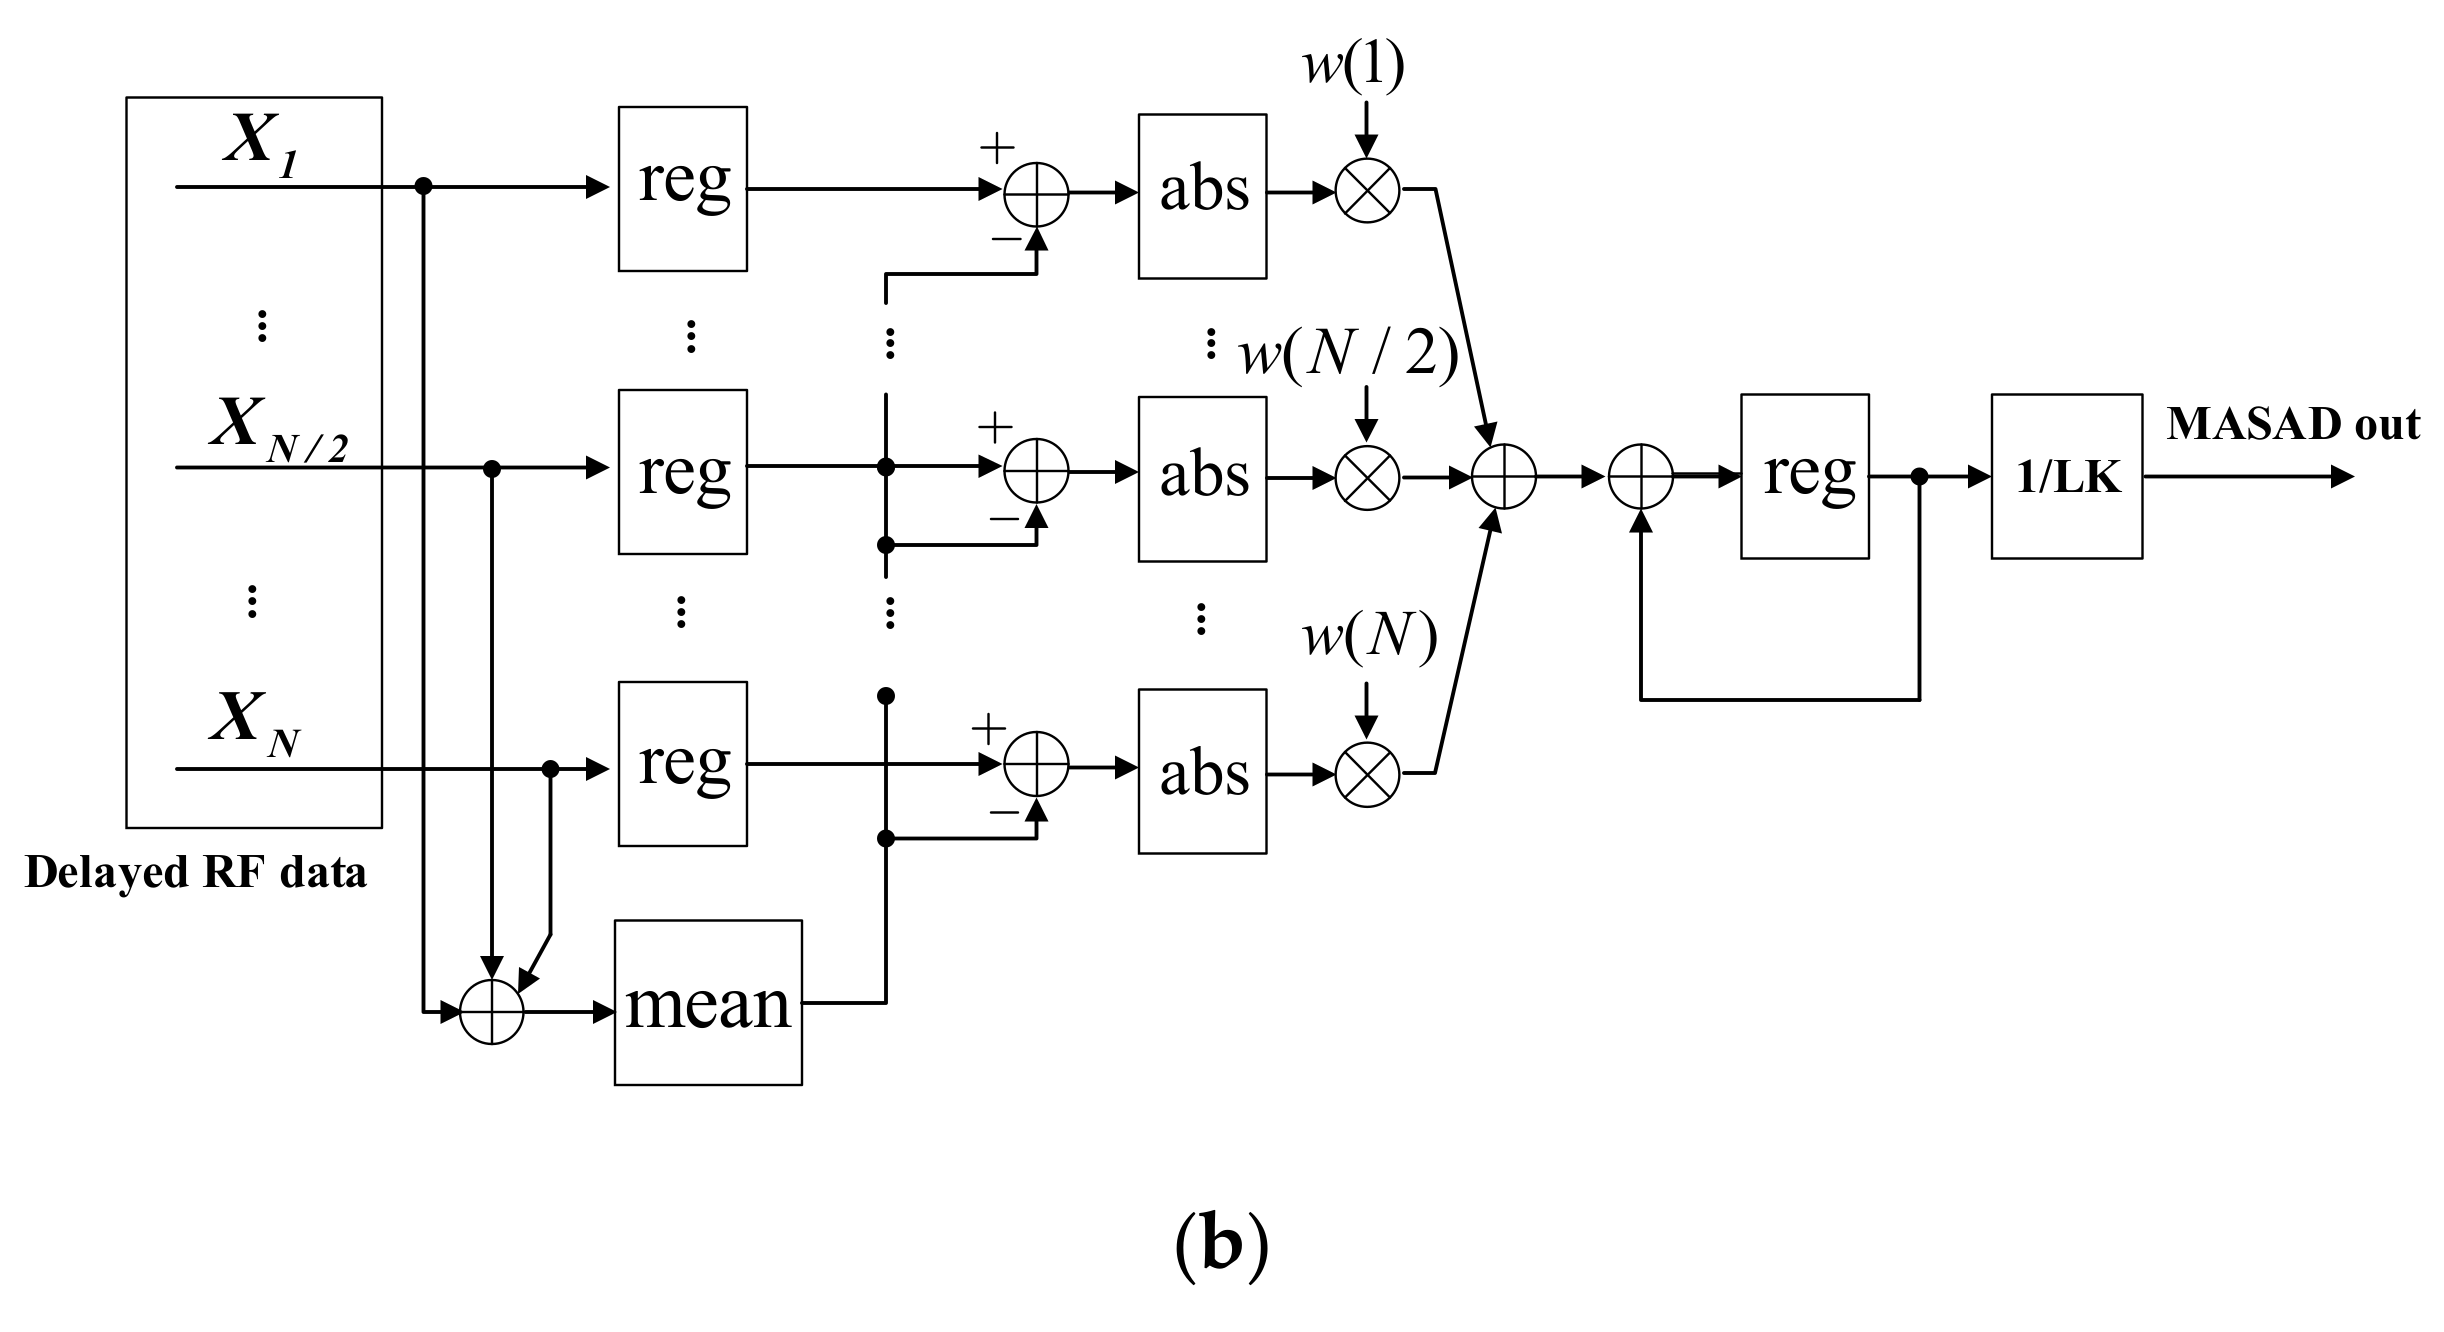
2.1. Minimum Average Sum of Absolute Difference (MASAD)

In ultrasound imaging systems, the dynamic receive focusing delays are computed based on the geometry of an ultrasound transducer and receive focusing points to adjust phase differences at each channel. The dynamic receive focusing delay of the nth element at (xn, zn), for a focal point at (x, z), is calculated by
τ n = ( x x n ) 2 + z z n 2 + R c
where R is a distance between the transducer center and the focal point, and c is the assumed sound speed in soft tissues (e.g., 1540 m/s) [21]. After applying receive focusing phase delay in Equation (1), all RF channel data are coherently aligned when the assumed fixed sound speed is equal to the actual sound speed in a propagation medium. However, when the sound speed of a medium is different from the assumed one, the phase distortion cannot be avoided even when the receive dynamic focusing is employed. Since the phase is directly related to the amplitude change of the RF data, these phase distortions cause the amplitude variations [7].
In the proposed method, the optimal mean sound speed is determined by computing the minimum average amplitude variance between all RF channel data after applying the receive dynamic focusing in the region of interest (ROI). Furthermore, we utilized the sum of the absolute difference in place of computing the variance to reduce the computational complexity. Thus, the cost function of sound speed estimation is defined by
c o p t = a r g m i n c = c + c i n c r 1 L K l = 0 L 1 k = 0 K 1 n = 0 N 1 X n l , k X m e a n l , k * w n
where N, L and K are the number of channels, scanlines and focal points per a scanline in the ROI, respectively. Xn (l, k) is the delayed RF data of the nth element for the kth focal point at the lth scanline in the ROI, Xmean (l, k) is the mean value of the delayed RF data and w(n) is the window function. The ROI can be set to around or beyond a transmit focusing point to minimize the effect from phase distortion in the near field. In the proposed estimation method, the pre-beamformed RF data in the ROI are first captured after freezing the image upon a user’s request. With an initial sound speed, the receive focusing delays are calculated using Equation (1). The focusing delays are applied to the captured RF data, and the average sum of the absolute difference (ASAD) in Equation (2) is computed. As indicated in Equation (2), the ASAD values are iteratively computed for the RF data in the ROI while changing the sound speed, and the sound speed providing the minimum ASAD (MASAD) value is determined as an optimal mean sound speed. Then, the estimated optimal mean sound speed is applied to subsequent real-time ultrasound beamforming to achieve the enhanced image quality.
Figure 1a shows a block diagram of a conventional dynamic receive beamformer (DRB) based on fractional delay beamforming architecture [22] with the proposed MASAD block, which is shaded gray. Pre-beamformed RF channel data from analog-to-digital converter (ADC) were 12 bit, which is typically used in medical ultrasound imaging systems. The signal to quantization noise ratio (SQNR) of typical ultrasound RF data is 74 dB, which is defined by SQNR = 6.02 b + 1.76 d B , where b is number of bits of ADC (i.e., 12 bit) [23]. The block diagram of the proposed MASAD is shown in Figure 1b. As shown in Figure 1b, the MASAD block can be implemented with N+2 register, N+2 adder, N absolute and N multiplier where N is the number of channels in the receive beamformer. To implement the proposed MASAD, input registers (pre-beamformed RF data), window coefficients and output register were 12 bits (12 integral bits), 8 bits (1 signed bit and 7 fractional bits) and 28 bits (21 integral bits and 7 fractional bits), respectively. Since we calculated the ASAD values without any truncation, the error between floating point calculation by PC and fixed point calculation by FPGA was less than 0.03%. The additional hardware for the MASAD block is not be a significant burden to the ultrasound imaging systems.

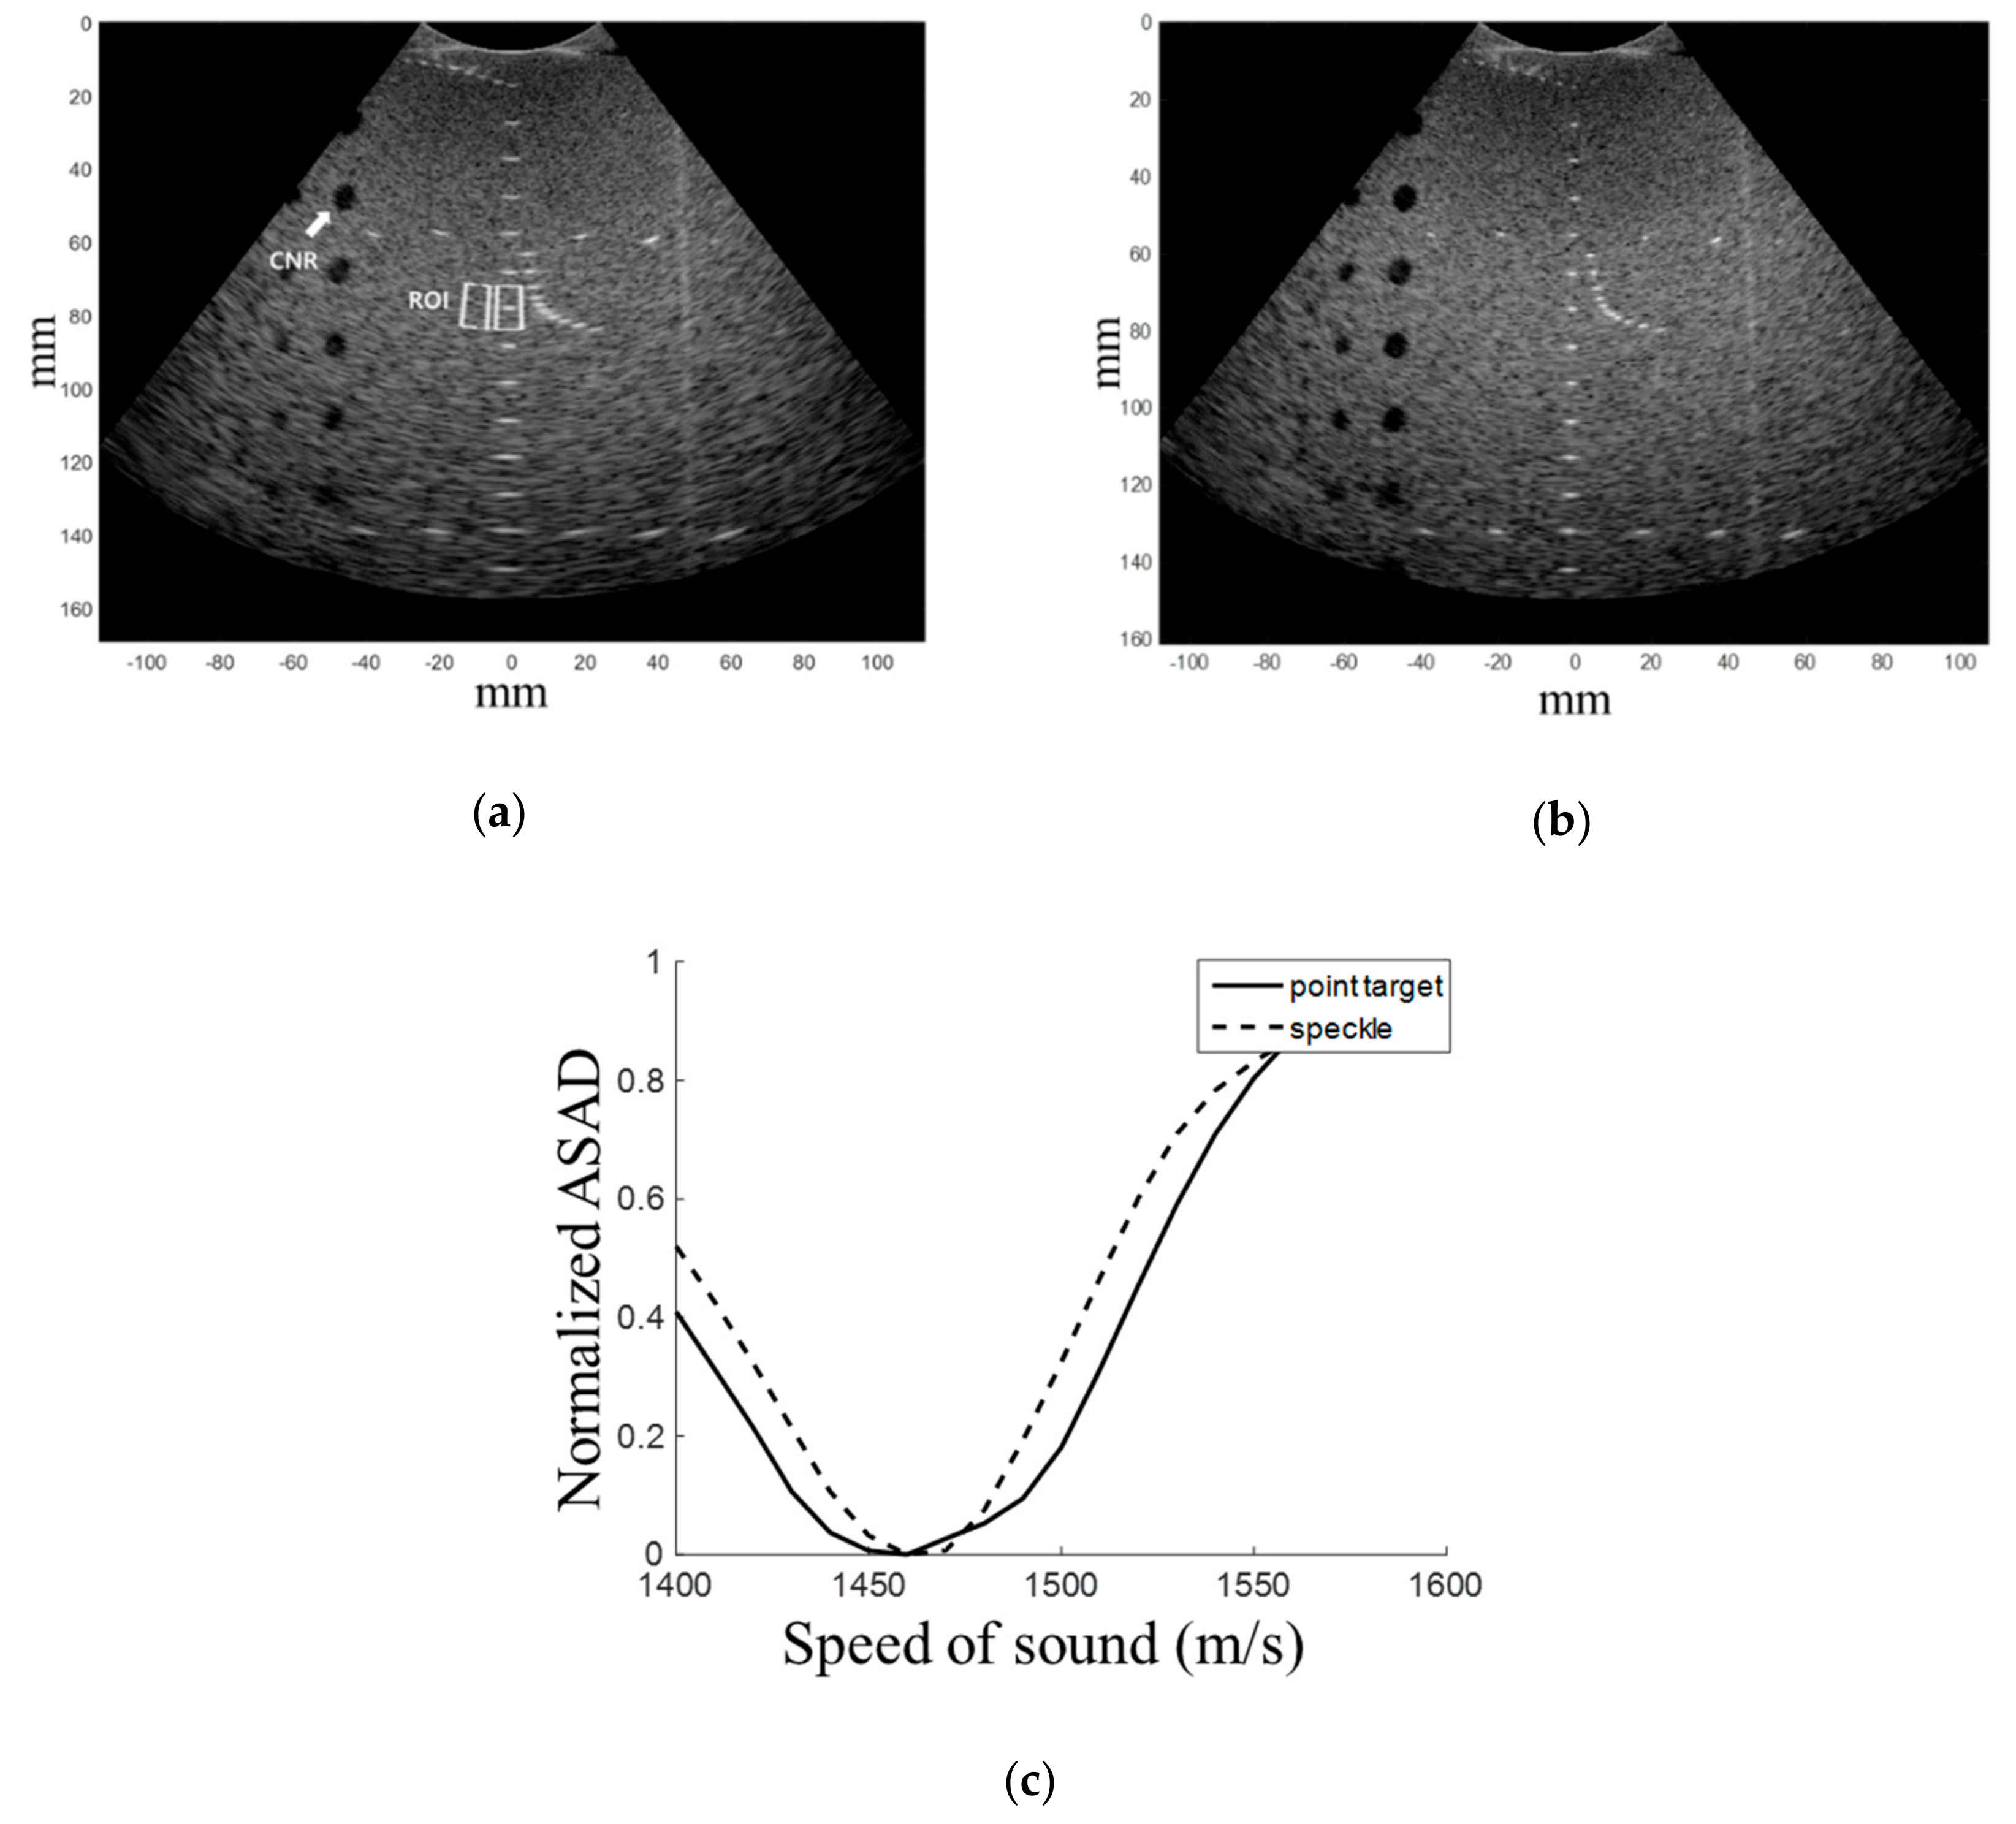
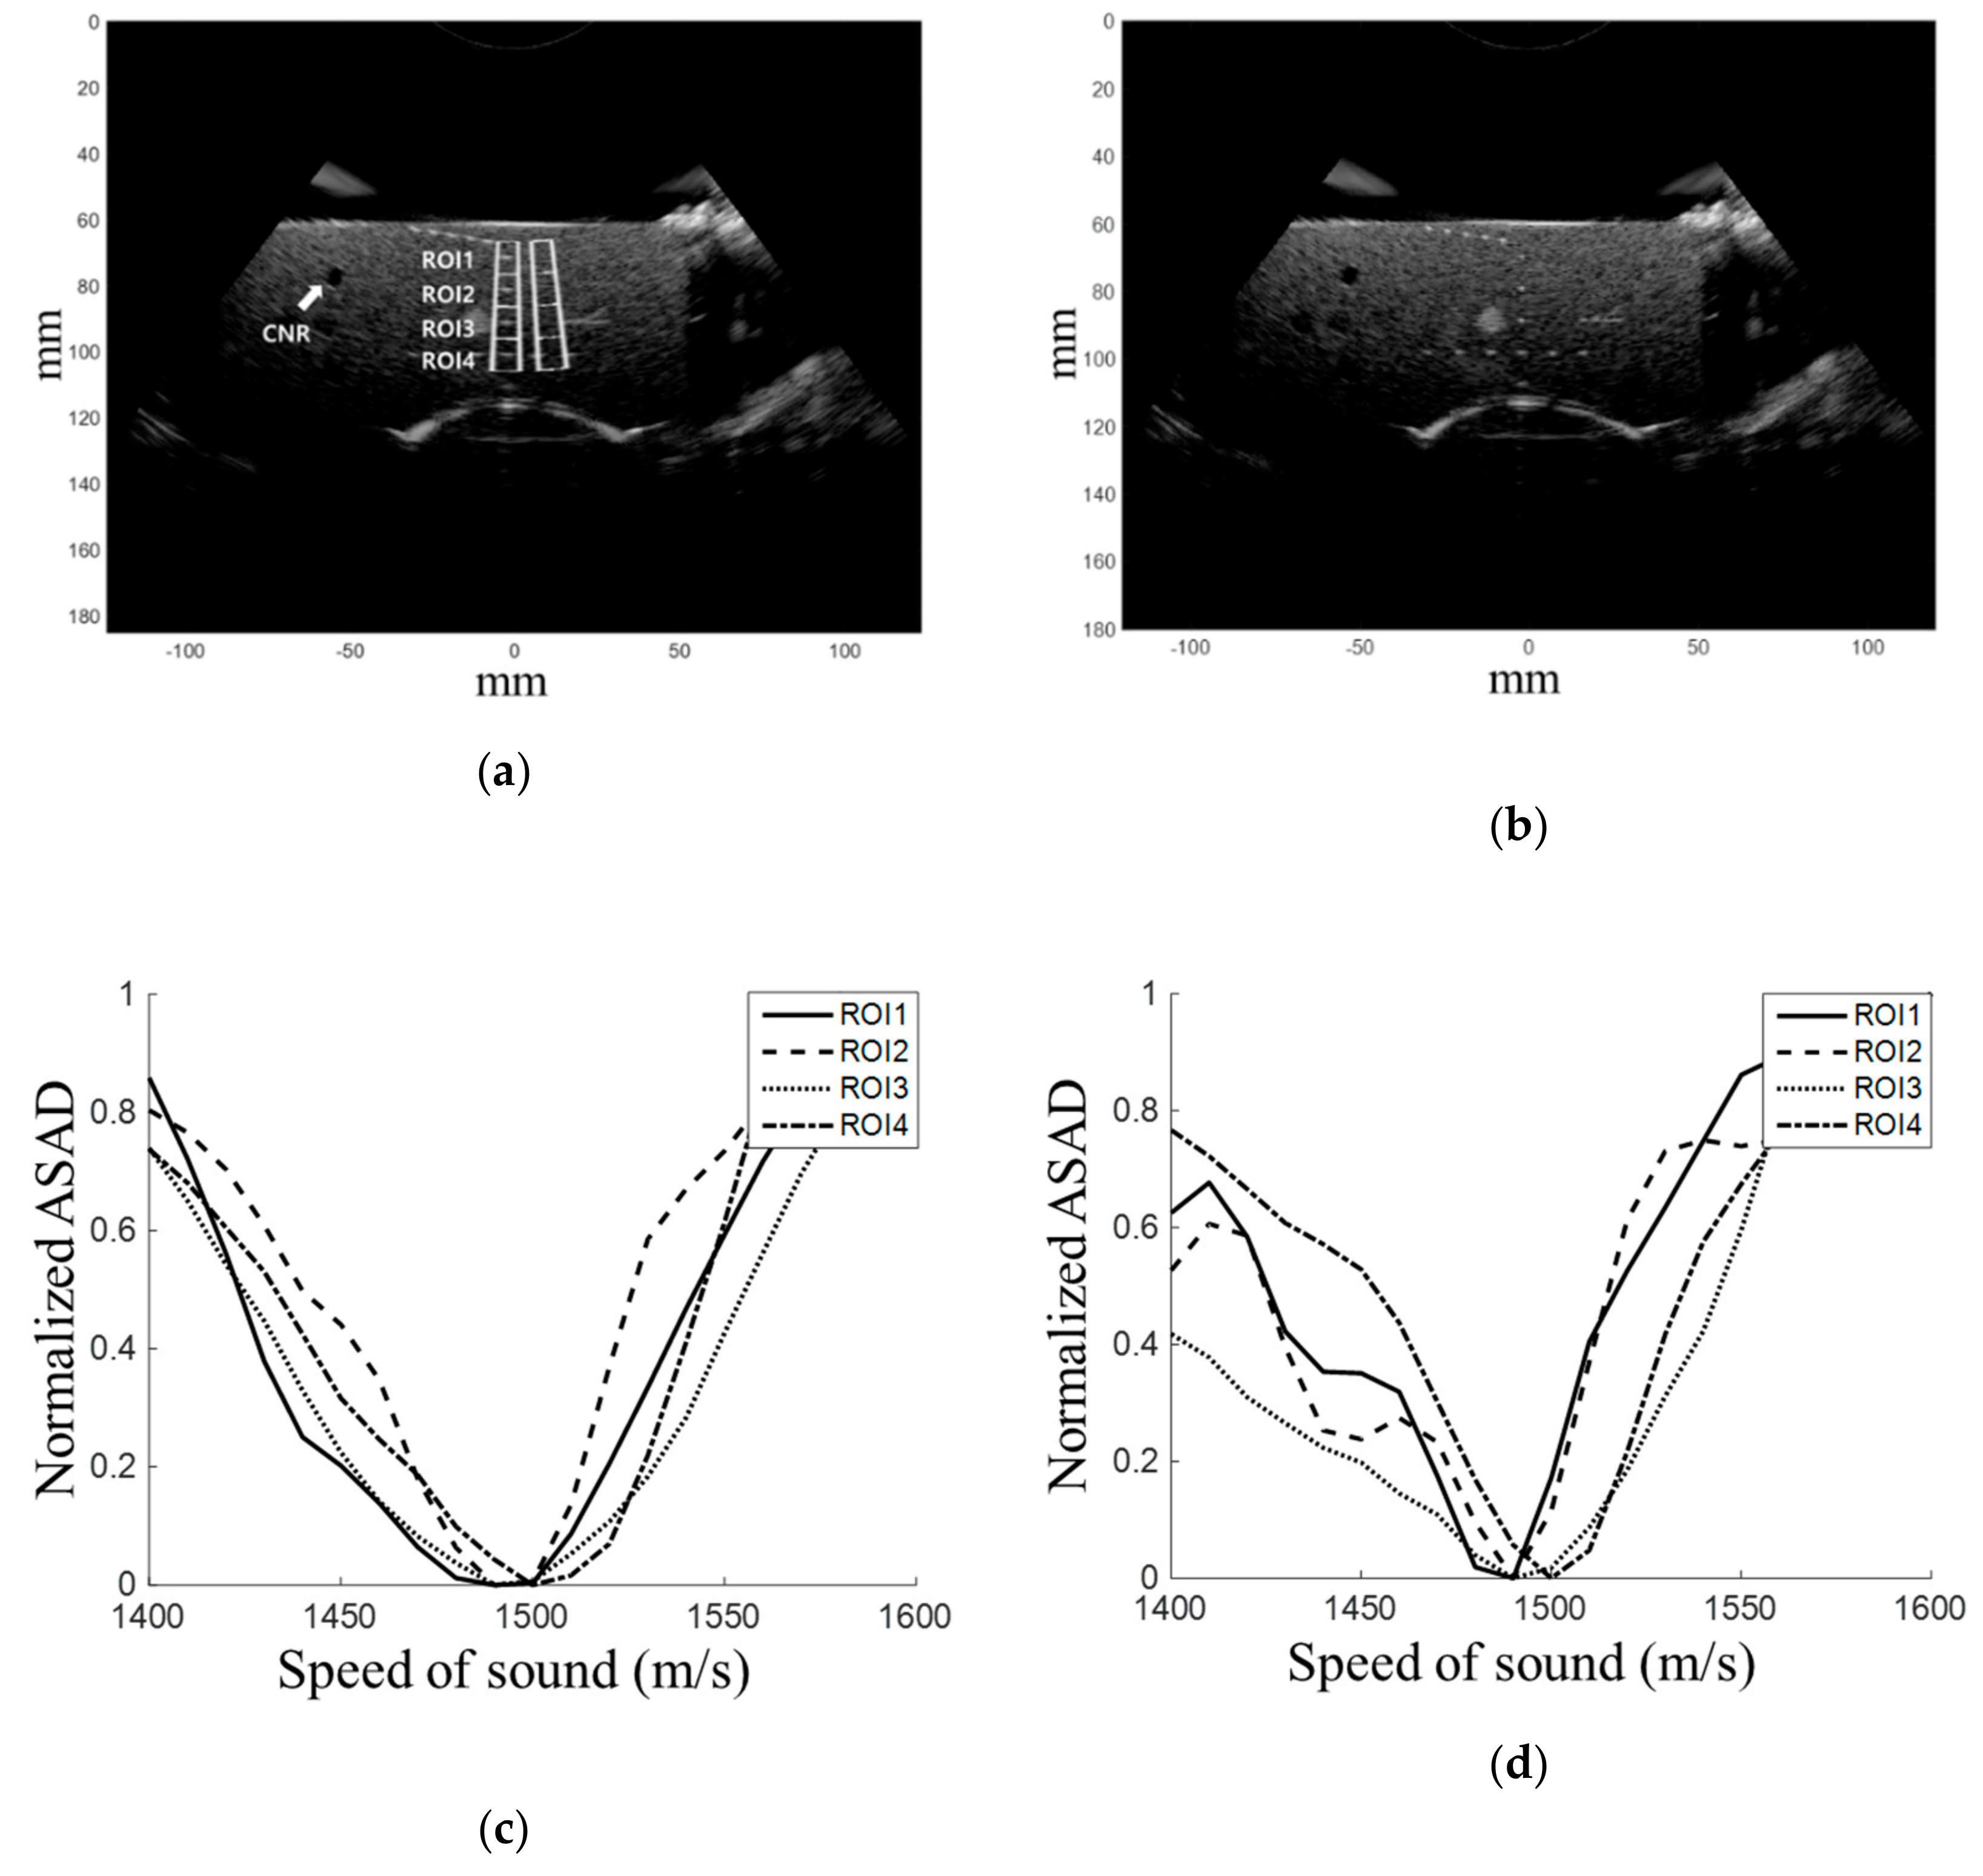
2.2. Experiment Setup and Evaluation Metrics

To evaluate the proposed MASAD method, an ultrasound research system (Vantage 128, Verasonics Inc., Redmond, WA, USA) was used to obtain pre-beamformed RF data using a 128-element convex array transducer (C5-2v, Ultrasonix Inc., British Columbia, Canada). The center frequency and sampling rate were 3.7 and 14.8 MHz, respectively. For the homogeneous medium experiment, a tissue-mimicking phantom (ATS 539, ATS Laboratories Inc., Bridgeport, CT, USA) with a sound speed of 1450 m/s ( ± 1% error) was used. In the inhomogeneous medium experiment, a tissue-mimicking phantom (040 GSE, CIRS Inc, Norfolk, VA, USA), for which the sound speed was 1540 m/s ( ± 1% error), was immersed in deionized water and pre-beamformed RF data were acquired. Note that the sound speed of deionized water at room temperature is 1480 m/s [24,25]. The in vivo data were acquired from the liver of a healthy volunteer. To compute the MASAD, the sound speed was changed from 1400 m/s (cinit) to 1600 m/s (cmax) in 10 m/s (cincr) increments for each iteration process.
For quantitative evaluation, the lateral resolution was measured with the full width at half maximum (FWHM) for each of the two cases where the conventional sound speed (i.e., 1540 m/s) and the estimated one are employed. The contrast-to-noise ratio (CNR) values were computed for the cyst region by [26]
C N R = μ c μ s ( σ c 2 + σ s 2 )
where μs and μc are the average intensities in the speckle and cyst regions, respectively, and σ s 2 and σ c 2 are the variances at each region.
The proposed MASAD sound speed estimation method was implemented on a FPGA (Virtex 4, Xilinx, San Jose, CA, USA) chip. In the experiments, the captured pre-beamformed RF data within a ROI were loaded in the custom-built FPGA platform [27], and then computed ASAD values were transferred to a PC to estimate the optimal sound speed. The hardware complexity was estimated by using Xilinx’s ISE 12.4.

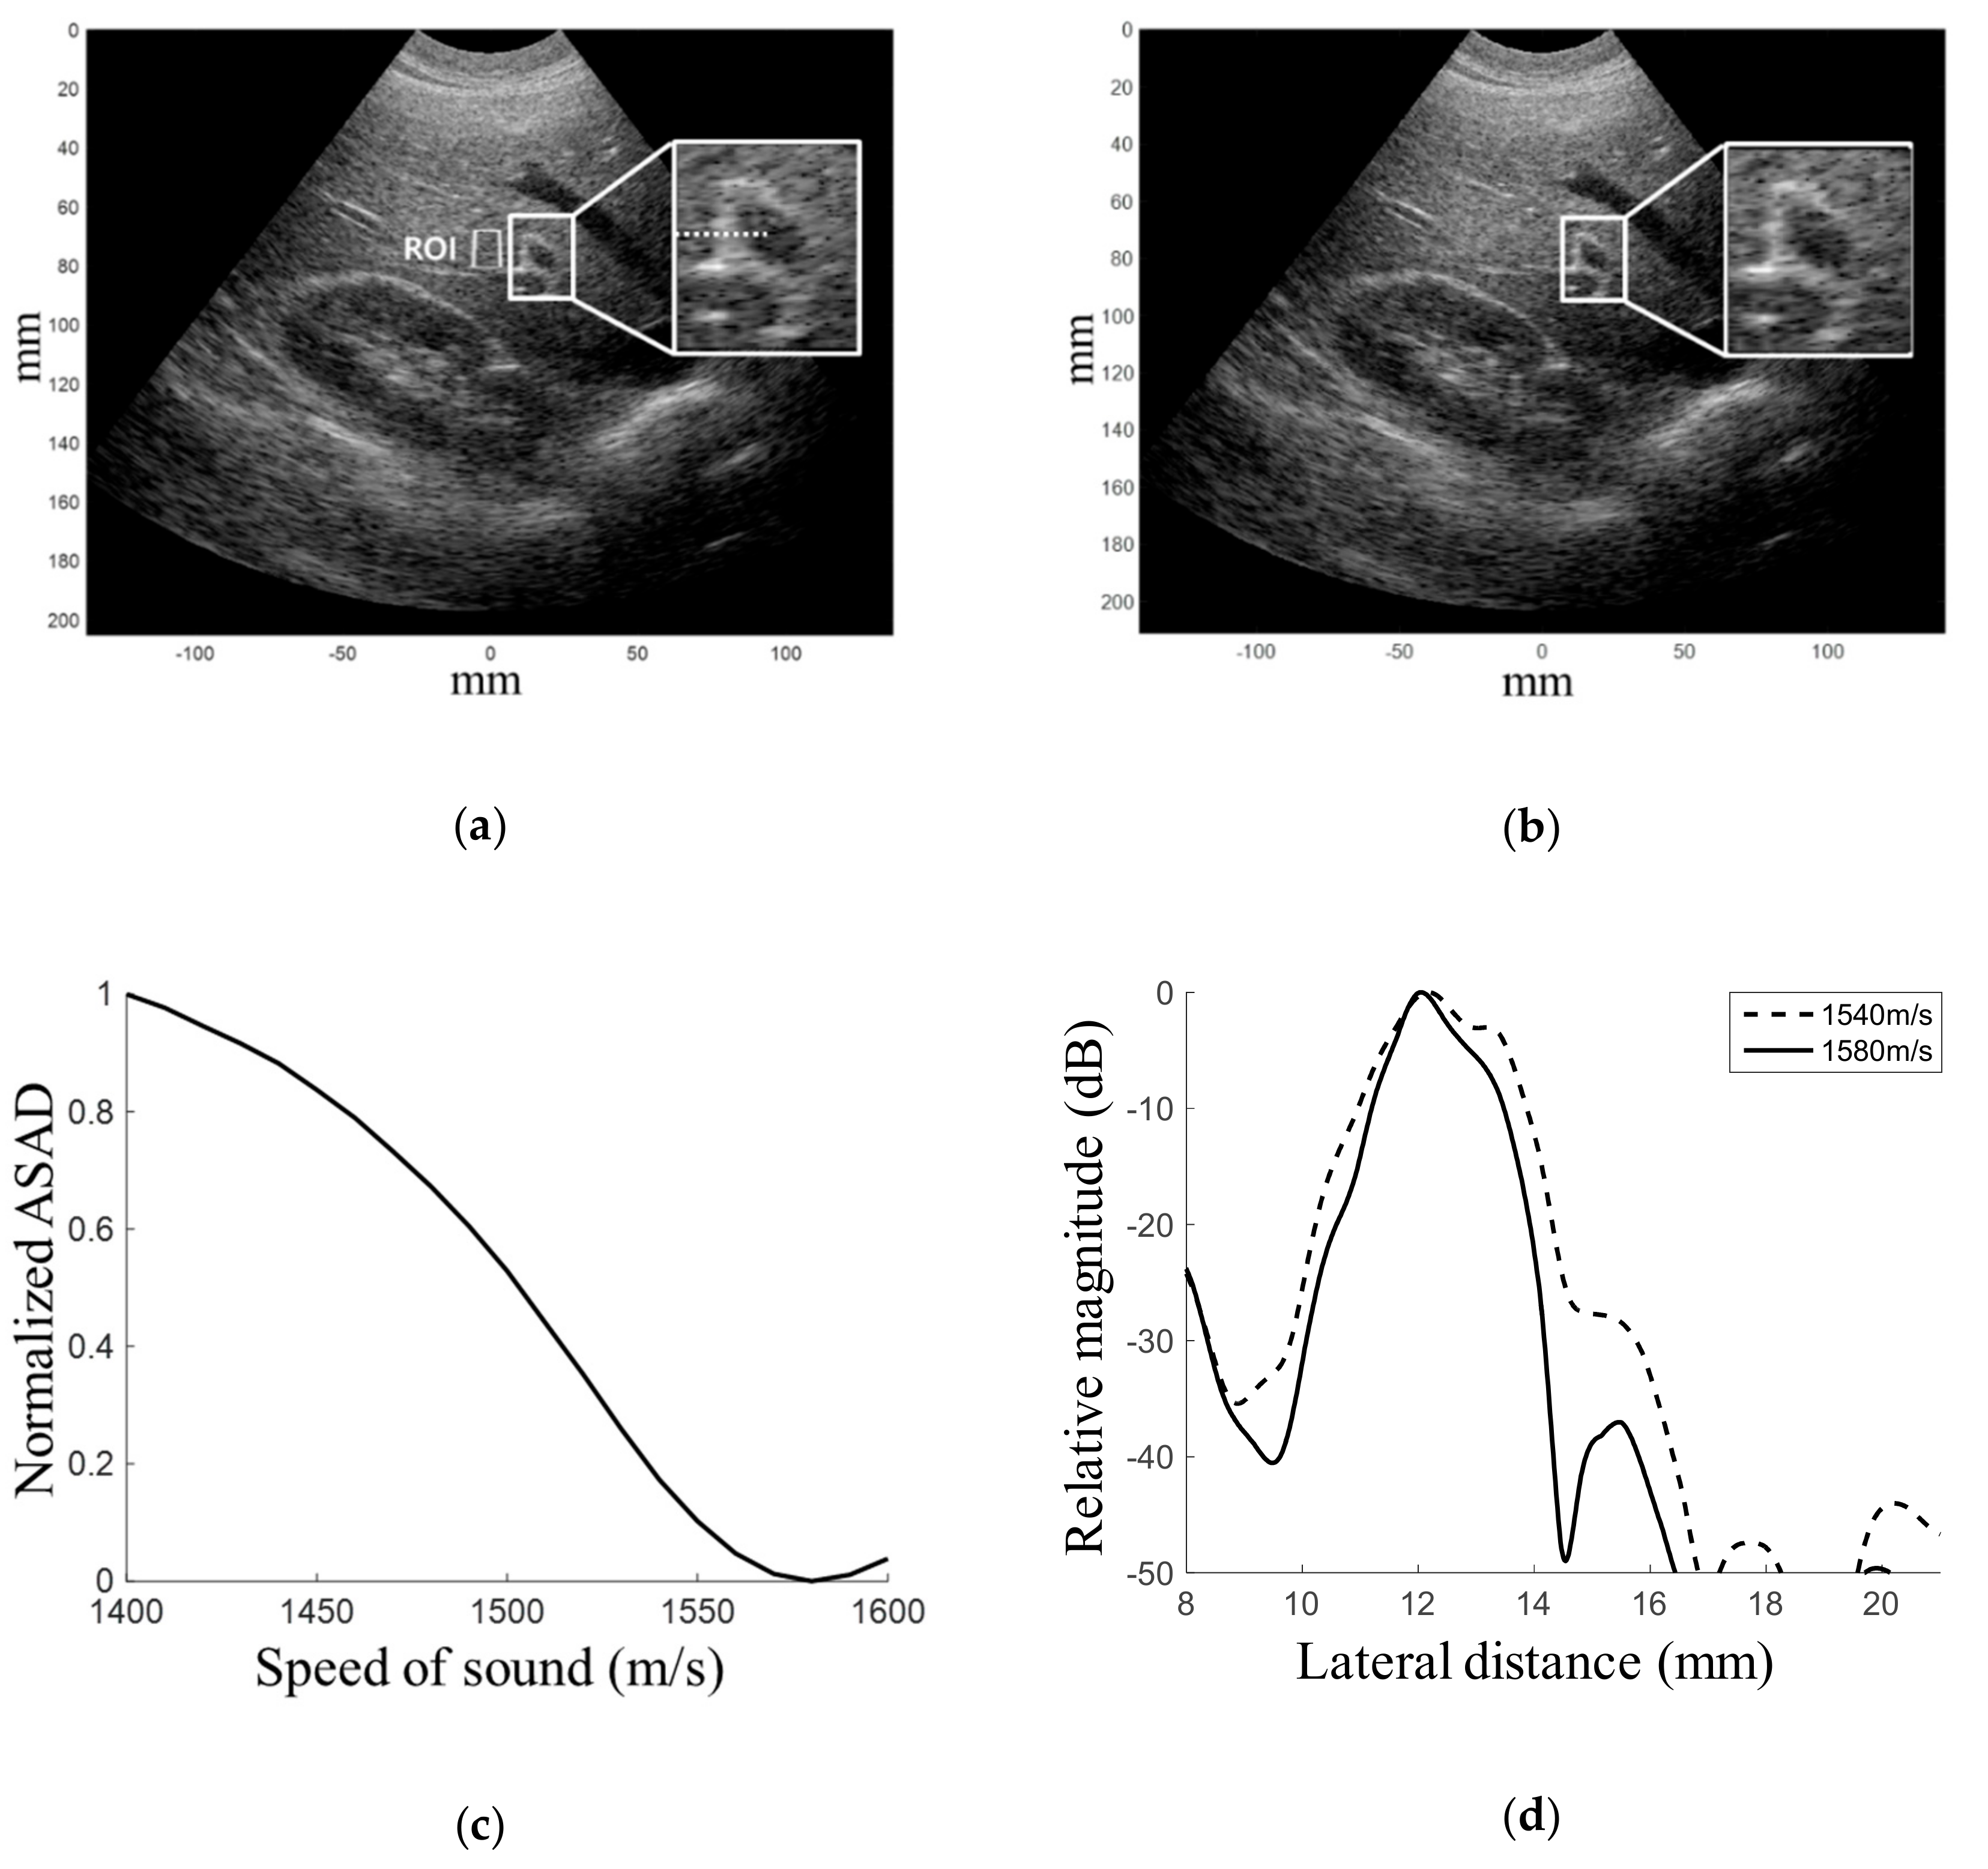
3. Results and Discussion

The results from homogeneous phantom experiments are shown in Figure 2. Figure 2a shows the B-mode image with a conventional sound speed (i.e., 1540 m/s); ROIs are indicated with white boxes to compute ASAD. The ROIs were selected around the transmit focusing point at 80 mm, and one ROI had a strong reflector while the other was a speckle region. Figure 2c shows the normalized ASAD values for each ROI. As can be seen, the estimated mean sound speed was 1460 m/s, which was within the fabrication error (i.e., 1450 m/s ( ± 1% error)). The image with the estimated sound speed is shown in Figure 2b. Under the visual assessment, the improved spatial resolution can be readily identified when the estimated sound speed is used in dynamic receive beamforming. For quantitative comparison, the FWHM from the point target in the ROI was measured and showed 1.55 mm for the conventional sound speed and 1.05 mm for estimated one, indicating that the FWHM was improved by 33. 3% using the proposed method. The CNR of the cyst indicated with an arrow in Figure 2a was measured for each image, which were 2.83 in Figure 2a and 4.20 in Figure 2b; the CNR was improved by 48.4%. This result demonstrates that a higher CNR could be achieved using the estimated sound speed in beamformation.
The results of the inhomogeneous medium experiment are shown in Figure 3. In this experiment, the sound speeds were estimated for the ROIs with and without a strong reflector, which are indicated in Figure 3a. The ADAS values for each ROIs as a function of sound speed are plotted in Figure 3c,d. As shown in Figure 3c,d, the same sound speed (i.e., 1490 m/s) was estimated for ROI-1, -2 and 3 using the proposed MASAD, and 1500 m/s was estimated for ROI-4. The actual sound speeds for each ROI were calculated by c = d w + d p c w c p / c p d w + c w d p , where dw is the propagation distance in water (i.e., 50 mm), dp is the phantom (i.e., 10, 20, 30 and 40 mm) for each ROI; cw is the sound speed in water (i.e., 1480 m/s) and cp is the phantom (i.e., 1540 m/s); and the actual sound speeds for each ROI were 1490, 1497, 1502 and 1506 m/s, respectively. These discrepancies between the estimation results and actual sound speeds were within the range of fabrication error (i.e.,   ± 1%). The B-mode image with the estimated sound speed (i.e, 1490 m/s) is shown in Figure 3b. As can be seen, the image with the estimated sound speed yielded a better quality image than the image obtained with a conventional sound speed (i.e., 1540 m/s). The FWHMs for ROI-1, -2, -3 and -4 with the estimated sound speed were 0.76, 0.69, 0.79 and 1.11 mm, respectively, while those with the conventional sound speed were 1.85, 1.34, 2.1 and 2.21 mm, respectively. The CNR values from the cyst indicated with a white arrow in Figure 3a were 1.89 and 2.53 for sound speeds of 1540 and 1490 m/s, respectively. The improvement of FWHM was 54.90% on average and CNR was improved by 33.9%.
Figure 4a,b shows the liver images constructed by using the conventional and estimated sound speeds, respectively. The ASAD as a function of sound speed is plotted in Figure 4c. As can be seen, the sound speed of 1580 m/s yielded MASAD, which is within the typical range of sound speed in human livers (i.e.,1550–1600 m/s) [28]. To clearly show the improvement of image quality, the profiles of the blood vessel wall in the white box are plotted in Figure 4d. The image with the estimated sound speed of 1580 m/s produced shaper edges than that with the conventional sound speed (i.e., 1540 m/s). The wall thickness with the conventional sound speed was 2.18 mm while it was 1.60 mm for the estimated one, indicating that the lateral resolution was improved by 26.6%. The CNR values inside the blood vessel improved 22.0%, and were 1.27 and 1.55 for the conventional and estimated sound speeds, respectively.
The time for estimating an optimal sound speed depends on the size of the ROI and is expressed as t e s t = N × L × K × N i t e r / f c l k , where N i t e r is the number of iteration processes and f c l k is the system clock used in the ultrasound imaging system. In the above experiments, we used L = 10, K = 200, N = 128, N i t e r = 20 and f c l k = 40 Mhz, and the processing time was 0.128 s. Note that the estimation of the optimal sound speed was conducted to frozen images upon user request and subsequent beamforming was performed using the estimated sound speed; thus, the time for the processing would not affect the real-time operation.
The hardware complexity of the 32-channel dynamic receive beamformer with the MASAD block was estimated by utilizing the Xilinx ISE 12.4. The hardware utilization of the conventional DRB and the proposed DRB with the MASAD block are summarized in Table 1. As listed in Table 1, the hardware utilization of the proposed DRB with the MASAD slightly increased over the conventional DRB; 0.8% and 0.7% in slice LUTs and slice flip flops, respectively. These results indicate that the proposed method is capable of substantially improving the spatial resolution in medical ultrasound imaging and can be implemented with nearly a negligible increase in hardware complexity.

4. Conclusions

In this paper, a hardware-efficient mean sound speed method based on the minimum average sum of the absolute difference was presented for enhancing the spatial resolutions of medical ultrasound imaging. From the phantom and in vivo experiments, FWHM and CNR improved by an average of 46.41% and 134.77%, respectively. The proposed method demonstrated that it can improve spatial resolution with a negligible increase in hardware complexity. We believe that the proposed method would be a viable solution for estimating optimal sound speeds and could provide improved image quality. Further experiments in various clinical environments should be followed to validate the performance of proposed method.

Author Contributions

Conceptualization, supervision, and funding Acquisition, C.Y. and T.-K.S.; methodology, J.L. and C.Y.; validation, J.L. Y.Y. and C.Y.; writing—original draft preparation, J.L. and C.Y.; writing—review and editing, C.Y., Y.Y. and T.-K.S.

Funding

This work was supported in part by a National Research Foundation of Korea (NRF) grant funded by the Korea government (MSIP; Ministry of Science, ICT & Future Planning) (No. 2019R1A2C1089813) and the R&D program of MOTIE/KEIT (10076675, Development of MR Based High Intensity Focused Ultrasound Systems for Brain and Urinogenital Diseases).

Conflicts of Interest

The authors declare no conflict of interest.

References

  1. Song, T.; Park, S. A new digital phased array system for dynamic focusing and steering with reduced sampling rate. Ultrason. Imaging 1990, 12, 1–16. [Google Scholar] [CrossRef]
  2. Steinberg, B.D. Digital beamforming in ultrasound. IEEE Trans. Ultrason. Ferroelectr. Freq. Control 1992, 39, 716–721. [Google Scholar] [CrossRef] [PubMed]
  3. Mucci, R. A Comparison of Efficient Beamforming Algorithms. IEEE Trans. Ultrason. Ferroelectr. Freq. Control 1984, 32, 548–558. [Google Scholar] [CrossRef]
  4. Anderson, M.E.; McKeag, M.S.; Trahey, G.E. The impact of sound speed errors on medical ultrasound imaging. J. Acoust. Soc. Am. 2000, 107, 3540–3548. [Google Scholar] [CrossRef] [PubMed]
  5. Inagaki, K.; Arai, S.; Namekawa, K.; Akiyama, I. Sound Velocity Estimation and Beamform Correction by Simultaneous Multimodality Imaging with Ultrasound and Magnetic Resonance. Appl. Sci. 2018, 8, 2133. [Google Scholar] [CrossRef]
  6. Flax, S.W.; O’Donnell, M. Phase-aberration correction using signals from point reflectors and diffuse scatterers: Basic principles. IEEE Trans. Ultrason. Ferroelectr. Freq. Control 1998, 35, 758–767. [Google Scholar] [CrossRef] [PubMed]
  7. Karaman, M.; Atalar, A.; Koymen, H.; O’Donnell, M. A phase aberration correction method for ultrasound imaging. IEEE Trans. Ultrason. Ferroelectr. Freq. Control 1993, 40, 275–282. [Google Scholar] [CrossRef] [PubMed]
  8. Li, P.C.; O’Donnell, M. Phase aberration correction on two-dimensional conformal arrays. IEEE Trans. Ultrason. Ferroelectr. Freq. Control 1995, 42, 73–82. [Google Scholar]
  9. Behar, V. Techniques for phase correction in coherent ultrasound imaging systems. Ultrasonics 2002, 39, 603–610. [Google Scholar] [CrossRef]
  10. Nock, L.; Trahey, G.E.; Smith, S.W. Phase aberration correction in medical ultrasound using speckle brightness as a quality factor. J. Acoust. Soc. Am. 1989, 85, 1819–1833. [Google Scholar] [CrossRef]
  11. Mozumi, M.; Hasegawa, H. Adaptive beamformer combined with phase coherence weighting applied to ultrafast ultrasound. Appl. Sci. 2018, 8, 204. [Google Scholar] [CrossRef]
  12. Ziksari, M.S.; Asl, B.M. Combined phase screen aberration correction and minimum variance beamforming in medical ultrasound. Ultrasonics 2017, 75, 71–79. [Google Scholar] [CrossRef] [PubMed]
  13. Shin, J.; Yen, J.T. Synergistic enhancements of ultrasound image contrast with a combination of phase aberration correction and dual apodization with cross-correlation. IEEE Trans. Ultrason. Ferroelectr. Freq. Control 2012, 59, 2089–2101. [Google Scholar] [PubMed]
  14. Cho, M.H.; Kang, L.H.; Kim, J.S.; Lee, S.Y. An efficient sound speed estimation method to enhance image resolution in ultrasound imaging. Ultrasonics 2009, 49, 774–778. [Google Scholar] [CrossRef] [PubMed]
  15. Ophir, J. Estimation of speed of ultrasound propagation in biological tissues: A beam-tracking method. IEEE Trans. Ultrason. Ferroelectr. Freq. Control 1986, 33, 359–368. [Google Scholar] [CrossRef] [PubMed]
  16. Robinson, D.E.; Ophir, J.; Wilson, L.S.; Chen, C.F. Pulse-echo Ultrasound Speed Measurements: Progress and Prospects. Ultrasound Med. Biol. 1991, 17, 633–646. [Google Scholar] [CrossRef]
  17. Krucker, J.F.; Fowlkes, J.B.; Carson, P.L. Sound speed estimation using automatic ultrasound image registration. IEEE Trans. Ultrason. Ferroelectr. Freq. Control 2004, 51, 1095–1106. [Google Scholar] [CrossRef]
  18. Anderson, M.E.; Trahey, G.E. The direct estimation of sound speed using pulse–echo ultrasound. J. Acoust. Soc. Am. 1998, 104, 3099–3106. [Google Scholar] [CrossRef]
  19. Napolitano, D.; Chou, C.H.; McLaughlin, G.; Ji, T.L.; Mo, L.; DeBusschere, D.; Steins, R. Sound speed correction in ultrasound imaging. Ultrasonics 2006, 44, e43–e46. [Google Scholar] [CrossRef]
  20. Yoon, C.; Lee, Y.; Chang, J.; Song, T.; Yoo, Y. In vitro estimation of mean sound speed based on minimum average phase variance in medical ultrasound imaging. Ultrasonics 2011, 51, 795–802. [Google Scholar] [CrossRef]
  21. Kim, P.; Kang, J. A Pseudo-Dynamic Delay Calculation Using Optimal Zone Segmentation for Ultra-Compact Ultrasound Imaging Systems. Electronics 2019, 8, 242. [Google Scholar] [CrossRef]
  22. Cho, J.; Lee, J.; Song, J.; Kim, Y.; Song, T. A fractional filter-based beamformer architecture using postfiltering approach to minimize hardware complexity. IEEE Trans. Ultrason. Ferroelectr. Freq. Control 2007, 54, 1076–1079. [Google Scholar] [CrossRef]
  23. Kozmin, K.; Johansson, J.; Delsing, J. Level-crossing ADC performance evaluation toward ultrasound application. IEEE Trans. Circuits Syst. I Regul. Pap. 2008, 56, 1708–1719. [Google Scholar] [CrossRef]
  24. Del Grosso, V.A.; Mader, C.W. Speed of sound in pure water. J. Acoust. Soc. Am. 1972, 52, 1442–1446. [Google Scholar] [CrossRef]
  25. Bilaniuk, N.; Wong, G.S. Speed of sound in pure water as a function of temperature. J. Acoust. Soc. Am. 1993, 93, 1609–1612. [Google Scholar] [CrossRef]
  26. Üstüner, K.F.; Holley, G.L. Ultrasound Imaging System Performance Assessment—AAPM. Available online: http://www.aapm.org/meetings/03AM/pdf/9905-9858.pdf (accessed on 9 August 2003).
  27. Kang, J.; Yoon, C.; Lee, J.; Kye, S.; Lee, Y.; Chang, J.; Kim, G.; Yoo, Y.; Song, T. A system-on-chip solution for point-of-care ultrasound imaging systems: Architecture and ASIC implementation. IEEE Trans. Biomed. Circuits Syst. 2015, 10, 412–423. [Google Scholar] [CrossRef]
  28. Bamber, J.C.; Hill, C.R. Acoustic properties of normal and cancerous human liver—I. Dependence on pathological condition. Ultrasound Med. Biol. 1981, 7, 121–133. [Google Scholar] [CrossRef]
Figure 1. (a) Block diagram of the conventional dynamic receive beamformer (DRB) with the proposed MASAD and (b) the detailed block diagram of MASAD.
Electronics 08 01368 g001aElectronics 08 01368 g001b
Figure 2. Experiment results of the homogeneous medium. B-mode image with a sound speed of (a) 1540 m/s, (b) 1460 m/s and (c) normalized ASAD values for the region of interest (ROI) of the point target (solid line) and speckle regions (dotted line).
Electronics 08 01368 g002
Figure 3. Experiment results of the inhomogeneous medium. B-mode image with a sound speed of (a) 1540 m/s and (b) 1490 m/s, and normalized ASAD values for ROI-1, -2, -3 and -4 for the (c) point target and (d) speckle regions.
Electronics 08 01368 g003
Figure 4. In vivo experiment results for the liver. B-mode image with sound speeds of (a) 1540 m/s and (b) 1580m/s, and (c,d) normalized ASAD values for the ROI. Cross-section of the vessel wall indicated by a dotted line in Figure 4a.
Electronics 08 01368 g004
Table 1. Hardware resource of conventional and the proposed beamformers.
Hardware ResourceConventional DRBProposed DRB with MASAD
Slices24,659 (36%)24,722 (36%)
Flip Flops21,641 (16%)21,736 (16%)
Input LUTs28,994 (21%)29,083 (21%)
FIFO16/RAMB16s144 (50%)144 (50%)

