1. Introduction
Cyber-Physical Systems (CPS) refer to a generation of systems where physical processes are monitored and controlled from the cyber domain through advanced computation and communication technologies with humans in the loop [
1]. The prosperity of any nation is highly dependent on its energy sector: CPS for electricity, petroleum and natural gas. They serve hospitals, military, transportation, the production of goods and many more. CPS of the energy sector are interdependent, for instance, natural gas-operated electric plants that generate power; on the other hand, components of the natural gas plant require power for operation. The advancement of information technology provides the ability to system engineers to control critical physical processes remotely. An activity performed in the cyber domain affects the physical infrastructure or vice versa [
2]. For instance, if a system in the cyber domain controls and monitors the pressure of the natural gas in a pipeline and sends commands to change the pressure (increase the pressure via compressor station: physical domain) beyond maximum allowable operating pressure, this may allow gas to leak or destroy the walls of the pipeline, causing an explosion [
3].
Motivation: The growing interdependence between the cyber and physical domain has imposed extraordinary challenges on the security of CPS such as the Smart Grid (SG). A Stuxnet-style attack on the U.S. SG could cost
$1 trillion to the U.S. economy [
4]. Recent attacks on the Ukraine power grid [
5] and a U.S. gas pipeline [
6] indicate that Cyber-Physical Attacks (CPA) on CPS will be frequent. Such scenarios clearly show how vulnerable CPS are to CPA, and thus, it is crucial to identify, understand and evaluate the resilience of the CPS. Most researchers [
7,
8,
9,
10,
11,
12] assess the resilience of SG by considering an adversary controlling a cyber system that controls a physical process. The researchers then perform sensitivity analysis in a power simulator by manipulating a particular power grid functionality on behalf of an adversary. For instance, one can manipulate the power demand and supply to make the area frequency diverge beyond a secure threshold, which destabilizes the underlying power grid [
10,
11,
12]. To the best of our knowledge, no tool assists power engineers in monitoring the security status and quantifying the likelihood of the compromise of a cyber component of SG in real-time and guides them to allocate security resources efficiently. We are among the first to present a Bayesian Attack Graph for Smart Grid (BAGS) tool that performs these tasks. Our key contribution is to show how this tool assists power engineers in improving the security status of the cyber domain of the grid. Furthermore, we combine the results of the tool with the results of the transient stability analysis of the power grid (using the function-based methodology) to quantify the overall risk.
In this paper, we present a comprehensive study of Smart Grid Resilience (SGR) in the presence of multiple CPA on its distinct functional components. We enlarge the surface area of attack by considering gas pipeline systems that supply fuel to Gas-operated Peaker Plants (GPP). We discuss: (1) the function-based methodology to evaluate SGR [
9,
10,
11,
12], (2) Bayesian Attack Graph for Smart Grid (BAGS) to compute the likelihood of the compromise of cyber components of SG [
13], (3) the risk analysis methodology, which combines the results of the function-based methodology and BAGS to compute risk for each cyber component and (4) efficient resource allocation using Reinforcement learning on the SG Bayesian graph (BAGS) [
14] to compute optimal policies about whether to perform vulnerability assessment or patch a cyber component of SG whose vulnerability has already been discovered. The results and analysis of these approaches help power engineers develop more resilient power systems and improve situational awareness and the response of the system to ongoing CPA. System engineers should maintain the status of various cyber functions (vulnerability status) and develop resilient algorithms to avoid system failure in the presence of compromised cyber components. This work sheds light on the interdependency between the cyber domain and power grid itself and demonstrates that the security of both worlds requires the utmost attention. We hope this work assists power engineers to protect the grid against future cyber-physical attacks.
The rest of the paper is organized as follows.
Section 2 discusses the related work.
Section 3 introduces the problem statement.
Section 4 describes the function-based methodology, and
Section 5 presents the BAGS tool.
Section 6 describes the risk assessment methodology to combine the results from
Section 4 and
Section 5.
Section 7 discusses the reinforcement learning approach to allocate resources efficiently. We discuss countermeasures in
Section 8.
Section 9 and
Section 10 conclude the paper by providing a conclusion and future work, respectively.
2. Related Work
In this section, we discuss various papers in the field of SG cyber-physical security. We divide the survey into two study sections: smart grid and cross infrastructure.
2.1. Smart Grid
One of the early studies that provided a way to analyze the impact of CPA on the power system was by Stamp et al. [
7]. The authors presented the idea of a “cyber-to-physical” bridge, which shows how attacks from the cyber domain propagate to the power domain. The bridge consists of four components: (1) attack vectors, (2) outcome of attacks, (3) technical effect on the grid and (4) grid impacts. The paper estimates the grid performance degradation by quantifying the grid reliability. The reliability is measured using various indices: Frequency Of Interruption (FOI), Loss Of Load Expectancy (LOLE), etc. The weakness of this approach is that it does not consider the dynamic nature of cyber-attacks and does not explain how attacks originate. Cardenas et al. [
15] demonstrated integrity attack on a chemical reactor to show how cyber-attacks impact a CPS. Through contingency simulations, they understood the behavior of a chemical reactor in the presence of attacks, and they described the attack detection methods and response to attacks. Sridhar et al. [
8,
16] emphasized the fact that SG is dependent on the cyber domain for monitoring and controlling, which broaden the surface area of attack. The paper provides details of the wide variety of attacks (integrity, replay, DDoS, etc.) and what their impact is on the SG.
AlMajali et al. [
9,
10] demonstrated the consequences of the load drop attack on the SGR. Through the combination of simulations in PowerWorld and Network Simulator, the authors showed how compromising the end nodes over Advanced Metering Infrastructure (AMI) of the SG to perform load drop attack destabilizes the underlying power grid. The parameter Time To Criticality is identified through simulations, and engineers should consider this while developing more resilient and robust algorithms for SG. Similarly, the authors in [
17] evaluated the resilience of the power grid by sending on/off commands (in order to drop (off) or increase (on) load) to a certain percentage of high wattage IoT devices (compromised as a part of a huge IoT botnet) such as air conditioners, electric heaters, etc. The authors in [
18] performed a detailed security analysis of the AMI to show different attack surfaces corresponding to various AMI components. In [
19], the authors performed packet replay attack against the authentication scheme over the AMI network. The packet replay attack drains the resources, similar to DDoS attacks, of the system. The results of the study show that there is an increase in authentication time due to replay attacks. The authors in [
20] modeled the propagation of a worm using the Weibull distribution over an AMI network. The Weibull distribution models the time needed for a smart meter in AMI to transit from a normal to malicious state. Through simulations in the Network Simulator, two parameters were identified that affect how fast the worm propagates within an AMI. First is the transmission range of meters, and second is the size of the worm. Finally, the authors discussed the physical consequences of the worm propagation in the power grid. The authors in [
21] proposed a distributed non-linear controller to improve the transient stability of synchronous generators in the presence of excessive communication delay (over AMI) and cyber-physical disturbances.
The concept of defining resilience using a Bayesian Network (BN) has frequently been used in securing CPS such as in [
22,
23,
24,
25]. Li et al. [
22] described a three-layer framework (static, dynamic and behavioral) that analyzes the risks introduced by the apps in the Android system. The authors modeled the system as a Bayesian risk graph. Similarly, in [
25], the authors have modeled IT infrastructure that assists administrators to compute the chances of compromise. The approaches discussed so far demonstrate how cyber-attacks affect the physical power domain, but they have failed to capture the dynamic behavior of attacks that are based on vulnerabilities associated with the components under attack. Furthermore, most of the researchers [
9,
10,
11] assumed a compromised cyber component from where attackers maliciously control physical processes. Very few [
18,
19,
20] focused on understanding the security status of the cyber domain. There is a need to develop a tool that provides the ability to perform an in-depth study from a functional level to the vulnerability level of any cyber function of SG. Power engineers not only monitor SG cyber components, but also compute their Probability of Compromise (PoC) using that tool.
Our research is different from current approaches since we model the SG system as a dynamic belief network. We compute the PoC of various cyber components of the SG using the Bayesian network. In
Section 5, we present the BAGS tool. We show how this tool assists power engineers in improving the security status of the cyber domain of the power grid.
2.2. Cross Infrastructure
The failure of a function in a system may propagate to another system and affect its resilience. For instance, a compromised compressor station can increase the gas pressure (leads to explosion [
3] or pipeline gas leakage) or decrease the gas pressure, which prevents gas delivery to GPP, causing loss of power generation and degrading SGR (see
Figure 1). Thus, it is crucial to identify and analyze the impact of various CPA on interdependent CPS.
The interdependency between CPS based on physical, geographical, cyber and logical [
26]. For instance, a compressor station receives power from a generator if it is situated geographically in the working area of the generator. The authors in [
27] analyzed the short-term impact of natural gas on power generation scheduling by formulating an optimization problem that tends to minimize the power generation cost. In [
28], the authors presented the qualitative model to model the interdependencies of the power and information system under the impact of cascading, escalating and malicious attacks. Erdener et al. [
29] described an integrated simulation model for analyzing electricity and gas systems. The authors assumed random failures in the SG network and analyzed their impact on the gas system and vice versa. However, the paper did not describe how those failures arise. The authors in [
30] presented the idea of a multi-agent system to prevent cascading failures in the power grid that might have originated because of CPA in the cyber domain. It is essential to understand how such attacks originate and what are the critical parameters to consider while developing resilient algorithms for the power system.
In
Section 4, we present a simulation-based approach to demonstrate attacks on multiple SG functions that affect SGR using the function-based methodology. We discuss two attack scenarios to simulate the transient stability of the grid in the PowerWorld simulator. In
Section 8, we provide sketches of countermeasures against those attack scenarios from both the grid and cyber system perspective. In the next section, we present the problem statement addressed in this paper.
3. Problem Statement
In this section, we present the problem statement and discuss the sub-questions related to the statement.
3.1. Problem Statement
“Given the components and functions of a smart grid system: How does one evaluate the resilience of the smart grid that is subject to the manipulation of its distinct functional components by different entities?”
3.2. What is Smart Grid Resilience?
Smart grid resilience is the ability of the SG system to avoid failure of its functions in the presence of non-malicious and malicious activities and to recover from those failures to an acceptable state without affecting power delivery [
11]. The power demand-supply mismatch affects SGR. The significant consequences of power demand-supply mismatch are load curtailment, load shedding and partial or complete power outage.
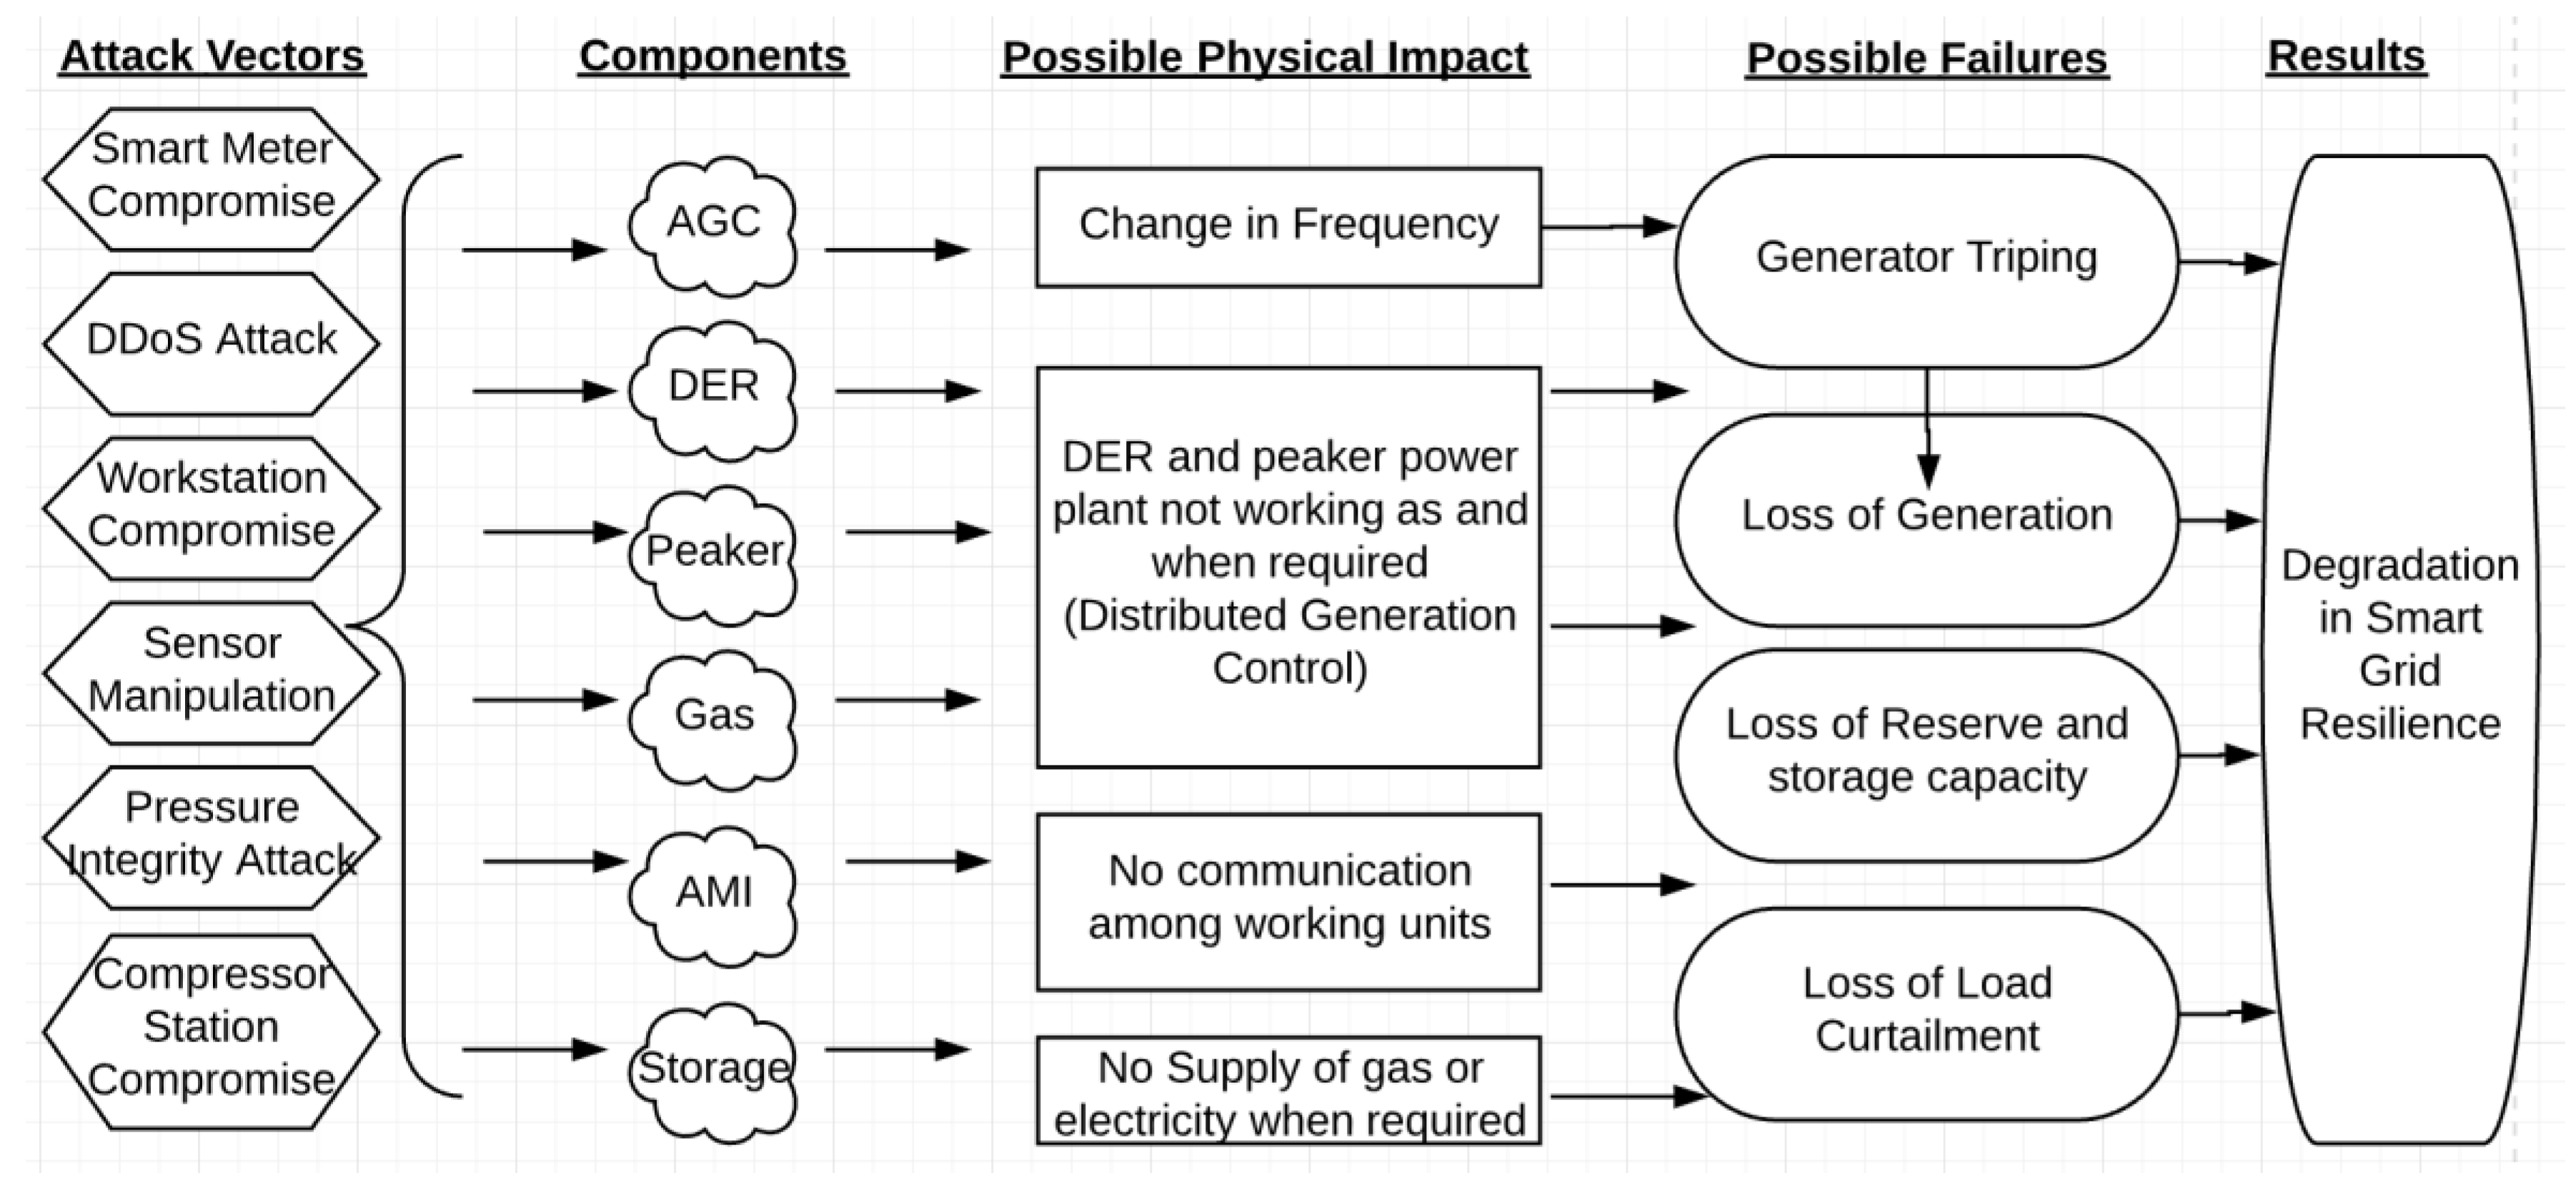
Figure 1 describes how a cyber-attack propagates from the cyber domain to SG and destabilizes SG. An adversary performs a variety of attacks on SG functions with the motive to control them (as shown in
Figure 1 first column). The compromised functions have a physical impact (such as a change in area frequency) that leads to partial or complete function failure (because of generator tripping due to the over or under frequency protection threshold), and this degrades SGR.
3.3. What Are Smart Grid Functions and Components?
Figure 1, second column, shows various components of the SG. They are: Automatic Generation Control (AGC), Distributed Energy Resources (DER), Communication Network consisting of Advanced Metering Infrastructure (AMI) and Sensor Communication Network (SCN), Demand Response (DR) and gas distribution pipeline providing natural gas to GPP. We do not describe these SG functions and components since they are already described many times in the literature.
3.4. Who (Entities) Performs Manipulation? Why and How They Perform?
The players interested in the SG systems are attackers, network engineers and customers. The primary motive of the attackers is to affect the SGR by performing malicious actions. The attackers are of two types based on the target they attack. The Cyber Attacker (CA) performs a variety of cyber-attacks such as malware injection, data integrity, unauthorized access, spear phishing and many more with the motive to control physical processes via the cyber domain. The Physical Attacker’s (PA) goal is to damage the physical machinery and components. The motive of the engineers is to protect the CPS from CPA and improve the system resilience. They allocate resources to patrol physical targets, monitor network traffic, perform vulnerability assessment and penetration testing of cyber components. Customers sometimes act as attackers who try to manipulate their consumption readings [
31] and steal electricity [
32] directly from the grid.
3.5. How to Allocate Resources Efficiently and Effectively to Maintain Smart Grid Resilience
System engineers are responsible for allocating resources with the motive to make CPS operations efficient, as well as secure. They make decisions from their experience of the system, consumption predictions, various types of attacks detected, the cost of deploying assets, the criticality of the system components and functions, whether components are vulnerable, etc. They must keep sufficient resources to fulfill the power demand and minimize the overall cost of the grid operation. In
Section 7, we tackle the problem of resource allocation in the SG cyber domain by proposing a tool, Reinforcement Learning-Bayesian Attack Graph for Smart Grid System (RL-BAGS). RL-BAGS extends the functionality of BAGS to compute optimal policies on regular intervals about whether to perform the vulnerability assessment of a cyber system of SG or patch a system whose vulnerabilities are already discovered.
4. Function-Based Methodology
In this section, we present the function-based methodology [
10,
12] to evaluate the SGR in the presence of CPA. First, we describe what the function-based methodology is. Second, how to apply the methodology to SG by considering a simple example, and finally results of the simulation.
4.1. Function-Based Methodology
In function-based methodology, we decompose a CPS into essential functions. A function refers to any task or critical mission of a component of the system. The first step of the methodology is to identify the function of the system and components on which this function depends. The primary motive is to narrow the focus to a particular function of the system. Second, an attack tree is created based on the dependencies of the chosen function. The attack tree abstracts the consequences of multiple attacks and demonstrates how attacks propagate from cyber to the physical domain. The third step is to perform a sensitivity analysis based on the first two steps with the motive to draw an acceptable boundary to represent system resiliency. It correlates the physical parameters and function failures. Finally, we perform a bottom-up analysis of the attack scenario, which validates that the attacks can propagate to the top nodes of the tree. The primary motive of this step is to demonstrate that at least one path may succeed that has an impact on the root node. In the next subsection, we describe how to use this methodology to model attacks on the SG.
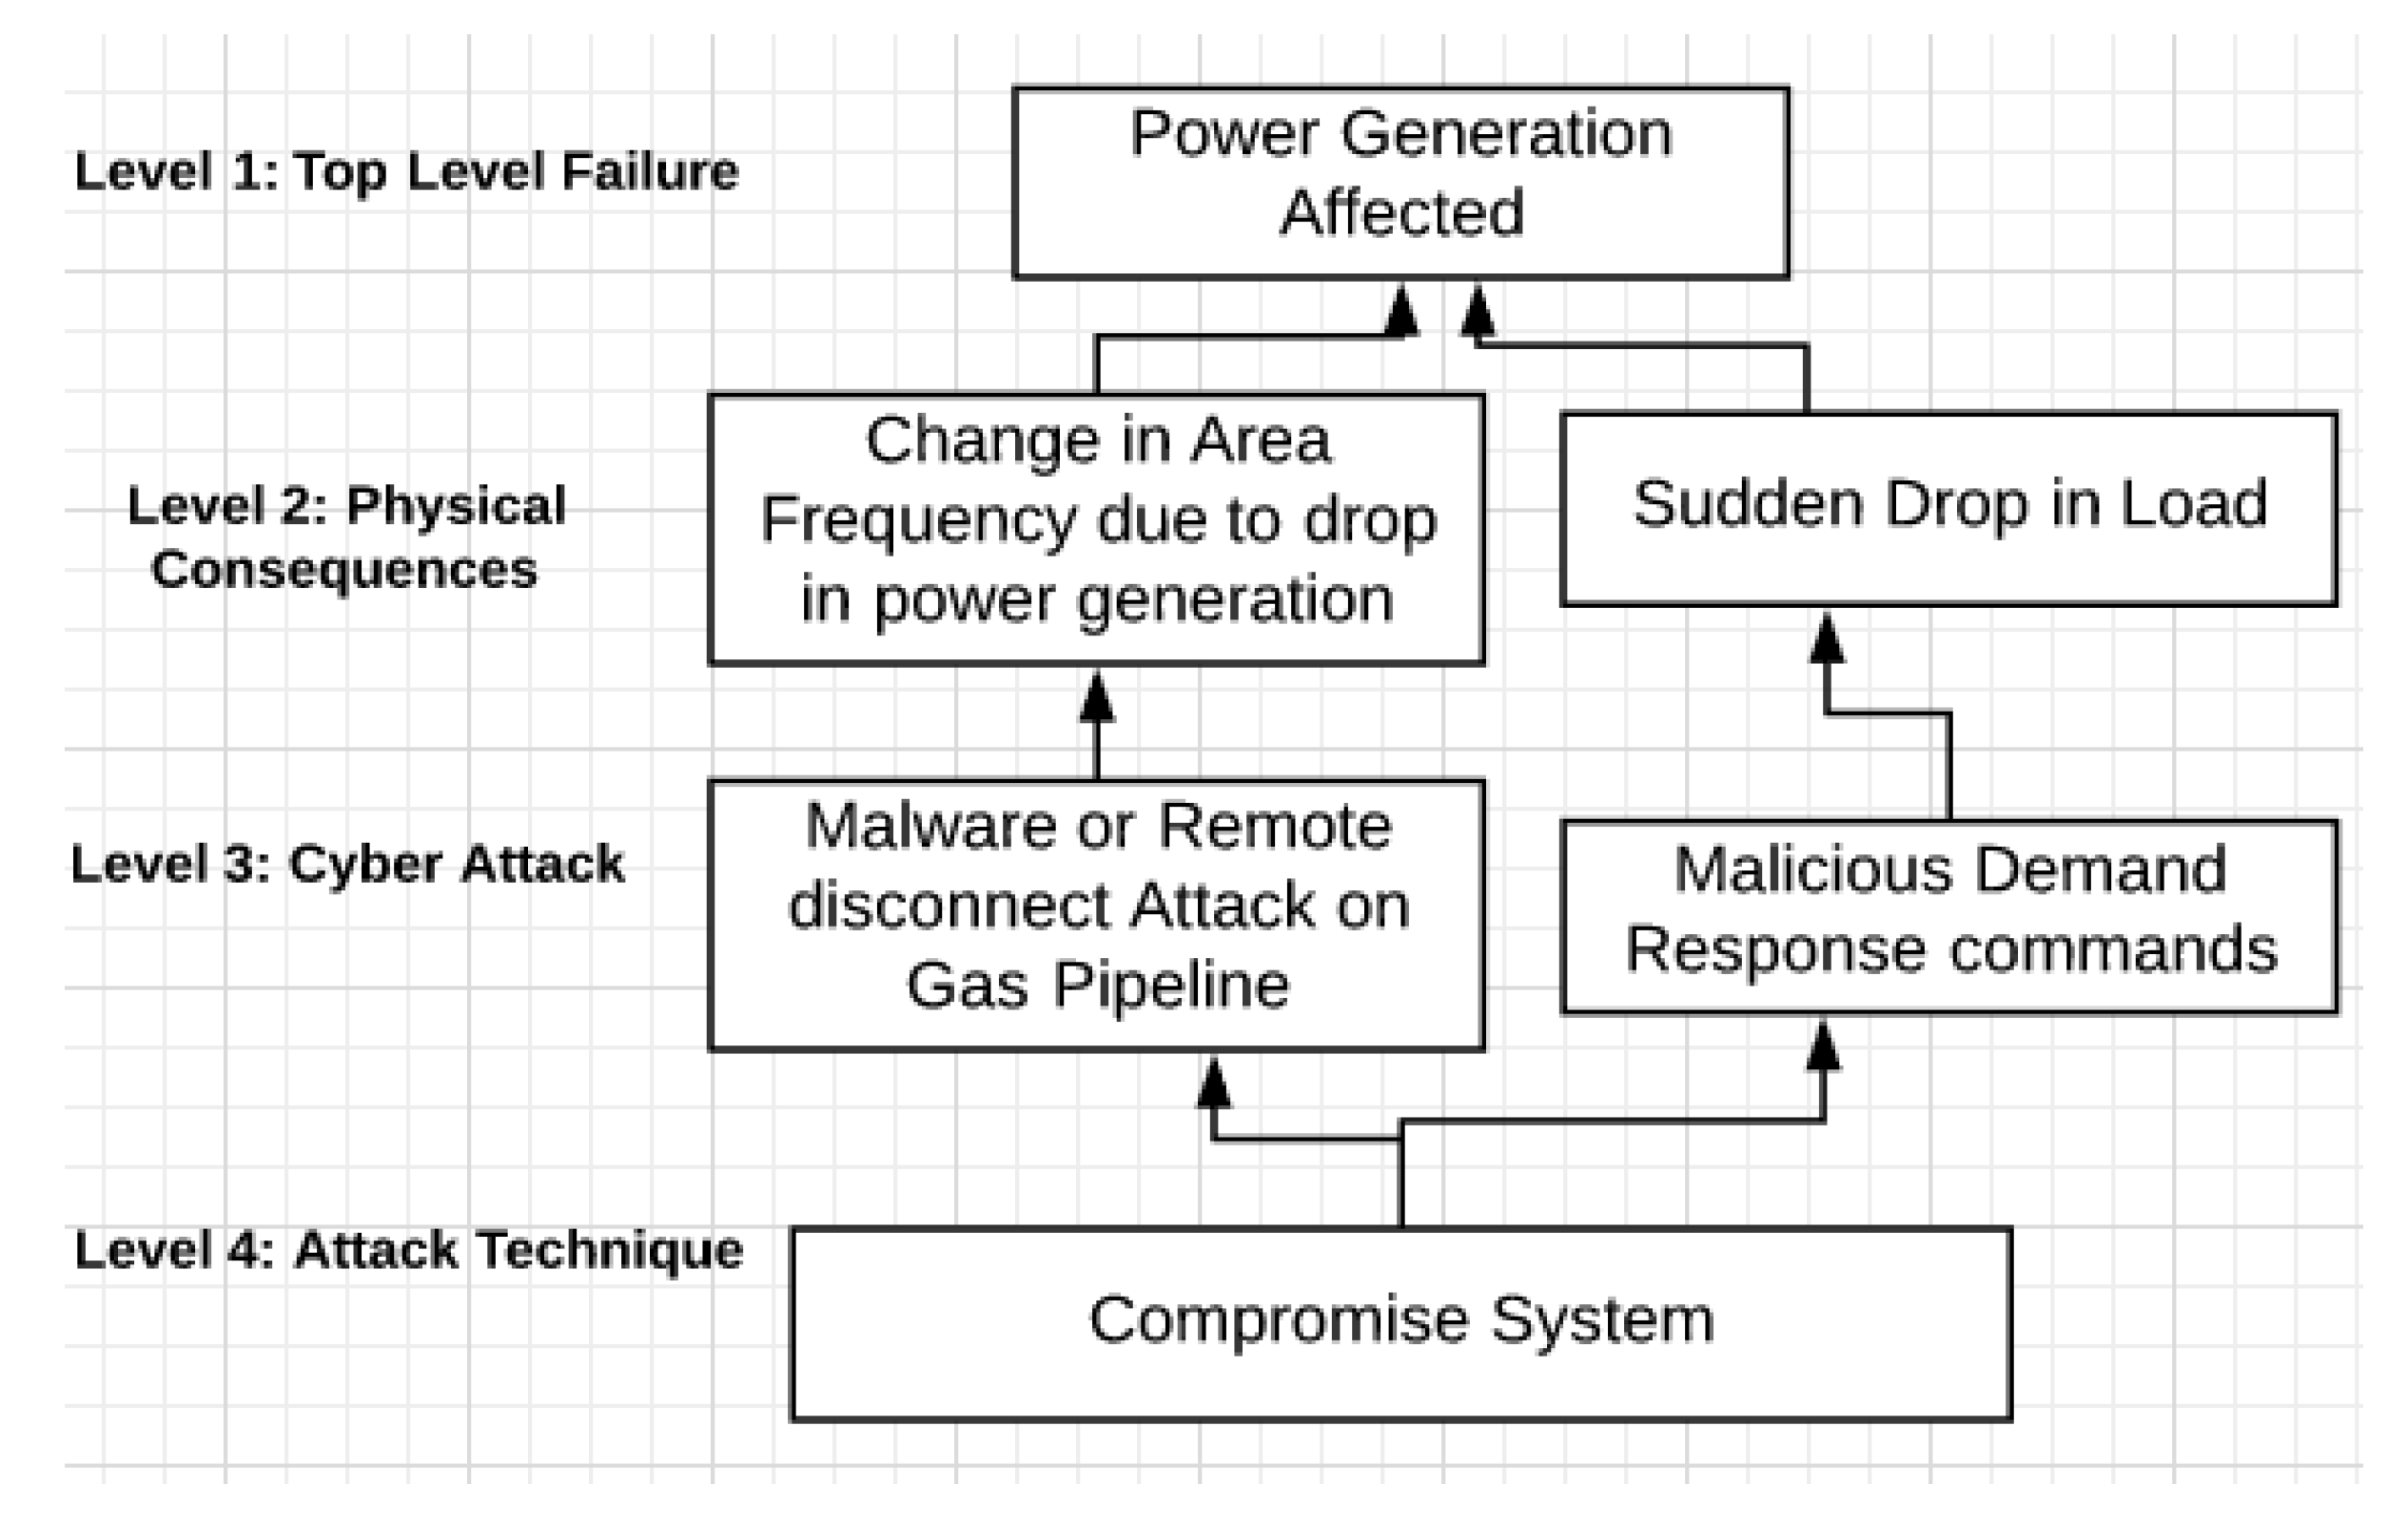
4.2. Attack Tree
Applying the function-based methodology, the function under study, in this case, is power delivery. This function depends on many other functions and components among which are GPP and Distributed Energy Resources (DER). The next step now would be creating an attack tree for power delivery function by focusing the attacks on GPP and DER.
Figure 2 represents the attack tree for the SG. Level 1 represents the primary function that is power delivery. Level 2 represents the physical consequences that lead to the failure of power delivery; for instance, change in area frequency or sudden load drop or increase. Level 3 represents the cyber-attacks that lead to physical consequences. By compromising the Remote Terminal Units (RTU) of the gas pipeline, the attacker controls the supply of gas to the GPP, affecting power generation. Finally, Level 4 represents the attack techniques (how an adversary performs attacks).
4.3. Cyber-Physical Attack Scenarios
Attack on gas-fired peaker plants (Attack I): The main motive of the attackers is to attack the gas distribution network via a business network. They perform social engineering (via spear-phishing emails) to employees with the goal to discover account details. The next step is to compromise the vulnerable workstations in the business network and try to find the connection to the industrial control system network. Once the attackers gain access to the control system network, they start compromising the workstations of the control center, which provides access to the physical devices (as in the case of the Ukraine Power grid attack [
5]) and machinery such as compressor stations, Remote Terminal Units (RTU), sensors and wireless nodes of the communication network. In this attack scenario, they compromise RTU present along the natural gas distribution pipeline and misguide them to send incorrect readings to the control center and close down one of the compressor stations. The primary motive is to cut down the supply of the natural gas to the GPP. The attackers perform this attack during peak hours, leveraging the online data available on the Independent System Operators (ISO) website [
33], so that the attack has a high impact on SGR. We have modeled this scenario by taking an interval during the peak time, closing the peaker power plant and evaluating the impact of such a contingency on the power grid.
Attack on Distributed Energy Resources (DER) (Attack II): In this attack scenario, attackers compromise the control center from where they control DERs. They send shutdown signals to a critical number of DERs to reduce power generation when it is required (using online ISO data [
33]). It creates a demand-supply mismatch and, thus, degrades SGR. In the simulation, we have modeled a generator as a DER Solar PV [
34]. We assume the attacker has compromised the DER station and can control its functionality remotely at any point in time. When generation is not able to meet demand, the power line frequency in the area decreases. We have modeled this scenario in the simulation by taking an interval during the peak demand of the day and shut down the DER generator.
4.4. How It Is Related to Historical Blackouts
The world has faced several large-scale blackouts in recent times [
35,
36,
37]. The blackouts were originated either because of malicious or non-malicious sources, but they had a profound impact on the economy. The Ukraine power grid attack [
5] led to power outages in the thousands of homes, and it is a perfect example of a cyber-attack on the grid, where the attackers compromised the cyber system (such as the electricity control center) that controls the functionality of various substations. Although malicious events did not cause some of the blackouts, blackouts could have easily originated from cyber-attacks on the grid; for example, the Arizona and Southern California blackout, which affected approximately 2.7 million people [
37]. During a hot day (hours of peak demand), a high voltage line failed, which redistributed the power towards San Diego. This redistribution of power resulted in additional line failures and led to the separation of San Diego from the rest of the Western Interconnection. Because of the huge imbalance of the power demand and supply, the frequency diverged beyond thresholds, and generators started tripping, resulting in the blackout.
How is this related to Attack Scenarios I and II? An adversary has compromised a cyber system in the electricity control center from where he/she controls DER in a large area (Attack II). He/she sends shutdown signals to a large number of DERs to reduce power generation and dispatch. Therefore, the initial line failure (in the Arizona blackout) could have resulted due to the reduced generation in San Diego, causing the imbalance between demand and supply. Since it was a hot day with peak demand, the reduced generation did not meet the power demand. Furthermore, an adversary could have shut down the peaker power plant (Attack I) by attacking the gas distribution pipeline to prevent gas reaching plants and generating power. The attack on GPP further reduced the generation, and generators started tripping resulting in the blackout in San Diego.
4.5. Simulation Setup
We use the PowerWorld simulator to model the power system. The power system is simulated using the standard IEEE 9-bus model [
38]. We model three-generation units of the IEEE 9-bus as Bus 1 Generator (B1G) serving as the base load, Bus 2 Generator (B2G) as the peaker power plant and Bus 3 Generator (B3G) as the Photovoltaic (PV) DER. It is the responsibility of the GPP or DER to provide the generation (other than base load) as required by the grid. We have not changed the default generation units of the IEEE 9-bus model except the generation and frequency limits and load requirements. We model B3G as a DER. We have configured this unit using the Western Electricity Cordination Council (WECC) Solar PV dynamic model specification [
34]. We use the frequency of the system as a metric to determine whether the system shuts down. We have assigned frequency boundaries for the generators with their pick up time in the simulation. The standard frequency limit is 60 Hz. The under frequency protection is enabled with a threshold of 57.60 Hz (0.96 pu ratio) with a pickup time of 2 s. The generators will trip if the frequency of the system goes below 57.60 Hz for more than 2 s in response to the under frequency protection mechanism and similarly for over frequency. When there is more generation than load, the over frequency threshold happens, and the under frequency threshold is when there is a lower generation than load.
4.6. Analysis Methodology
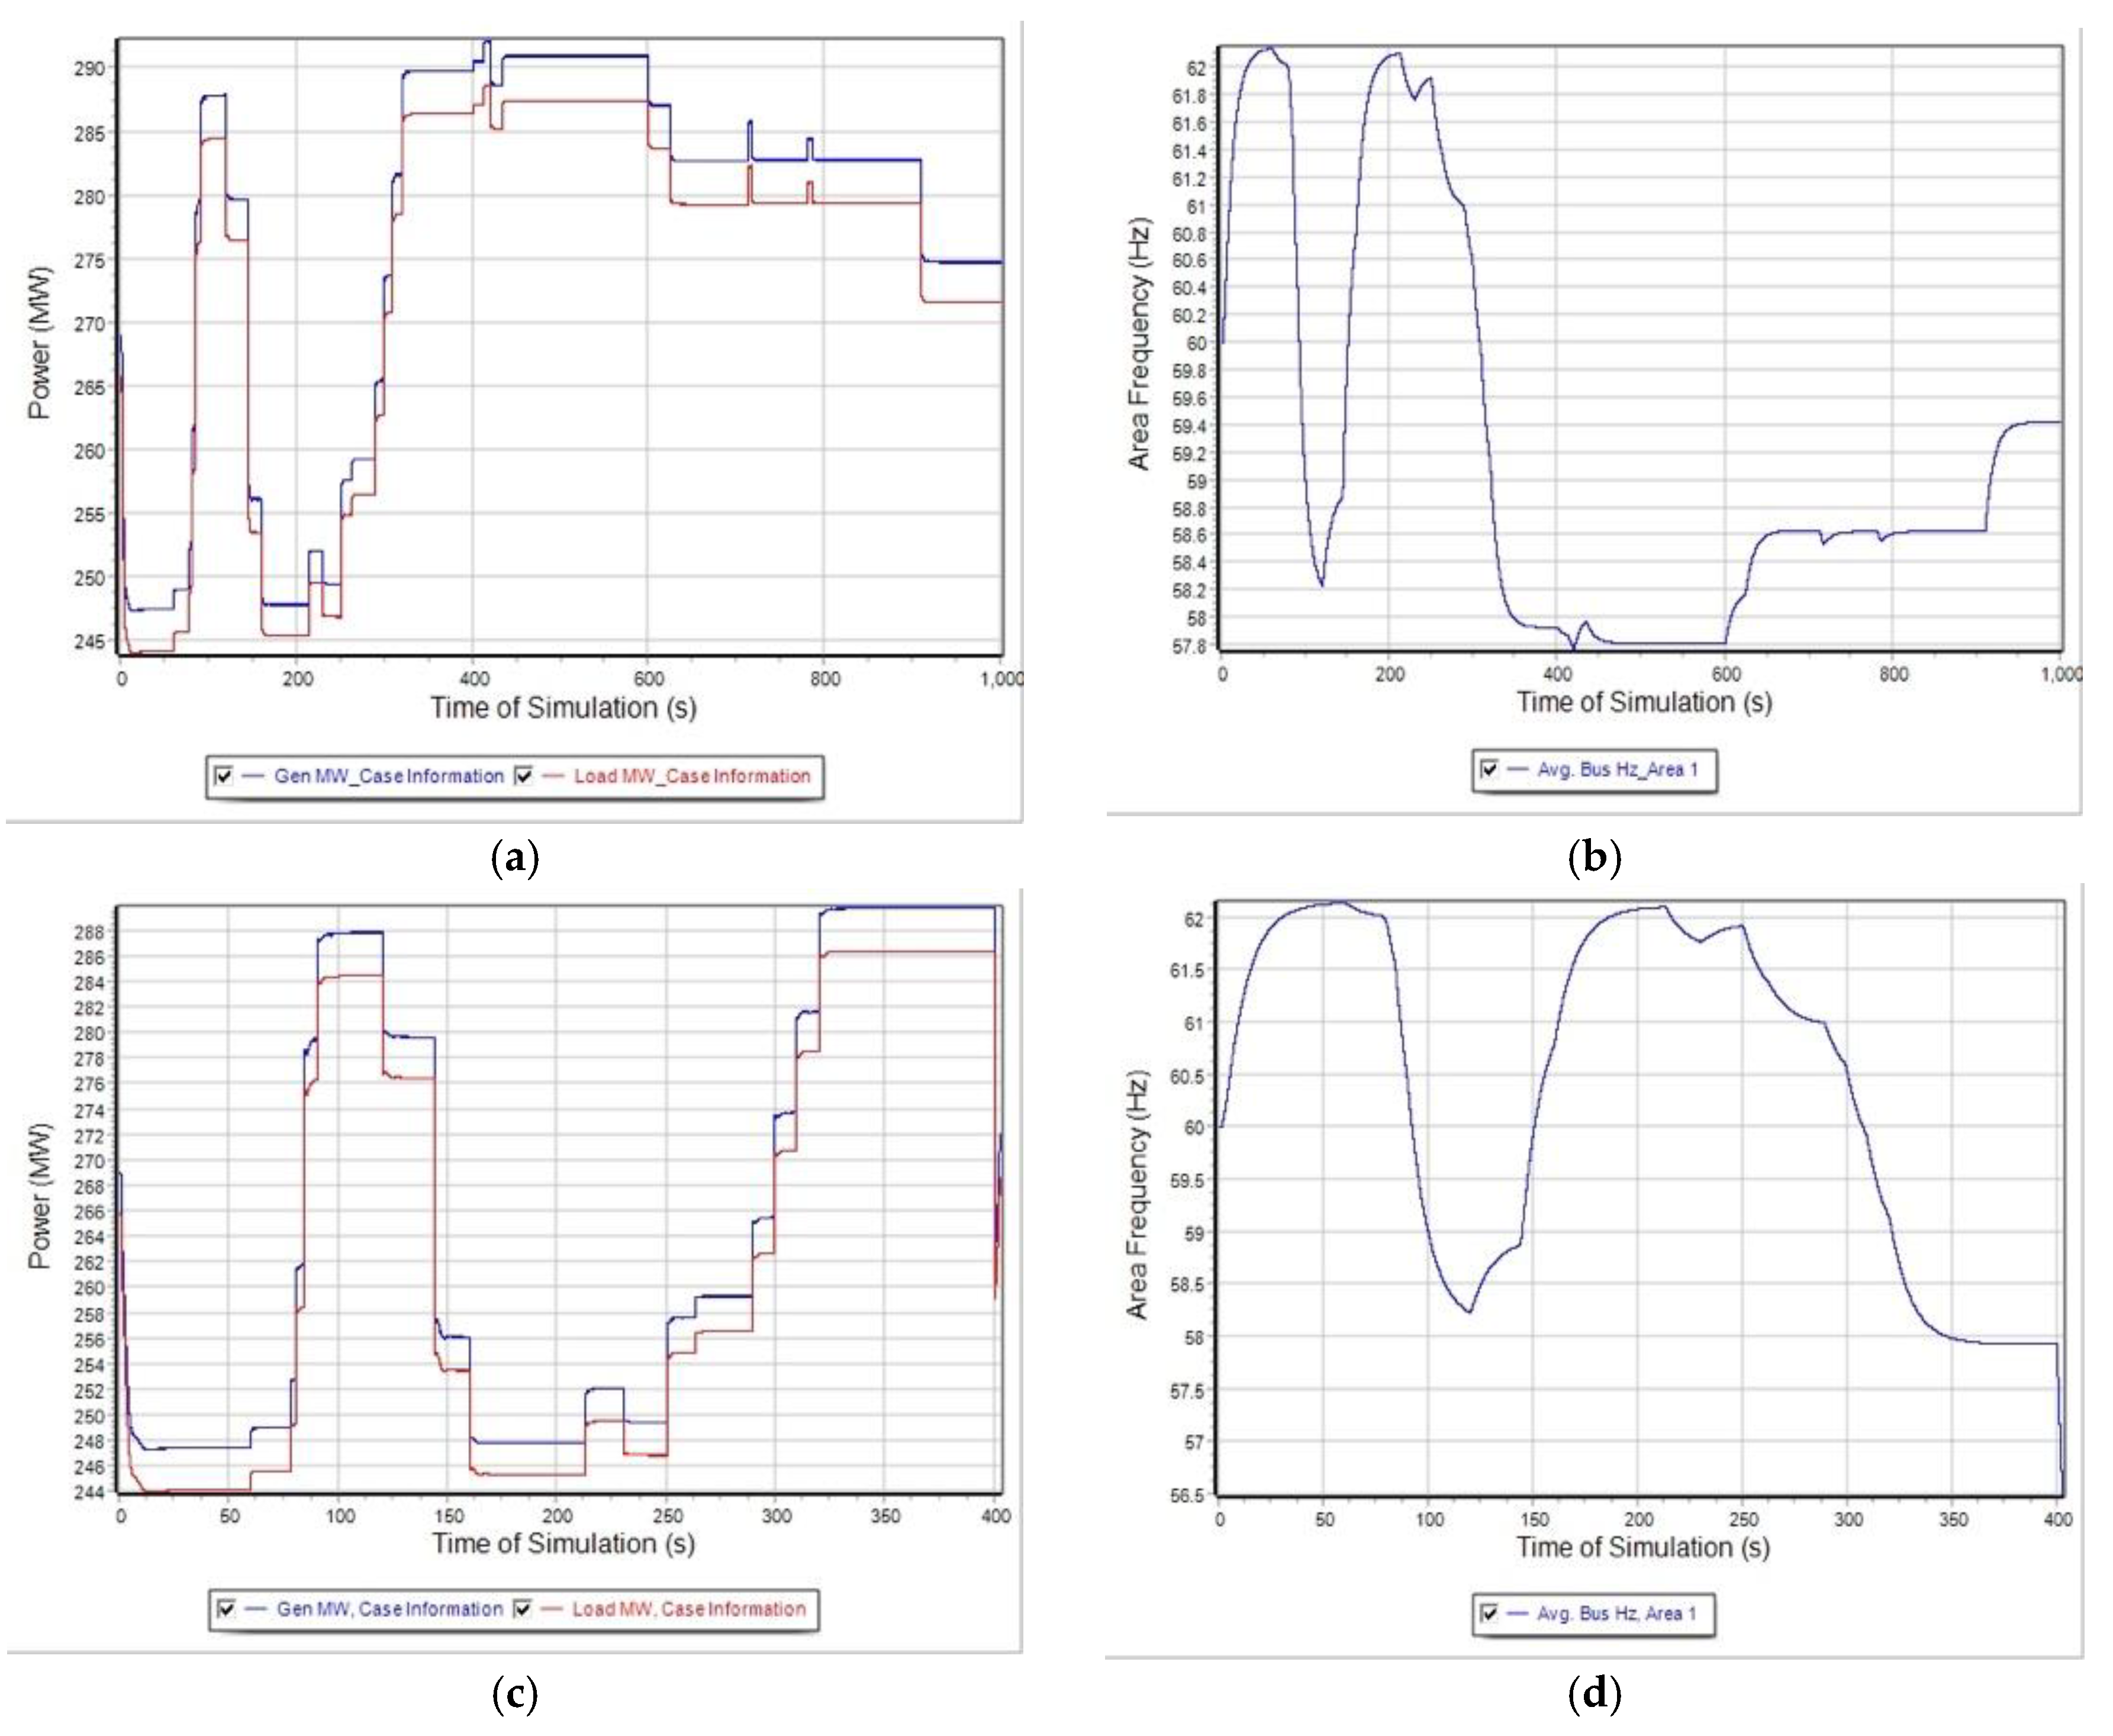
We perform the simulation for 1000 s (simulated time). We initialize the system with all the parameters such as initial load requirements, frequency limits, generator fuel and unit type. We create a demand curve for our simulation model (see
Figure 3a). We have three generation units: B1G, B2G and B3G, which will serve the load generated. As demand keeps on increasing, generators provide generation to meet the demand, but up to their maximum generation limits. We run the simulation and plot the generation, load and frequency curve for this normal working scenario. We perform simulation in the presence of the attack described above. We choose an instance randomly
t = 390–400 s during the peak hour to perform the attack on the power system. We perform peaker plant (Attack I) and DER (Attack II) shutdown during this interval (in
Figure 3c,d). We run the simulation and plot generation, load and frequency curves. Finally, we analyze the impact of the attack on the power system.
4.7. Simulation Analysis
Figure 3a shows the generation and load requirement curve when there are no attacks on the SG. The generation (in blue) is slightly higher as compared to the load (in red) because of the loss of power during its transmission over the buses.
Figure 3b shows the frequency of the area deployed for the simulation. Whenever there is a change in generation and load, the frequency of the area also changes. When we perform an attack at 400 s (see
Figure 3c), the area frequency of the system goes to less than 57.60 Hz (see
Figure 3d) for more than two seconds due to which the generators are tripped. The primary justification for this observation is the mismatch in the power demand-supply, which led the area frequency to decrease because of the shortage of power in the given region. The area frequency crosses the secure threshold of 57.60 Hz for two seconds, which led to generator tripping, which further reduced the generation in the area. We conclude that the power system is not resilient because the primary function under study (power delivery) failed. To understand the in-depth sensitivity analysis, see [
9,
10].
4.8. Lessons Learned
The function-based methodology demonstrates how to model the system and evaluate its resilience in the presence of CPA. It demonstrates the inability in the power grid when there is a mismatch in power demand-supply for a certain period. In this section, we showed that an adversary’s motive is to destabilize the grid. In reality, this is not always true. The primary motive of an adversary is not always to destabilize the grid, instead to increase the operating cost of the power system operator by performing slight modifications in the power demand-supply. Instead of closing most (or all) of the DERs in an area, an adversary closes a few of the DERs that will affect the power grid and increase the operational cost regarding increased power reserve, dispatch and updating DERs software. The power grid is not ready to defend against such complex attack scenarios that cause abrupt changes in the power demand and supply [
10,
11,
12,
17]. Although it is challenging for power engineers to prevent such attacks where the attacker compromised a cyber system to control some physical processes, in
Section 8, we discuss some countermeasures.
The function-based methodology assists power engineers to identify various attack vectors and how they affect the power system metrics (such as frequency thresholds) when subject to cyber-attacks, but it does not discuss how to provide security to these cyber components of the SG that control the power grid functions (such as power dispatch, outage management, demand response, etc.). Providing security to such critical systems is a complex task. Power engineers should understand how a system is behaving, which functions and network components are vulnerable, what are the vulnerabilities and how does this affect the resilience of the system. In the next section, we discuss the BAGS tool, which can be used to compute the likelihood of the compromise of various cyber components of the SG system, answering the latter questions.
5. Bayesian Attack Graph for the Smart Grid Cyber Domain
In this section, we present the Bayesian Attack Graph for Smart Grid tool to compute the likelihood of attack (or PoC) on the cyber domain of SG. BAGS provides the ability to assess how a compromise of a cyber component propagates in the network and affects the PoC of other components. Furthermore, it helps engineers identify the failure paths in advance from one component to another, which assists them in deploying security resources effectively.
5.1. Bayesian Belief Network
Bayesian Belief Network (BBN) is a probabilistic graphical model based on Bayes’ theorem. It is represented in the form of a directed acyclic graph to represent the dependency between a set of random variables. G = {V, E}, where V = {V1, V2, ……, VN} is a set of nodes of the system and E is the set of edges representing the relationship among nodes. Ei,j represents the causal dependency between variables Vi and Vj. The nodes probabilities are measured from data analysis, expert knowledge or the combination of both and using real-word attack datasets. The major advantage of using BBN is that we can compute posterior probabilities of an event when certain events are observed in real time.
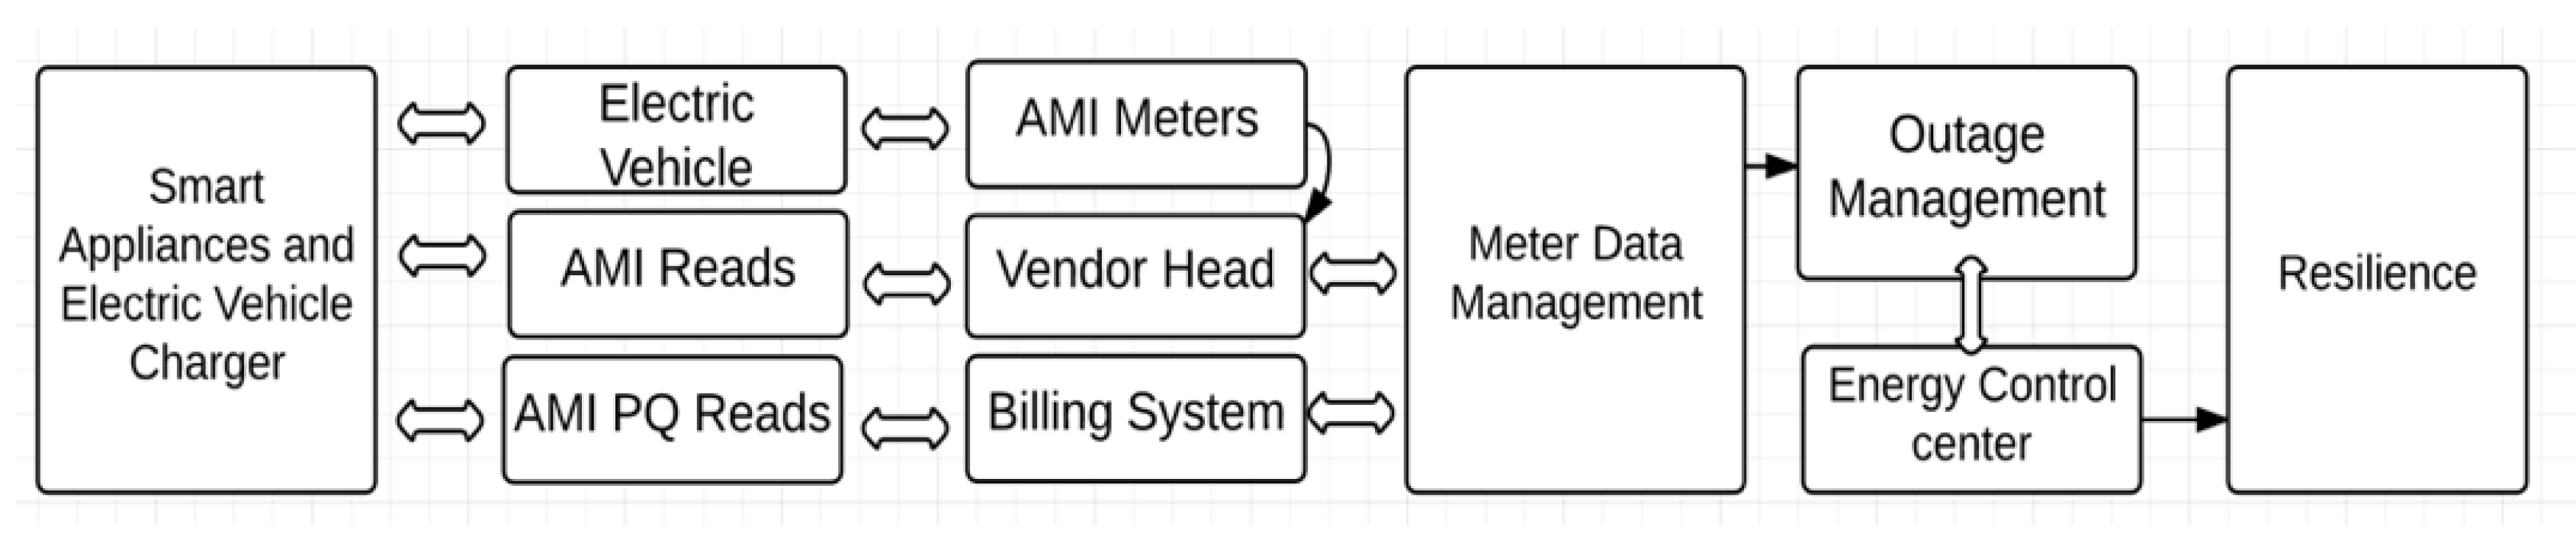
5.2. Smart Grid Architecture: Test Network
The Smart Grid Architecture (SGA) for the test network is shown in
Figure 4. It is comprised of smart meter (SM) collector (which includes smart meters) (S1) that collects power consumption and quality readings from smart appliances (including electric vehicles) and transfer it to SM sync head (S2), vendor-specific head (S6), and billing system (S3). These systems communicate data to Meter Data Management (MDM) (S8) and then to the Outage Management System (OMS) (S4). OMS keeps track of the reserved power and predicts outages. OMS interacts with the Electricity Control Center (ECC) (S7) to make decisions regarding power generation, DR and power delivery.
5.3. Tool Design
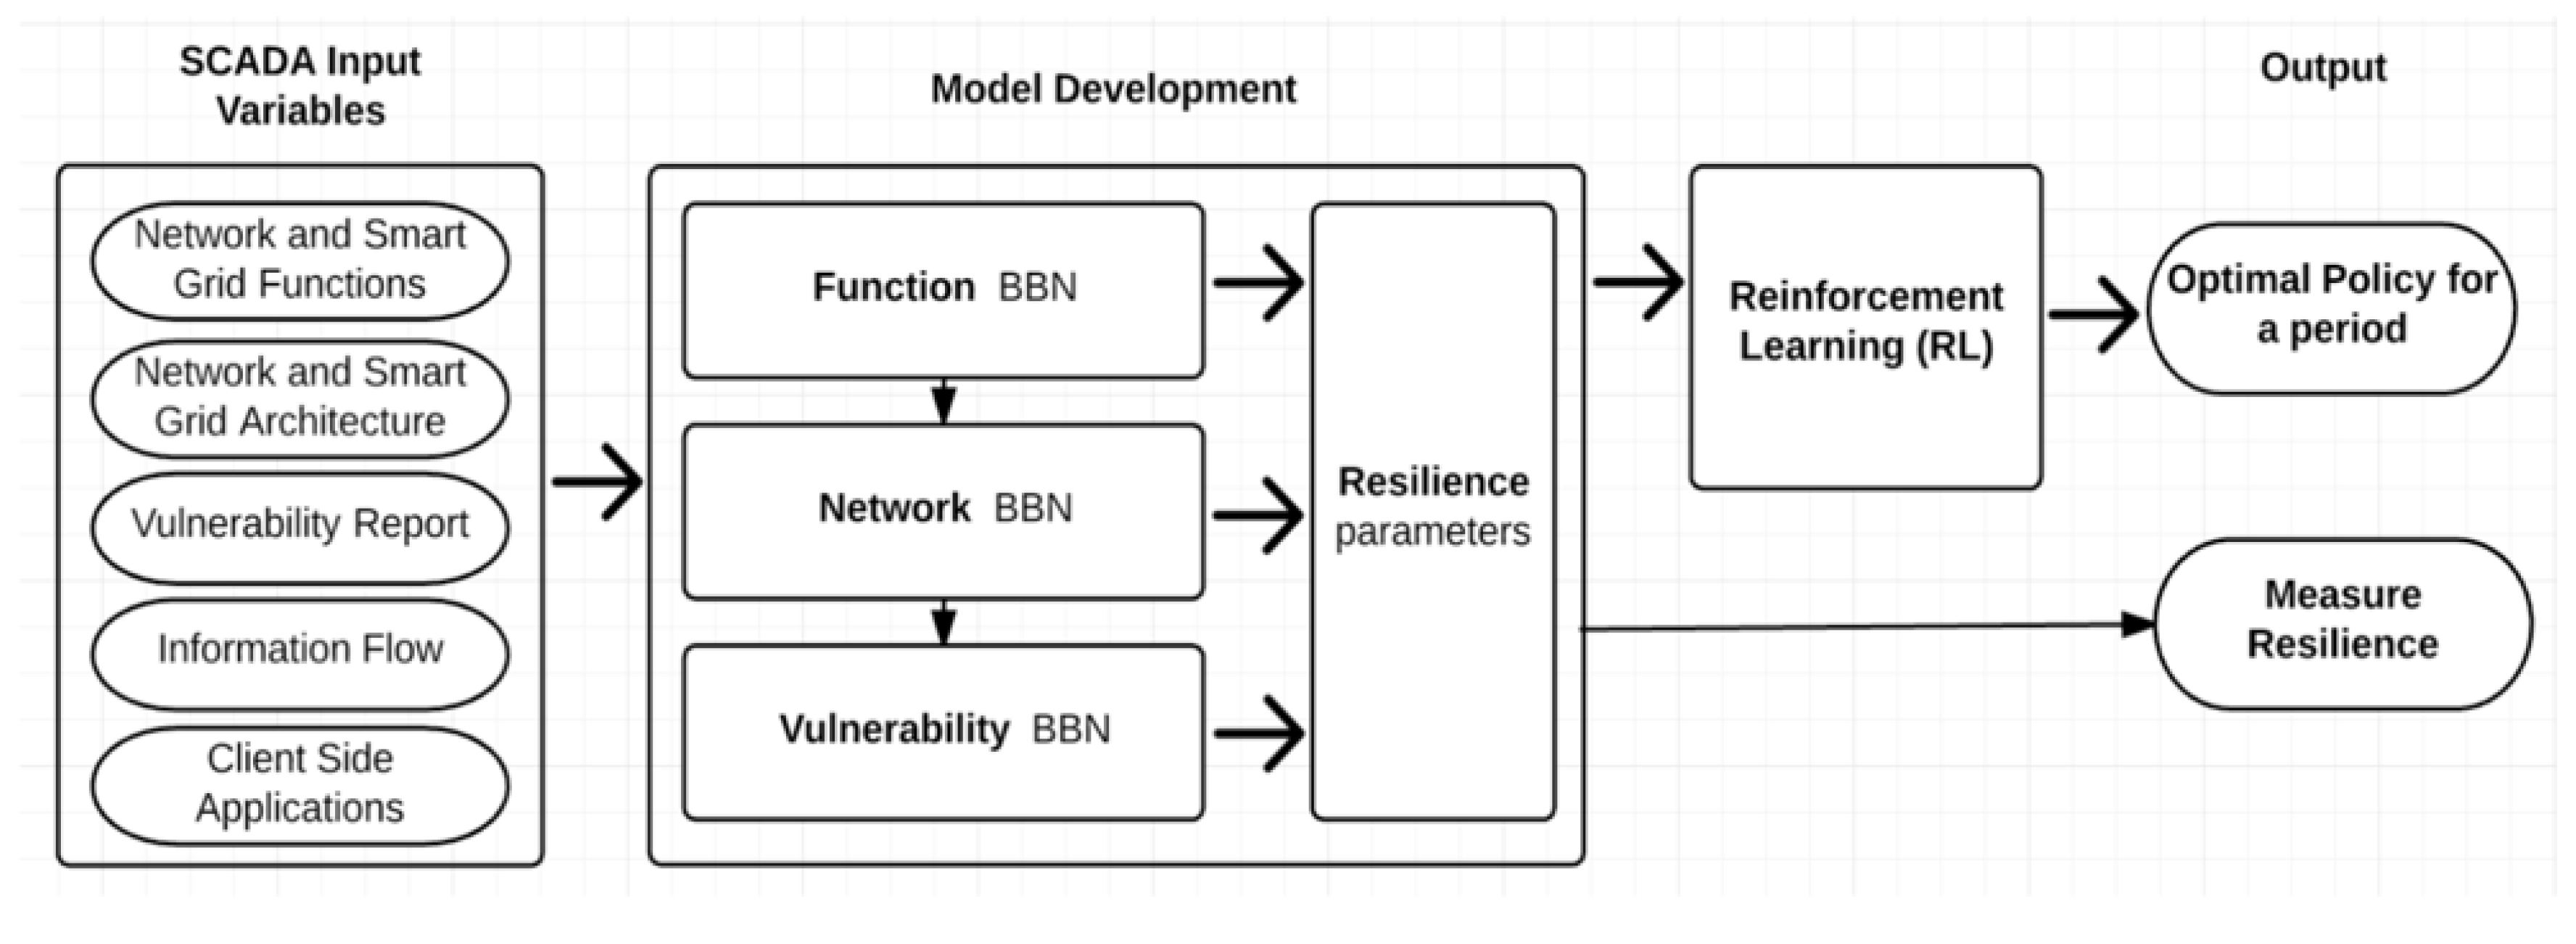
Figure 5: input variables: (1) network and SG functions represent the SG network and functions such as DR, billing system, MDM, OMS, etc., (2) the network and SGA comprise the network architecture of the system that supports all the functions; (3) the list of clients, server and vendor side applications; (4) the vulnerability report to compute the likelihood of a particular system compromise. Using input variables, the tool generates BBN and displays on the dashboard. The generated BBN are:
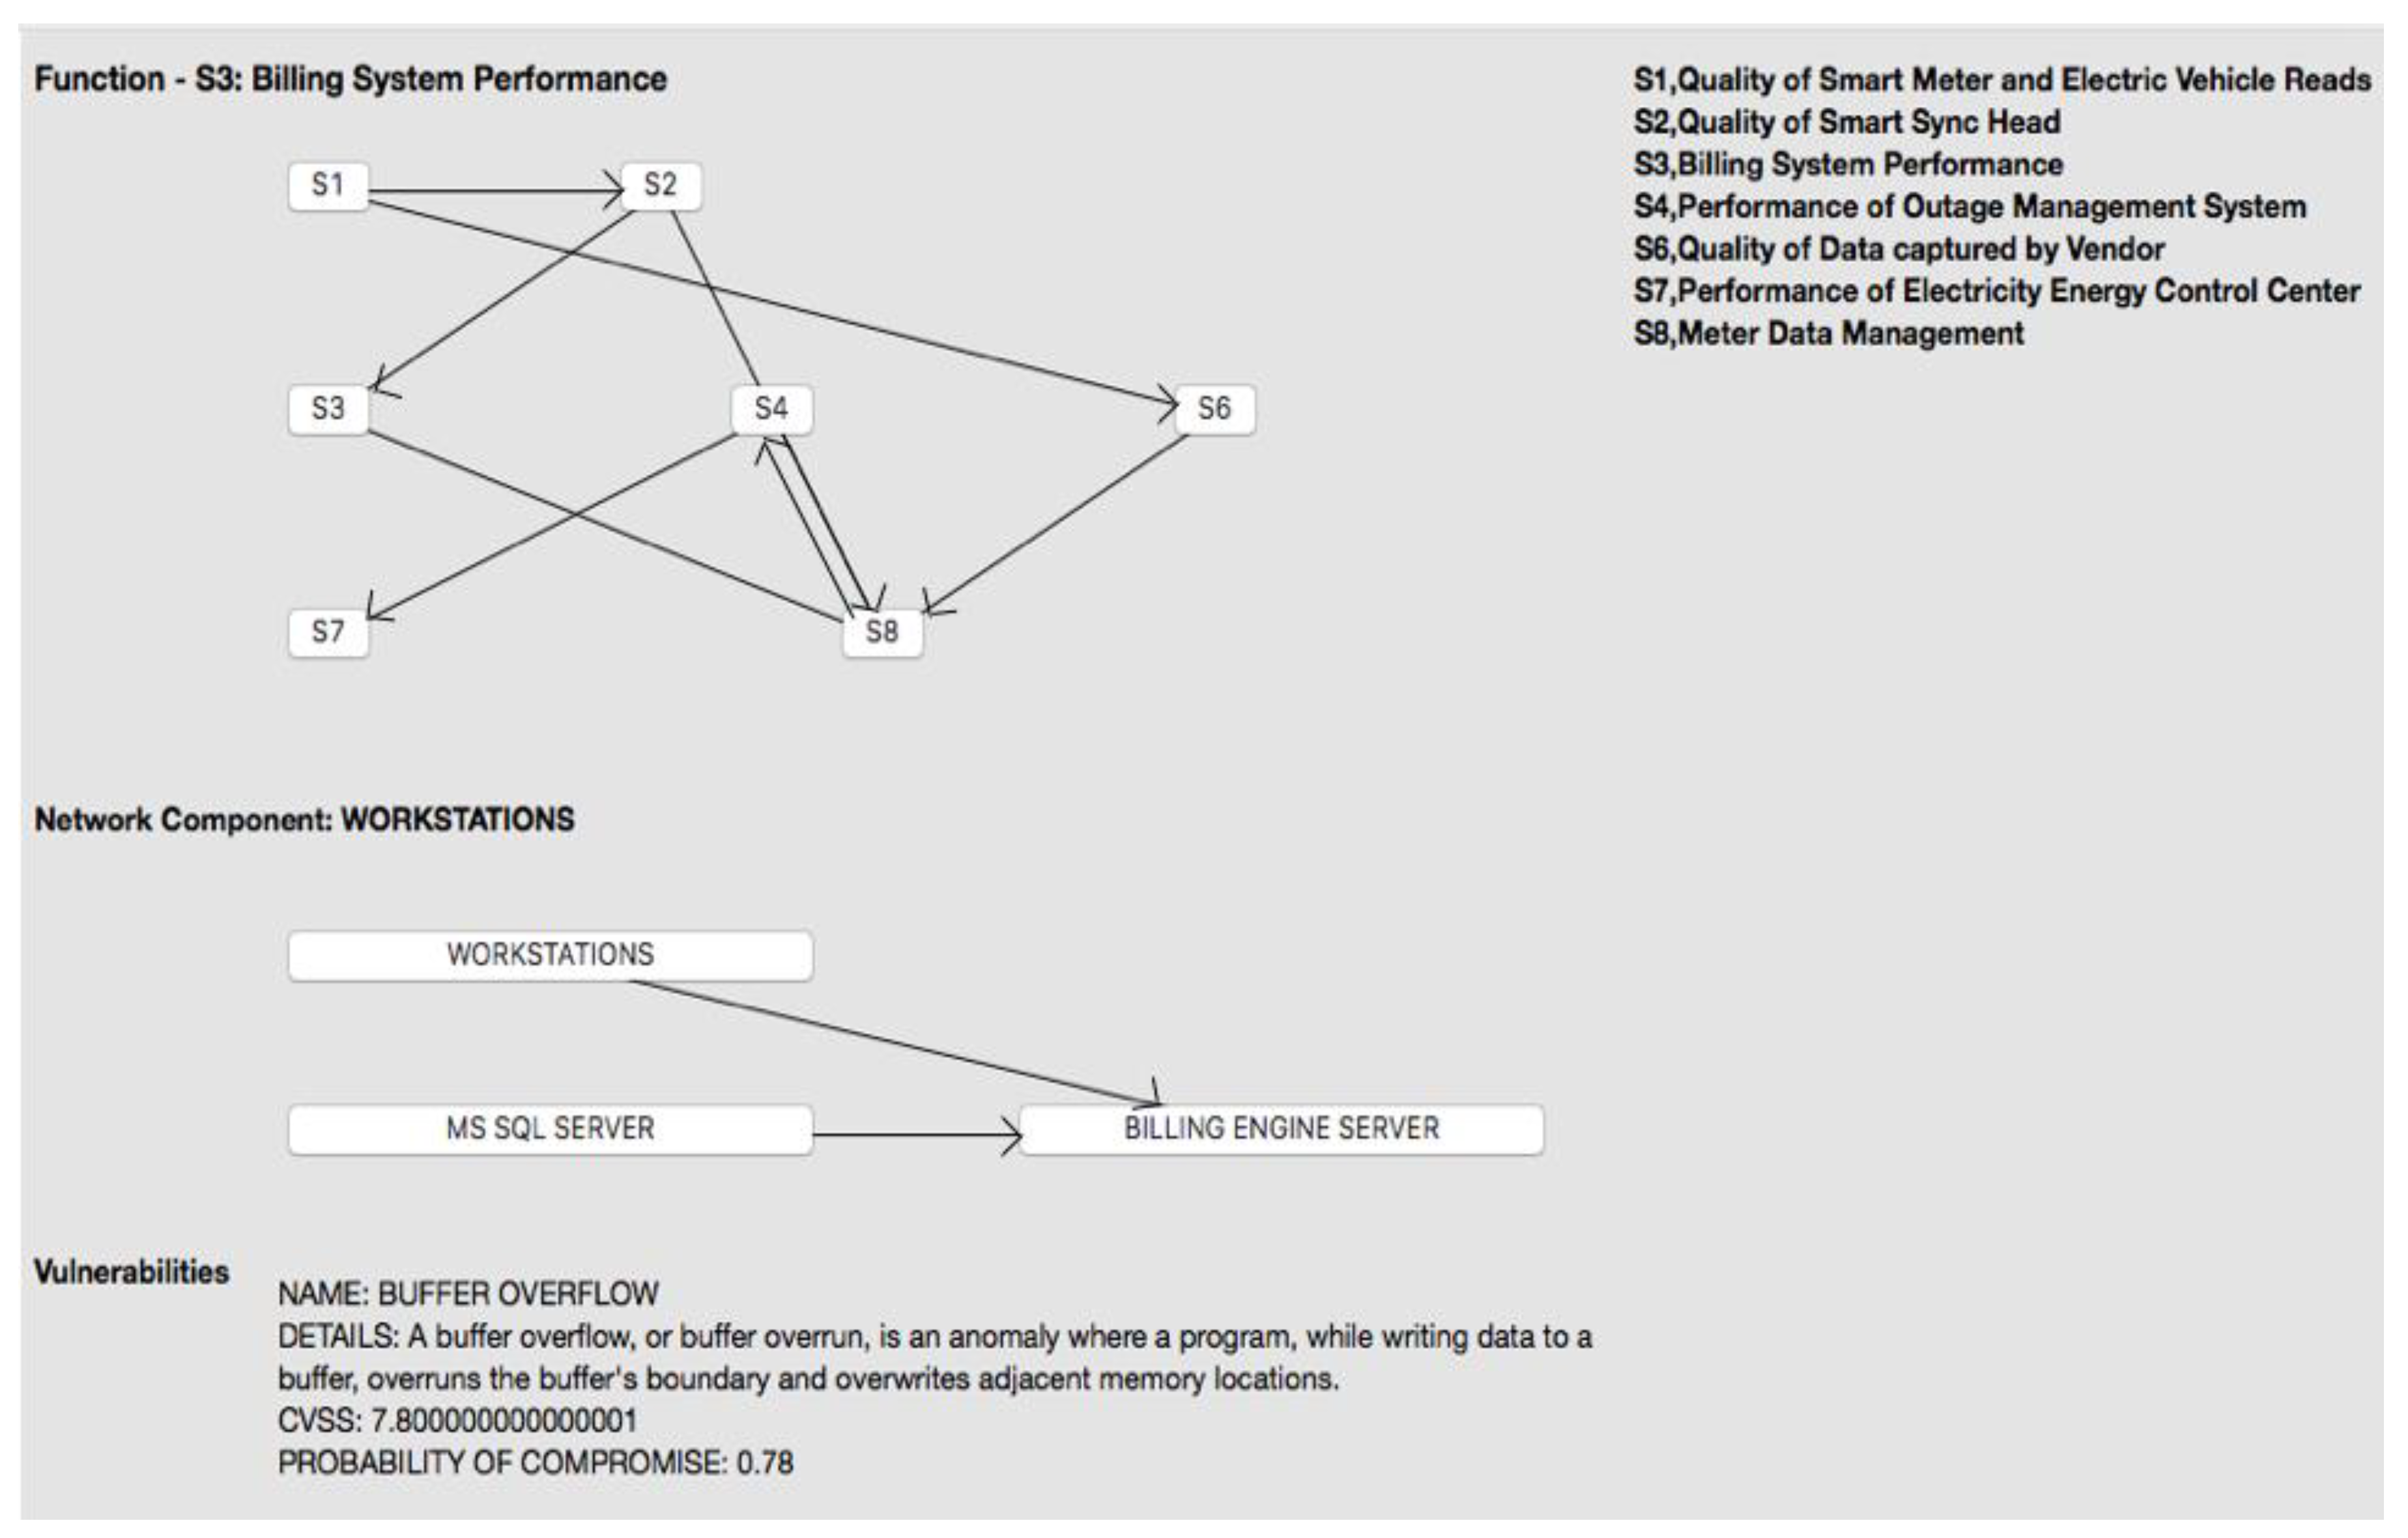
Function Bayesian Network (FBN): FBN represents the causal interconnection between different functions of the SG (see
Figure 6, top level). The nodes in FBN describe the functions of the SG, and edges represent the information flow from one function to another.
Network Bayesian Network (NBN): NBN represents various network components supporting a particular SG function (see
Figure 6, middle level). The system engineers can select a function at the FBN level on the dashboard, view its network components and analyze function status and information flow.
Vulnerability Bayesian Network (VBN): The system engineers select a particular network component from the NBN and view the list of its vulnerabilities (see
Figure 6, bottom level). The PoC corresponding to the component is computed using the Common Vulnerability Scanning Score (CVSS) score [
39].
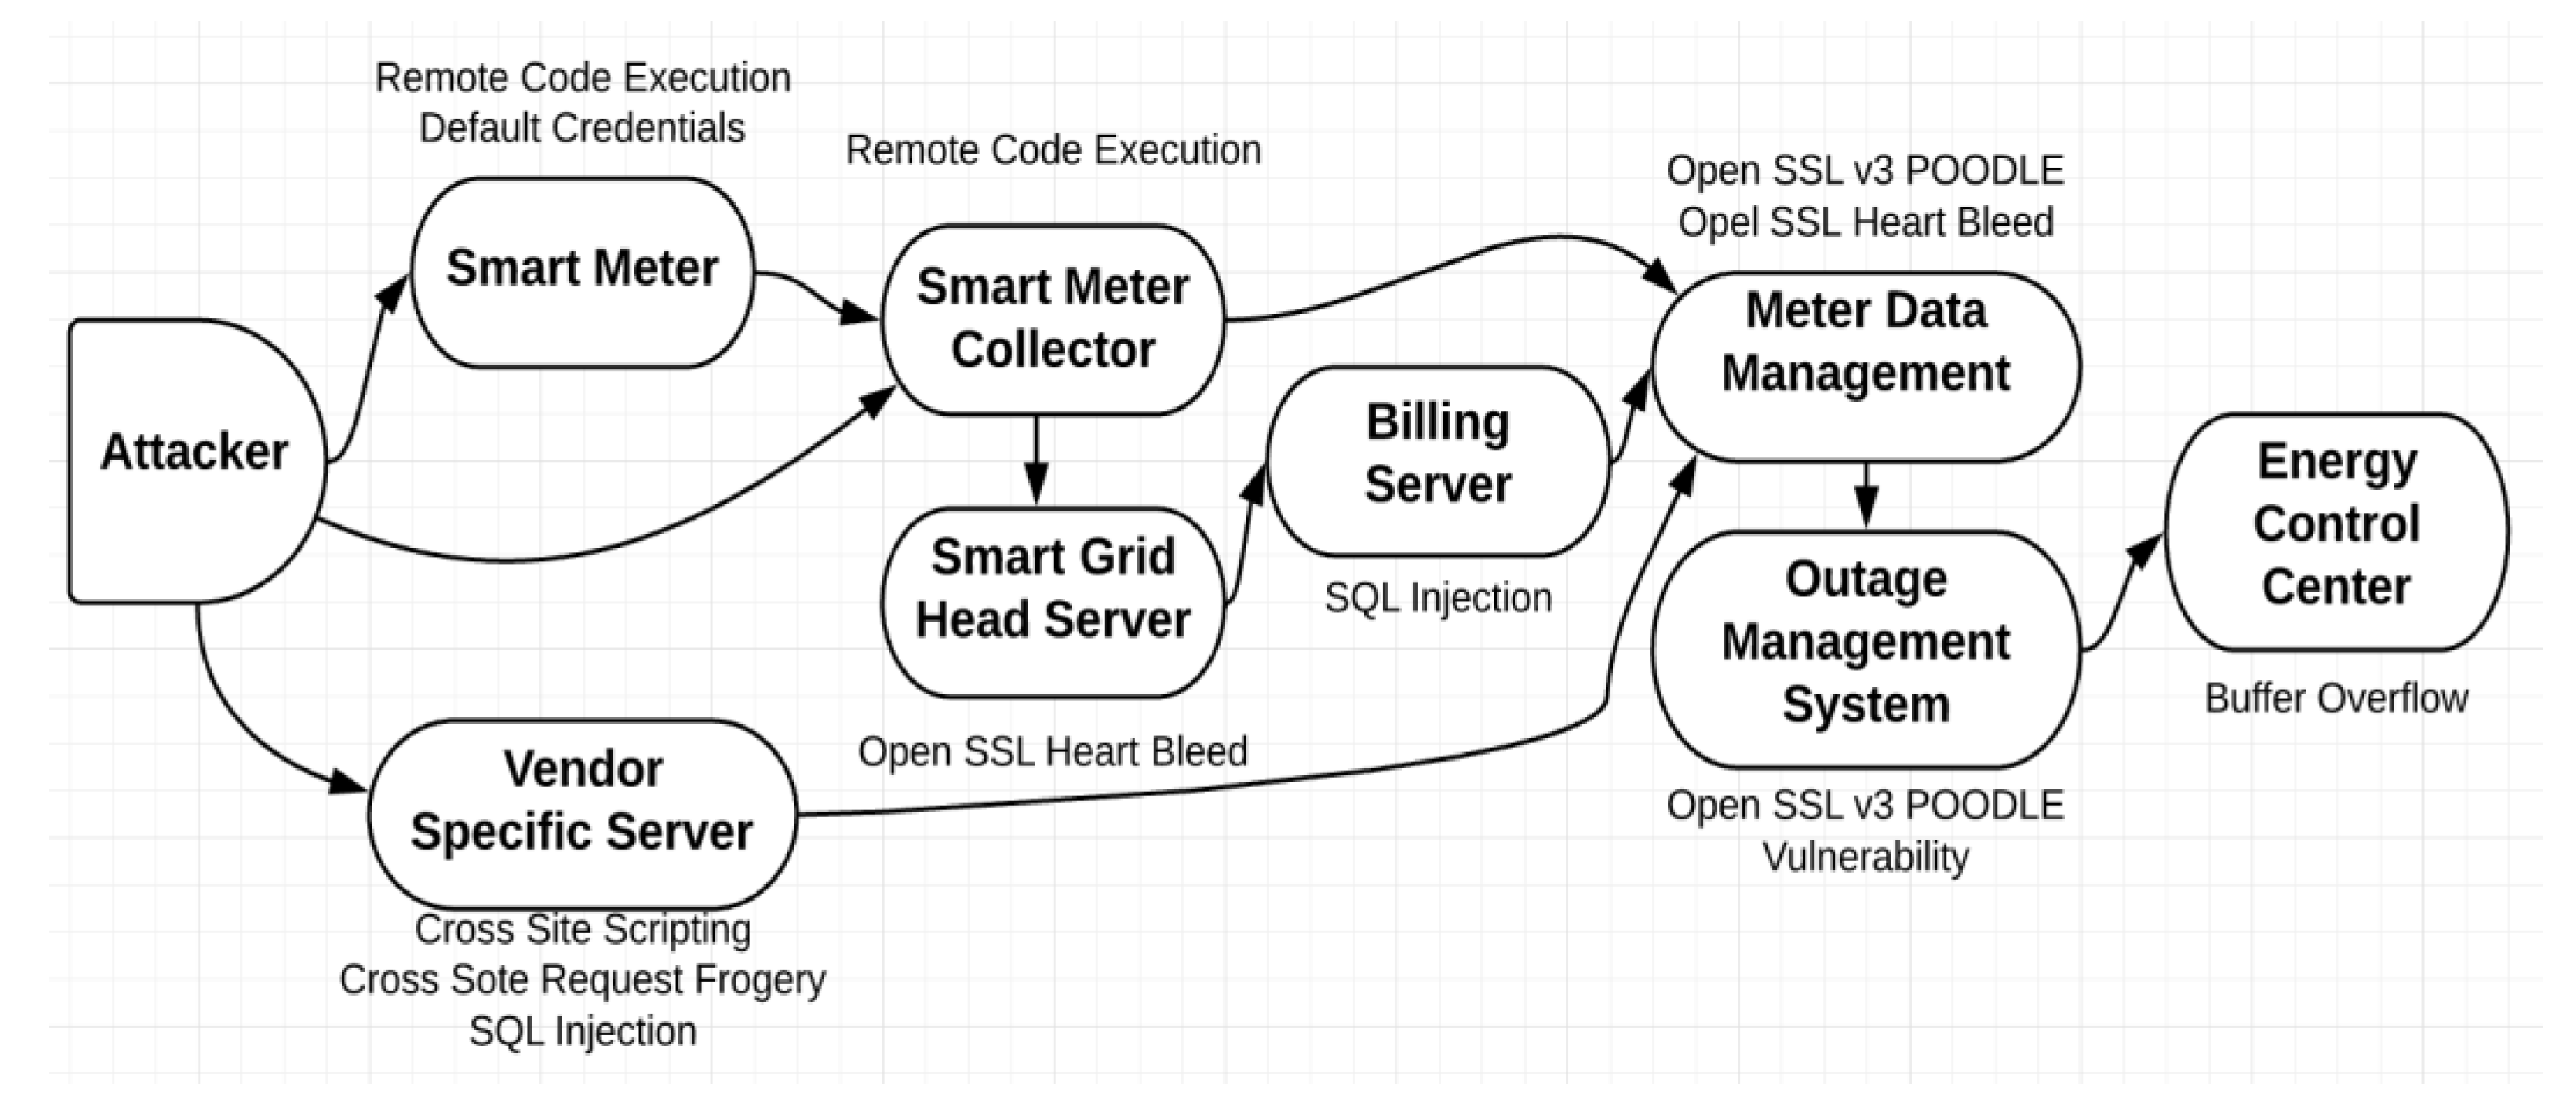
Figure 7 describes the set of vulnerabilities associated with system components in the test network.
5.4. Likelihood of Compromise
We use the CVSS [
39] to compute the PoC for a set of vulnerabilities for a cyber system. CVSS consists of three scores: base, temporal and environmental. The base score consists of properties that provide information about the exploitability of a vulnerability: Attack Vector (AV), Attack Complexity (AC), User Interaction (UI), required or not, Privileged Required (PR) or not, confidentiality, integrity and availability levels. We compute the probability of exploiting the vulnerability by considering the exploitability score and impact as described in the CVSS specification. We use the online CVSS calculator to compute the base score (probabilities) that uses Equation (1) to compute the exploitability sub-score. We take the base score and divide by 10 to compute the probability since all scores are out of 10.
Table 1 represents the CVSS PoC corresponding to all the vulnerabilities we have chosen for the test network. For instance, ECC has a buffer overflow vulnerability. The value for parameters for buffer overflow are: AV: local; AC: low; PR: no; UI: required; scope: unchanged; confidentiality: high; integrity: high; and availability: high. The value for these parameters according to CVSS is 7.8. We divide this score by 10 to get the PoC for buffer overflow that is 0.78. Similarly, we compute the probabilities for other vulnerabilities (
Table 1). The value of parameters for each vulnerability is stored by engineers into their database and should be updated via CVSS website [
39].
When multiple exploits are present in a system, we compute the Local Conditional Probability Distribution (LCPD), using the following equations: P (Y|Parents(Y)) = ΠiN P(Exploiti) when AND operation and P (Y|Parents(Y)) = 1 − ΠiN (1 − P(Exploiti)) when OR operation. LCPD of a system X depends on the exploits and its parents Y. For instance, MDM has three parents that are connected to different components of the MDM and have access to different exploits. We create three columns for LCPD, one for each parent system exploiting vulnerabilities to the component to which they are connected. The idea behind this is that if the attacker has compromised a parent of MDM, he/she has access to the MDM system component, which is connected to it, not others. The probabilities of compromise of a particular system will change over time. Therefore, posterior probabilities of system components are useful to evaluate such risk in the dynamic environment using Bayes’ rule.
5.5. Tool Output
Figure 5: dashboard: The tool provides an interactive dashboard for viewing the whole system and its various components. The engineers’ view: (1) FBN, system functions are logically connected, (2) NBN, the detailed description of the functional components, and (3) VBN, the list of vulnerabilities associated with the components and their probabilities of compromise.
Measure resilience: The primary motive of the tool is the PoC of cyber components of the SG. Using the Bayesian network, we connect different components of the SG and compute the PoC of each system using CVSS. The resilience of the system is computed based on the PoC of ECC (which controls the power dispatch and generation).
Alert mechanism: The system engineers assign a threshold probability to value each system component based on their experience of attacks on the system. The system triggers the alarm if the PoC crosses the threshold. This feature assists the system admin in identifying vulnerable components and assigning security controls to them.
5.6. Tool Prototype
We have developed the user interface of the tool in Java. It represents the framework that is accessible to the engineers on the dashboard. The input to the tool is the static database of the network components, functions and vulnerabilities (based on test SGA). The tool parses the input and generates the FBN (top level in
Figure 6). When an engineer clicks on a node of the FBN, the network components of that function and their connections are displayed in form of NBN (middle level in
Figure 6). Further, when an engineer clicks on a particular network component, the list of vulnerabilities associated with that element is displayed (bottom level in
Figure 6). If engineers change the configuration of the system, the changes are reflected on the dashboard. We do not implement the Bayesian algorithm; instead, we use a Bayes.jar file to compute the probabilities of the functions and represent the network graph. For more details, refer to [
13].
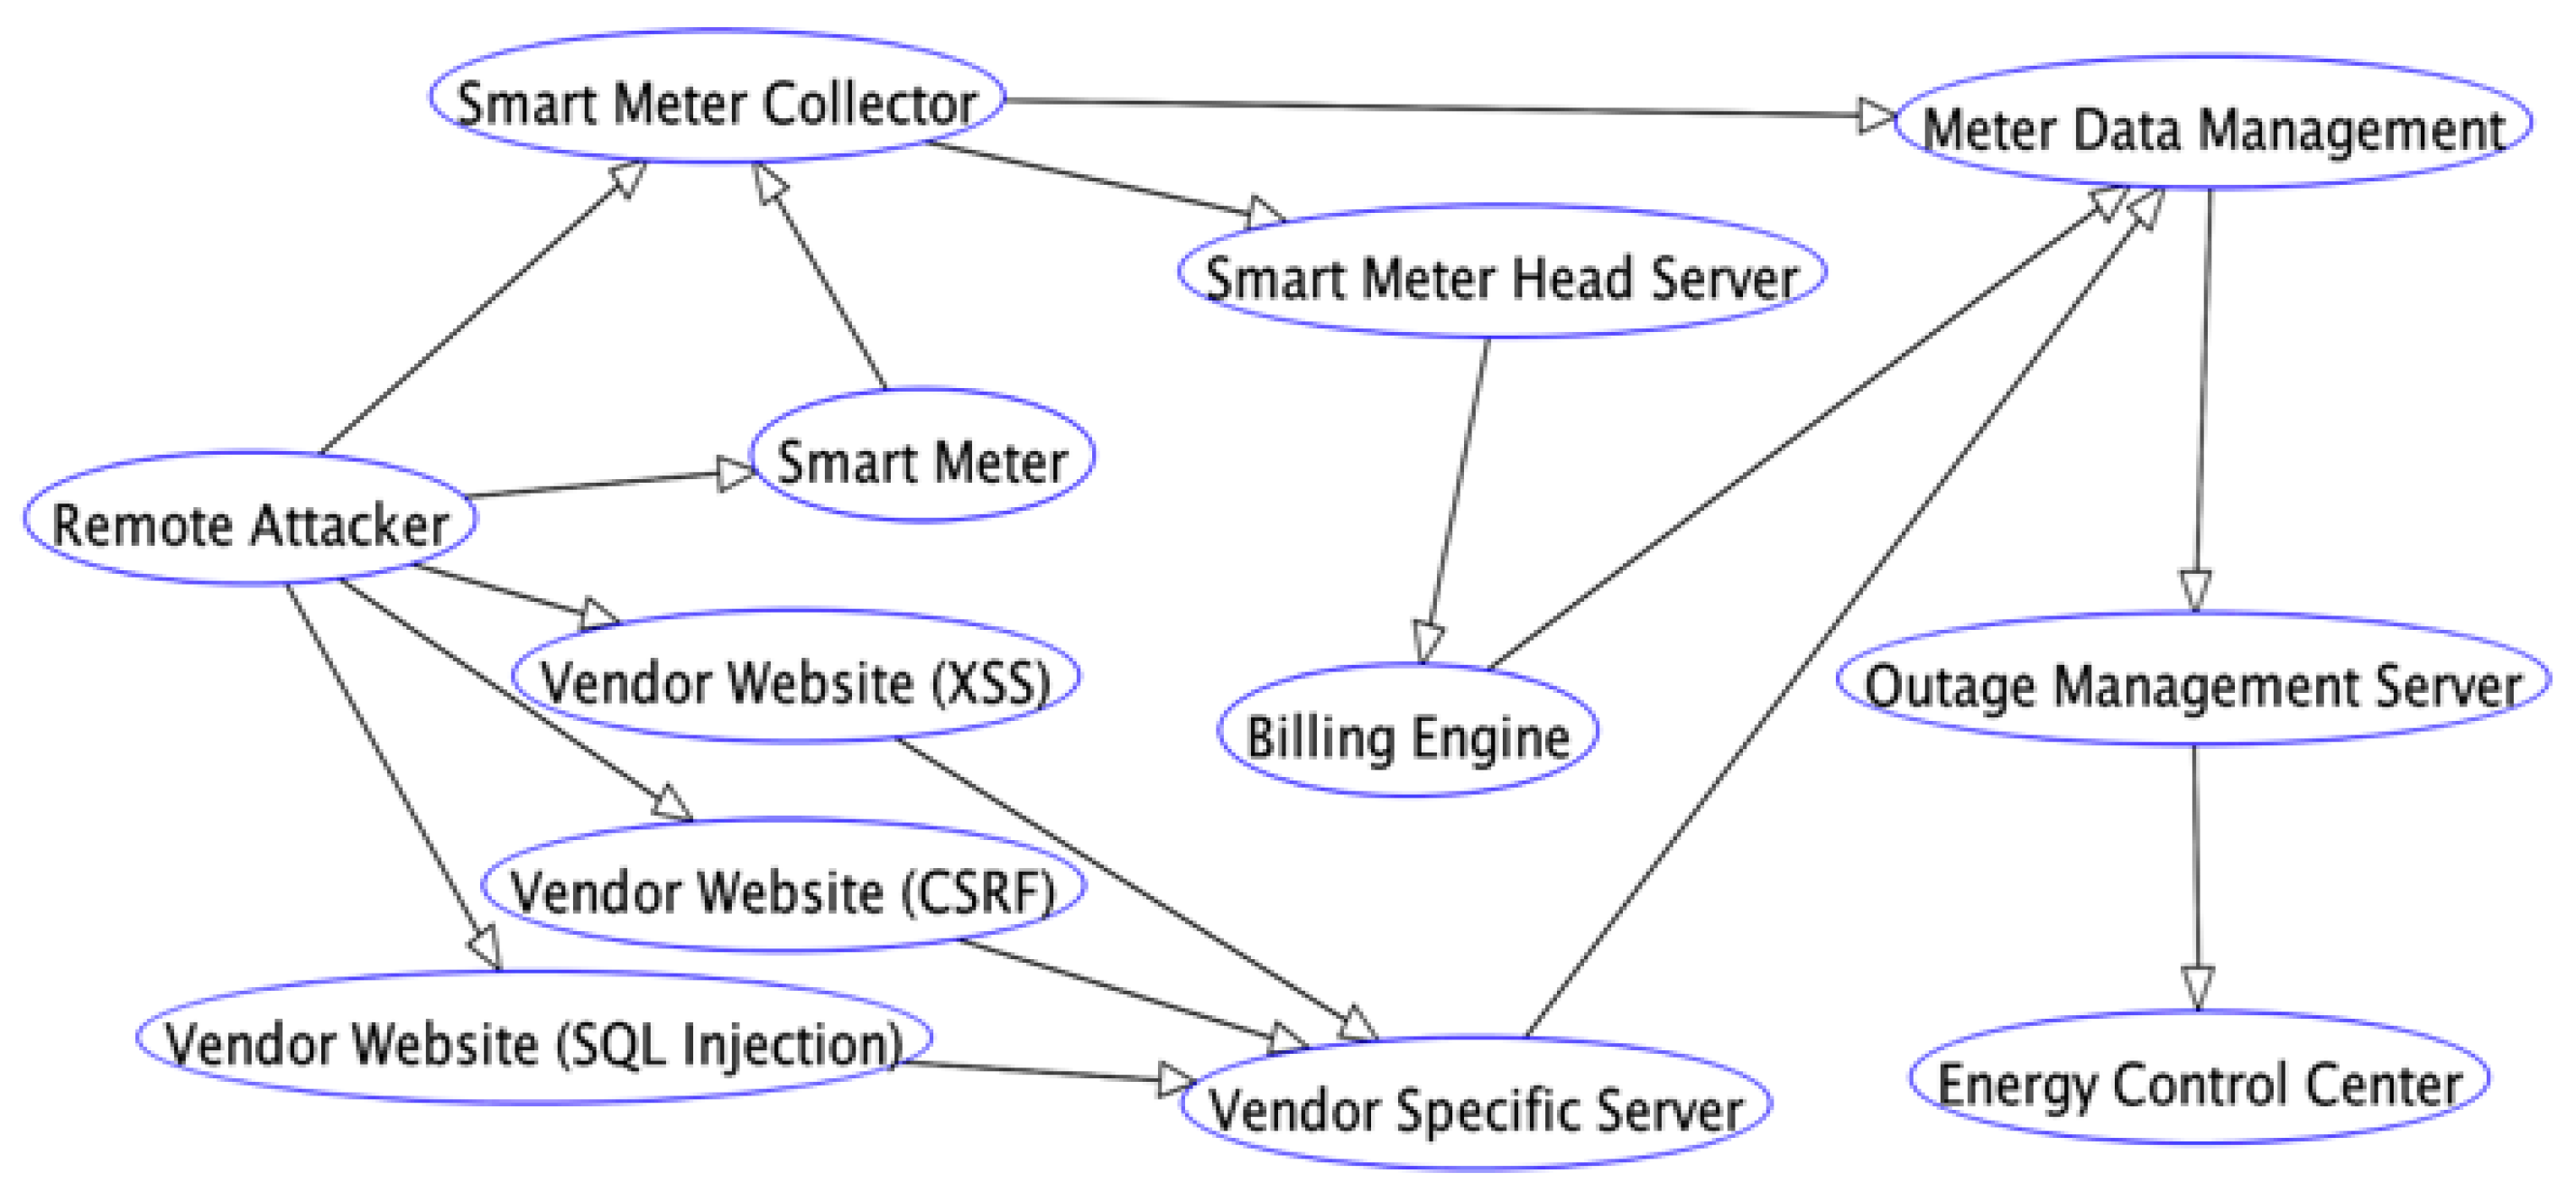
5.7. Simulation Results
Figure 8 represents the BN using Bayes.jar file. This network is used to compute the PoC of all SG cyber functions (shown in
Figure 7). We input all the PoC of all vulnerabilities corresponding to each cyber function into the Byes.jar file.
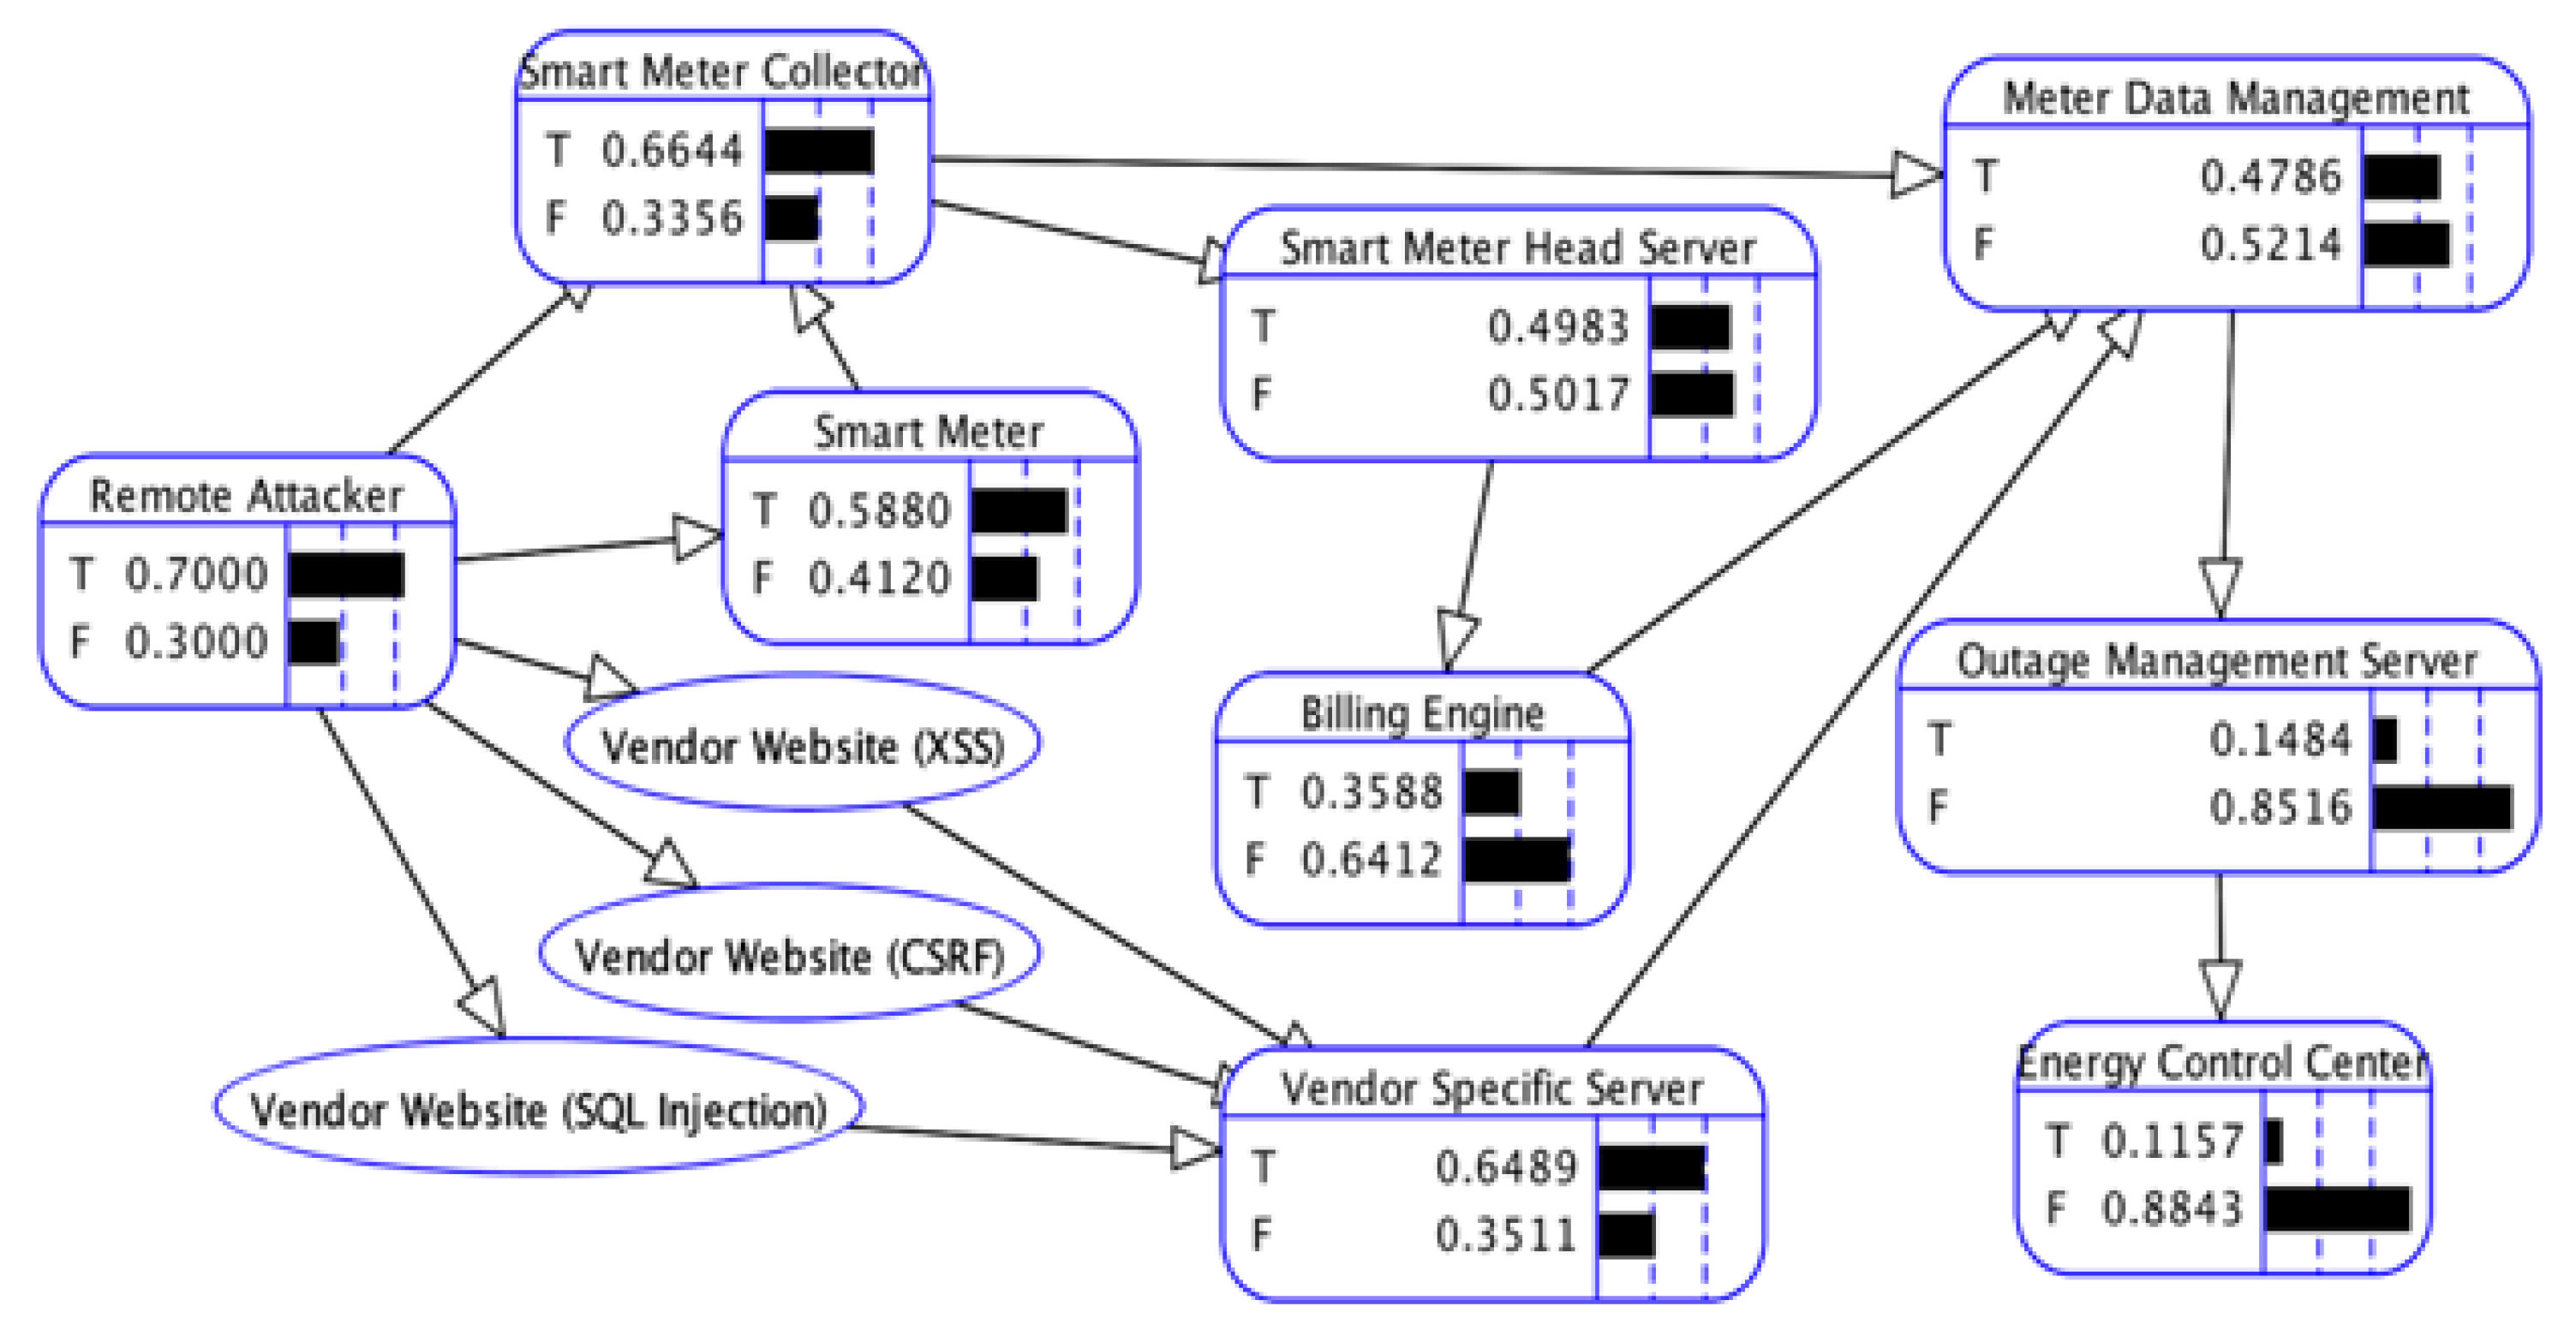
Figure 9 represents the unconditional probabilities of all functions of the SG test network. Each functional node is a Bernoulli variable, where True (T) represents the probability of compromise and False (F) represents the likelihood of no compromise. The probabilities will change if any vulnerability is patched or discovered, and that will change the probability of compromise of other system components since they are connected in the Bayesian network using Bayes’ rule.
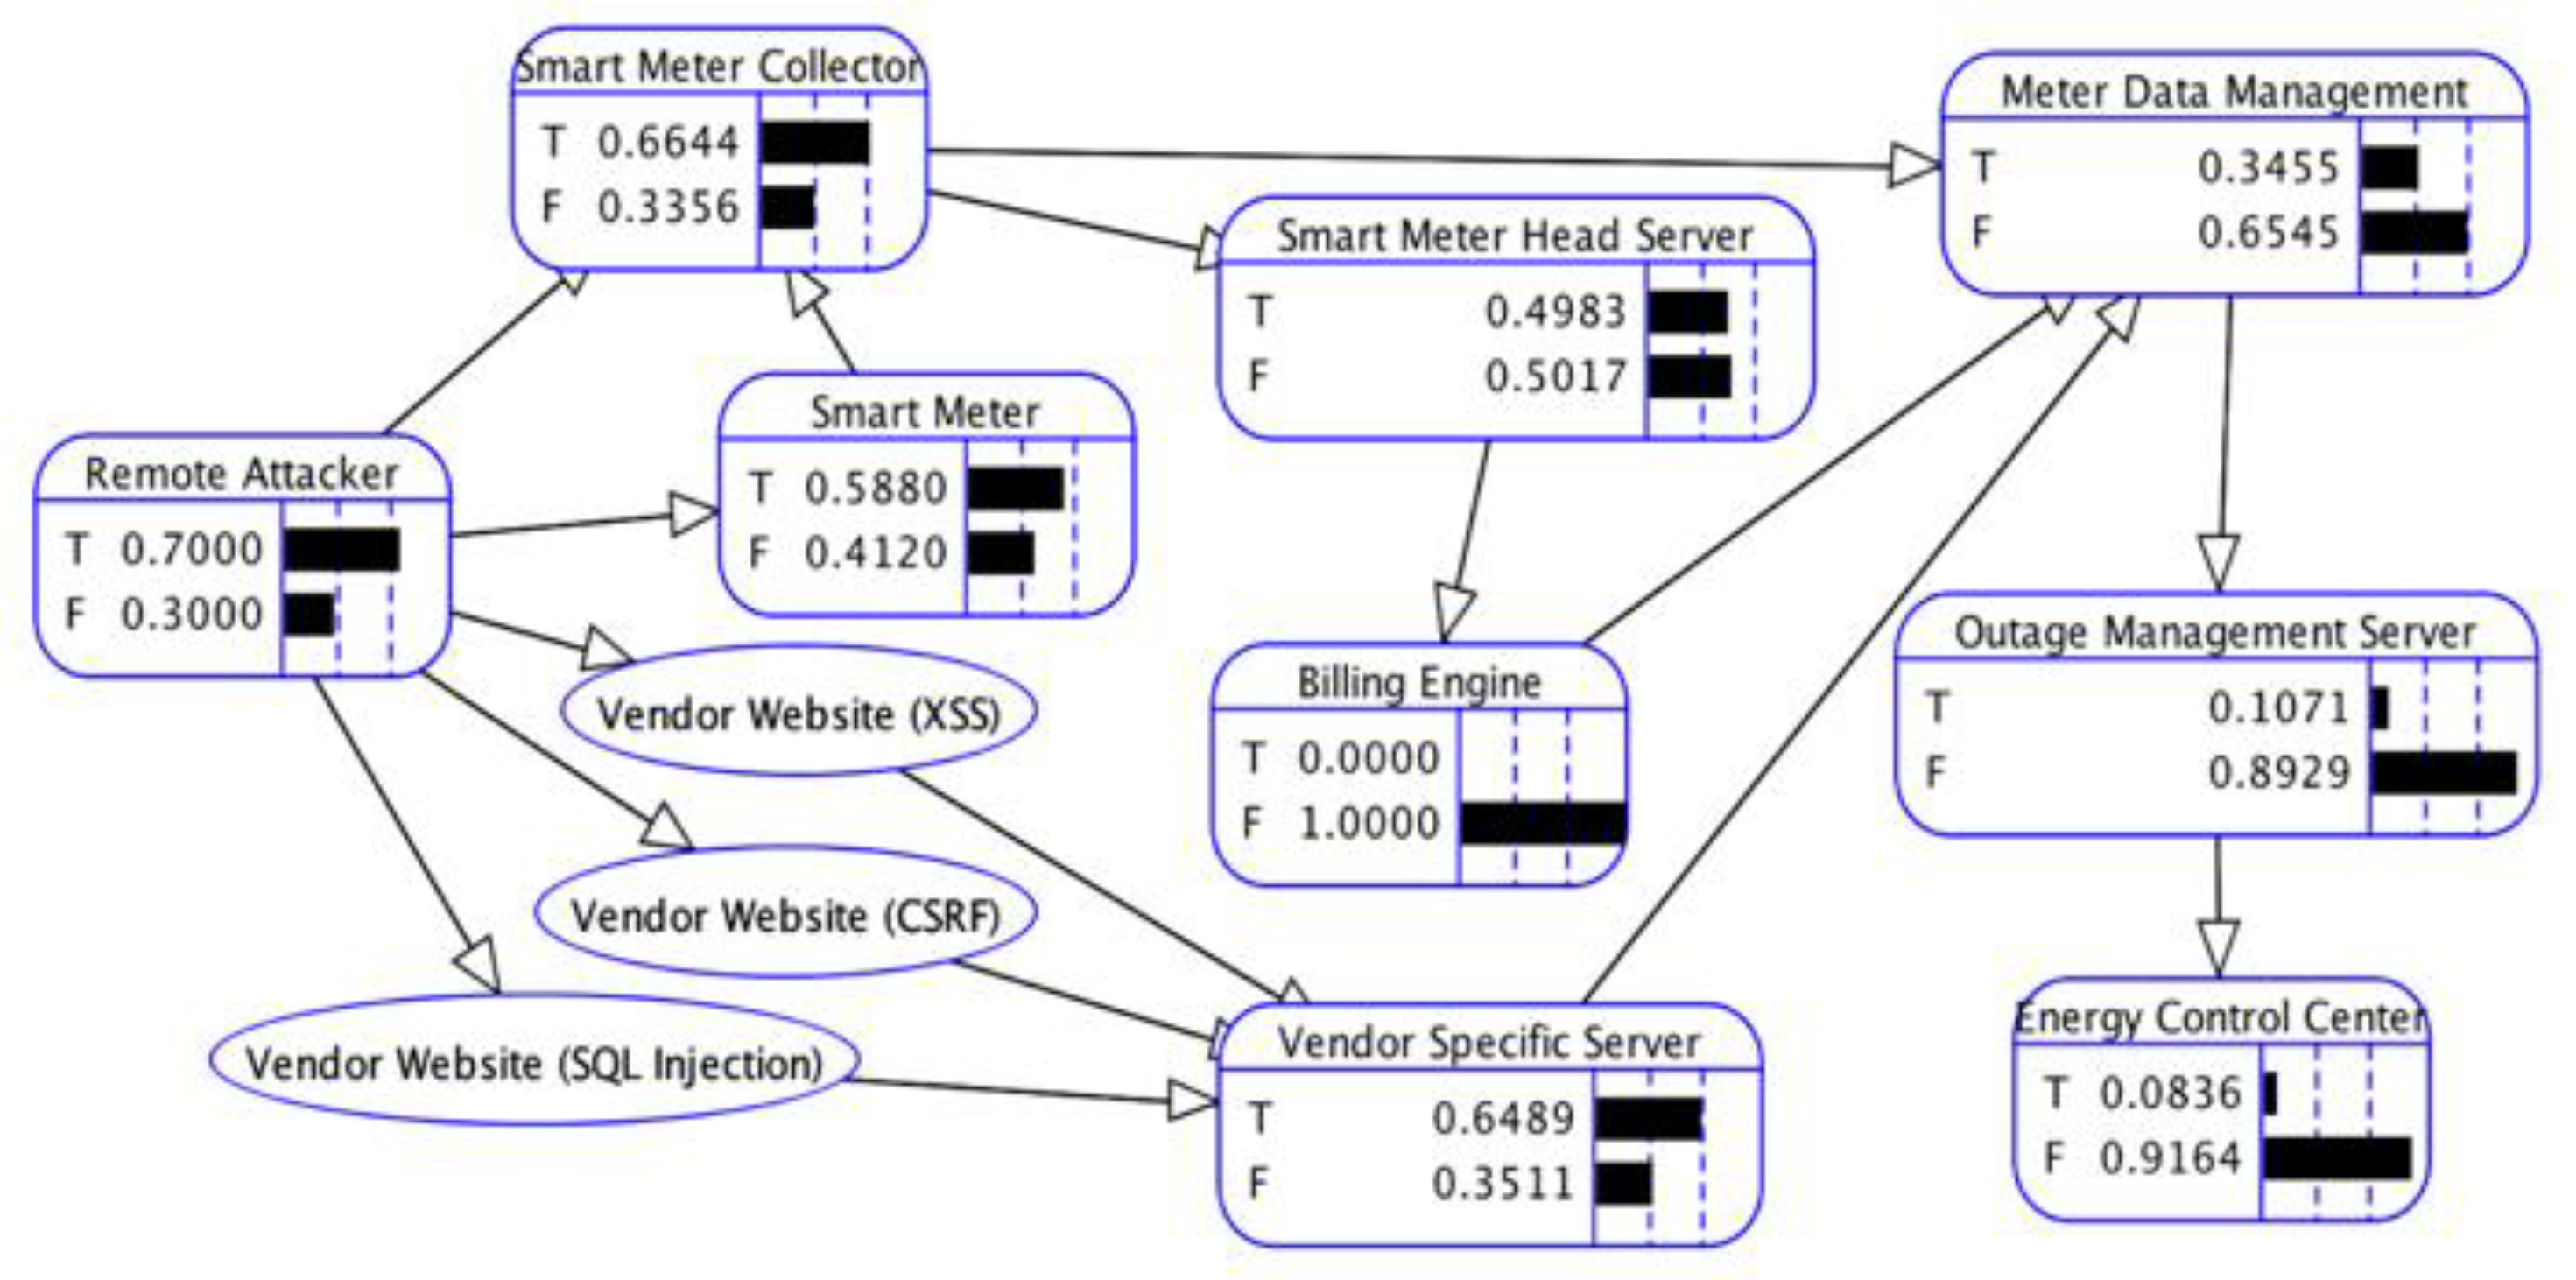
Figure 10 represents a scenario when engineers have patched the billing engine server, and its likelihood of compromise becomes zero.
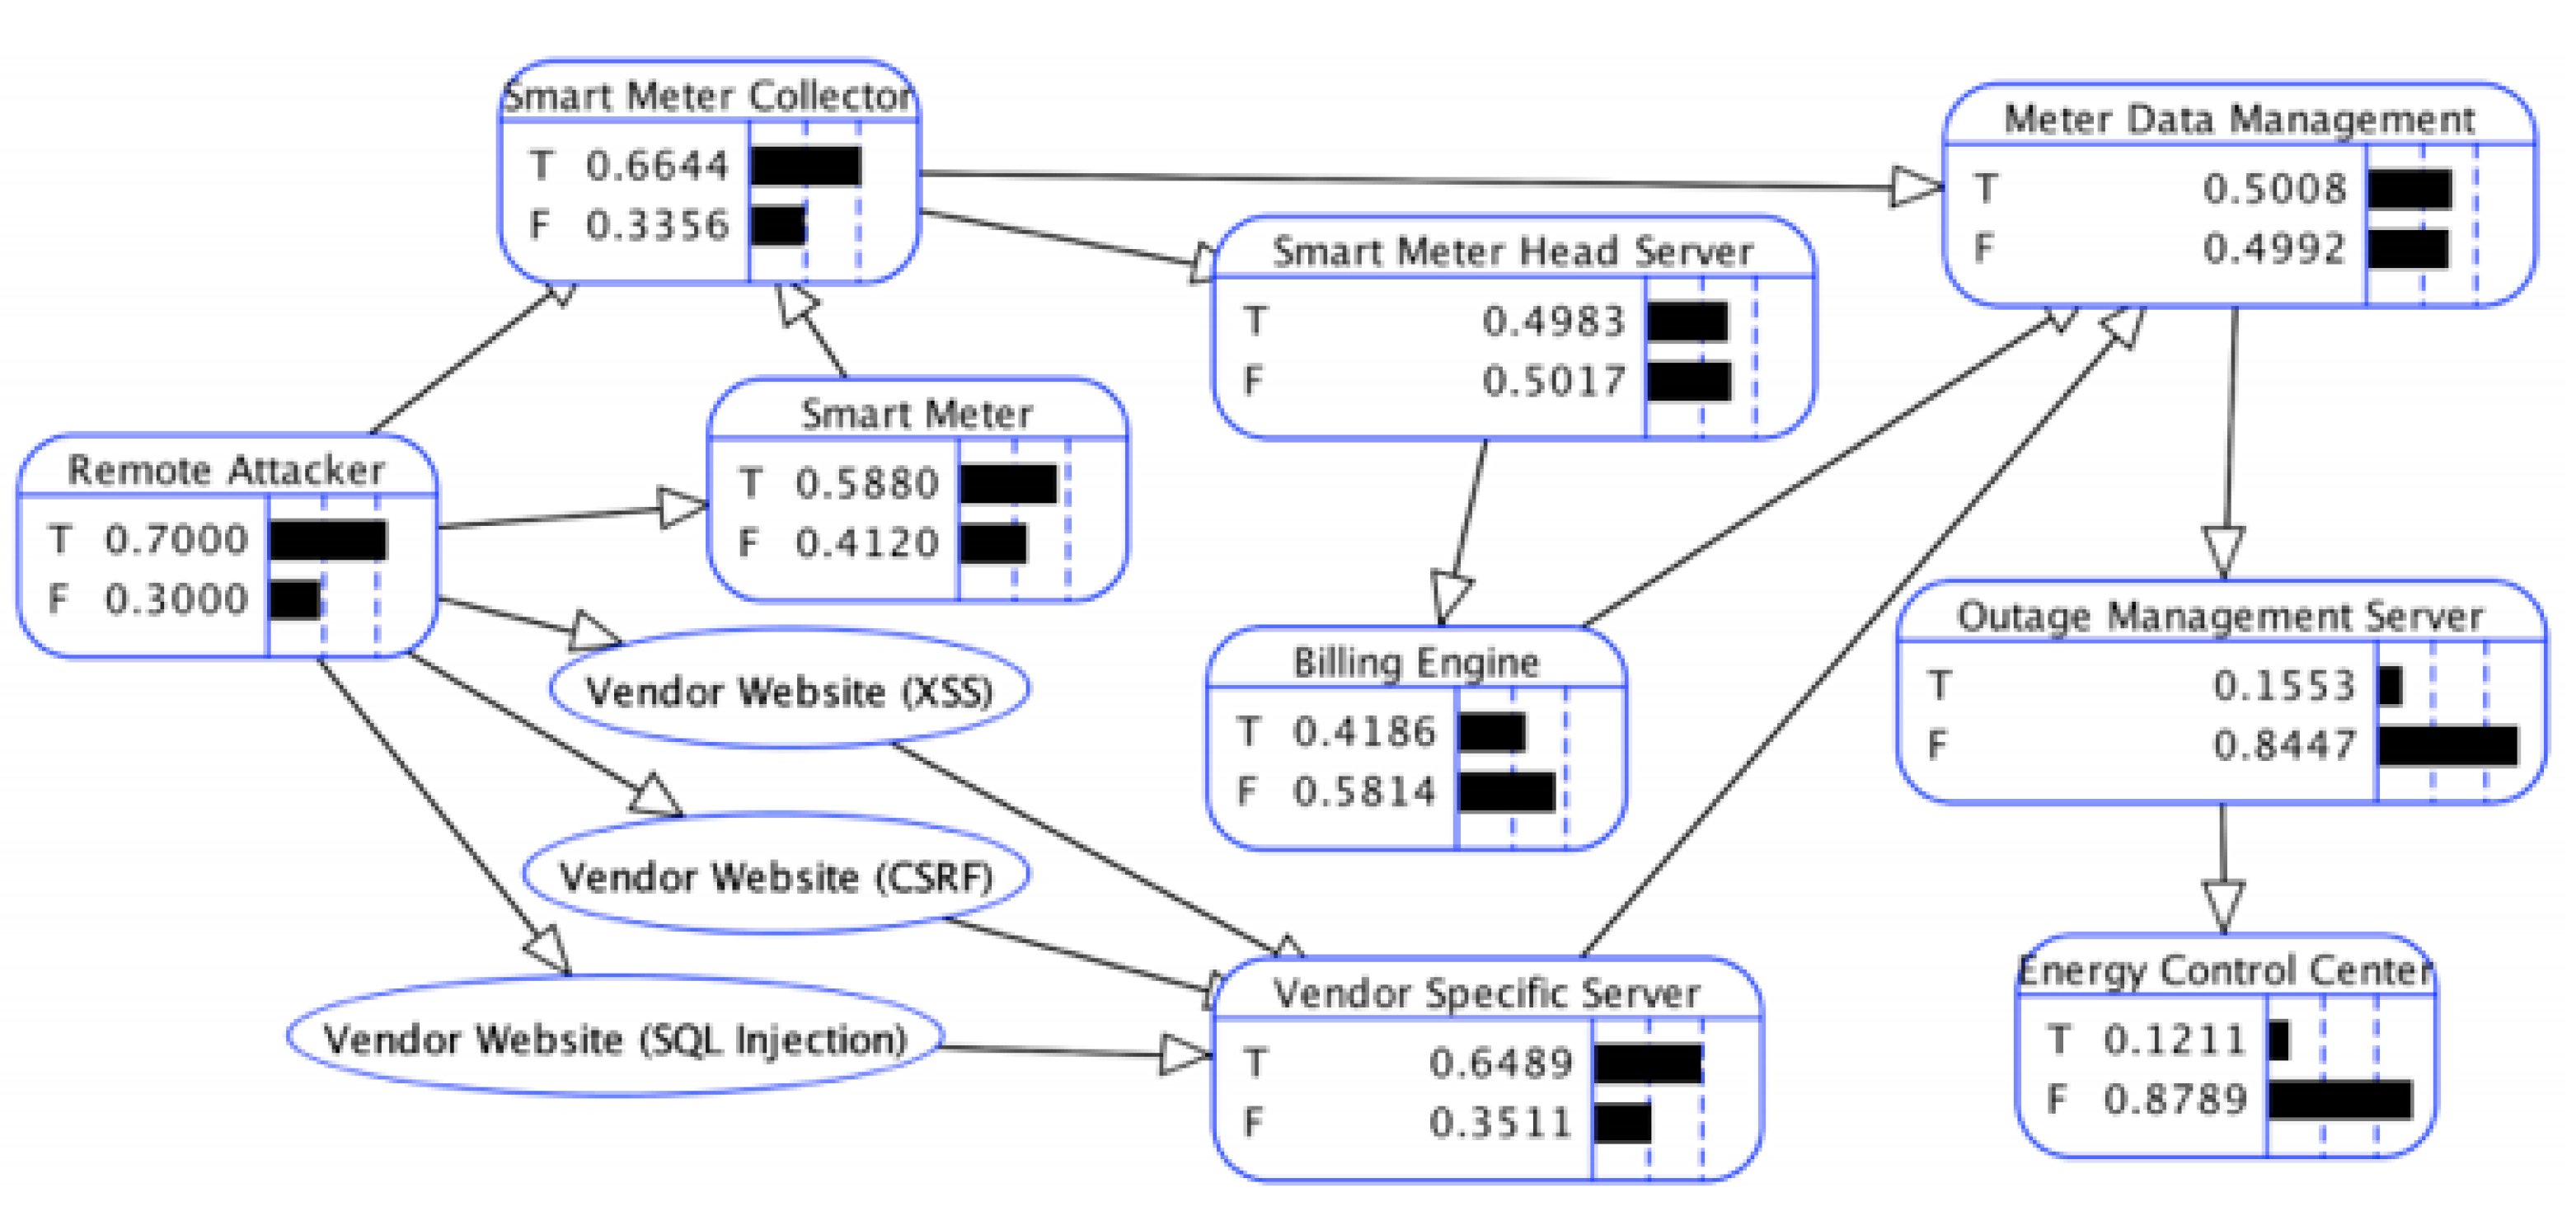
Figure 11 represents the scenario when remote code execution is discovered in the billing engine server and shows how the PoC of its children change. Furthermore, if we know OMS is compromised, we can compute the likelihood of MDM compromise using the posterior probability distribution based on Bayes’ rule.
BAGS quantifies the resilience of the cyber domain of the SG system based on the vulnerabilities of the cyber components. It accounts for the known vulnerabilities for which we compute CVSS scores. If there is any zero-day vulnerability (unknown to the system admin), it does not account for that. The system admin should implement an intrusion detection system on the gateways and install application layer firewall and anti-virus systems in order to detect zero-days. BAGS focuses on the first step of compromising the system, which is exploiting known vulnerabilities and protecting the system from them.
6. Risk Assessment Methodology
The risk is a function of the impact of an event (e.g., cyber-physical attack) and the likelihood of that event (PoC) [
40]. In CPS, the risk is measured in terms of the likelihood of cyber-physical attacks and their impact on the system. The likelihood of CPA depends on the vulnerabilities of the cyber system components that an attacker wants to exploit to mount sophisticated attacks. In order to perform the risk assessment of CPS, we need to compute the likelihood of CPA and analyze their impact. The following steps must be taken by the system admin of a CPS to perform the risk assessment:
Define the cyber system that controls a specific functionality of the physical system, in the form of a directed acyclic graph. The graph represents the information flow from the start of the system to the main system (such as the energy control center in SG).
Define the entry points in the system from the Internet.
Perform the vulnerability assessment of all the cyber components present in the graph.
Compute the CVSS base score corresponding to all vulnerabilities present.
Compute the PoC of each cyber component using the CVSS score of vulnerabilities they possess.
Use the directed graph as a Bayesian graph to compute the causal dependency between the systems. The PoC of each system is now dependent on its parents as well.
The PoC of a cyber component of interest is computed in the Bayesian graph (BAGS tool).
Using the simulator corresponding to CPS (for instance, PowerWorld in SG), perform contingency simulations by manipulating the system on behalf of an adversary.
Quantify the impact of attacks on the system and discover various parameters that are important to system resilience (for instance, frequency boundaries in this case).
Combine the PoC of a cyber component and its impact on the physical domain to determine the risk to the system.
In this paper, we presented the BAGS tool to compute the likelihood of an attack on various cyber systems of SG. Then, we assumed the attacker has compromised a cyber system from where he/she controls a physical process. We perform attacks on behalf of the attacker on the physical system using the PowerWorld simulator to understand the behavior of the grid in the presence of attacks. The likelihood is PoC. We create a range of probabilities and give names to them [
40] (see
Table 2). Since we know the PoC of each function, we can see in which probability range they lie and specify the corresponding qualitative value of likelihood. The impact of attacks depends on whether cyber components can manipulate the frequency of the grid. To manipulate frequency, the system admin must identify which cyber components are responsible for controlling the power generation, distribution, dispatch, storage, smart meters, etc. After identifying components, they should decide which components have a direct or indirect impact. The system admin specifies these values based on his/her experience and contingency analysis of the grid.
The impact of attacks (consequence) is represented in terms of the frequency domain [
10] {restricted, continuous and optimal} (see
Table 3), and accordingly, we specify the qualitative values. The optimal domain is a safe region of operation because of the required amount of load responded to, to bring the frequency to its normal level within the required time. The cyber functions such as billing engine and smart meter head server do not affect the power generation. The continuous domain is a safe region, but not the desired region of operation. The system is not able to curtail the required amount of load within the required time to bring the frequency back to the normal scenario (60 Hz). The system should take actions such as load shedding or increase generation via peaker plants to meet load. The system components such as the smart meter and smart meter collector indirectly affect the frequency by performing load drop or manipulating the readings of the power consumptions if compromised. Finally, the restricted domain is not safe at all. The components such as ECC, OMS and MDM that are responsible for controlling the power generation and dispatch come under this category.
Table 4 maps the likelihood and consequence values to the risk levels. There are three risk levels: {Extreme (E), High (H), Low (L)}. For each function, we know the PoC using the BAGS tool. Moreover, we know the impact on the grid for each function if it gets compromised. Therefore, using
Table 4, we compute the risk level for each function.
Table 5 represents the risk level corresponding to each function based on the PoC and the consequence on the grid. We use probabilities computed in the above table and assign the likelihood and consequence for each function. After referring to
Table 4, we specify the risk level for each function.
ECC is the main component that controls the power generation, distribution and power dispatch. If it gets compromised, the whole grid may get destabilized. Therefore, we put major as the consequence of an attack via ECC, and it has the extreme risk level. Similarly, since OMS is responsible for managing outage power and it makes the decision such as load curtailment and load shedding, OMS also has the major level of consequence and thus extreme risk level. Even if the PoC is rarer or unlikely, if SG suffers an unbearable impact on its frequency, it poses the extreme risk. The billing engine compromise will not affect the grid frequency. Therefore, it has an insignificant consequence, and thus the low-risk level.
The results of this methodology help power engineers to understand which system component is most vulnerable and easily compromised and that will have a significant impact on the frequency (stability) of the system. By combining the vulnerabilities of the cyber system of SG and the attacks on the grid, we provide the complete study of risk analysis of the SG. The risk analysis assists power engineers to understand the system dynamics during contingency and discover the relationship between cyber and physical domain variables. The question now arises how to allocate resources in order to maximize the resilience of the system at minimum cost. We answer this question in the next section using the RL-BAGS tool, an extension of BAGS.
7. Resource Allocation in the Smart Grid
In this section, we extend the BAGS functionality by implementing Reinforcement Learning for Bayesian Attack Graph for Smart Grid System (RL-BAGS) [
14] to provide the ability to compute optimal policies on regular intervals of whether to scan or patch a cyber function of SG. RL-BAGS implements two RL algorithms: Q-learning and State-Action-Reward-State-Action (SARSA) learning, on the generated FBN (BAGS). The SG System Admin (SA) should incorporate BAGS into his/her security operations center to make optimal decisions at regular intervals.
7.1. System Description
Agent: The defender is the only agent in the system. Although there could be multiple defenders trying to protect the system, we consider only one defender that abstracts all other defenders. The main goal of the agent is to patch all the cyber functions of the SG. The defender has no idea of the state of the system. He/she should scan (perform vulnerability assessment) the nodes to know their vulnerability status and perform patching (remove those vulnerabilities by updating the secure version of a software). We have not considered an attacker in this work. Instead, we specify the function states as Hacked. The agent has two actions for each node X: scan-X and patch-X. Since we have seven nodes in the system (according to
Section 5.2), there are 14 total actions (for this section, consider S5 as vendor specifc head and S6 as MDM, rest is unchanged).
System Description: Function Bayesian Network (FBN) built in the BAGS represents the state of the system. In order to discover the set of vulnerabilities of a node, SA must perform the vulnerability assessment. From the vulnerabilities discovered, BAGS computes the probability of compromise for each function using the CVSS score [
39]. A function can stay in any one of the following states: {Unknown, Vulnerable, Hacked, Patched}. The initial state (s
i) of the system is when all the functions’ status is Unknown. SA does not know the status of any function. The terminal states (s
t) of the system are as follows: (1) Terminal State 1: all functions’ status is Patched and, (2) Terminal State 2: Function S7 is Hacked.
State Transition and Rewards:
Table 6 represents how the status of the function changes and what rewards SA will receive for acting. If SA performs the scan function and the previous status of the function is Hacked, the new status will remain Hacked. SA receives −200 rewards since it is a bad move. If the previous state is Unknown, with a random distribution, we decide whether it is Patched, Vulnerable or Hacked. If it is Patched, SA receives zero rewards because it was not worth scanning it, and if it turns out to be Vulnerable or Hacked, SA receives function importance rewards. If SA performs Patch function and the previous status is Hacked or Vulnerable, the next status will be Patched. It is possible that a node which is in the Patched state can be found in the Vulnerable or Hacked state.
Function Significance: The functional significance is precomputed in the system, and it changes with the change in one of the following factors: (1) Asset Value (AV), (2) Rate of Occurrence (RO) of attacks, (3) Risk Exposure (RE), (4) Probability of Compromise (PoC), (5) Influence Of Function (IOF) and (6) Cost (C). For more details, refer to [
14]. If the PoC is not known, we can remove it from the equation and compute importance based on other parameters that are assigned by SA based on his/her experience and the system’s historical attack data. The reward of a function f is represented by:
7.2. Reinforcement Learning
We implement two RL algorithms: Q-learning and SARSA learning.
Q-learning: Q-learning is a model-free RL algorithm [
41]. The algorithm converges to an optimal policy for a finite number of states, and actions for a single agent. It is an off-policy temporal difference algorithm and therefore does not depend on the policy followed by the agent. The agent chooses an action in the environment based on the ε-greedy policy. The greedy policy allows the agent to explore all the states possible with probability ε, and eventually, it will tune the Q-values by choosing the best actions with probability (1 minus ε) that maximize the discounted rewards. The total rewards Q is computed according to (3) and updated according to (4). The optimal actions corresponding to a particular state are determined by Equation (5).
SARSA learning: SARSA is an on-policy model-free temporal difference algorithm. In contrast to Q-learning, it does not find the best action possible that maximizes the rewards; rather it continues to choose the next action using the same policy. The update rule for SARSA learning is according to Equations (6) and (7). λ refers to eligibility trace, and e
t (s, a) denotes the trace of the state-action pair. When λ = 0, there is a one-step backup return as in Q-learning. When λ = 1, there is a one episode backup return as in Monte Carlo. In our model for SARSA learning, λ = 0.4. α ∈ [0,1]: learning parameter, and γ ∈ [0,1]: discount factor.
7.3. Assumptions
We make the following assumptions:
- (1)
The availability of the data is a measurement problem in the SG research field. Therefore, we logically assign the values of the reward function in a way that a critical function value is more as compared to other components.
- (2)
SG is a complex federated system that contains any number of network components. Including all the network components in the simulation will increase the state space exponentially, and it is impossible to track. Therefore, we use FBN built in BAGS as the system state to abstract all the network components.
- (3)
We are computing the optimal policy for the system admin, but not of an attacker. To model an attacker, we introduce the Hacked status for functions randomly during the simulation to learn the behavior of the SA in the presence of Hacked functions.
7.4. Experiment Setup
We use the Brown-UMBC Reinforcement Learning and Planning (BURLAP) java code library [
42] to implement Q-learning and the SARSA learning algorithm. The challenge was to model the problem in the form of the Markov decision process [
43] without the state transition probability function. For this, we implemented the StateWorld class that includes the state transition function given a state and action, reward and terminal function.
7.5. Agent Learning Procedure
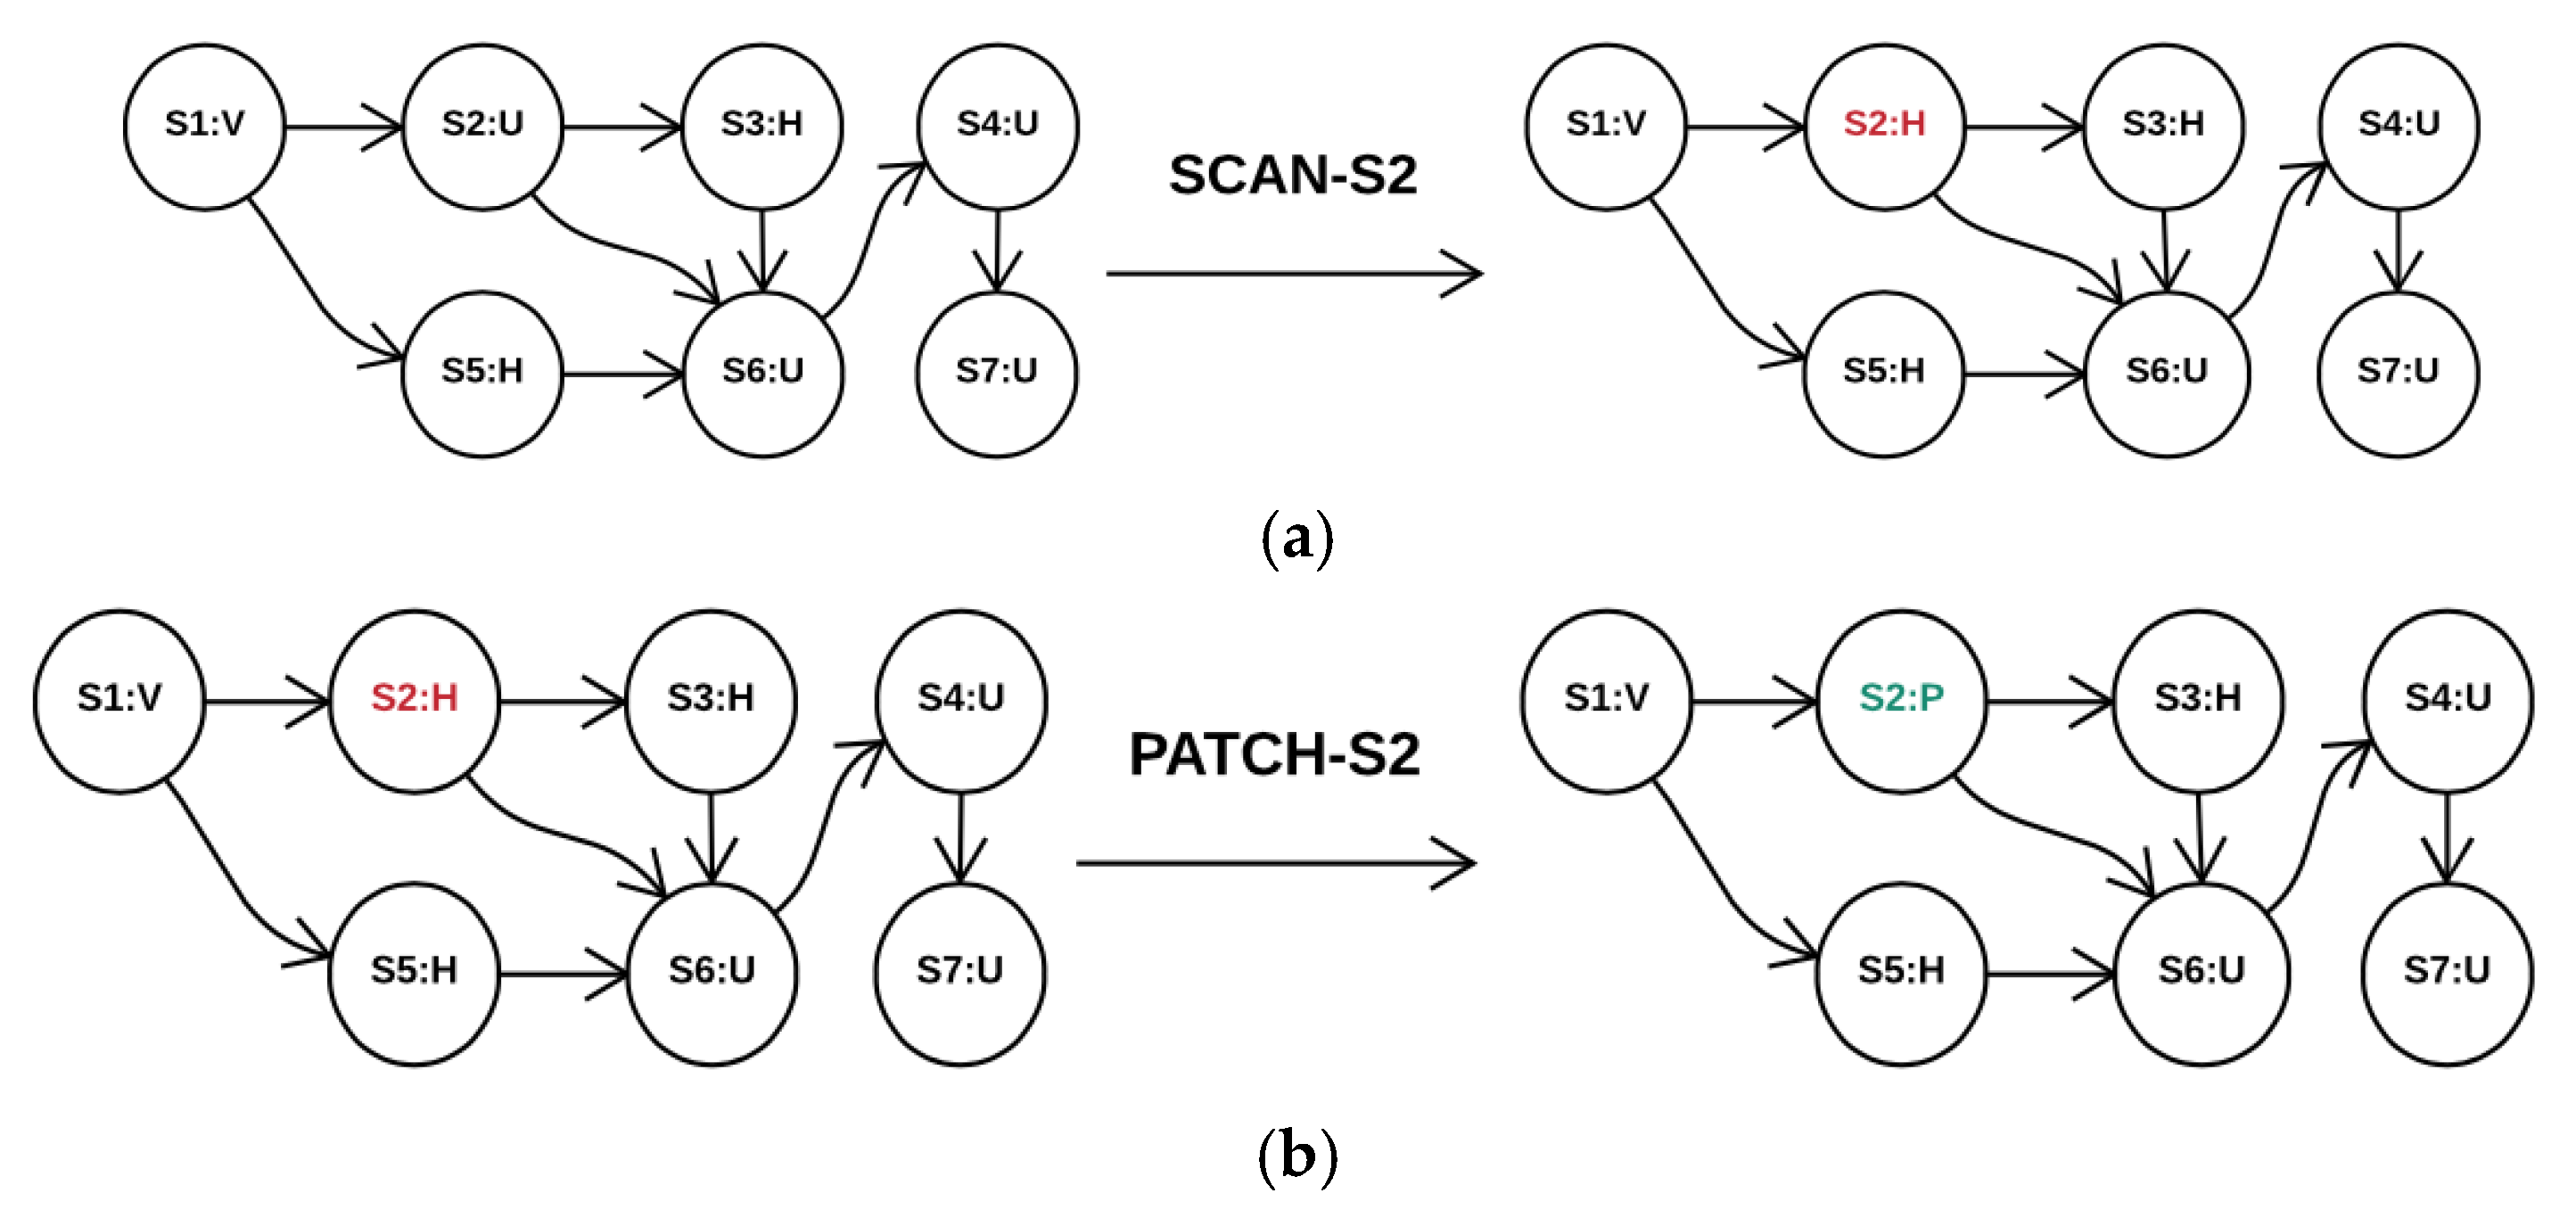
Suppose the initial state of the system is described in
Figure 12a. The status of S2 is Unknown. The system admin takes action scan-S2 and discovers S2 is Hacked. After this action, the system moves to the next state (
Figure 12b). Now, the system admin updates the Q-values of the state-action pair using Equation (4). The system admin now takes action patch-S2, and S2 is Patched in a new state. The agent receives a reward that depends on the importance of the function and updates its Q-values.
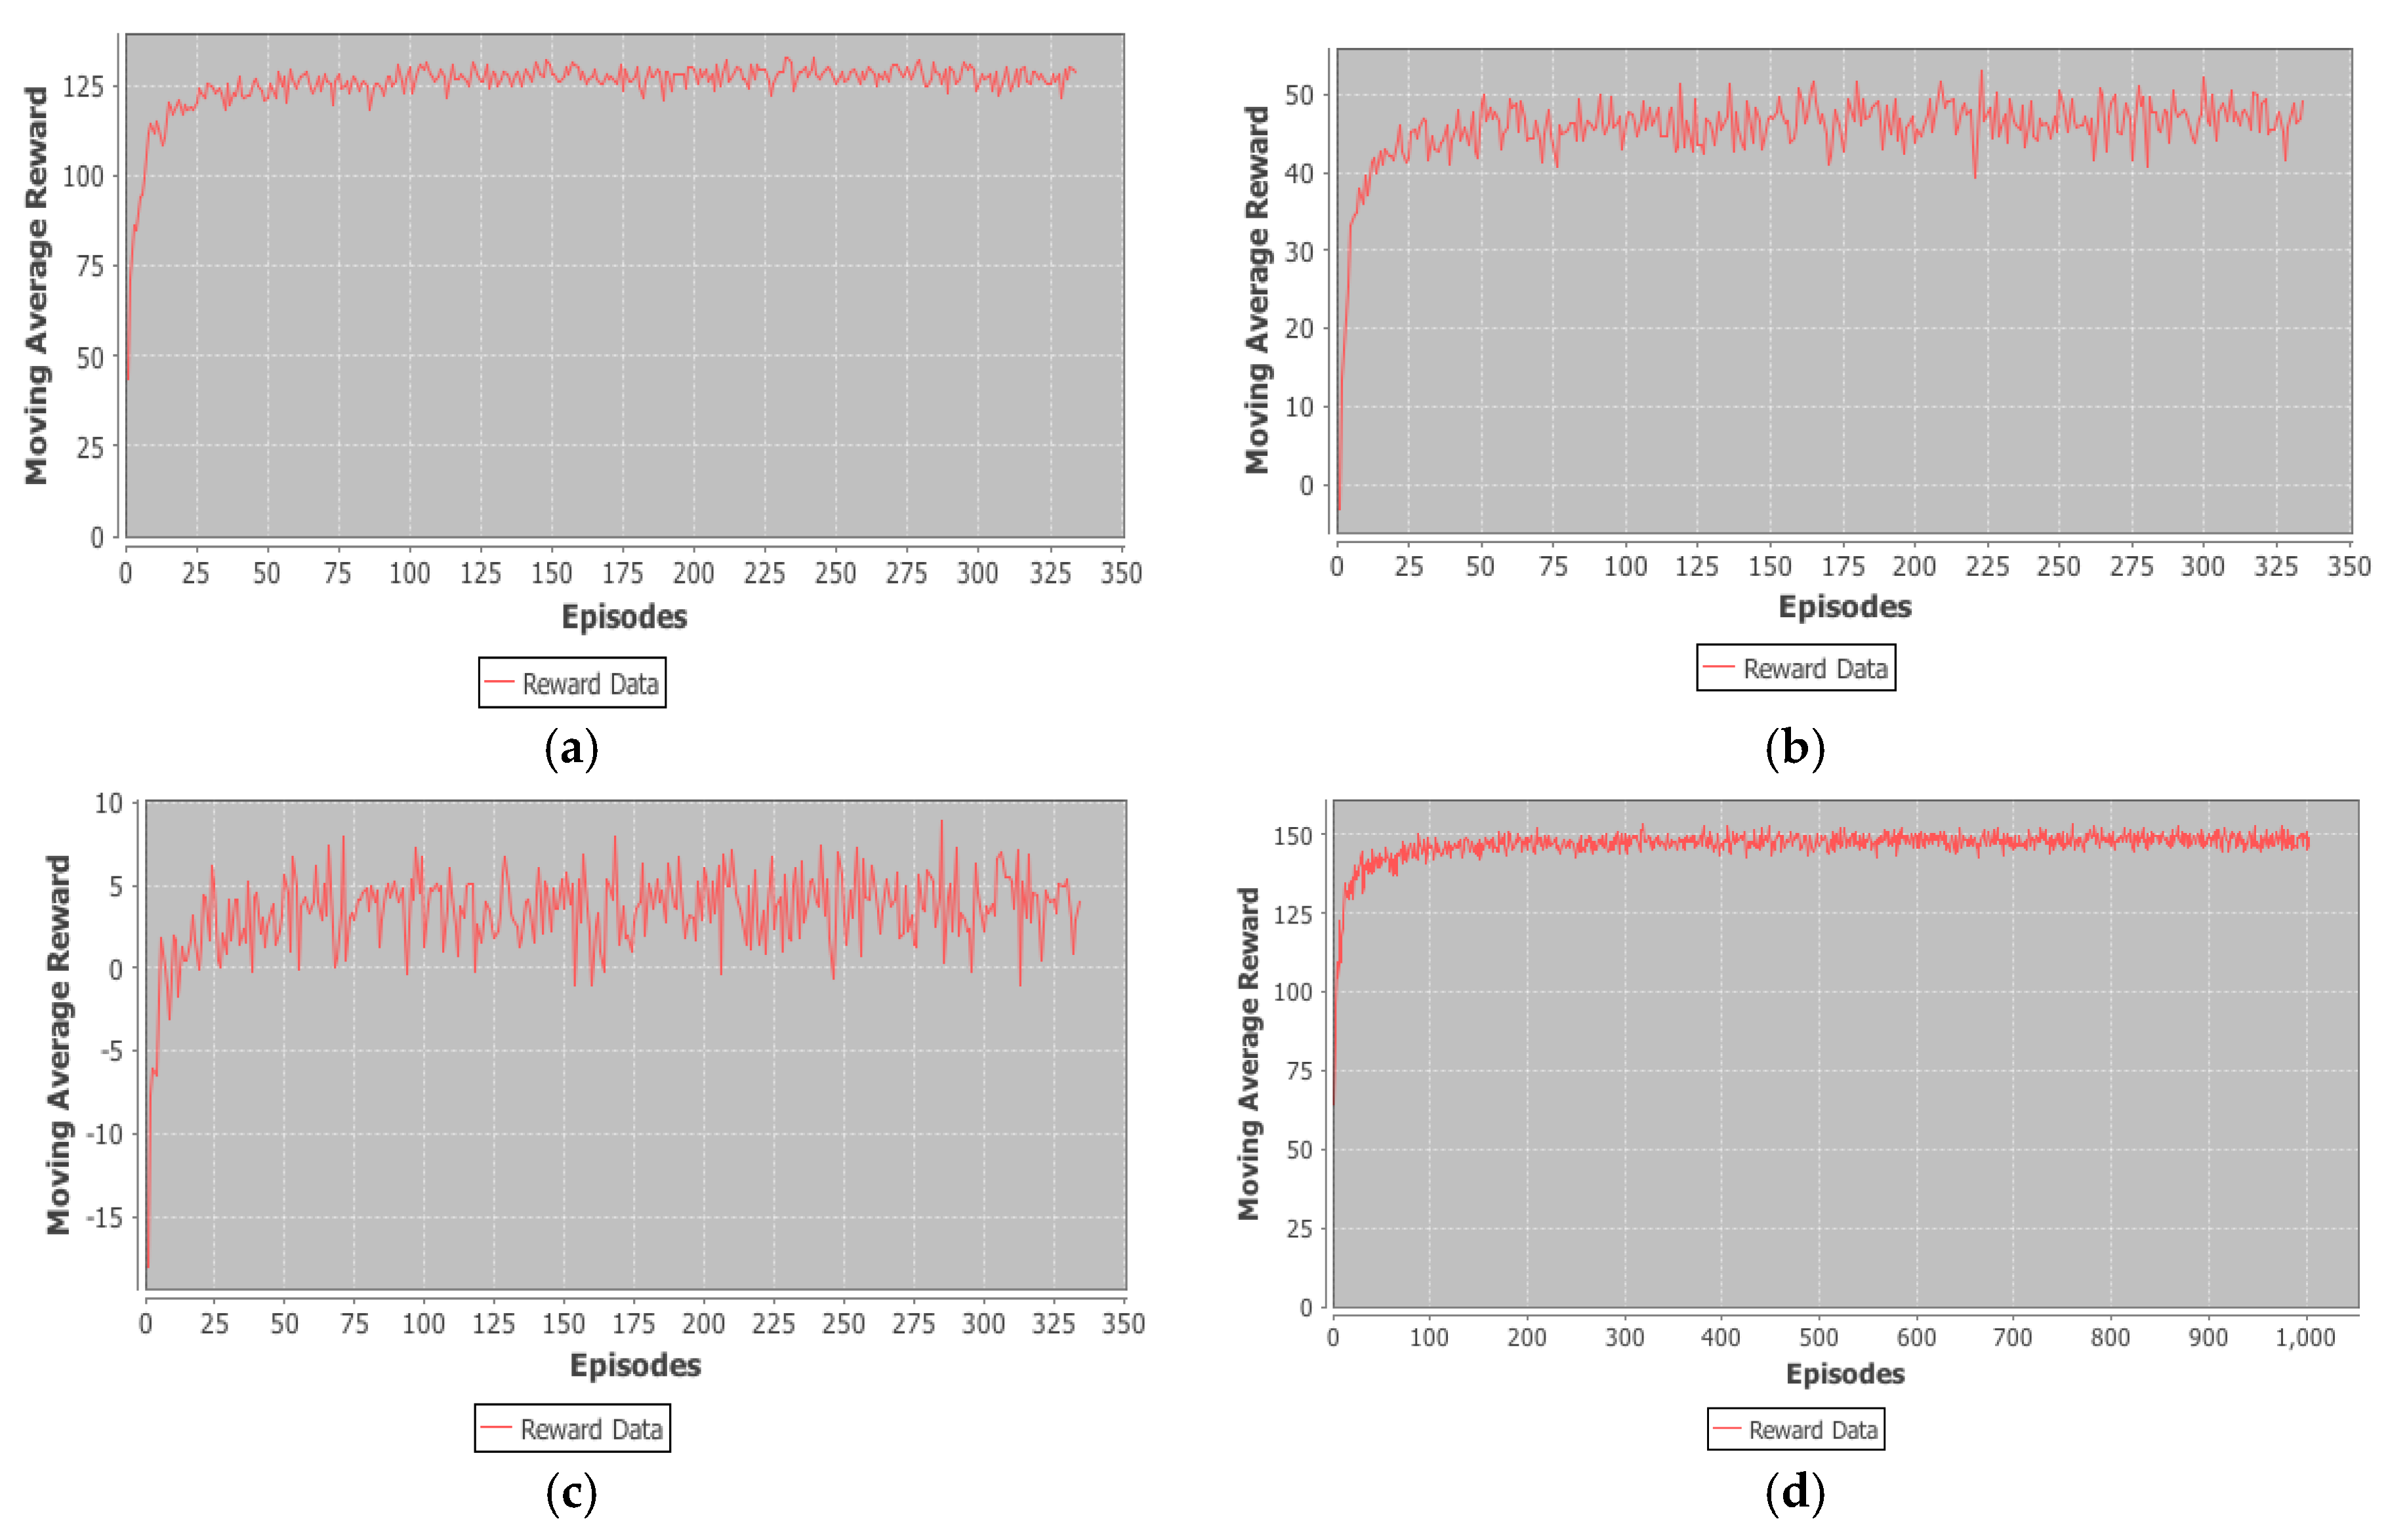
7.6. Simulation Analysis
Figure 13a–d represents the simulation results of RL algorithms that show the moving average reward against the number of episodes. We calculate the moving average reward for 300 episodes: (1) over 100,000 episodes for Q-learning for a value of ε = 0.2 in
Figure 13a, ε = 0.6 in
Figure 13b and ε = 0.8 in
Figure 13c and (2) 300,000 episodes for SARSA learning in
Figure 13d.
The Q-learning algorithm will converge if we set the value to any other constant between [0,1]. The exploration (with probability ε) diminishes over time, and the policy becomes greedy and, thus, optimal. In
Figure 13a, the agent takes the optimal action with probability 0.8 (and random actions with probability ε = 0.2). Therefore, we see stable average rewards after some episodes are completed. In contrast to
Figure 13a, in
Figure 13b,c, the agent takes a random action with high probability (ε = 0.6 for
Figure 13b and ε = 0.8 for
Figure 13c) when the optimal policy has already been computed, and that is why we see variation in rewards even when optimal policy is already learned.
The simulation results show the difference between the Q-learning (off-policy) and SARSA learning (on-policy) approach. The average reward per episode in SARSA learning (see
Figure 13d) is more than Q-learning, which represents that SARSA learning is useful when we want to optimize the reward for the agent that is exploring the state space of the system (not exploiting the best possible action). SARSA follows the current exploration policy, which may or may not be greedy, due to which SARSA learning converges and reaches the terminal state quickly and may have a different optimal policy as compared to Q-learning. It might be possible that Q-learning takes a long time to find an optimal policy as compared to SARSA learning but it always computes the optimal policy at a particular state [
41]. Once the Q-values converge, we calculate the optimal policy using Equation (5). The actions will be stored within the tool after computation, so that SA should be able to access which action to take in a particular state. Consider state: s: {S1: Unknown, S2: Unknown, S3: Patched, S4: Vulnerable, S5: Patched, S6: Unknown, S7: Vulnerable}. Using Q-learning results (
Figure 13c), the best action is patch-S7 (electricity control center) with a Q-value for this state of 282.2781. Since S7 is vulnerable, it is beneficial to protect S7 first, otherwise the admin will receive a −500 reward if it gets compromised. The algorithm may learn the policy to patch some different function because that may lead to compromising of the S7 function. Such actions depend on the importance of the function. If engineers give importance to functions that are present at the start of the graph, the agent will learn a policy to scan and patch those functions first, even if functions present in the end are vulnerable. For more details, refer [
14].
The engineers should choose function importance values carefully in order to learn effective optimal policy. They should compute optimal policies after every regular interval so as to incorporate changes in the system such as a change in vulnerabilities, the importance of the functions, the frequency of attacks occurring on the system, etc. In the next section, we discuss the countermeasures against the CPA.
8. Countermeasures
The attacks we have demonstrated target the grid to create an imbalance in the power demand and supply in a particular region. Once an attacker compromises a cyber system to control a physical process, it is challenging for power engineers to protect the system or prevent further attacks. Furthermore, the attacker performs attacks on regular intervals until the grid loses stabilization. Power engineers do not currently consider such attacks during their contingency planning, and hence, they are unprepared to deal with them. Power engineers should consider such a family of attacks during the contingency planning and provide sufficient resources to withstand them. The resources are as follows:
Power storage at different levels.
The higher capacity of power lines.
Backup power lines for each high voltage line.
Use demand response as a spinning reserve [
11].
Gas storage near peaker plants to recover from the attacks on a gas distribution pipeline.
Use trusted platform chips in each hardware such as Programmable Logic Controllers, Remote Terminal Units, smart meters, etc., so that the attacker is not able to install malwares.
Use the BAGS tool to maintain the security status of various cyber components of the grid.
Patch all the vulnerable and out of date cyber components in the grid using RL-BAGS.
Power engineers must focus on the optimal scheduling of DERs to maintain the resilience of the grid. It involves understanding the power consumption pattern and predicting power outages before they happen.
Power engineers must know the total number of DERs in a given region and the average amount of power generated by them. They should maintain sufficient resources (such as power storage) to mitigate an attack (such as Attack II described in
Section 4.3) on a certain number of DERs so that the area’s frequency never diverge beyond protective thresholds.
Power engineers should perform secure device enrollment into their system so that malicious devices are not enrolled. Many cloud solutions provide secure device enrollment and lifecycle management such as Amazon Cloud [
44], IBM Watson [
45], etc. Furthermore, the devices should be equipped with the trusted platform module so that even if an adversary tries to compromise those devices by installing malware, the system admin will get notified and the device will stop working.
9. Conclusions
In this paper, we described the risk assessment methodology for any CPS. The risk assessment methodology depends on the likelihood and the impact of the attack on the CPS. To compute the likelihood of attack, we presented the BAGS tool. BAGS quantifies the PoC of cyber functions (which control various physical processes) of the SG. We incorporate the dynamic nature of system vulnerabilities into a Bayesian Network and use belief propagation to calculate the PoC. To analyze the impact of CPA, we perform transient contingency simulations in the PowerWorld simulator using the IEEE 9-bus model. We evaluated the resilience of the SG in the presence of CPA using the function-based methodology that abstracts the wide variety of attacks and narrows down the focus of analysis on one primary function, which is power delivery.
Furthermore, we described how CPA originate and what the attack vectors associated with the system are. The area frequency is used as a metric to analyze the system status, and it is used to define the qualitative values for the consequence. We combine the results of the BAGS and transient contingency simulations to determine risk for each cyber function. Risk assessment of each function assists system engineers to understand which system component is most vulnerable and easily compromised, and have a significant impact on the stability of the grid. By combining the vulnerabilities of the cyber system of SG and the impact of attacks on the grid, we provide an in-depth study of risk analysis of the SG. Risk analysis will help engineers to decide the security budget to protect systems. For instance, if cyber systems are vulnerable and likely to get compromised, they have to increase the employee hours to perform vulnerability assessment and patch management. Therefore, the results will help engineers to shape the grid’s operational needs.
We extend the functionality of the BAGS tool to perform optimal resource allocation to secure SG in the presence of attacks using reinforcement learning algorithms (RL-BAGS). We implement two RL algorithms over BAGS, Q-learning and SARSA learning, on the generated BN to learn optimal policies. The results showed that it is possible to learn the policy using model-free RL algorithms. One of the most important parameters is function importance, which must be calculated carefully. We discussed how Q-learning provides an optimal policy by exploiting the best possible action rather than following the current exploration policy, as in the case of SARSA learning. The results of this simulation assist engineers to make an efficient decision subject to budget constraints. Finally, we described some countermeasures to maintain the resilience of SG in the presence of CPA. Power engineers must know the total number of DERs in a given region and the average amount of power generated by them. They should maintain sufficient resources (such as power storage) to mitigate an attack on a certain number of DERs so that the area’s frequency never diverge beyond protective thresholds. We hope this comprehensive analysis of SG security assists engineers to protect the grid against future cyber-physical attacks.
10. Future Work
Storage of energy is one of the strategies of the SG system administrator, and customers in response to SG contingencies. The question arises: what happens if an adversary performs an attack on the energy storage system, and what actions should a defender take to avoid the system failure in response to those attacks? The future work is to provide an in-depth risk assessment of the energy storage systems in the SG and their impact on SGR. Furthermore, in this paper, we do not consider an intelligent adversary who observes the strategy of the defender and then plans his/her action. The future work is to develop resource allocation models in the presence of an intelligent attacker.


