Article

On the Reduction of Transmission Complexity in MIMO-WCDMA Frequency-Selective Fading Orientations via Eigenvalue Analysis

1
Department of Electrical Engineering, School of Technological Applications, Technological Educational Institute of Sterea Ellada, Dirfies Messapies 34400, Greece
2
Intelligent Communications and Broadband Networks Laboratory, School of Electrical and Computer Engineering, National Technical University of Athens, 9 Heroon Polytechneiou str, Zografou, Athens 15780, Greece
3
Department of Electrical and Computer Engineering, Microwaves Lab, Democritus University of Thrace, Xanthi 67100, Greece
4
Radiocommunications Laboratory, Department of Physics, Aristotle University of Thessaloniki, Thessaloniki 54124, Greece
*
Author to whom correspondence should be addressed.
Electronics 2018, 7(10), 239; https://doi.org/10.3390/electronics7100239
Submission received: 18 September 2018 / Revised: 29 September 2018 / Accepted: 3 October 2018 / Published: 5 October 2018
(This article belongs to the Section Microwave and Wireless Communications)

Abstract

:
In this paper, a novel transmission strategy for Mutliple Input Multiple Output Wideband Code Division Multiple Access (MIMO-WCDMA) orientations operating in frequency-selective fading environments is investigated, in terms of overall algorithmic complexity reduction. To this end, Principal Component Analysis (PCA) is employed on the received data matrix, in order to define the significant terms that are taken into account during transmission matrix formulation. According to the presented results, feedback information of only the primary eigenvector of the corresponding covariance matrix of the received data matrix is required, in order to maintain the mean Bit Error Rate (BER) at acceptable levels. In particular, a complexity reduction of up to 10% can be achieved, when comparing BER values derived by the selection of all components of the received covariance matrix during transmission matrix formulation, and the corresponding BER when selecting half of the components. This reduction is maintained to 10%, when considering a realistic four-element antenna design; however, in this case mean BER inaccuracy is further reduced to 1%.

1. Introduction

The rapid growth in the demand for high data rate services in wireless networks over the last decades has boosted scientific research towards the implementation and evaluation of efficient transmission strategies, as well as the reduction of overall transceiver complexity. To this end, in 1998 the Wideband Code Division Multiple Access (WCDMA) physical layer protocol was adopted for the third generation (3G) wireless networks [1]. The key idea was to allow mobile users to transmit simultaneously, occupying the whole transmission bandwidth, by assigning different spreading codes per user during transmission phase. Proper code design should ideally result in minimum auto-correlation and cross-correlation properties for any pair of the considered sequences. Therefore, both Multiple Access Interference (MAI) as well as Intersymbol Interference (ISI) can be significantly mitigated in multiuser scenarios [2]. In addition, Bandwidth on Demand (BoD) can also be supported, either by assigning multiple codes per user or by adjusting the corresponding spreading factor.
Although 3G networks can provide bit rates per user that reach up to 2 Mbps, it soon became apparent that even higher transmission rates should be supported, as in the era of broadband wireless networks various bandwidth demanding services (e.g., video streaming) are quite popular among mobile subscribers. In this context, a practical solution with no additional spectrum requirements is the deployment of multiple antennas at both ends of the wireless transceiver, also known as Multiple Input Multiple Output (MIMO) [3]. The increased degrees of freedom offered by such topologies, can be used either to improve mean Bit Error Rate (BER) or overall network throughput [4]. In the first case, also known as diversity combining (DC) [4], link outage is significantly minimized, since there are multiple independent replicas of the transmitted signal, especially in rich scattering environments. In the second case, also known as spatial multiplexing (SM), independent data streams are transmitted from different antennas. Therefore, bit rate per user can be increased, at the cost however of increased transceiver complexity, since the diversity order of the system is reduced by a factor equal to the number of transmit antennas used for independent stream transmission.
In realistic wireless networks however, the existence of both MAI and ISI can significantly degrade the performance of MIMO transceivers [5]. Therefore, advanced signal processing techniques should be employed at the receiver, in order to maximize DC or SM gain. To this end, various studies in literature examine appropriate transceiver techniques for MIMO orientations, as well as practical limitations from the deployment of MIMO architecture in next generation broadband wireless networks. In this context, in [5] the outage probability and capacity of MIMO-CDMA cellular systems is derived. According to the presented results, intercell interference can significantly degrade the performance of the MIMO orientation in SM scenarios. In [6], the performance of various transmission techniques in MIMO-WCDMA networks is investigated, with and without channel knowledge at the transmitter. As results indicate, adjacent sector cooperation can significantly improve the performance of the cellular orientation, at the cost however of increased signal burden for channel estimation and feedback to the transmitter. In [7], the performance of various precoding matrices is analyzed, when receiver operations are based on Minimum Mean Square Error (MMSE) detection. As results indicate, maximum likelihood detector can improve overall performance when the spatial correlation among the two input streams is taken into account. In [8], the performance of various beamforming algorithms for CDMA systems was evaluated, in terms of algorithmic complexity. In [9], the performance of MIMO-WCDMA downlink systems is investigated with antenna selection at the transmitter in correlated Nakagami fading channels. In [10], the multiuser case is examined in MIMO–WCDMA/HSDPA systems, where an effective user scheduling technique is proposed. In [11], mean BER is improved by applying initial-phase optimized Gold codes in a quasi-static fading channel. In [12], the performance of various beamforming algorithms for CDMA systems is investigated, in terms of achievable algorithmic complexity reduction.
In this work, the performance of a novel approach for MIMO-WCDMA networks is investigated, that is based on eigenvalue decomposition of the received signal matrix. This technique is also known as Principal Component Analysis (PCA) [13]. PCA has been used in various scientific applications (e.g., [14,15]), where the main goal is to reduce signal dimension and consequently algorithmic complexity for signal processing and analysis. Therefore, in this study our main purpose is to reduce signal burden by sending to the transmitter only the primary eigenvector of the corresponding covariance matrix. As in [6], all multipath components contribute to signal estimation at the receiver. This work extends the study initially presented by the authors in the conference paper in [16], as the proposed approached is also evaluated considering a realistic four-element transmit antenna.
In the next section, signal transmission and reception in MIMO-WCDMA networks is described, in terms of equivalent signal matrices. In addition, a theoretical analysis for mean BER estimation is provided as well. In Section 3, the proposed approach based on PCA is analyzed, while results are presented in Section 4. Proposals for future work along with concluding remarks are provided in Section 5.

2. Signal Transmission and Reception in MIMO–WCDMA Networks

2.1. Signal Model and Receiver Operations

In all examined MIMO orientations, it is assumed that downlink transmission takes place and each transmitter/receiver is equipped with Mt/Mr antennas, respectively. The transmitted signal for the kth user (1≤ kK) can be expressed as a product of individual terms [1]:
s k ( t ) = p t , k c k ( t ) t k b k ( t )
where pt,k is the total power allocated to the kth user (1 ≤ kK), bk is the dim × 1symbol matrix, ck(t) is the spreading code and tk the dim × dim transmission matrix, where dim = min(Mt,Mr) represents the dimension of the MIMO orientation (i.e., the number of operating transmit or receive antennas for a square channel matrix). It is assumed that the transmitted signal undergoes multiple reflections from L dominant clusters [17]. Therefore, received signal can be expressed as:
z k ( t ) = l = 1 L H k , l , T k s k ( t τ l ) + k = 1 , k k K l = 1 L H k , l , T k s k ( t τ l ) + n k
where τl and H k , l , T k are the delay and channel coefficients, respectively, of the lth multipath component and nk is the corresponding Gaussian Mr × 1 noise. Each element of H k , l , T k is assumed to be normally distributed with zero mean value and unity variance.
The received signal is processed by a 2-D RAKE receiver, where the time of arrival of each multipath component along with the corresponding channel coefficient are estimated. Hence, the Maximal Ratio Combing (MRC) multiplying vectors per RAKE finger [18] can be formulated as:
r k , l = ( H k , l , T k t k ) H
where the conjugate transpose of a matrix A is denoted by AH. The output dim × 1 signal of the lth RAKE finger of the kth user after correlation with the desired spreading sequence is given by:
u k , l = r k , l ( H k , l , T k t k b k , 0 p t , k + l = 1 l l L H k , l , T k t k ( ρ k , k , | l l | b k , 1 + ρ ¯ k , k , | l l | b k , 0 ) p t , k k = 1 k k K l = 1 L H k , l , T k t k ( ρ k , k , | l l | b k , 1 + ρ ¯ k , k , | l l | b k , 0 ) p t , k + n k )
where ρ k , k , | l l | and ρ ¯ k , k , | l l | are the partial cross correlations [19], bk,0 is the symbol matrix at the current transmission period and bk,−1 is the corresponding transmission matrix at the previous symbol period. The partial cross correlations are given by:
ρ k , k , l = 0 l T c c k ( t l T c ) ¯ c k ( t ) d t
ρ ¯ k , k , l = l T c Τ c k ( t l T c ) ¯ c k ( t ) d t
where x ¯ is the conjugate of x. In Equations (2)–(4), the term Tk indicates the selected set of transmit antennas per active user, given defined by:
T k = argmax T T R ( l = 1 L d = 1 d i m λ m ( H k , l , T H H k , l , T ) )  
In Equation (7), TR is the set of all possible combinations of dim transmit antennas out of Mt and λm(A) is the maximum eigenvalue of matrix A. Considering for example a 4 × 2 MIMO orientation (i.e., Mt = 4 and Mr = 2), then the set TR will be equal to {(1,2),(1,3),(1,4),(2,3),(2,4),(3,4)}.
Under the assumption of independent symbol matrices among the various users of the MIMO–WCDMA orientation, the signal power of the desired user, ISI and MAI power as well as total noise power will be given by Equations (8)–(11), respectively [16]:
P s , k = p t , k l = 1 L r k , l H k , l , T k t k F 2
P I S I , k = | l = 1 L l = 1 l l L ( r k , l H k , l , T k t k ) p t , k ( b k , 1 ρ k , k , | l l | + b k , 0 ρ ¯ k , k , | l l | ) | 2 + l = 1 L ( r k , l H k , l , T k t k p t , k ) H l = 1 L l = 1 l l L ( r k , l H k , l , T k t k p t , k ) ( b k , 1 ρ k , k , | l l | + b k , 0 ρ ¯ k , k , | l l | ) + l = 1 L ( r k , l H k , l , T k t k p t , k ) ( l = 1 L l = 1 l l L ( r k , l H k , l , T k t k p t , k ) ( b k , 1 ρ k , k , | l l | + b k , 0 ρ ¯ k , k , | l l | ) ) H
P M A I , k = k = 1 , k k N ( | l = 1 L l = 1 L ( r k , l H k , l , T k t k ) ( b k , 1 ρ k , k , | l l | + b k , 0 ρ ¯ k , k , | l l | ) | 2 ) p t , k '
P n o i s e = N o l = 1 L H k , l , T k t k F 2
where No is the thermal noise level and A F the Frobenius norm of A. All output expressions from Equations (8)–(11) are dim × dim matrices. Therefore, all transmission matrices should be appropriately selected so as to provide diagonal expressions for each Ps,k matrix.

2.2. Theoretical Background for the Calculation of Mean BER in MIMO-WCDMATtopologies

In this section, the Gaussian approach is described for the calculation of mean BER in a MIMO-WCDMA network. In this context, an arbitrary user (e.g., the kth) is considered as the desired one, and MAI from the rest K-1 users as well as ISI are expressed in terms of the desired user signal. With respect to Equation (10), then [19]:
E { l = 1 L r k , l H k , l , T k t k F 2 , d } l = 1 L { r k , l F 2 , d } p k , d , 1 d d i m
The term {A,x} indicates the xth line of matrixA. In addition:
E { l = 1 L r k , l H k , l , T k t k F 2 , d } l = 1 L { r k , l F 2 , d } 2 p k , d , 1 d d i m
The Signal to Interference plus Noise Ratio (SINR) for the kth user will be given by [19]:
S I N R k , d l = 1 L { r k , l F 2 , d } p k , d ( K 1 ) ( 1 6 P G ) + ( L 1 L ) ( 1 4 P G ) + N o , 1 d d i m
where PG is the system’s processing gain [1]. In Equations (13) and (14), pk,d is the transmission power per active user and mode, subject to:
d = 1 d i m p k , d = p t , k
The desired user signal can be expressed as:
γ k , d = l = 1 L { r k , l F 2 , d } p k , d  
Hence, for BPSK modulation, BER will be given by [18]:
B E R = 1 d i m d = 1 d i m 0 Q ( S I N R k , d ( γ k , d ) ) p γ k , d ( γ k , d )
where p γ k , d ( γ k , d ) is the probability density function (pdf) of the desired user signal of Equation (16), while the Q function is given by:
Q ( x ) = 1 2 π x exp ( u 2 2 ) d u
The pdf of the desired user signal can be evaluated by taking samples from a sufficient number of independent channel realizations. Afterwards, γk,d is calculated for each transmission mode. For a 4 × 2 MIMO network with six multipath components, the pdf functions of the two transmission modes follow the Gamma distribution (Γ(x) is the Gamma function):
f 1 ( x ) = x 27 e x / 0.11 0.11 28 Γ ( 28 )  
f 2 ( x ) = x 18 e x / 0.09 0.09 19 Γ ( 19 )
where x = γk,d. Note that the expressions in Equations (19) and (20) were derived after 107 channel realizations with the help of Matlab©.

3. Reducing Transmission Complexity in MIMO–WCDMA Networks Using PCA

As it was shown in [6], the selection and processing of all multipath components in frequency-selective MIMO-WCDMA networks can improve mean BER. In this context, an iterative transmission approach was proposed that calculates transmission matrices in Equation (8). This algorithm, which is described in Algorithm 1 for the kth user, successively calculates the RAKE multiplying vectors for each multipath component, the total signal power from Equation (8) as well as the transmit weight vector of the desired user, until convergence is achieved. Note that Idim is the dim × dim identity matrix, tr(X) is the trace of matrix X and D is a diagonal matrix indicating the power ratio per transmission mode. However, it is evident from Figure 1, where the pdf of the number of repeats of the Maximization of Signal-to-Noise Ratio (MSNR) algorithm of Algorithm 1 is presented (i.e., mean value of parameter n that indicates total repetitions for convergence), that the mean value can be up to 285 repeats. Note that the curve of Figure 1 is depicted for quanta of L2, since the L2 multip−cation steps to calculate matrix A in Algorithm 1 are also included in the total number of repeats of the MSNR algorithm.
Algorithm 1 Maximization of Signal-to-Noise Ratio (MSNR) Algorithm
Step 1: Set n ← 1, tk,n ( 1 / d i m ) I d i m , P k , n t k , n H t k , n , ε = 10−3
Step 2: r k , l , n = ( H k , l , T k t k , n ) H and A n l = 1 L l = 1 L ( r k , l , n H k , l , T k ) H r k , l , n H k , l , T k , A n U n Σ n V n H
Step 3: tk,n+1 V n D 1 / 2 and P k , n + 1 t k , n + 1 H A n t k , n + 1
Step 4: If   | tr ( P k , n + 1 ) tr ( P k , n ) | ε · tr ( P k , n ) then nn + 1. Go to Step 2
In our proposed approach, the correlation matrix of the received data is first formulated, with dimensions L × L and sorted afterwards. The (i,j) entry of this matrix indicates the degree of correlation among the signals of two different multipaths. Therefore, instead of considering all L2 terms in matrix A formulation, C terms are selected that correspond to the first C dominant terms of the correlation matrix. In this approach, it is assumed that all received data for an arbitrary user after RAKE processing can be stacked as an L × S matrix (denoted as Z throughout the rest of the manuscript), where S indicates the samples per observation [13]. The received data matrix per transmission mode will be given by:
Z k , d ( l , s ) = z k , d , l , s , 1 d d i m , 1 l L , 1 s S
In Equation (21), zk,d,l,s is the sth received symbol from the kth user in the lth RAKE finger and dth transmission mode (S denotes the total number of transmitted symbols). Hence, the correlation matrix will be given by:
C Z k , d ( l , l ) = 1 S s = 1 S z k , d , l , s z k , d , l , s ¯ ,   1 d d i m , 1 l , l L , 1 s , s S
With the help of PCA, a different representation of Zk,d can be formulated (i.e., Yk,d = PZk,d), so that the new correlation matrix, namely C Y k , d = ( 1 / S ) Y k , d Y k , d H will be a diagonal οne. In this case, the final set of data can be decomposed to individual orthogonal representations, also known as principal components. The importance of each principal direction is now measurable. Namely, the variances associated to each direction (i.e., rows of P) quantify how “principal” each direction is by rank-ordering each basis vector according to the corresponding variances. The reconstruction of matrix C Z k , d is performed according to the following equation:
C Z k , d = V ( 1 : L , 1 : w ) H Σ ( 1 : w , 1 : w ) V ( 1 : L , 1 : w )
where w (1 ≤ wL) is the number of dimensions that are considered at matrix reconstruction, while V and Σ correspond to the eigenvector and diagonal eigenvalue matrix, respectively, of C Z k , d . Notation a:b indicates all elements from a to b with unity step. Hence, matrix C Z k , d can now be sorted, where the indexes of each sorted value are stored in the two-dimensional matrix B. Therefore, the modified matrix A can be alternately written as:
A c = 1 C ( r k , B ( c , 1 ) H k , B ( c , 1 ) , T k ) H r k , B ( c , 2 ) H k . B ( c , 2 ) , T k
In this case, the C (1 ≤ CL2) most important terms can be taken into account during matrix A formulation. In the results that will be presented in the following section, C is chosen to be an even number, since C Z k , d ( l , l ) = C Z k , d ( l , l ) ¯ . This technique, which will be referred as MSNR-PCA algorithm throughout the rest of the paper, is described in Algorithm 2. Note that O M t x M t is a zero matrix of dimensions Mt × Mt, while the output of B k sort ( C Z k ) is an L2 × 2 two dimensional matrix, where for example the kth pair of rows corresponds to the (i,j) indexes of the kth maximum value of C Z k .
Algorithm 2 Maximization of SNR Algorithm based on Principal Component Analysis (PCA)
Step 1: k ← 0
Step 2: k k + 1 ,   B k sort ( C Z k U ) , B k B k ( 1 : C )
Step 3: Set n ← 0, t k , n ( 1 / d i m ) I d i m , P k , n t n , i H t n , i , ε = 10−3 and r k , l , n = ( H k , l , T k t k , n ) H , 1 l L
Step 4: n n + 1 ,   A n O M t x M t
   for j = 1:1:C
     A n A n + H k , B k ( j , 1 ) , T k H r k , B k ( j , 1 ) , n H r k , B k ( j , 2 ) , n H k , B k ( j , 2 ) , T k
   end
Step 5: t k , n + 1 V n D 1 / 2 , r k , l , n = ( H k , l , T k t k , n ) H , 1 l L P k , n + 1 t k , n + 1 H A n t k , n + 1
Step 6: If | tr ( P k , n + 1 ) tr ( P k , n ) | ε · tr ( P k , n ) algorithm terminates, else go to Step 4. Then go to Step 2.
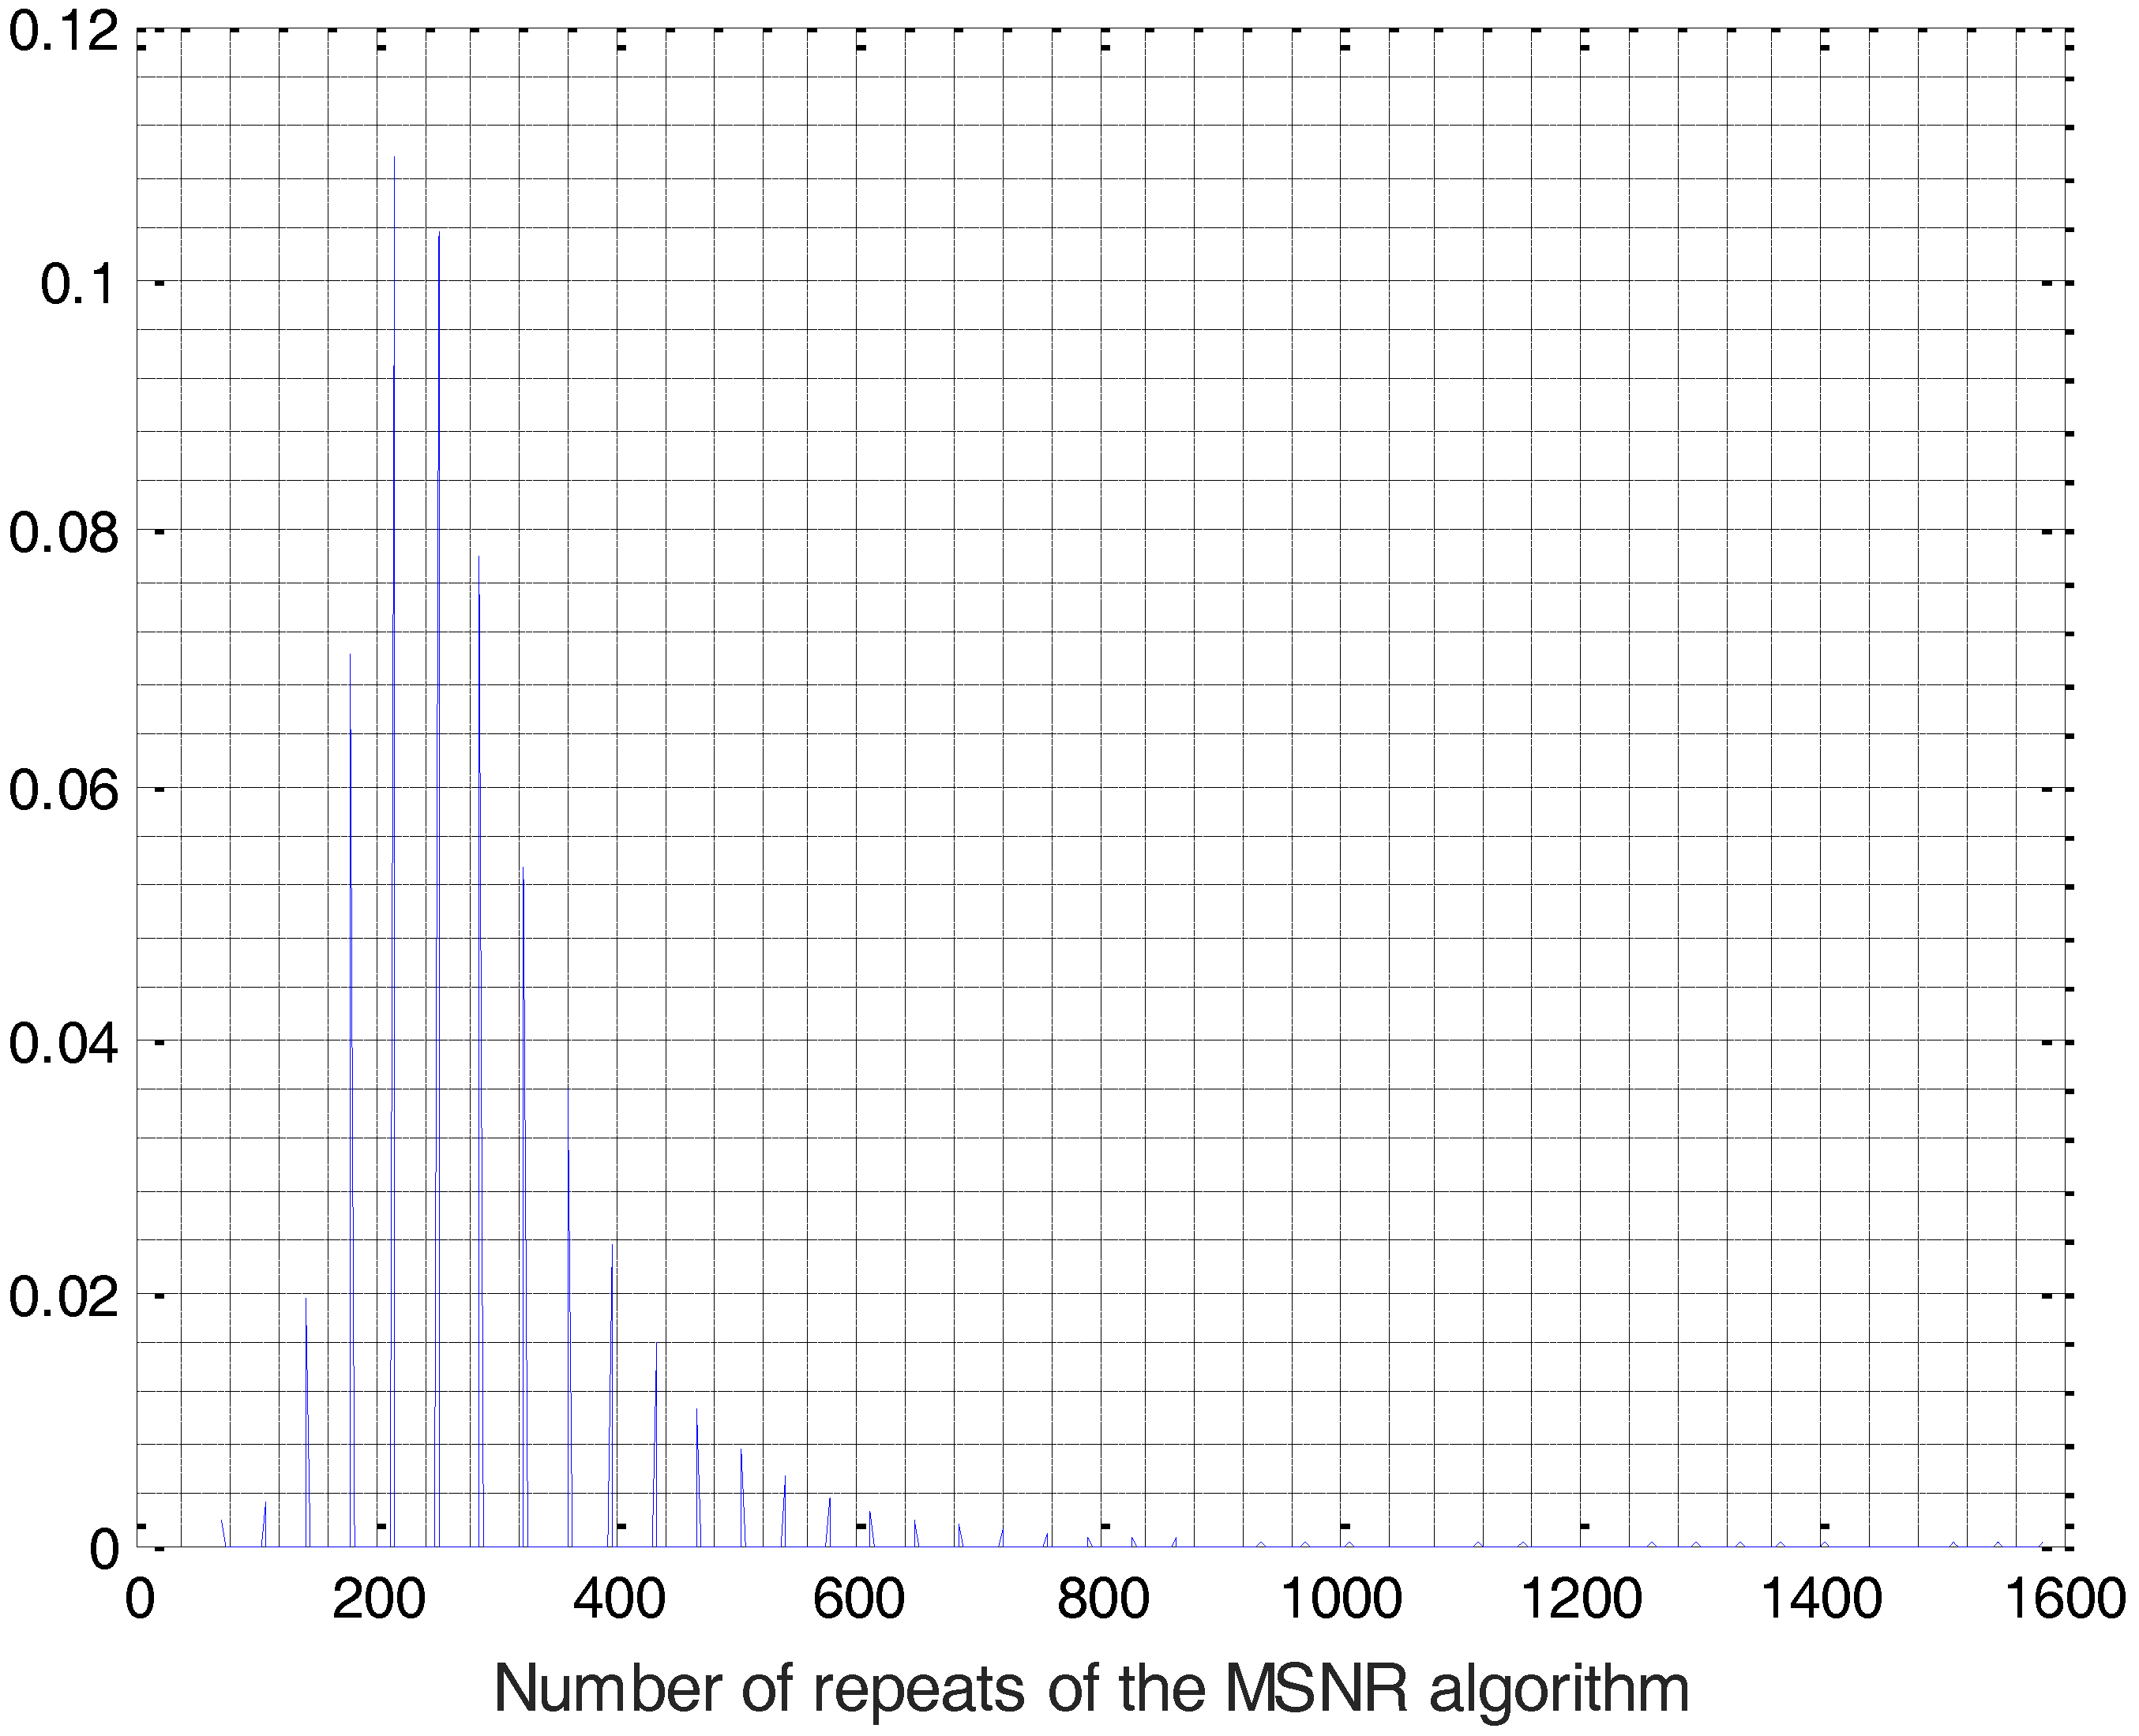
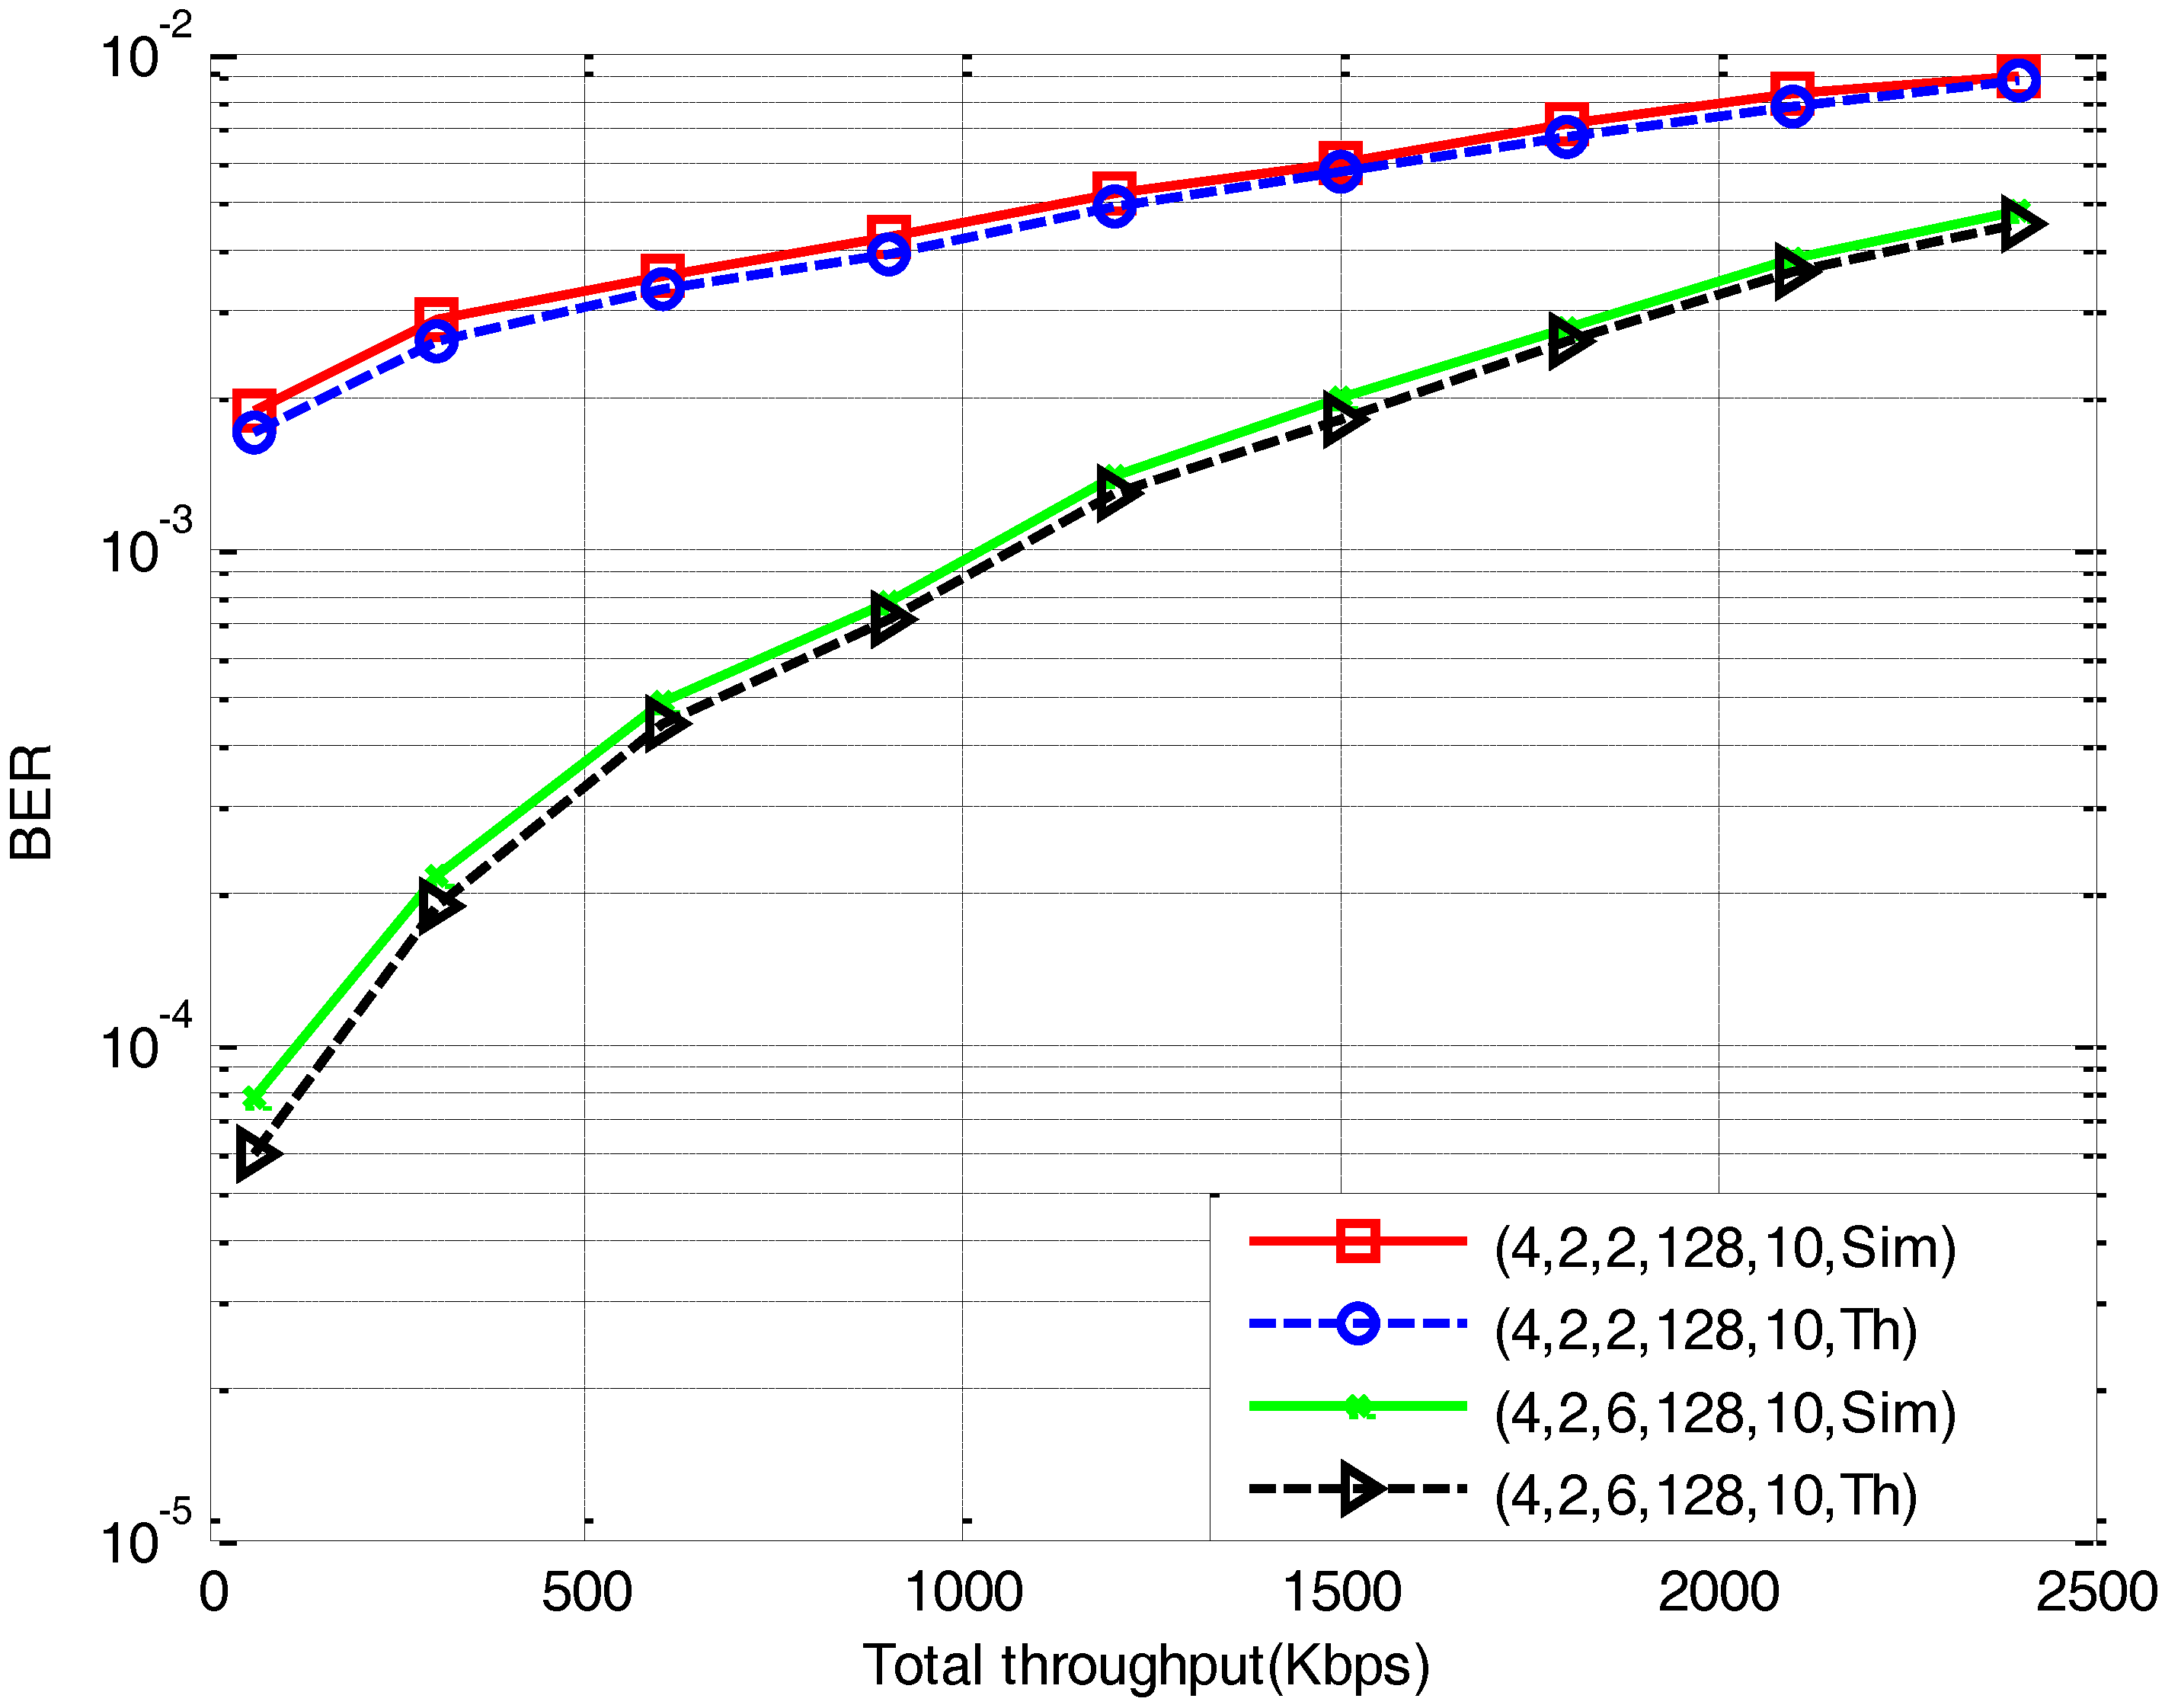
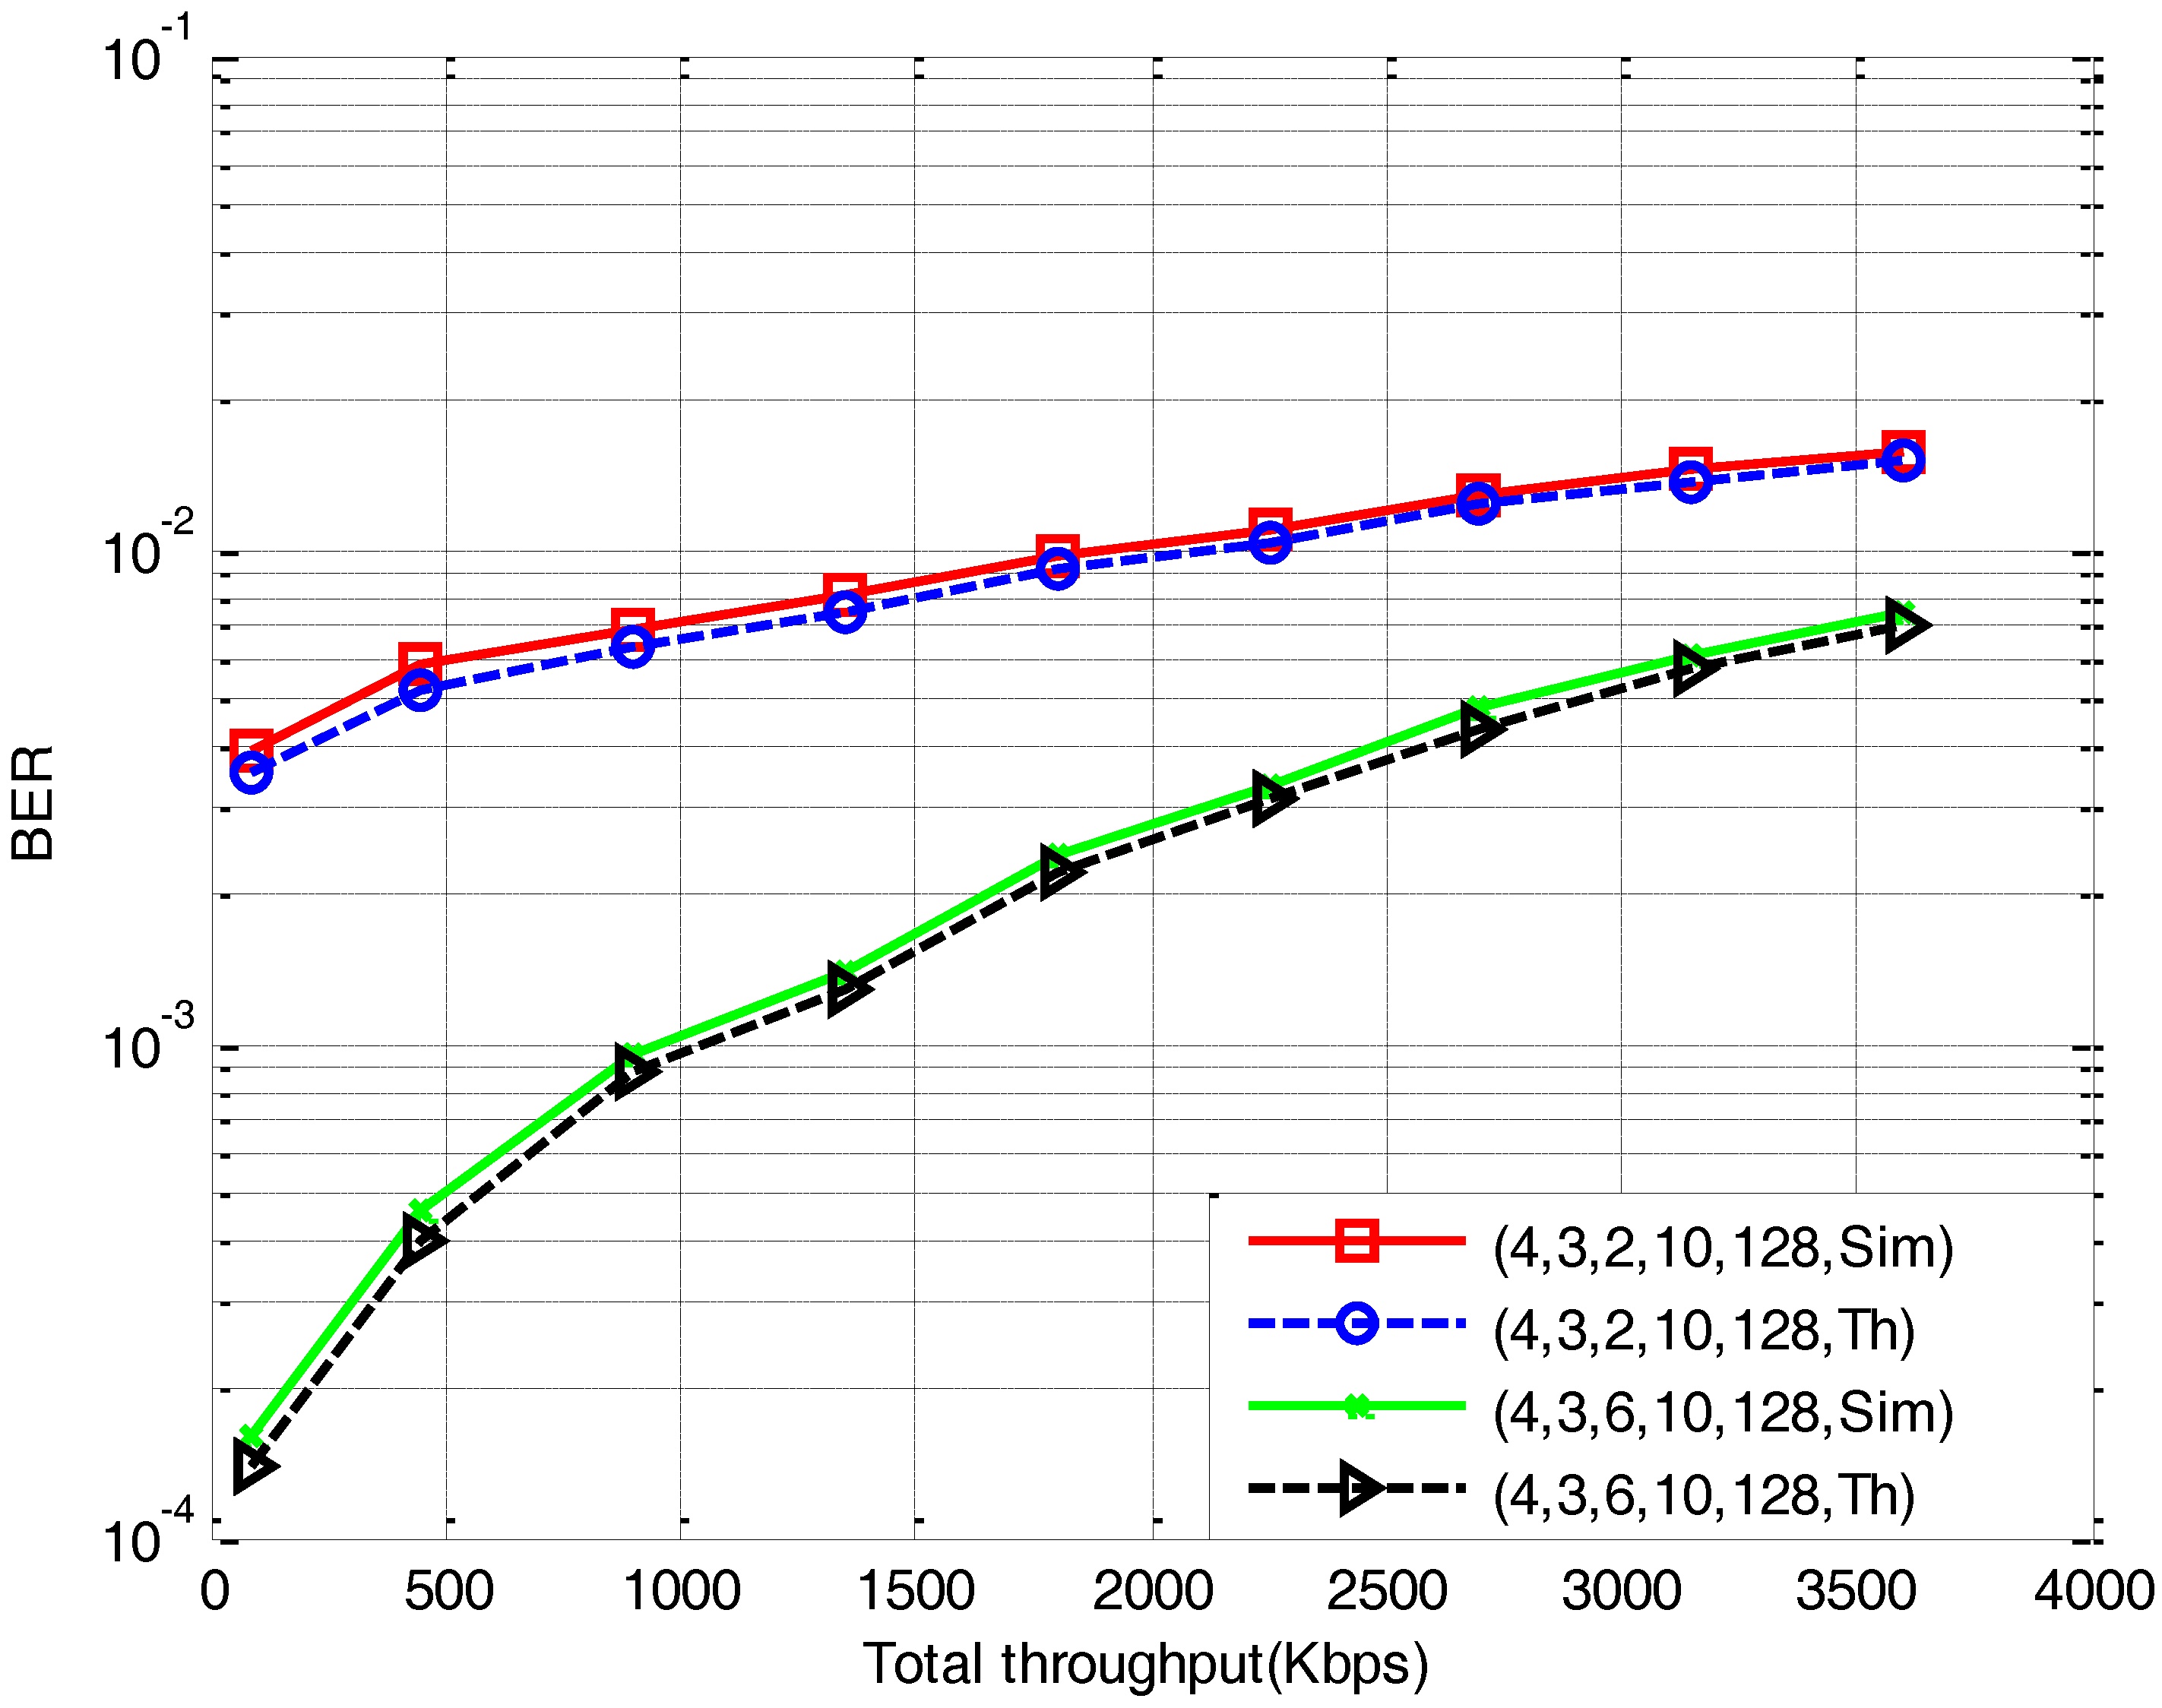
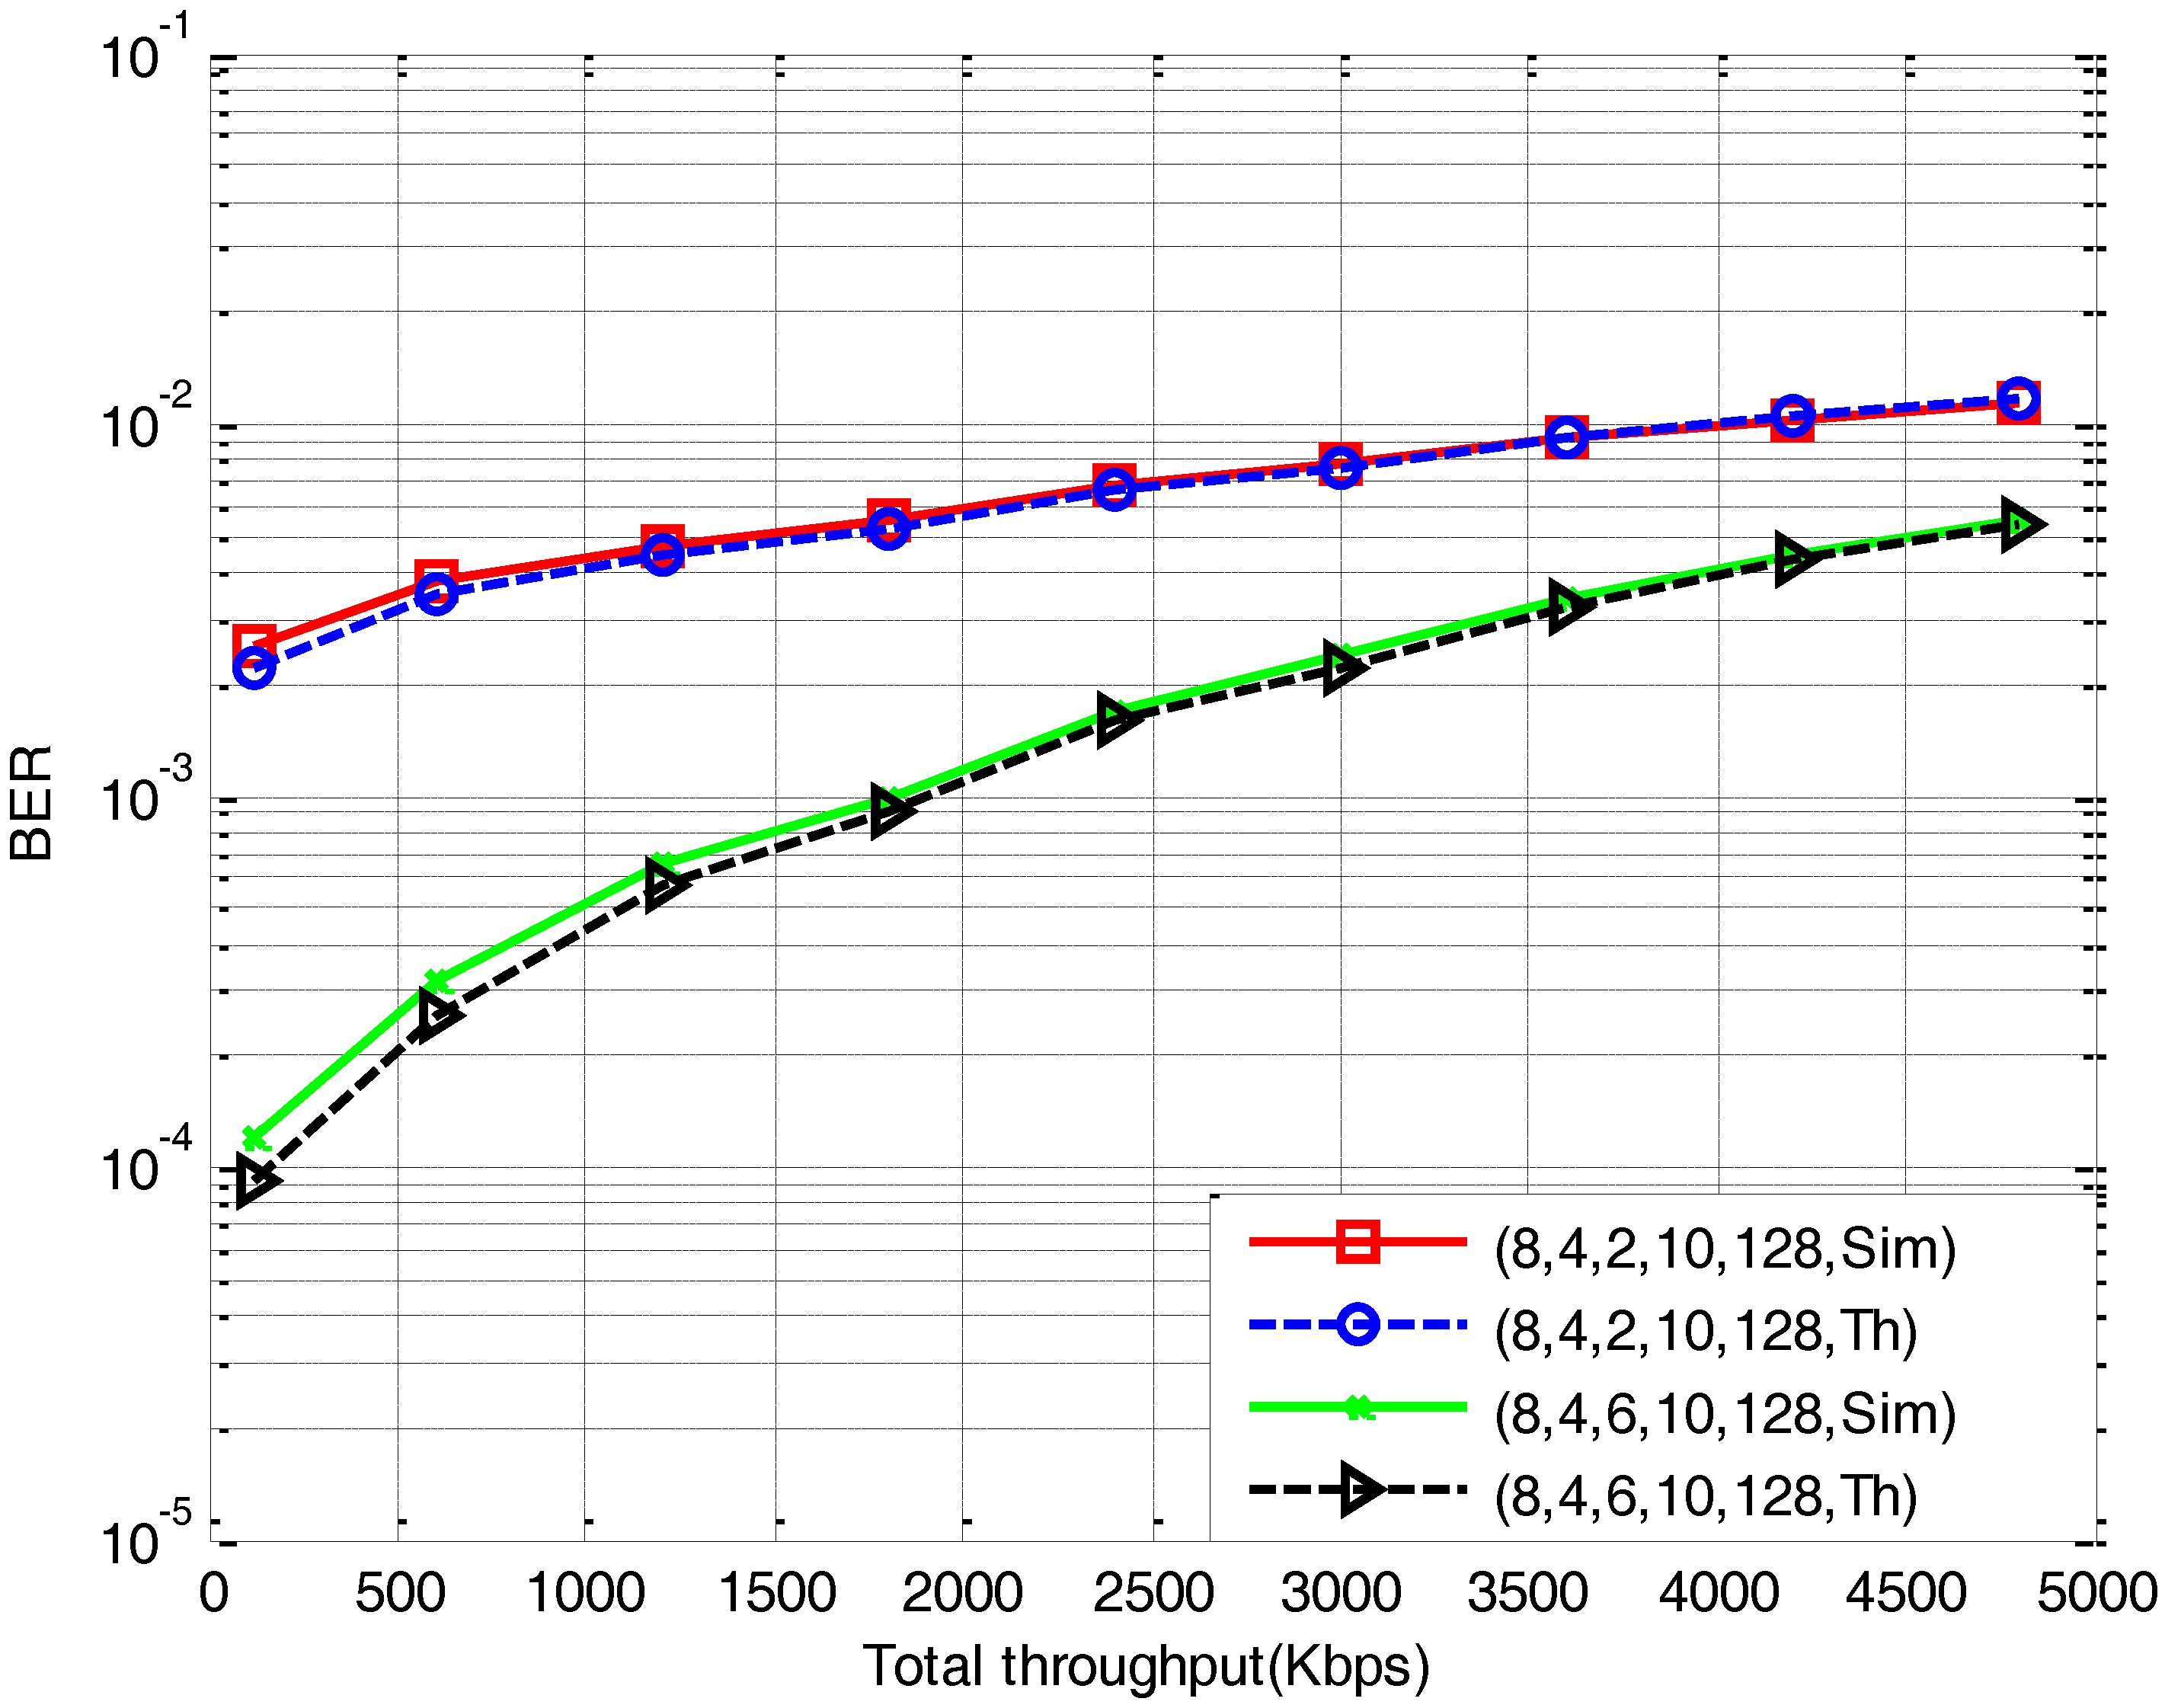
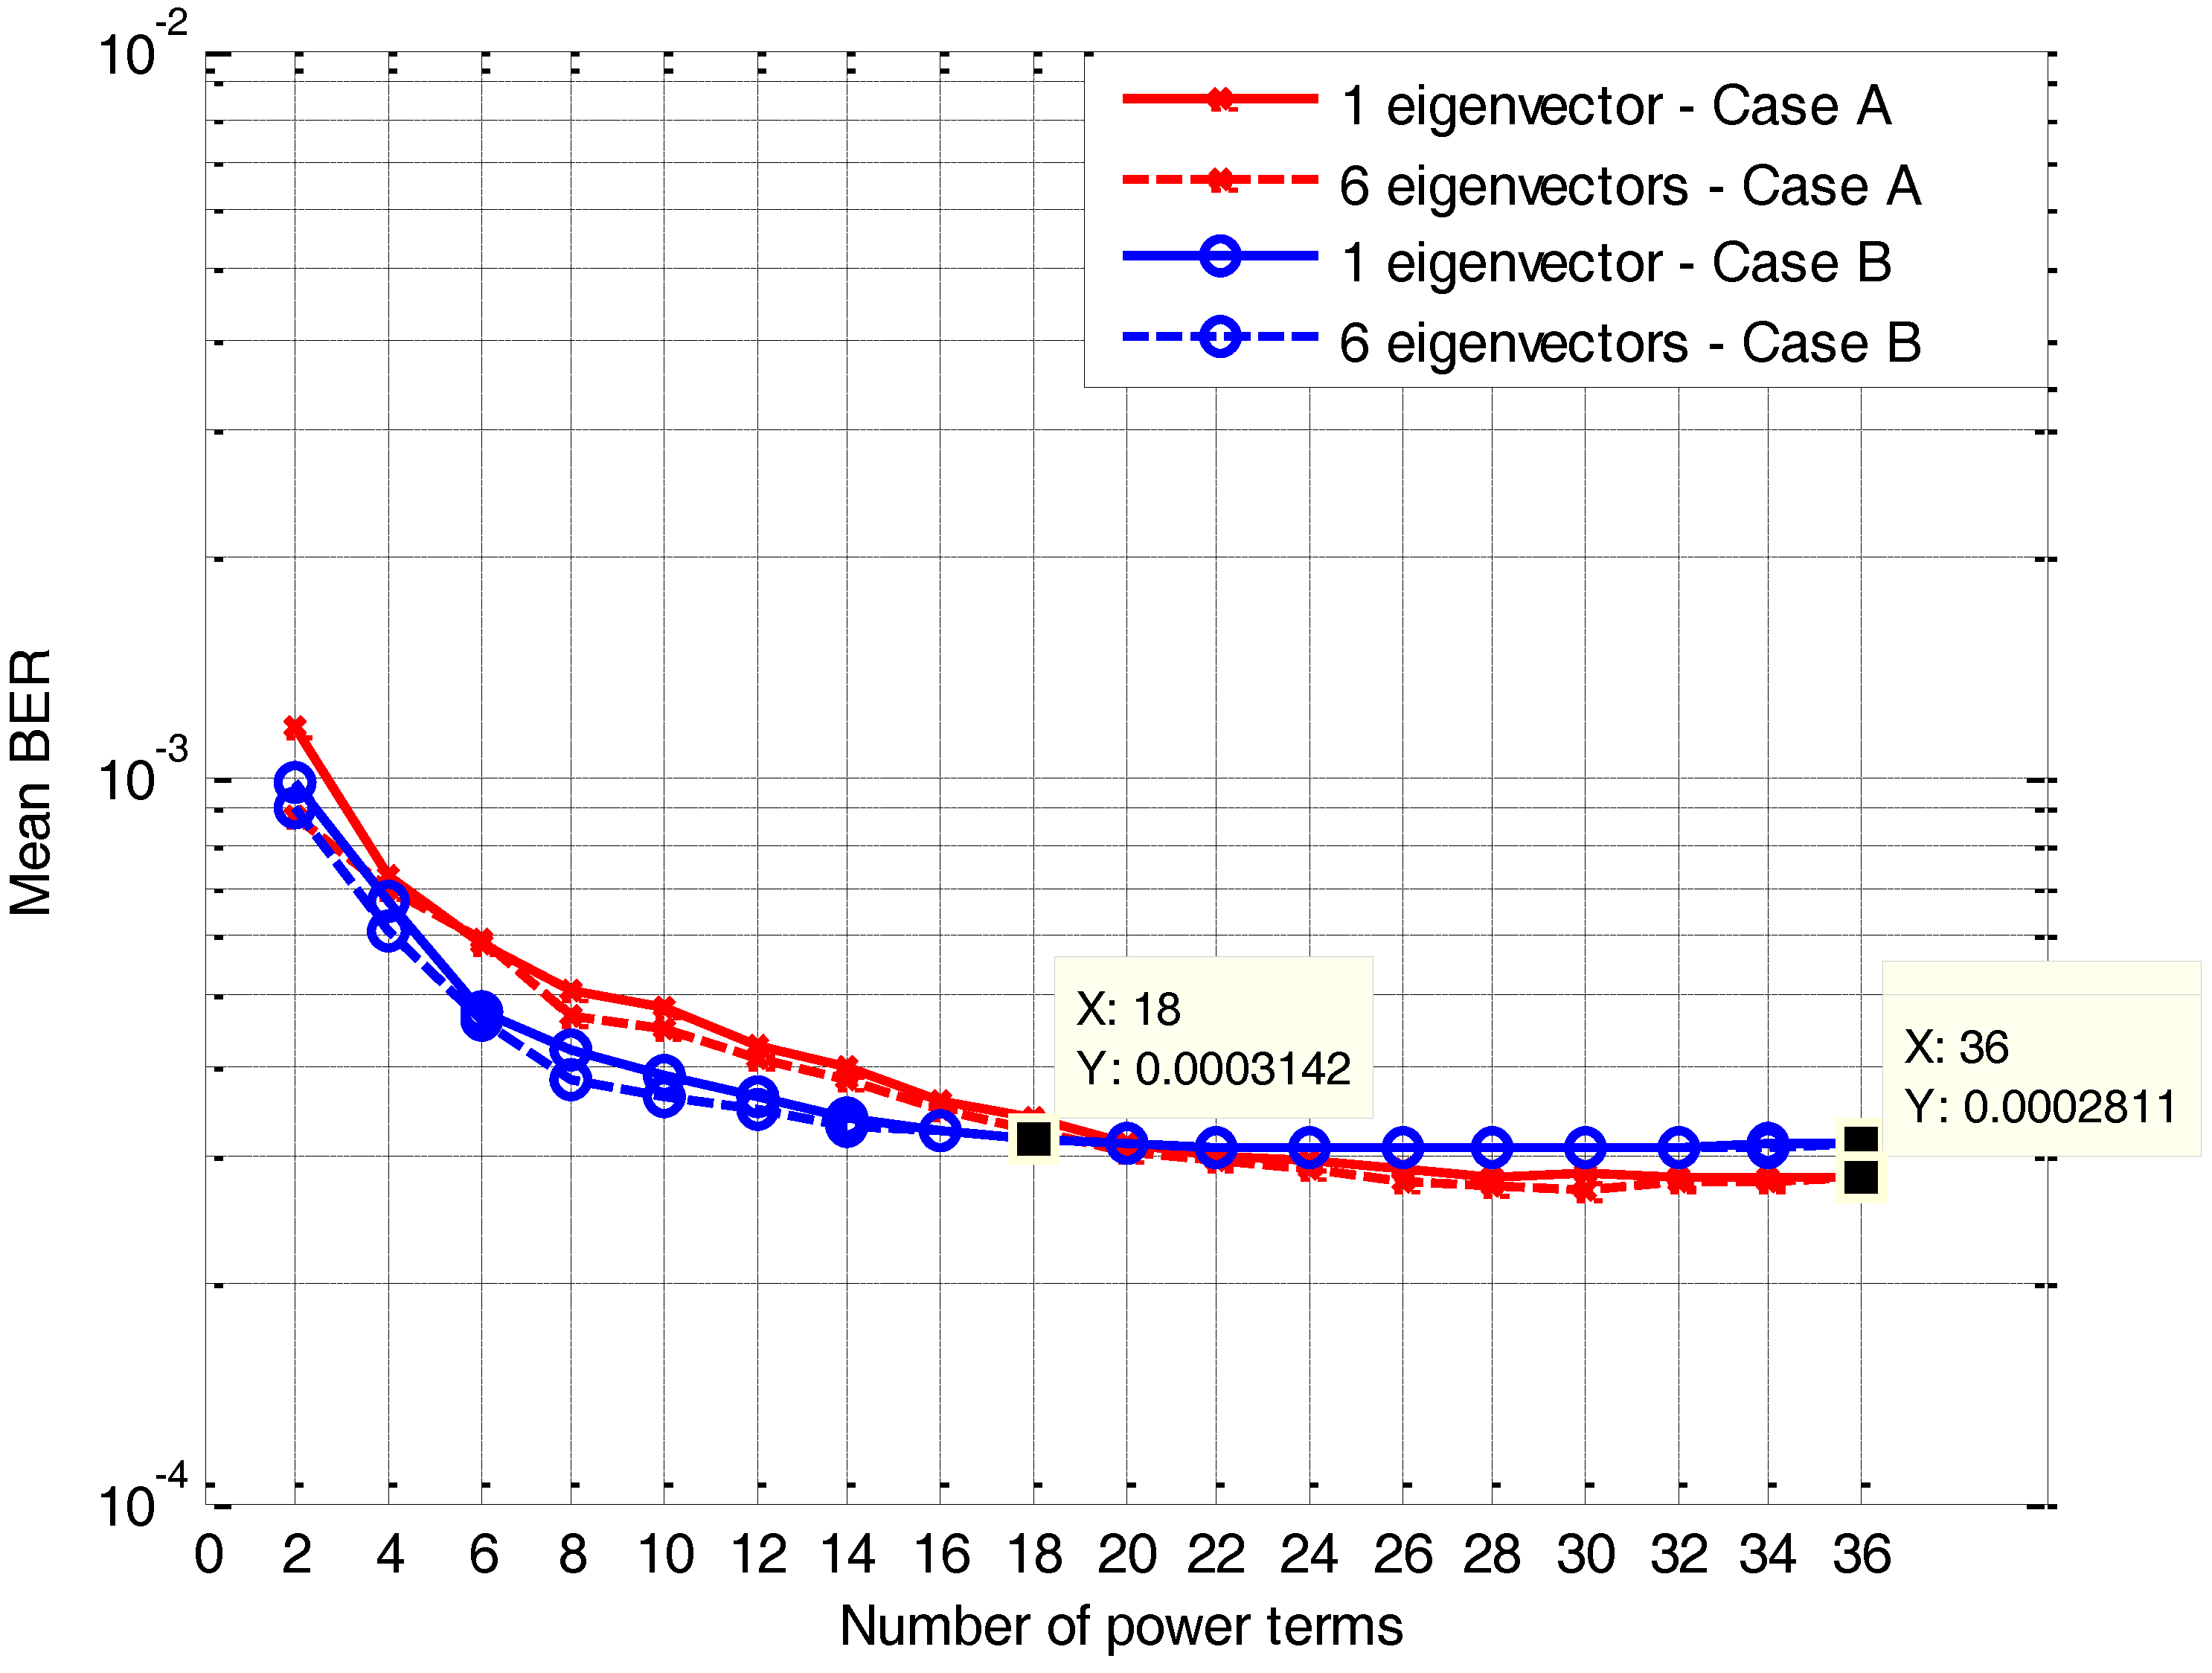
4. Results

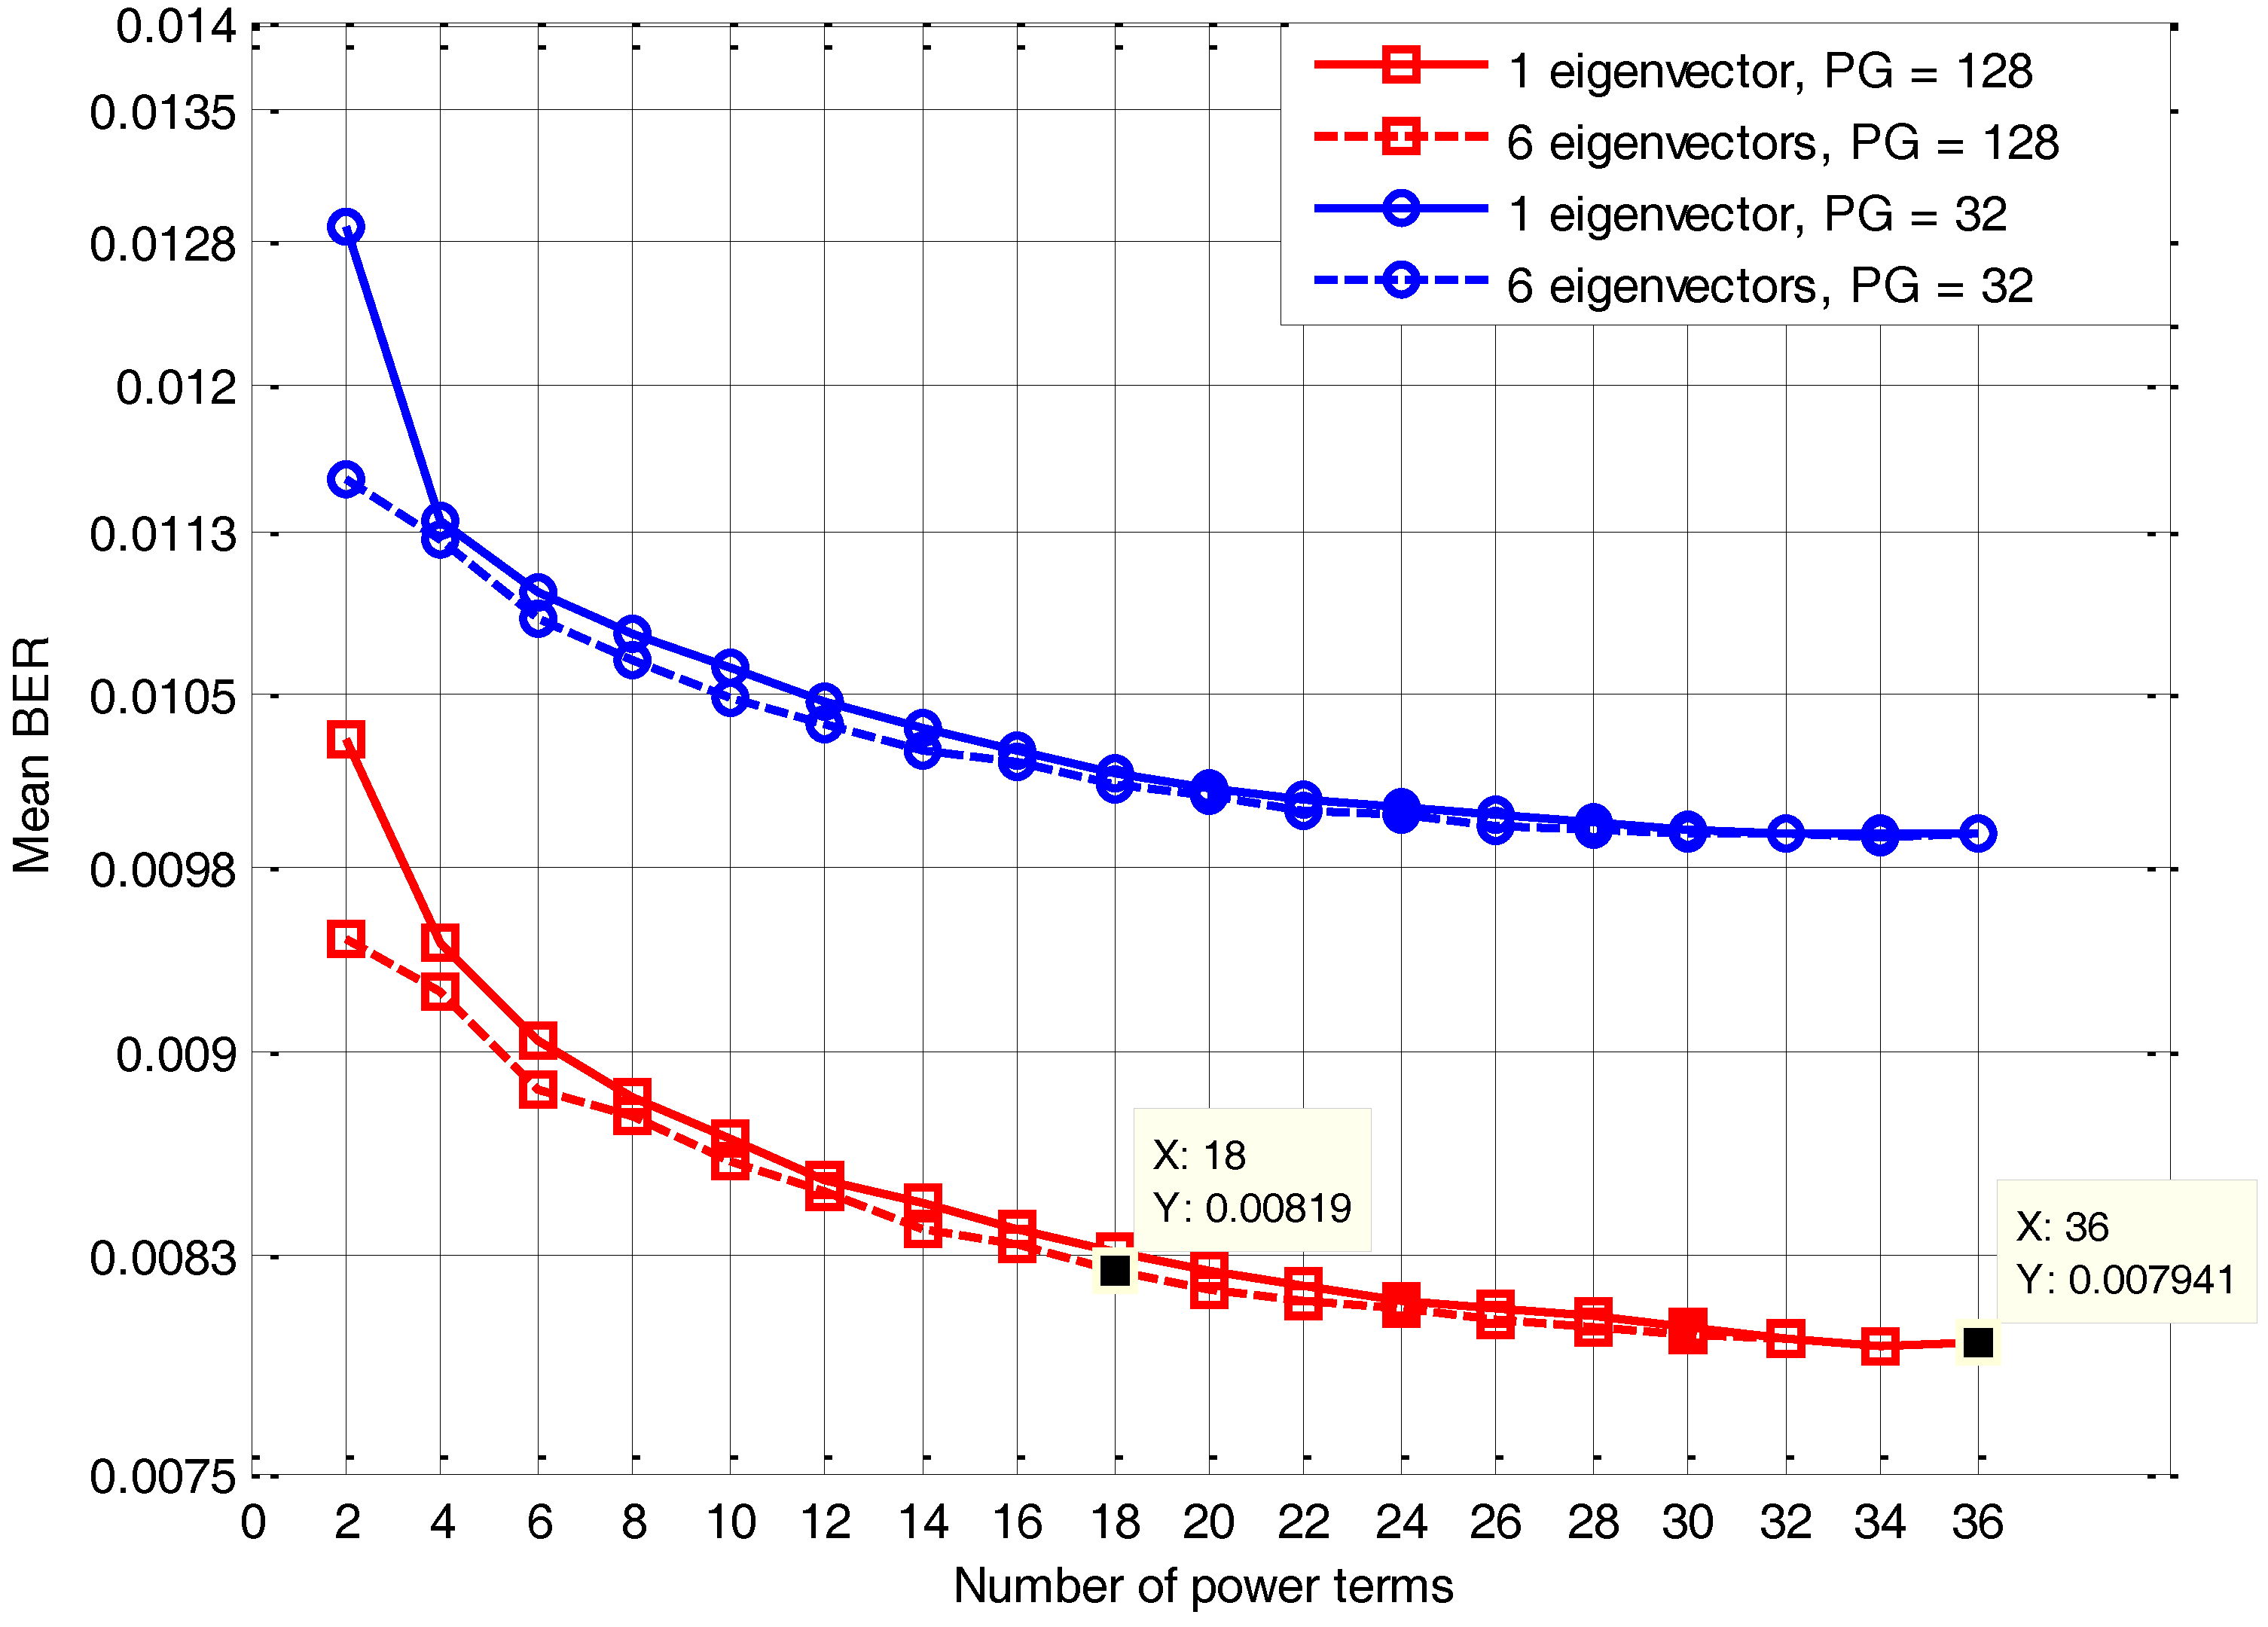
4.1. PCA with Theoretical Antenna Radiation Patterns

In order to evaluate the performance of the proposed approach, Monte Carlo (MC) simulations were performed in various MIMO topologies. In the first set of results (i.e., Figure 2, Figure 3 and Figure 4), the goal was to calculate mean BER and compare output values with the ones derived from the theoretical model as described in Section 2.2. For this reason, three different MIMO orientations (i.e., 4 × 2, 4 × 3 and 8 × 4) were considered, with two and six resolvable multipath components. The equivalent SNR was set to 10 dB, while a uniform power delay profile regarding the individual powers of the multipath components was taken into account. In figure legend, notation (Mt,Mr,L,PG,SNR,Sim or Th) has been carried out. Assuming independent data streams per different transmit antenna, then user throughput is set to R × min(Mt,Mr) Kbps, where R is the basic transmission rate of 30 Kbps that corresponds to the ratio of the system’s bandwidth (3.84 MHz for the WCDMA, [1]) to the processing gain. Moreover, it is assumed that each mobile terminal is equipped with a number of RAKE fingers that equals the number of multipath components. Finally, the number of active users may vary from 1 to 40 with a step of 5. As it is evident from Figure 2, Figure 3 and Figure 4, there is a good agreement among the Gaussian approximation for the error probability and consequently the mean BER and BER results derived from MC simulations. In addition, the selection of all multipath components (i.e., 6) leads to improved BER compared to the case of two multipath components. As expected, this gain reduces for high values of overall throughput, since to the increased number of active users, MAI can be significantly increased.
In Table 1, the mean number of repeats of the proposed MSNR-PCA algorithm that are required for convergence is presented, versus the number of power terms that are taken into account i.e., parameters C in Equation (24)). Moreover, in Figure 5 and Figure 6 the mean BER is presented for a 4 × 2 MIMO orientation, five active users and SNR equal to 5 dB and 10 dB, respectively, versus the number of power terms. Two simulation cases have been considered: In the first one, correlation matrix per user is formulated considering only the primary eigenvector and eigenvalue from PCA. In the second case, all eigenvalues and eigenvectors are taken into account. In both cases, PG can be either 32 (high data rate services) or 128 (low data rate services). As derived from Figure 5, for high number of power terms there are practically no BER deviations per group of curves. However, even for reduced number of power terms, BER deviations are kept to a minimum. In particular, for 36 power terms, the mean BER is 7.9 × 10⁻³. For one eigenvector in PCA and 18 power terms, the mean BER is 8.1 × 10⁻³. Hence, in this case there is an error of almost 2.6%. However, it follows from Table 1 that there is also a complexity reduction gain of almost 10%, as the mean number of repeats is 108 for 36 power terms and reduces to 98 repeats for 18 power terms. Note that in the corresponding cases for PG equal to 32, there are practically no deviations among the two calculated BER values (1 and 6 eigenvalues and eigenvectors, respectively). Finally, in Figure 6, where SNR is set to 10 dB, convergence is achieved for higher number of power terms compared to the previous case of 5 dB SNR. In particular, for PG equal to 32, there are practically no BER deviations among 24 and 36 power terms. However, for PG equal to 128, convergence is achieved for 30 power terms.

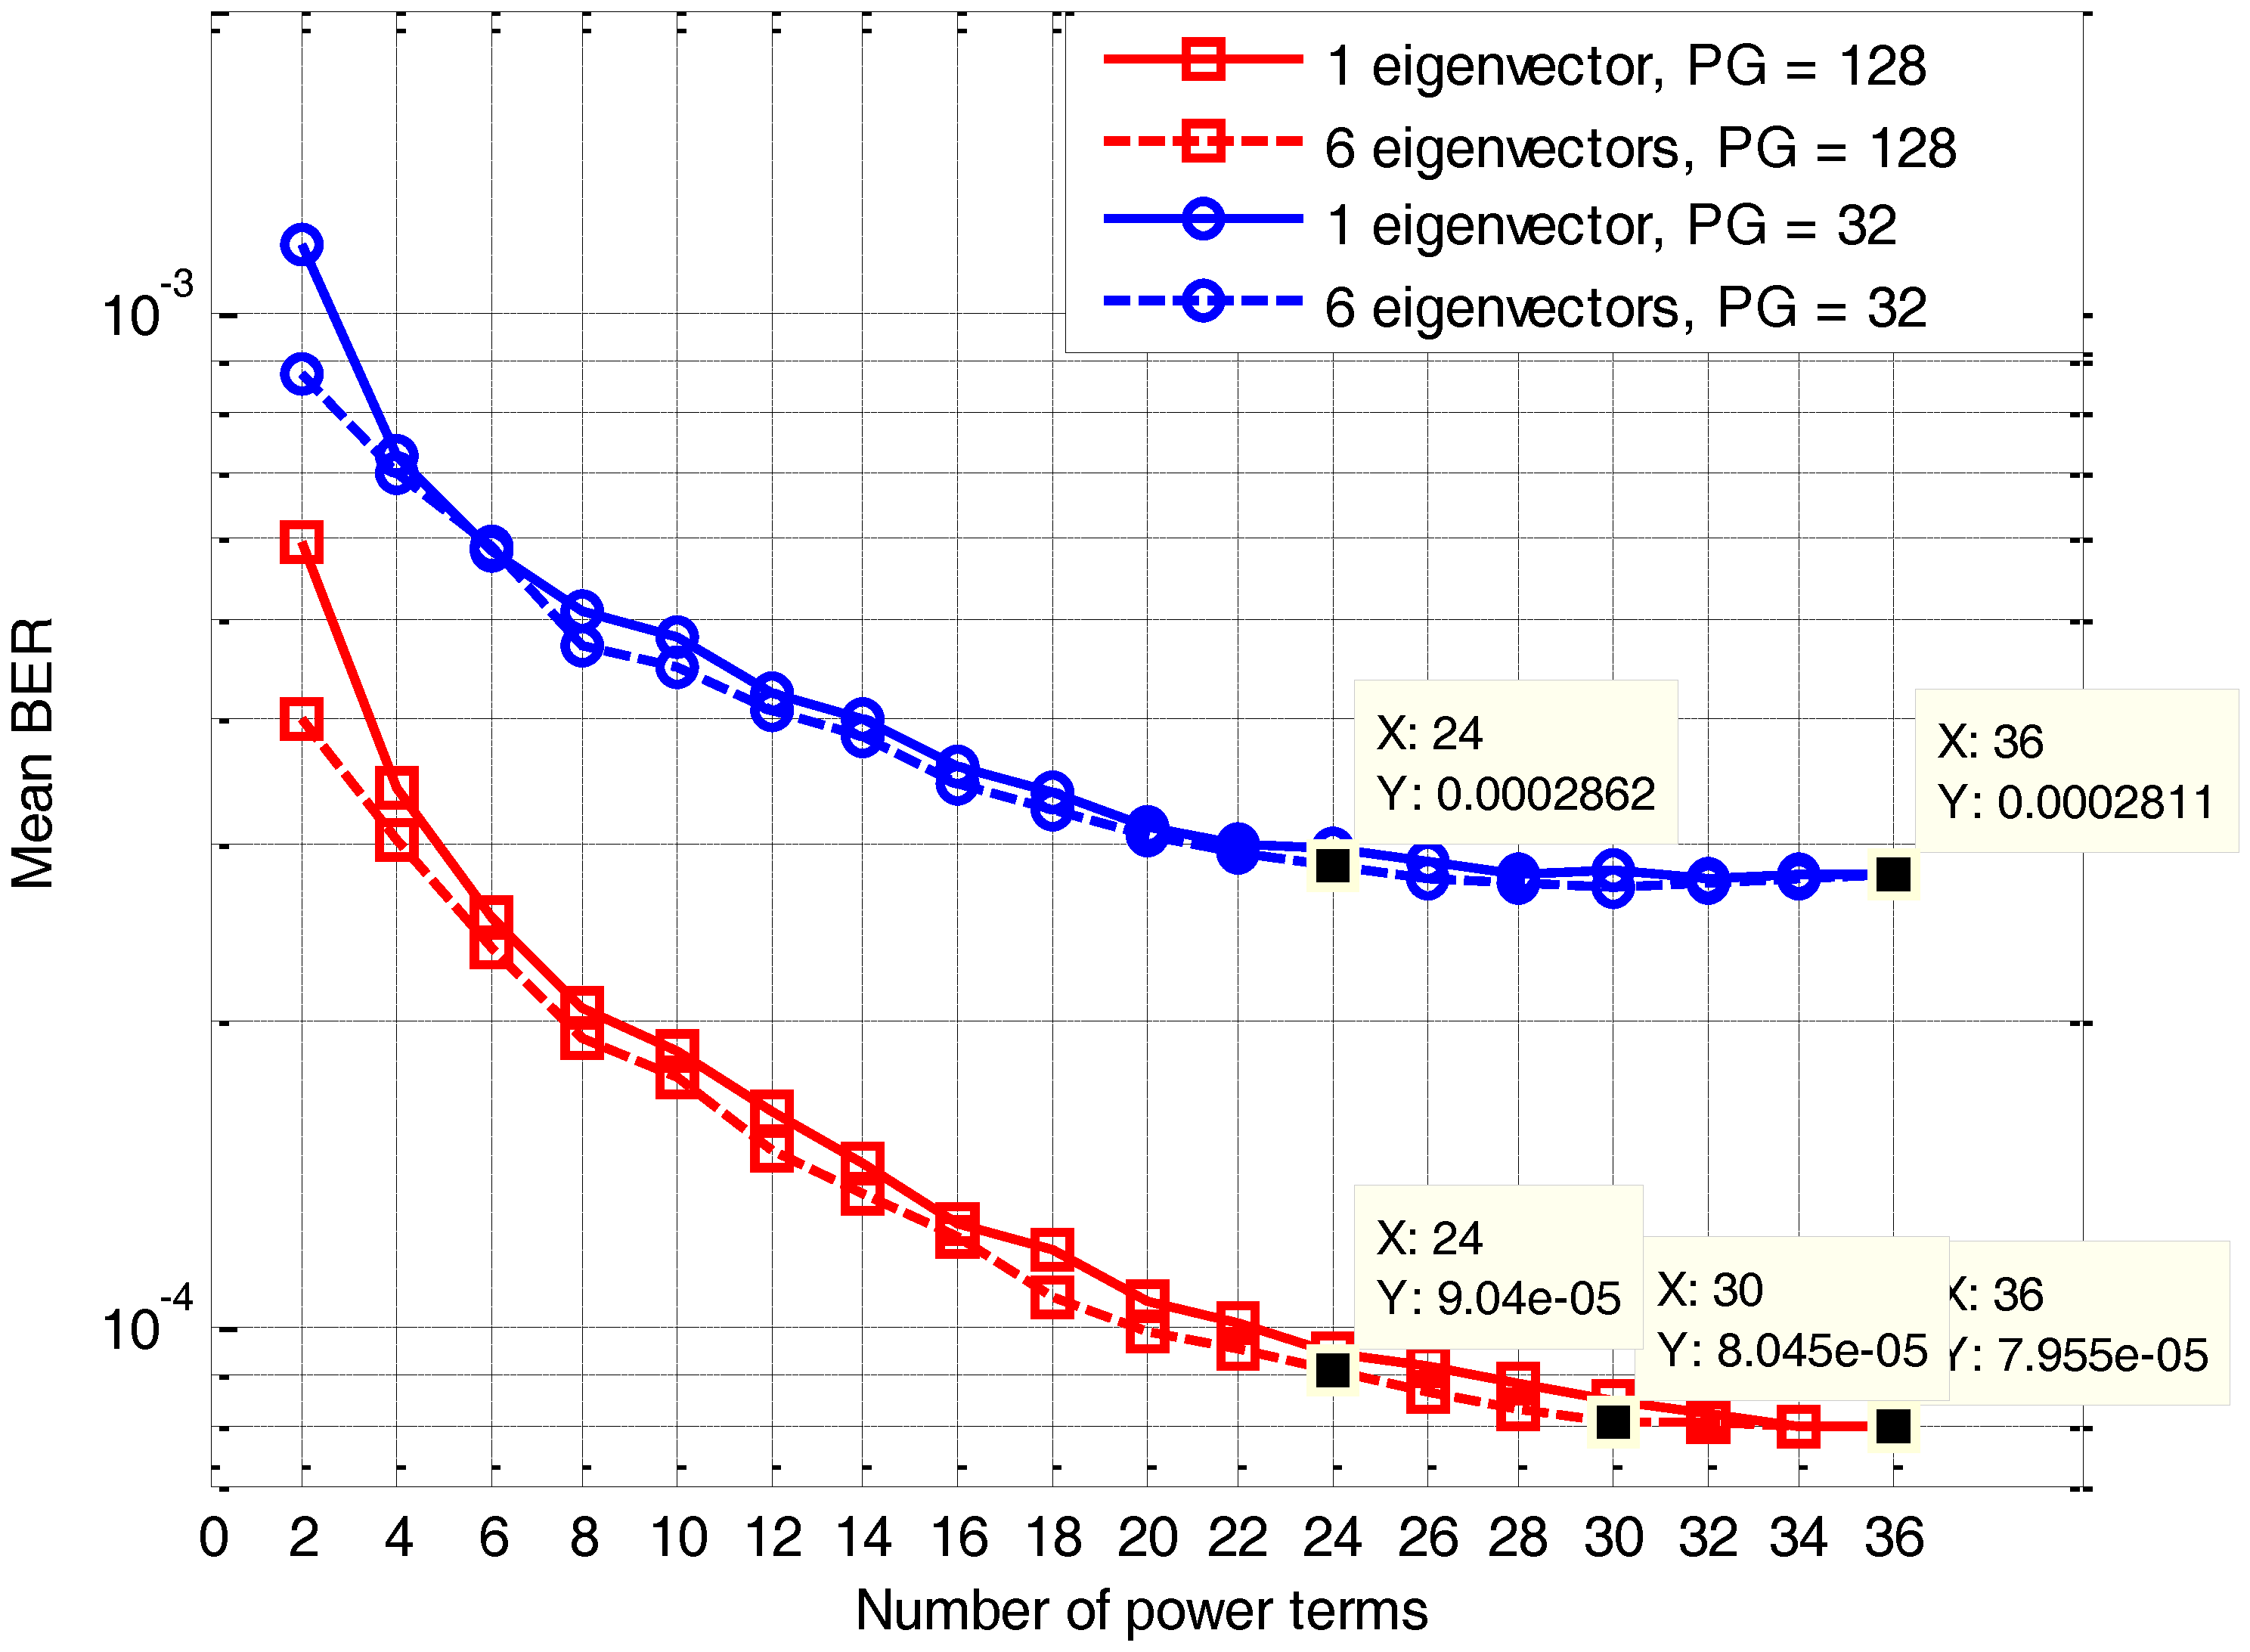
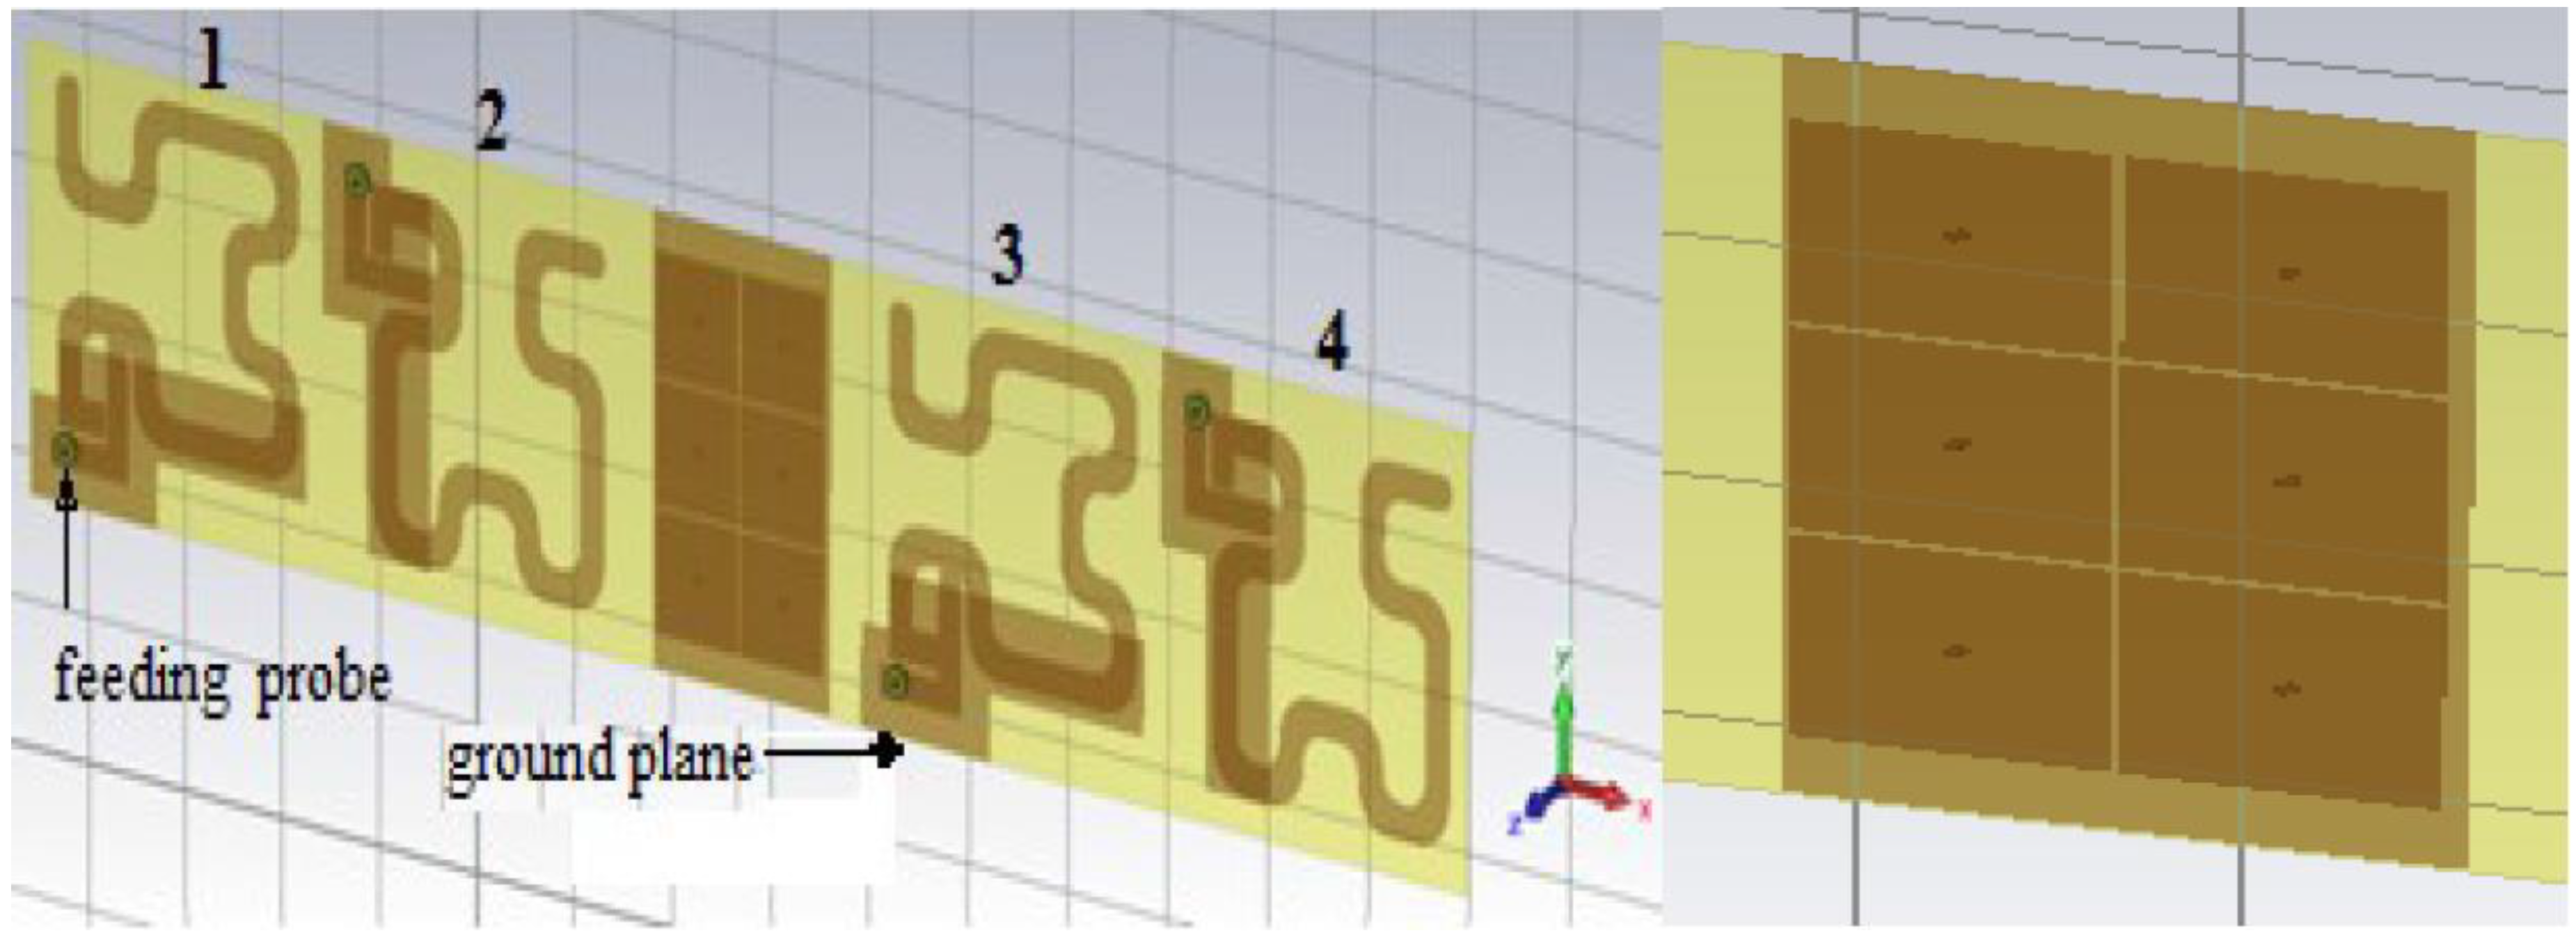
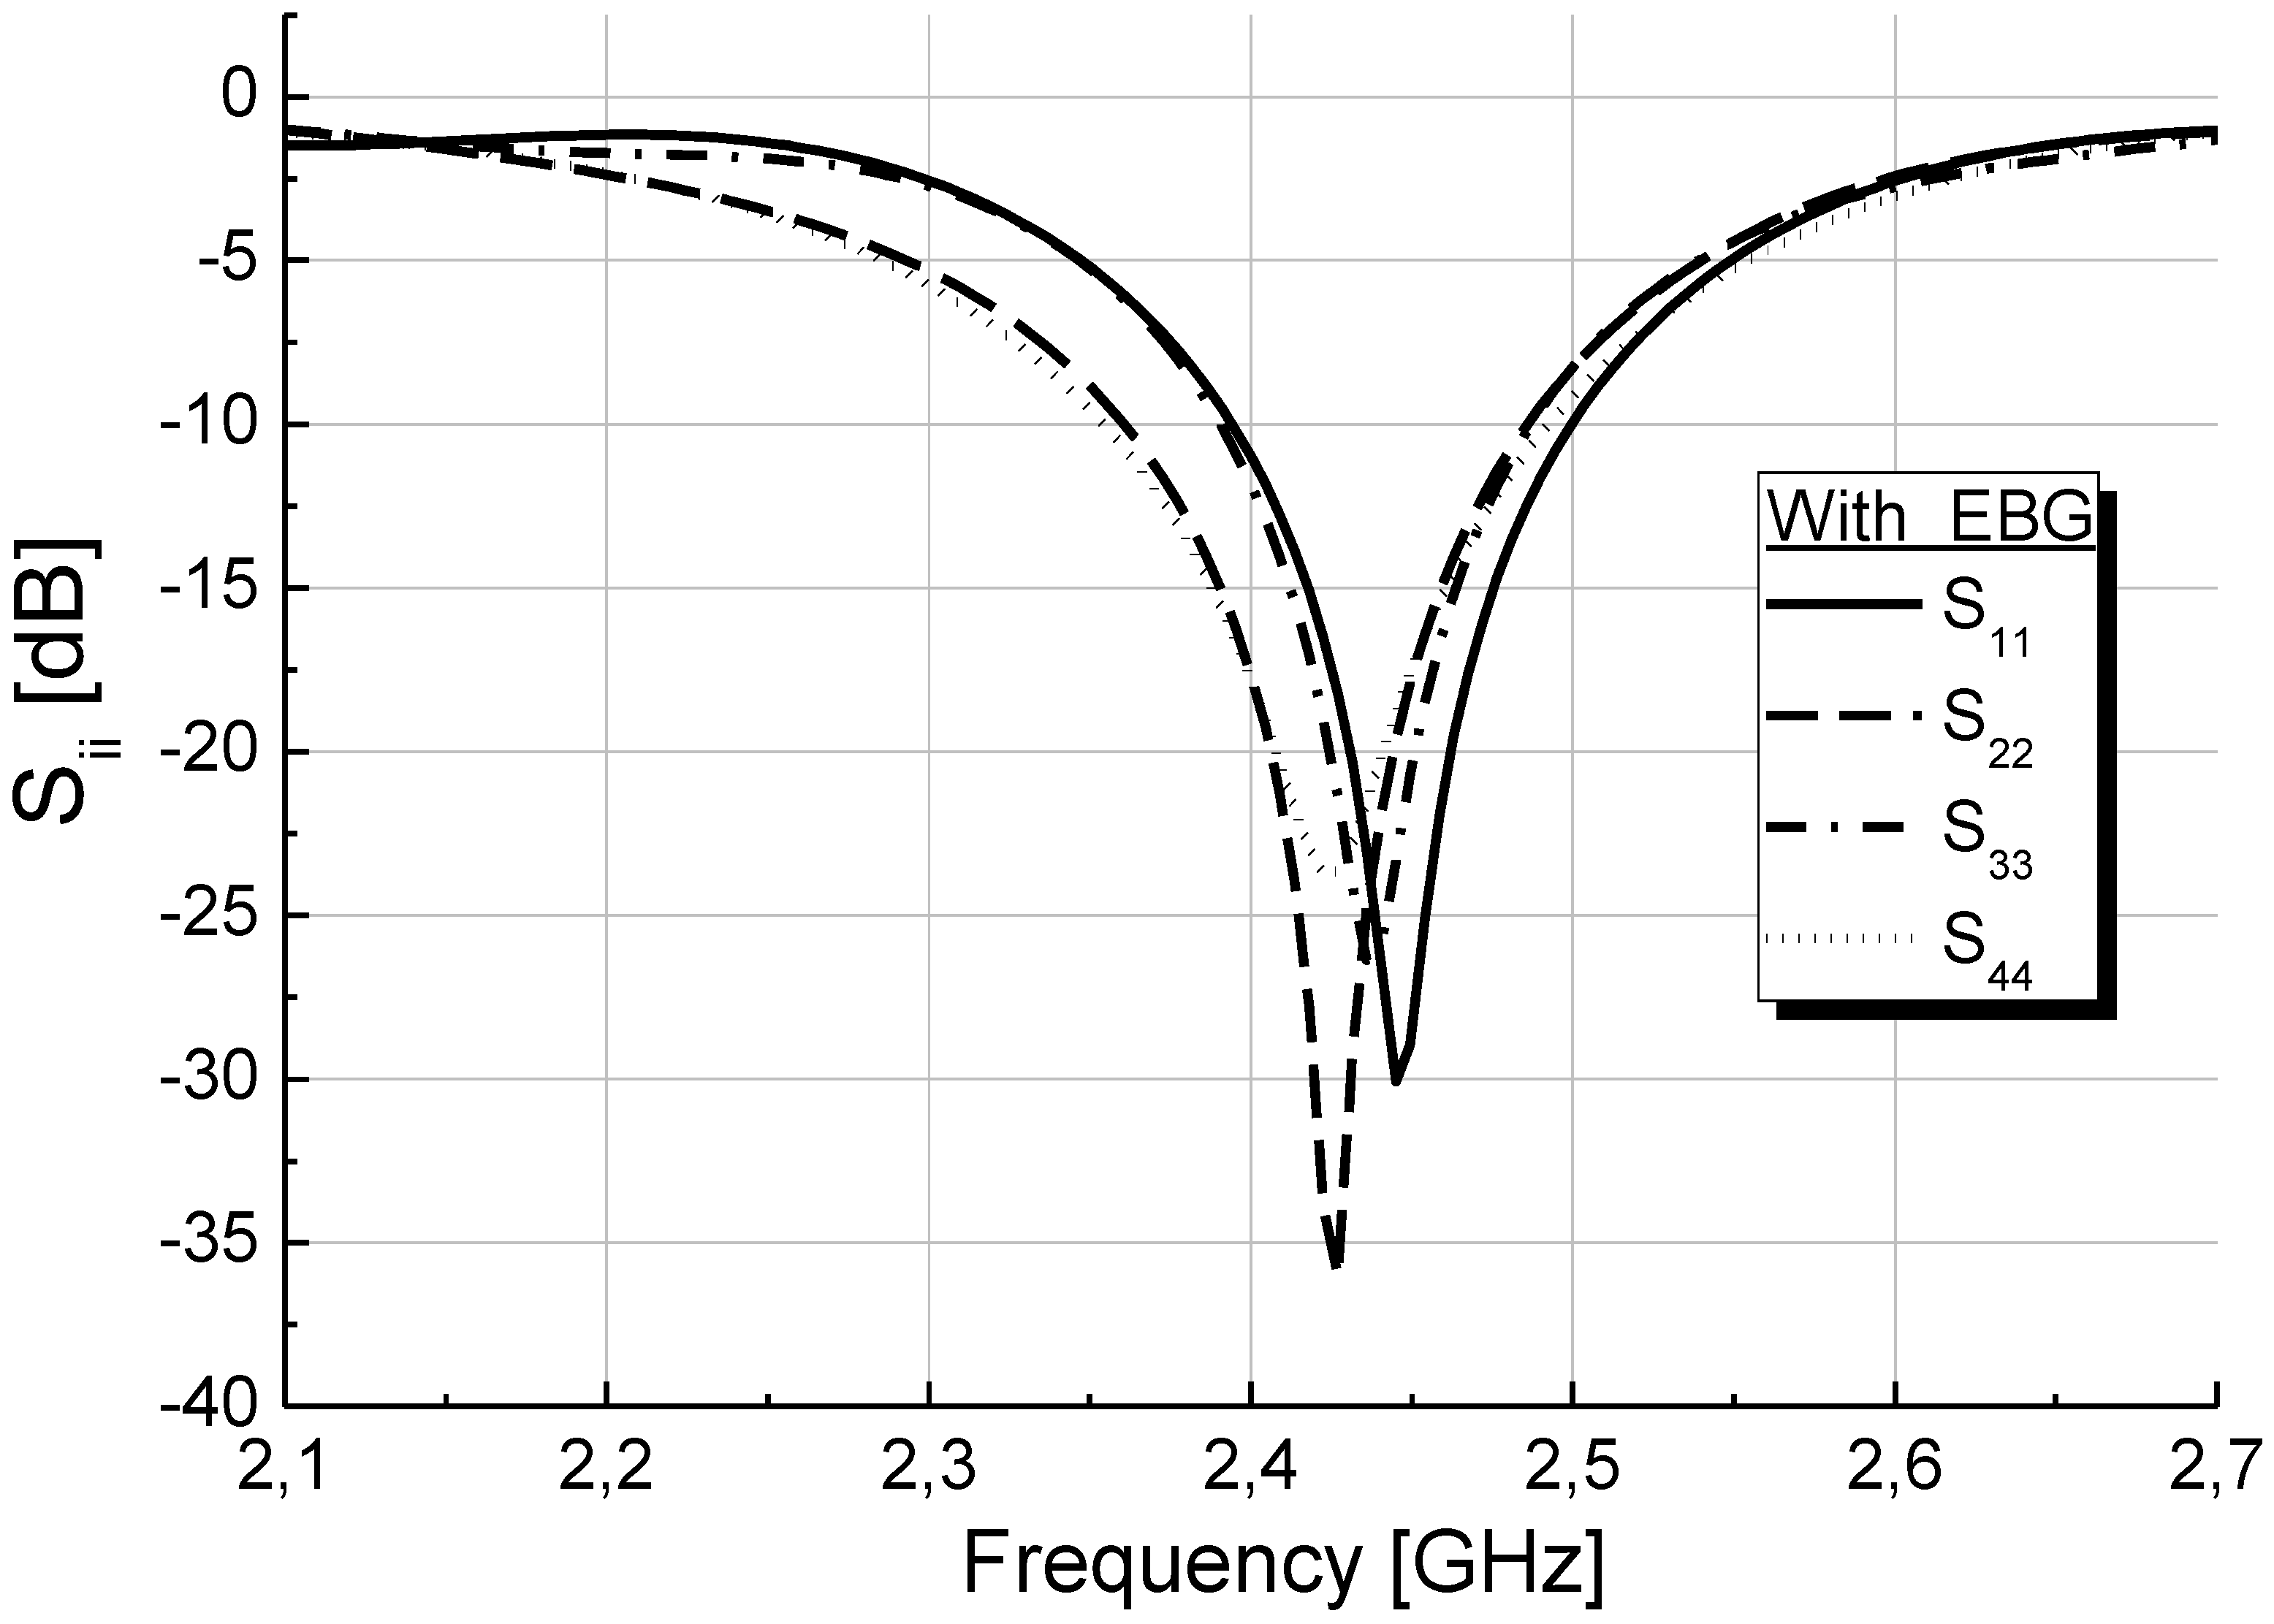
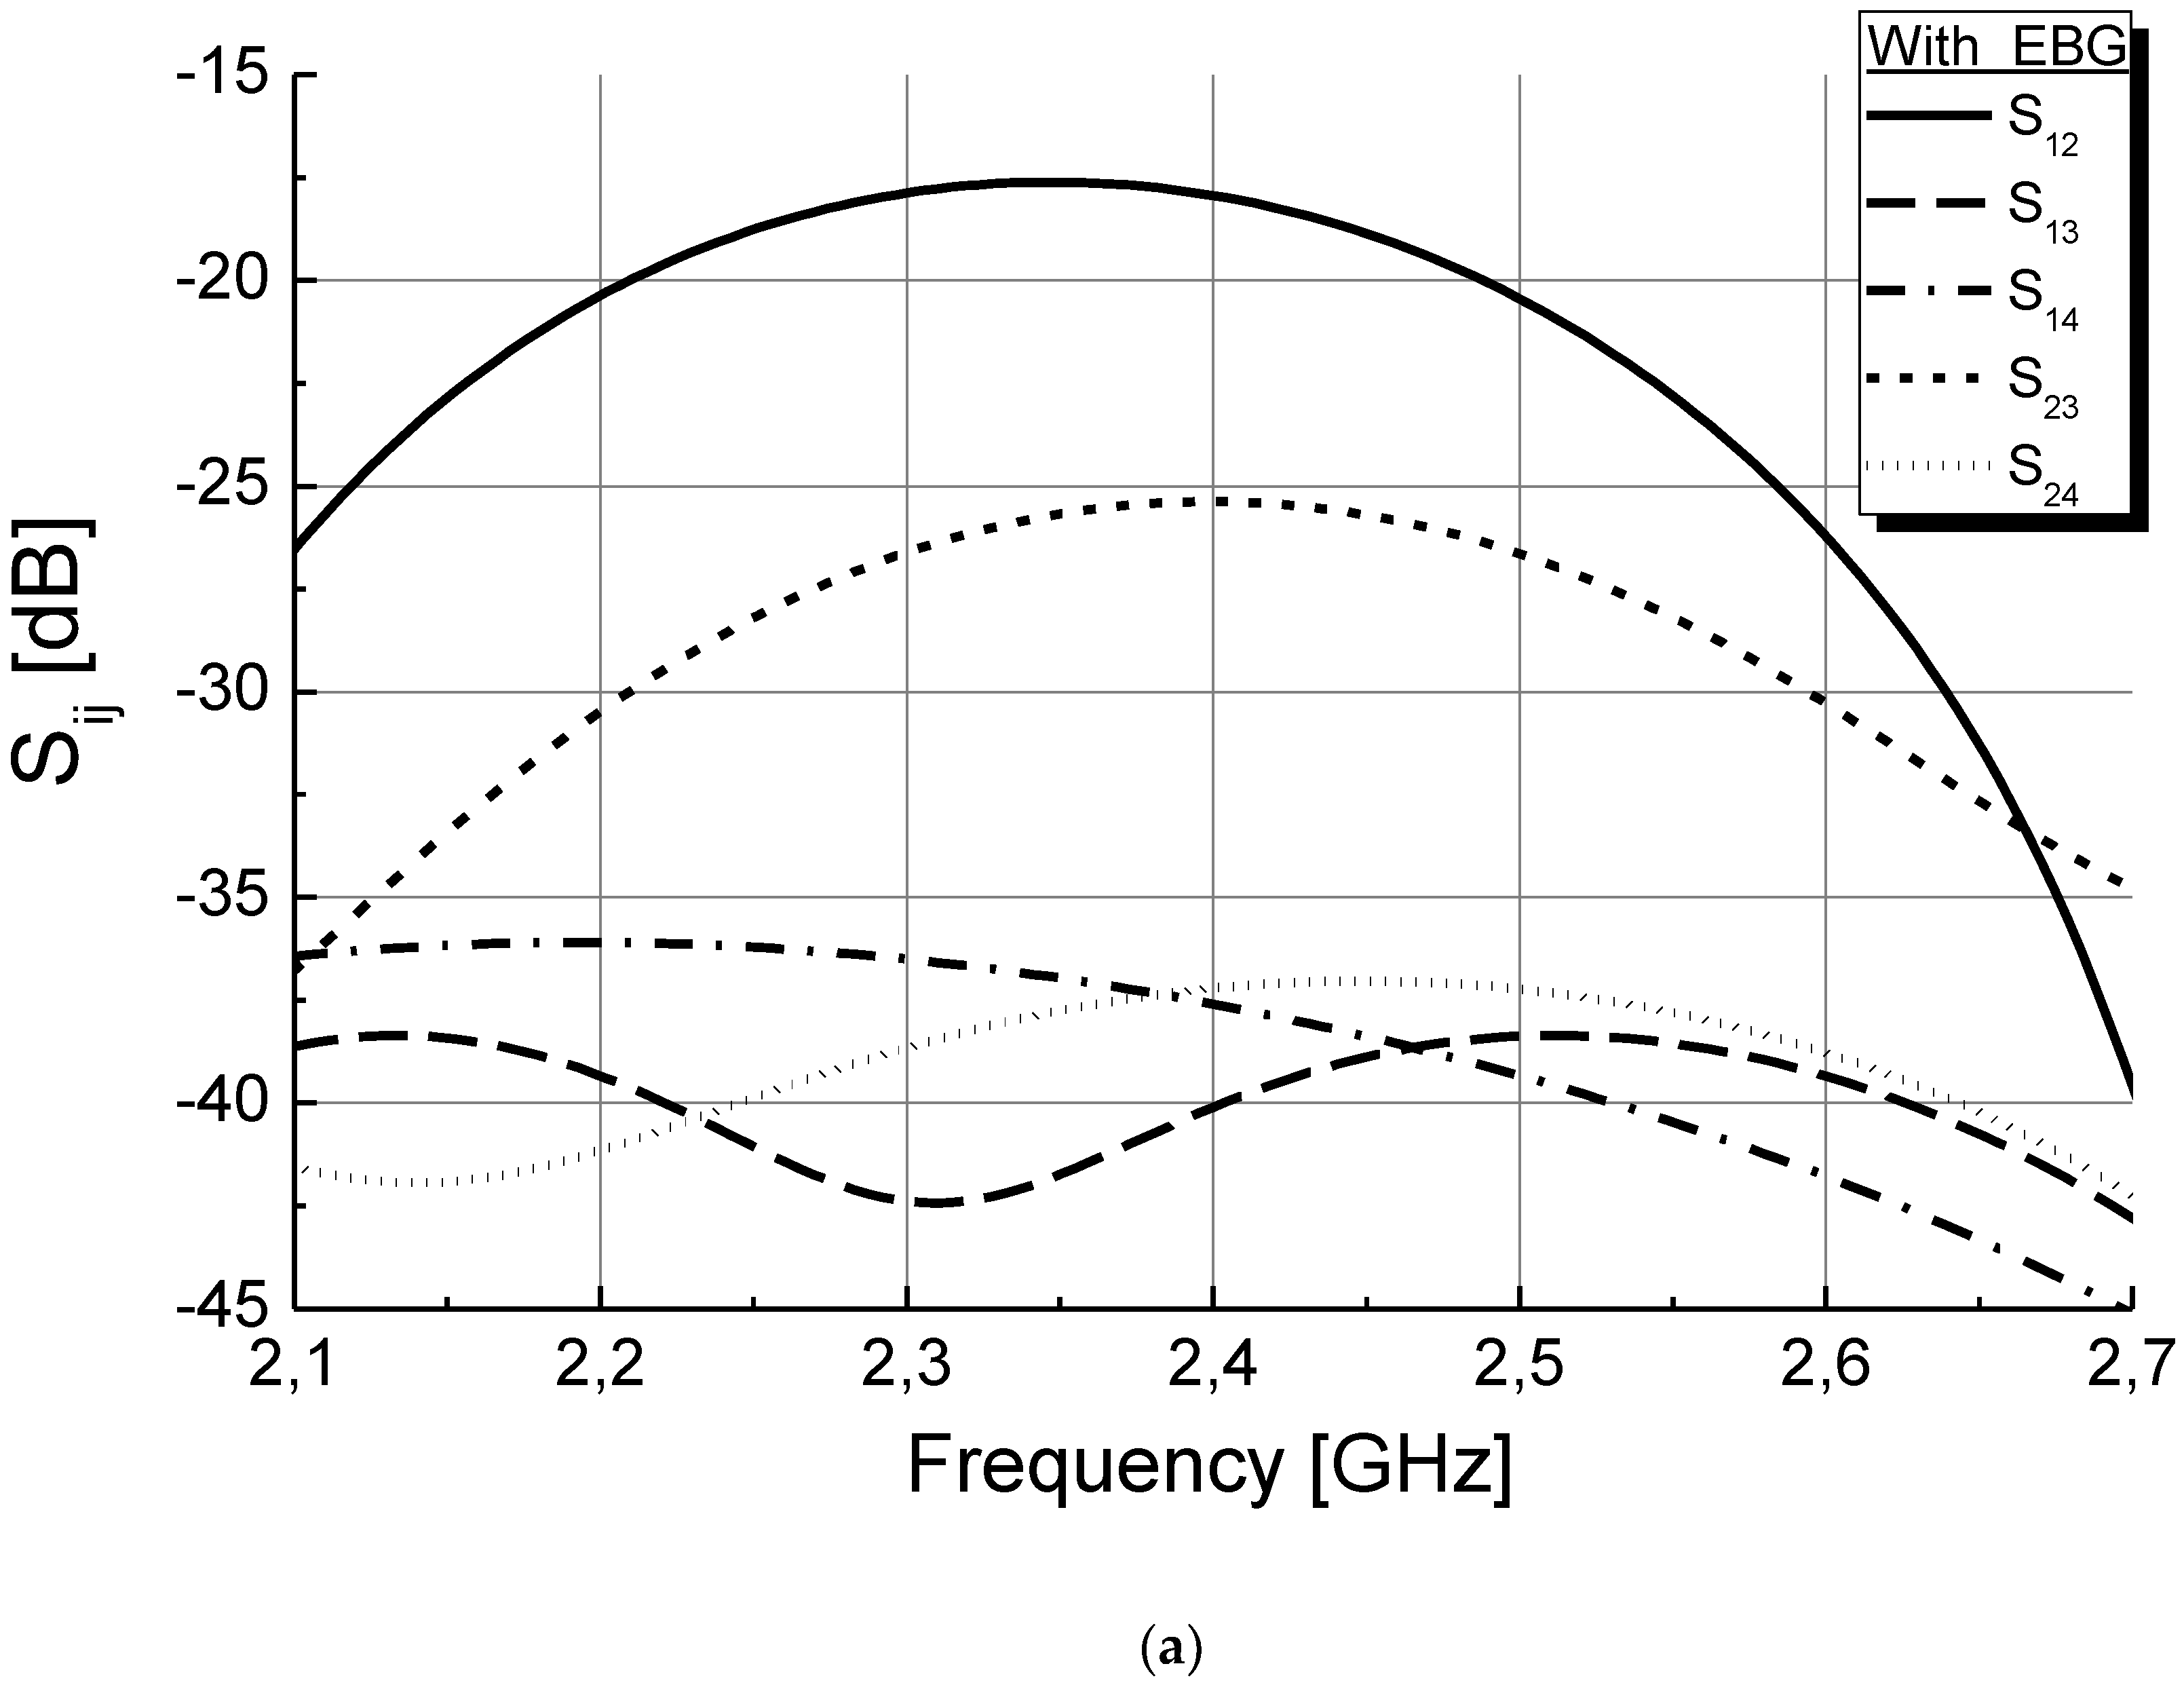
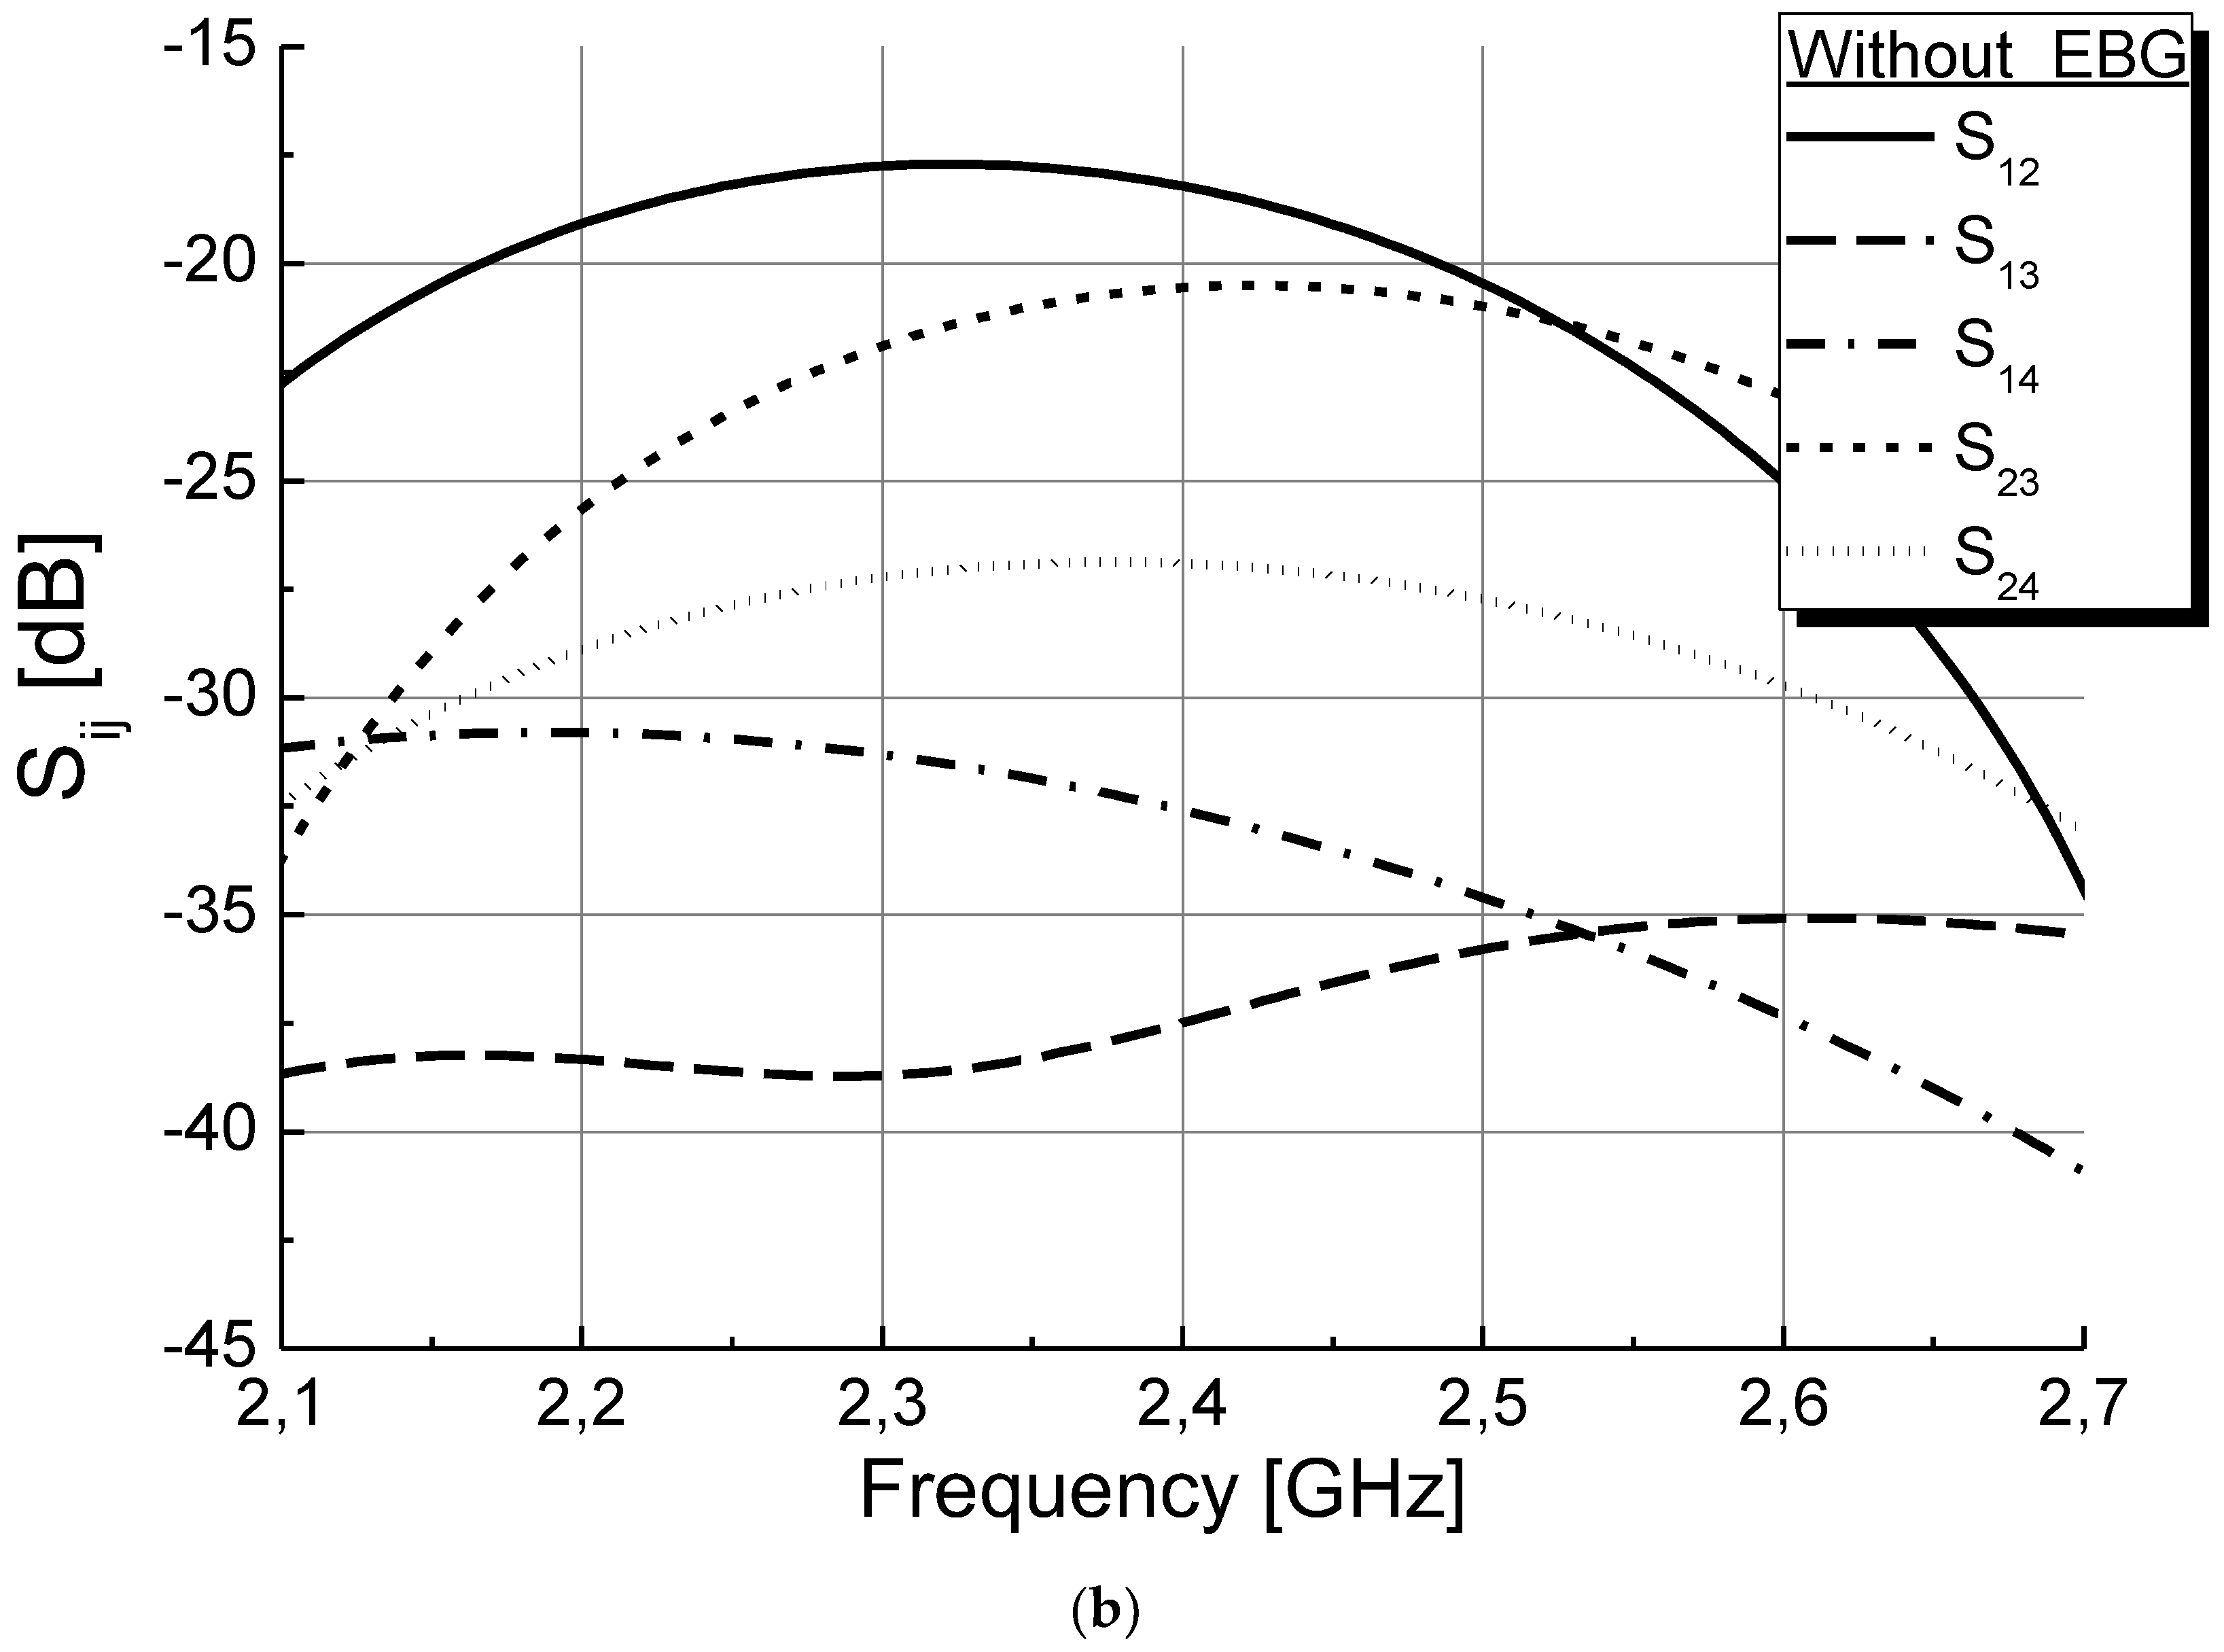
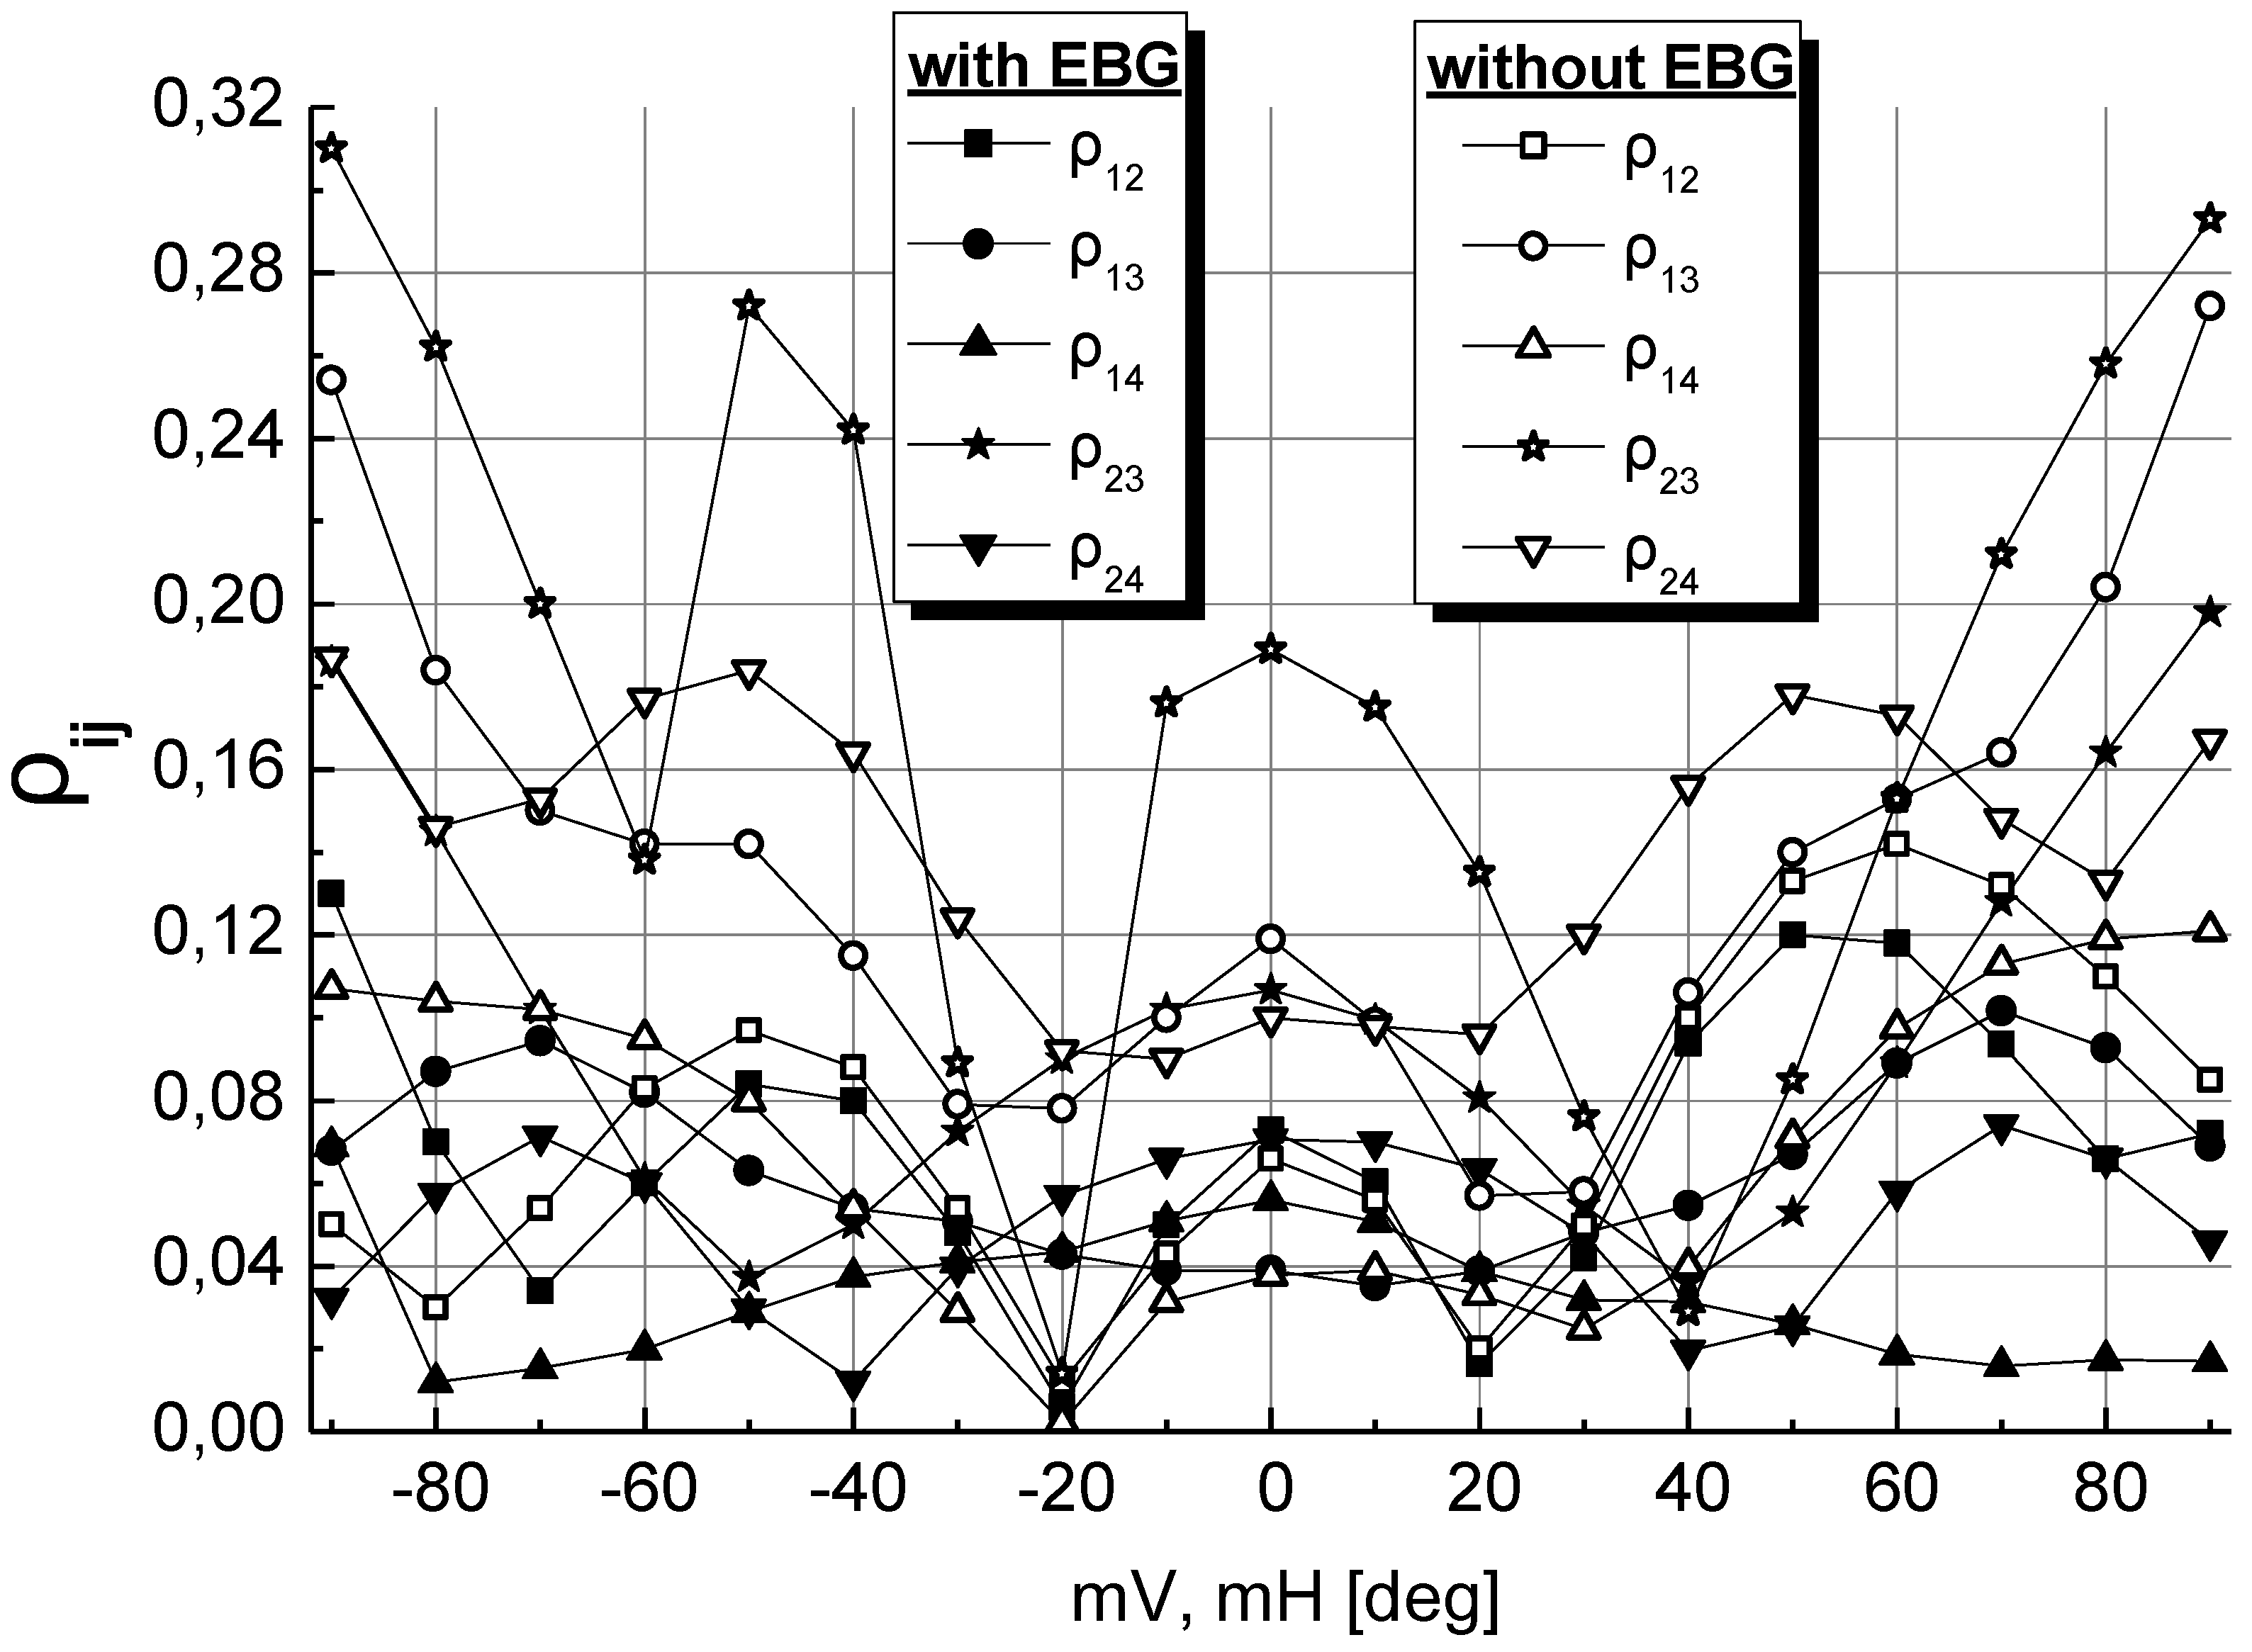
4.2. PCA with Antenna Radiation Patterns from Electromagnetic Simulations

In the final set of simulations, a realistic four-element transmit antenna has been considered (Figure 7), as well as two omni antennas per receiver. In this case, the channel between an arbitrary transmit antenna (denoted as q) and an arbitrary receive antenna (denoted as u) for the lth multipath component is given according to 3GPP specifications [17], as:
h = P l σ S F M m = 1 M ( G B S ( θ l , m , A o D ) exp ( j [ k w d q sin ( θ l , m , A o D ) + Φ l , m ] ) × G M S ( θ l , m , A o A ) exp ( j ( k w d u sin ( θ l , m , A o A ) ) ) )
where j is the imaginary unit, Pl is the power of the lth path, σSF is the lognormal shadow fading, M is the number of sub-paths per path, θl,m,AoD and θl,m,AoA are the angles of departure (AoD) and arrival (AoA), respectively, for the mth subpath of the lth path, GBS(θl,m,AoD) is the transmitter antenna gain for each array element and GMS(θl,m,AoA) is the receiver antenna gain for each array element for the AoD and AoA, respectively. Moreover, Φl,m is the phase of the mth subpath of the lth path, uniformly distributed over [0, 2π]. Finally, kw is the wave number 2π/λ, where λ is the carrier wavelength in meters, dq is the distance in meters of the transmit antenna element q from the reference (q = 1) antenna and du and is the distance in meters of the receive antenna element u from the reference (u = 1) antenna.
The transmit antenna array consists of two elements, each one composed of two similar co-planar elements positioned in close proximity to each other and rotated one to the other, by an angle of 90°, in order to obtain polarization diversity. The elements are fractal shaped, via a modified Hilbert curve configuration and were designed by the technique proposed in [20], the target being the dual frequency operation at ISM (2.4–2.489 GHz) and 5–6 GHz bands. The elements are semi-printed on the dielectric substrate RO3003 (εr = 3 and thickness h = 0.812 mm).The ground plane, having the shape shown in Figure 7, is on the back side of the substrate, extended only at a part of the whole antenna strip. This configuration, as proposed in [20], is not enough to ensure low values of all the correlation coefficients among the array’s elements when two dual elements are arranged to compose a four-element array, because the four elements have (two by two) the same polarization. The problem was confronted embedding an EBG lattice as shown in Figure 7. EBG lattices are commonly used in antenna structures as they can enhance their performance, increasing their frequency bandwidth, contributing to the decrease of their size and affecting their gain either increasing it or keeping its value constant within wide frequency ranges [21,22,23]. Besides these ways of influence, to the antennas’ operation, the incorporation of EBGs, of mushroom or of other type in antenna arrays, can reduce significantly the isolation among their element reducing their electromagnetic mutual coupling. This result is very useful at MIMO antennas systems as it contributes to the reduction of correlation coefficients among their elements, thus enhancing the MIMO procedure ([24,25,26,27,28]). In the present work, the performance of the prototype of Figure 7 is presented via Figure 8, Figure 9, Figure 10 and Figure 11. Figure 8 depicts the scattering coefficients Sii at the input of the antenna elements, confirming that they operate at the ISM band, which is under interest. Figure 9 illustrates the mutual signal scattering coefficients (Sij) among the elements and, for comparison, the respective coefficients of the same array without EBG are presented. It is observed that significant reduction, more than 5 dB, of the level of those of the Sij coefficients which correspond to pairs of elements that have the EBG between them, as the S23, S24 and S14 can be achieved. Moreover, indicative results of the 3D and polar gain radiation patterns for one of the elements are shown in Figure 10. The patterns of all four elements are almost similar and the deviations from their maximum values do not exceed 3 dB inside the space angular section of utilization. The suitable orientation of the elements and the reduction of their mutual coupling lead to the reduction of the correlation of the respective coefficients, ρij. It is validated by calculating them via the theory of [29] and Figure 11 depicts the results of these calculations for the cases of the array with EBG and without EBG. The comparison between the two arrays, shows a significant reduction of the ρij at the array with EBG especially when the elevation angle of the incoming signals are high, namely when they come from the space area at the broadside of the antenna. Among all four elements, of the EBG array, ρij values are less than 0.1, being a little higher in some cases.
In Figure 12, results are provided for two cases, considering a 4 × 2 MIMO orientation, as well as one and six eigenvector and eigenvalues for covariance matrix formulation, respectively. They concern to two antennas. The first of them, Case A, represents an ideal system with an antenna having omni directional radiation pattern and channels modeled according to the Gaussian distribution which corresponds to zero correlation. The second one, Case B, is the realistic antenna array, of Figure 7, designed properly in order the correlation to be minimized. In this case, the channels were modeled according to 3GPP specifications as described in Section 4 and Equation (25). In this equation, for the evaluation of the channel matrix elements, the antenna’s radiation patterns are taken into account through the antennas’ gain values which are calculated via simulation. The very low space correlation is impressed to these patterns and is inserted substantially to the channel estimation. As it can be observed, in Case B, for 18 power terms the mean BER is 3.142 × 10⁻⁴, while for 36 power terms the corresponding number is 3.109 × 10⁻⁴. Therefore, although we have again a complexity reduction equal to 10% as in Case A, the corresponding mean BER inaccuracy is further reduced to 1%. It is also shown that the results of BER for the antennas of both cases are very low and converge to each other proving that a real antenna when properly designed can achieve the records of a theoretically omni directional antenna which operates under ideal conditions.

5. Conclusions

The performance of a proposed transmission strategy for MIMO-WCDMA networks based on eigenvalue analysis was evaluated in this work. The goal was to select the appropriate transmission matrices per active user in order to maximize system throughput in a multiuser/multipath environment. As it was shown in the results section, the selection and processing of all multipath components via RAKE receivers can improve system performance in terms of mean BER. Moreover, the adoption of the proposed approach can reduce the overall complexity of transmit weight formulation. Results were also validated for the case of a realistic four-element antenna. In this case, correlation coefficients values among all four elements were less than 0.1. Hence, BER deterioration was only 10% compared to the ideal case of uncorrelated channels among all transmit and receive antennas.
Motivated by the above results, we aim that future work will include the extension of the presented results in cellular networks, where fundamental trade-offs among spatial multiplexing and diversity transmission mode will be investigated.

Author Contributions

Conceptualization, P.K.G. and G.A.K.; Methodology, P.K.G., D.I.K. and K.S.; Software, I.S.V.; Validation, P.K.G., M.T.C. and K.S.; Formal Analysis, D.I.K. and K.S.; Writing: Original Draft Preparation, P.K.G. and C.T.D.; Writing: Review and Editing, P.K.G., C.T.D., D.I.K., I.S.V., G.A.K., M.T.C. and K.S.

Acknowledgments

This research has been co-financed by the European Union (European Social Fund—ESF) and Greek national funds through the Operational Program “Education and Lifelong Learning” of the National Strategic Reference Framework (NSRF)-Research Funding Program: THALIS–DUTH, “Design Techniques for Digitally Controlled RF-Microwave Structures Appropriate for Software Defined–Cognitive Radio” (MIS 379521).

Conflicts of Interest

The authors declare no conflicts of interest.

References

  1. Holma, H.; Toskala, A. WCDMA for UMTS: Radio Access for Third Generation Mobile Communications, 3rd ed.; John Wiley & Sons: ‎Hoboken, NJ, USA, 2004. [Google Scholar]
  2. Glisic, S.G. Adaptive WCDMA: Theory and Practice; John Wiley & Sons: Hoboken, NJ, USA, 2002. [Google Scholar]
  3. Paulraj, A.; Gore, D.; Nabar, R.; Bolcskei, H. An overview of MIMO communications—A key to gigabit wireless. Proc. IEEE 2004, 92, 198–218. [Google Scholar] [CrossRef]
  4. Lozano, A.; Jindal, N. Transmit Diversity vs. Spatial Multiplexing in Modern MIMO Systems. IEEE Trans. Wirel. Commun. 2010, 9, 186–197. [Google Scholar] [CrossRef]
  5. Choi, W.; Andrews, J. Spatial Multiplexing in Cellular MIMO-CDMA Systems with Linear Receivers: Outage Probability and Capacity. IEEE Trans. Wirel. Commun. 2007, 6, 2612–2621. [Google Scholar] [CrossRef]
  6. Gkonis, P.K.; Tsoulos, G.V.; Kaklamani, D.I. Performance evaluation of MIMO-WCDMA cellular networks in multiuser frequency selective fading environments. Wirel. Commun. Mob. Comput. 2013, 13, 72–84. [Google Scholar] [CrossRef]
  7. Shenoy, S.P.; Ghauri, I.; Slock, D.T.M. Optimal Precoding and MMSE Receiver Designs for MIMO WCDMA. In Proceedings of the VTC Spring 2008—IEEE Vehicular Technology Conference, Singapore, 11–14 May 2008. [Google Scholar]
  8. Mc Beath, S.; Ahmed, M.; Rohani, K. Impact of imperfect estimators on W-CDMA receiver performance with MIMO antenna systems. In Proceedings of the IEEE 58th Vehicular Technology Conference (VTC), Orlando, FL, USA, 6–9 October 2003. [Google Scholar]
  9. Ghavami, S.; Feghhi, M.M.; Abolhassani, B. Performance Analysis of Downlink MIMO WCDMA Systems Using Antenna Selection in Transmitter and MRC Plus LDD in Receiver over Correlated Nakagami-Fading Channels. Wirel. Sens. Netw. 2010, 2, 555–561. [Google Scholar] [CrossRef]
  10. Kim, J.; Kim, H.; Park, C.S.; Lee, K.B. On the Performance of Multiuser MIMO Systems in WCDMA/HSDPA: Beamforming, Feedback and User Diversity. IEICE Trans. Commun. 2006, 89, 2161–2169. [Google Scholar] [CrossRef]
  11. Develi, I.; Filiz, M. Improvement of BER Performance in MIMO-CDMA Systems by Using Initial Phase Optimized Gold Codes. J. Electr. Eng. 2013, 64, 38–43. [Google Scholar] [CrossRef]
  12. Tavassoli, F.; Abolhassani, B.; Oraizi, H.; Zhou, C. Three novel simple beamforming algorithms for CDMA communication systems. Int. J. Commun. Syst. 2014, 27, 248–264. [Google Scholar] [CrossRef]
  13. Shlens, J. A Tutorial on Principal Component Analysis; Cornell University Library: Ithaca, NY, USA, 2005. [Google Scholar]
  14. Kim, K.; Park, S.; Kim, J.; Park, S.-B.; Bae, M. A fast minimum variance beamforming method using principal component analysis. IEEE Trans. Ultrason. Ferroelectr. Freq. Control 2014, 61, 930–945. [Google Scholar] [CrossRef] [PubMed]
  15. Yu, L.; Wei, L.; Langley, R. Robust Adaptive Beamforming for Multi-Path Environment Based on Domain Weighted PCA. In Proceedings of the 15th International Conference on Digital Signal Processing, Cardiff, London, UK, 1–4 July 2007. [Google Scholar]
  16. Gkonis, P.K.; Kaklamani, D.I.; Venieris, I.S.; Dervos, C.T.; Chrysomallis, M.T. A New Transmission Strategy for MIMO-WCDMA Spatial Multiplexing Networks based on Principal Component Analysis. In Proceedings of the 11th Conference on Antennas & Propagation (LAPC), Loughborough, UK, 2–3 November 2015. [Google Scholar]
  17. Meredith, J.M. Spatial Channel Model for Multiple Input Multiple Output (MIMO) Simulations. Available online: http://www.qtc.jp/3GPP/Specs/25996-900.pdf (accessed on 4 October 2018).
  18. Goldsmith, A. Wireless Communications; Cambridge University Press: Cambridge, UK, 2005. [Google Scholar]
  19. Efthymoglou, G.P.; Piboongungon, T.; Aalo, V.A. Performance of DS-CDMA Receivers With MRC in Nakagami-m Fading Channels With Arbitrary Fading Parameters. IEEE Trans. Veh. Technol. 2006, 55, 104–114. [Google Scholar] [CrossRef]
  20. Peristerianos, A.; Theopoulos, A.; Koutinos, A.G.; Kaifas, T.; Siakavara, K. Dual-Band Fractal Semi-Printed Element Antenna Arrays for MIMO Applications. IEEE Antennas Wirel. Propag. Lett. 2015, 15, 730–733. [Google Scholar] [CrossRef]
  21. Mosallaei, H.; Sarabandi, K. Antenna Miniaturization And Bandwidth Enhancement Using A Reactive Impedance Substrate. IEEE Trans. Antennas Propag. 2004, 52, 2403–2414. [Google Scholar] [CrossRef]
  22. Li, L.-W.; Li, Y.-N.; Yeo, T.S.; Mosig, J.R.; Martin, O.J. A Broadband and High-Gain Metamaterial Microstrip Antenna. Appl. Phys. Lett. 2010, 96. [Google Scholar] [CrossRef]
  23. Yao, J.; Tchafa, F.M.; Jain, A.; Tjuatja, S.; Huang, H. Far-Field Interrogation of Microstrip Patch Antenna For Temperature Sensing Without Electronics. IEEE Sens. J. 2016, 16, 7053–7060. [Google Scholar] [CrossRef]
  24. Kim, S.-H.; Lee, J.-Y.; Nguyen, T.T.; Jang, J.-H. High-Performance MIMO Antenna with 1-D EBG Ground Structures for Handset Application. IEEE Antennas Wirel. Propag. Lett. 2013, 12, 1468–1471. [Google Scholar] [CrossRef]
  25. Zhang, H.; Chen, J.; Piao, D.; Li, Z.; Sun, J. A Compact Four-Element MIMO Antenna with High Isolation Based on EBG. In Proceedings of the International Symposium on Antennas and Propagation (ISAP), Okinawa, Japan, 24–28 October 2016. [Google Scholar]
  26. Altaf, A.; Alsunaidi, M.A.; Arvas, E. A Novel EBG Structure to Improve Isolation in MIMO Antenna. In Proceedings of the USNC-URSI Radio Science Meeting (Joint with AP-S Symposium), San Diego, CA, USA, 9–14 July 2017. [Google Scholar]
  27. Mourtzios, C.; Siakavara, K. Novel Antenna Configurations with Non-Uniform EBG Lattices for Wireless Communication Networks. In Proceedings of the 7th European Conference on Antennas and Propagation (EuCAP), Gothenburg, Sweden, 8–12 April 2013. [Google Scholar]
  28. Mourtzios, C.; Siakavara, K. Contribution of Non-Uniform EBG Antenna Arrays to the Enhancement of MIMO Channel Capacity. Int. J. Electron. Commun. (AEÜ) 2017, 82, 334–340. [Google Scholar] [CrossRef]
  29. Fujimoto, K. Mobile Antenna Systems Handbook, 2nd ed.; Artech House: London, UK, 2001. [Google Scholar]
Figure 1. Probability density function (PDF) curve of the number of repeats of the Maximization of Signal to Noise Ratio (MSNR) algorithm (Algorithm 1).
Electronics 07 00239 g001
Figure 2. Simulation and theoretical Bit Error Rate (BER) values for a Multiple Input Multiple Output –Wideband Code Division Multiple Access (MIMO–WCDMA) network (Mt = 4, Mr = 2, PG = 128, SNR = 10 dB).
Electronics 07 00239 g002
Figure 3. Simulation and theoretical BER values for a MIMO–WCDMA network (Mt = 4, Mr = 3, PG = 128, SNR = 10 dB).
Electronics 07 00239 g003
Figure 4. Simulation and theoretical BER values for a MIMO–WCDMA network (Mt = 8, Mr = 4, PG = 128, SNR = 10 dB).
Electronics 07 00239 g004
Figure 5. BER comparisons for a MIMO–WCDMA orientation for varying number of eigenvector/eigenvalues for signal reconstruction (SNR = 5 dB, PG = 32, 128).
Electronics 07 00239 g005
Figure 6. BER comparisons for a MIMO–WCDMA orientation for varying number of eigenvector/eigenvalues for signal reconstruction (SNR = 10 dB, PG = 32, 128).
Electronics 07 00239 g006
Figure 7. (a) (left part) The four-element transmit array, size: 29.18 cm × 6.15 cm, dielectric: RO3003, (εr = 3, h = 0.812 mm) (b) (right part) the incorporated EBG lattice: Size of patches: 16.8 mm × 16.8 mm, distance between adjacent patches: 0.5 mm, size of EBG’s ground 36 mm × 61.5 mm.
Electronics 07 00239 g007
Figure 8. Scattering coefficients for the signals, at the input of the array elements, versus frequency.
Electronics 07 00239 g008
Figure 9. Mutual scattering coefficients of the signals, among the inputs of the array elements, versus frequency (With EBG in (a) and without EBG in (b)).
Electronics 07 00239 g009aElectronics 07 00239 g009b
Figure 10. Radiation patterns of antenna of Figure 6: (a) 3D gain pattern; (b) polar gain pattern on-xz-plane (f = 2.45 GHz).
Electronics 07 00239 g010
Figure 11. Correlation coefficients of the array with and without EBG, versus the mean direction of arrival of the waves incoming from the two main planes of the array (f = 2.45 GHz).
Electronics 07 00239 g011
Figure 12. BER comparisons for a MIMO–WCDMA orientation for varying number of eigenvector/eigenvalues for signal reconstruction (SNR = 10 dB, PG = 32, Cases A and B).
Electronics 07 00239 g012
Table 1. Mean number of repeats of the MSNR-PCA algorithm.
Power TermsMean Number of Repeats ( n ¯ ) Power TermsMean Number of Repeats ( n ¯ ) Power TermsMean Number of Repeats ( n ¯ )
288.36521495.409826102.2866
489.34521696.658628103.5060
690.34921897.861230104.9076
891.42462098.936432106.2758
1092.639822100.036434108.0206
1293.989424101.075436108.0000

