Article

A Generation of Enhanced Data by Variational Autoencoders and Diffusion Modeling

1
Department of Computer Science, Graduate School, SangMyung University, Seoul 03016, Republic of Korea
2
Department of Intelligent IoT, SangMyung University, Seoul 03016, Republic of Korea
*
Author to whom correspondence should be addressed.
Electronics 2024, 13(7), 1314; https://doi.org/10.3390/electronics13071314
Submission received: 27 February 2024 / Revised: 27 March 2024 / Accepted: 28 March 2024 / Published: 31 March 2024
(This article belongs to the Special Issue Data Privacy and Cybersecurity in Mobile Crowdsensing)

Abstract

:
In the domain of emotion recognition in audio signals, the clarity and precision of emotion delivery are of paramount importance. This study aims to augment and enhance the emotional clarity of waveforms (wav) using a technique called stable diffusion. Datasets from EmoDB and RAVDESS, two well-known repositories of emotional audio clips, were utilized as the main sources for all experiments. We used the ResNet-based emotion recognition model to determine the emotion recognition of the augmented waveforms after emotion embedding and enhancement, and compared the enhanced data before and after the enhancement. The results showed that applying a mel-spectrogram-based diffusion model to the existing waveforms enlarges the salience of the embedded emotions, resulting in better identification. This augmentation has significant potential to advance the field of emotion recognition and synthesis, paving the way for improved applications in these areas.

1. Introduction

Accurate recognition of emotions from audio signals has long been a topic of intense research. Scholars have explored ways to capture and analyze the subtle nuances and intensity of emotions in audio signals. Previous work has utilized various feature extraction techniques and machine learning models to classify and predict emotions from audio signals. Also, in the area of emotion synthesis, various technical approaches have been proposed to generate speech recordings with natural emotions [1,2,3,4,5,6].
At the core of these studies is the need for high-quality data. In AI research, good quality data is necessary to train a model that performs well. In recent years, as the level of artificial intelligence research has been increasingly advanced, the need to build high-quality data has become increasingly necessary and the process has become increasingly difficult. In addition, in recent deep learning research, generative models are in the spotlight, and the quality of the generated results depends on the data used, so the importance of data is becoming more important. In recent generative model research, the focus has been on diffusion. Generative models such as conventional synthetic models or GANs have problems such as too much computation, long training time and cost, and poor accuracy in the inference process. Therefore, applying diffusion, which has been actively utilized in the image domain, to audio data is expected to facilitate the development of emotion recognition and synthesis by obtaining high-quality data [7].
In this paper, we applied the diffusion technique to enhance the emotion clarity of audio clips by utilizing the mel-spectrogram, a unique feature of audio [8]. The process of emotion synthesis using diffusion is divided into emotion embedding, utterance-style embedding, and the diffusion process. Emotion embedding is used to extract emotion information, utterance-style embedding is used to identify the features of emotion-specific mel-spectrogram images, and then diffusion is used to generate mel-spectrograms that meet the user’s conditional input. The augmented emotional utterance data obtained through this process was evaluated using a residual network (ResNet)-based emotion classification model. The evaluation showed that the emotion recognition rate was higher than the existing dataset, which means that the augmented dataset contains clearer emotions than the existing emotion dataset, confirming the advantages of augmented emotional utterance data in emotion research.
The organization of this paper is as follows. Section 2 describes the background of the techniques utilized in the research. We overview and summarize diffusion, mel-spectrograms, Convolutional Neural Networks (CNNs), and the Emotional Speech Database. Section 3 describes related research. Starting with the work that precedes this thesis, synthesizing emotional speech data using GANs, we describe and review the work on synthesizing emotional speech data using diffusion models. In Section 4, we propose a diffusion-based sentiment synthesis model, which is the method of sentiment utterance data synthesis proposed in this paper, followed by the experimental design and experimental results in Section 5, and concluding remarks in Section 6.
This paper aims to respond to the need for high-quality emotion data and to explore quality data augmentation methods in the field of audio emotion recognition and synthesis by utilizing diffusion models. We demonstrate the improvement of emotion clarity through mel-spectrograms and diffusion techniques and propose a novel approach to improve the accuracy of emotion recognition. This represents a technological advance in emotion research and is expected to have a good impact on the future development of emotion recognition and synthesis technology.

2. Related Work

Research on the augmentation and generation of emotional utterance data has been continuously evolving from the past to the present, and various approaches have been tried in this field, including emotion data augmentation using GANs, data generation using diffusion models, and emotion synthesis models using existing neural networks. In particular, recent research has focused on augmentation using GANs and data generation using diffusion models.
First, in [9], DCGAN among GANs was used to augment data for each emotion using mel-spectrograms. By comparing the emotion recognition rate of EmoDB and RAVDESS datasets used in the experiment, this study showed that data augmentation using DCGAN contributes to increasing the emotion recognition rate.
Next, studies using diffusion models, such as papers [10,11,12,13], proposed to augment emotional utterance data by using mel-spectrograms of spoken utterances as input data for diffusion models.
Among the studies using diffusion, paper [10] used a refinement process of injecting and extracting Gaussian noise for learning sentiment data, and introduced a method of receiving conditional input from users by utilizing U-Net, a basic type of BERT model and diffusion model.
Next, paper [11] proposed the design of Grad-TTS [14] using a sentiment synthesis method based on stochastic differential equation (SDE) [15] formulation and de-noised diffusion probability model (DDPM) [16]. This study directly injected sentiment data into the learning process, introduced SER to encode sentiment information, utilized text as conditional input from the user, and used the wav2vec 2.0 model [17] to capture speaker embeddings. The speaker embeddings and emotion information were used to augment the new dataset by de-noising the mel-spectrograms. This work differs from paper [15] in that it achieves emotion synthesis using emotion embeddings rather than simply using emotion data for training, and shows that emotion embedding techniques improve the performance of emotion data augmentation, increasing the depth of emotion information.
Paper [12] had the structure of text encoder–emotion embedding–diffusion decoder, and used adversarial learning to separate speaker features, while emotion embedding used orthogonal projection, considering that speaker separation may weaken emotion expressiveness. Finally, diffusion decoders used emotion-related distributions to recover the mel-spectrogram.
Finally, ref. [13] had a phoneme encoder, speaker encoder, and emotion encoder similar to [18], and used the mel-spectrograms of emotion data for training without further adjustment, but differed in that it applied the information from the resulting emotion embeddings for inference.
In this paper, we propose a model that contains sufficient emotion information and generates augmented datasets of much higher quality than existing emotion datasets for superior performance in the synthesis of emotional utterance data by referring to emotion embedding techniques in related research, as well as techniques such as utterance encoders and conditional inputs.

3. Background

3.1. Diffusion

Diffusion models, as referenced in [16], are a form of latent variable models characterized by the equation p θ x 0 = p θ x 0 :   T   d x 1   :   T . In this equation, x 1 ,   , x T are latent variables having the same dimensionality as the observed data x 0 , which is drawn from the distribution q ( x 0 ). The combined distribution p θ x 0 : Τ is recognized as the reverse process and is characterized by a Markov chain using learned Gaussian transitions, originating from the distribution p x Τ = N ( x Τ ; 0 ,   Ι ) .
The cornerstone idea of the diffusion model emanates from the diffusion process, where Gaussian noise is sequentially added to the original image, converting it into pure random noise. This diffusion process essentially has the structure q ( x Τ | x Τ 1 ) , as expressed in Equation (1), and it involves the continuous application of a Gaussian Markov chain to the original image x 0 . After multiple iterations, x Τ adheres to a complete random Gaussian distribution.
q x 1 : T x 0 = t = 1 T q x t x t 1 ,      q x t x t 1 = N ( x t ; 1 β t x t 1 , β t Ι )
Subsequently, an essential aspect is learning the inverse transformation of Equation (1), termed the inverse process. The inverse process begins when x Τ follows a thorough Gaussian distribution and seeks to convert it back to the original x 0 . This inverse process is defined by the parameters of the Gaussian Markov chain, μ θ and Σ θ , and is represented as Equation (2).
p θ ( x 0 : T ) = p ( x T ) t = 1 T p θ x t 1 x t ,          p θ x t 1 x t = N ( x t 1 ; μ θ x t , t , θ ( x t , t ) )
By optimizing the diffusion process and the inverse process, the training objective, in terms of the ELBO, is given by Equation (3).
E q D K L ( q ( x T | x 0 ) | p x T L t + t > 1 D K L ( q ( x t 1 | x t , x 0 ) | | p θ ( x t 1 | x t ) ) L 1 : T 1 l o g p θ ( x 0 | x 1 ) L 0
In Equation (3), L t signifies the forward process, while L 1 : T 1 pertains to the reverse process. The critical learning parameter is denoted by p θ . As L t lacks trainable parameters, it can be regarded as a constant during the learning phase. Consequently, the essence is optimizing the L 1 : T 1 segment. The optimization results are represented by Equation (4).
p θ x t 1 x t = N ( x t 1 ; μ θ x t , t , θ ( x t , t ) ) ,   ( t = 1 ~ T 1 )
Therefore, this paper utilized the diffusion and backward process of the diffusion model to generate mel-spectrograms using de-noising techniques, and combined with techniques such as emotion embedding, text embedding, feature extraction, encoder, and decoder to generate emotional speech data in the form of mel-spectrograms with improved emotion.

3.2. Mel-Spectrograms

A mel-spectrogram is a visual representation of the spectrum of sound that utilizes the mel frequency scale to show one of the salient features of speech and voice. The mel frequency scale is often used in speech and audio processing because it is intentionally designed to reflect the way the human ear is sensitive to certain frequencies. Whereas standard spectrograms operate on a logarithmic frequency scale, mel-spectrograms are constructed using a mel frequency scale. This design choice allows it to more closely match human auditory characteristics, focusing specifically on the frequencies that the human ear perceives most distinctly.
To obtain a mel-spectrogram, speech utterances and speech are divided into short frames of uniform length. To perform spectral analysis on each frame, it must be transformed from the time domain to the frequency domain. This transformation step uses techniques such as the Fast Fourier Transform (FFT) and the Short Time Fourier Transform (STFT). The transformation step uses a Hamming window to reduce frequency leakage, which occurs when a signal is truncated to a certain length and the periods of the signal are not exactly aligned, and edge effects, which are distortions of the signal at the beginning and end of the signal in the time domain. After this transformation, the derived spectrum is interfaced with a bank of mel filters to extract the energy associated with each frequency bank on the mel scale. The mel-spectrogram effectively encapsulates relevant information about speech by representing three-dimensional data of time, frequency, and amplitude as a two-dimensional image [19].
Therefore, in this study, we use mel-spectrograms as input data to augment speech data through the diffusion process. Furthermore, the reason why we do not use features other than mel-spectrograms in this study is that if we use features such as MFCC or chroma in the diffusion model, we are trying to generate the value of the feature rather than the speech information itself, and we use mel-spectrograms because the diffusion model originated in the image domain and we want to extend it to the speech domain. In addition, by evaluating the enhanced emotional speech data by using it as input to the emotion evaluation model, we can comprehensively analyze the trajectories of complex speech features and emotional nuances [20].

3.3. Convolutional Neural Networks

Convolutional Neural Networks (CNNs) originated from the necessity of deep learning models that accommodate local features within image patterns, adeptly capturing their spatial structures. CNNs have been predominantly employed in various computer vision tasks, including image classification, object detection, medical image analysis, and face recognition. Due to their remarkable performance in learning based on spatial structures, patterns, and features of images, their usage has extended beyond vision tasks to various signal data, encompassing audio and sensors [21].
A CNN processes input images through several layers, such as convolutional layers, pooling layers, and fully connected layers, to distill information. The convolutional layers are primarily utilized to detect features from the input data, while pooling layers serve the purpose of reducing the data’s dimensionality.
In this study, we investigate the change in emotion recognition rate of emotional audio data enhanced by a diffusion model. The diffusion model is used for feature extraction, pattern-based learning, feature map generation, etc.

3.4. Emotional Speech Database

The main objective of this thesis is to identify clearer emotional distinctions through the enhancement of emotional speech data, where the chosen database plays a pivotal role. Two databases were used in this thesis: EmoDB and RAVDESS.
EmoDB, originating from the Technical University of Berlin, consists of data sampled at 16 kHz. It contains emotions such as neutral, happy, sad, angry, fear, and disgust. There are 10 speakers in the database, five male and five female. The recordings consist of different emotional states conveyed through German sentences and are characterized by the fact that the speakers were genuinely experiencing the emotions they described during the recording.
RAVDESS, on the other hand, is a product of the University of Toronto that records data sampled at 48 kHz in English [18]. While RAVDESS provides a wider spectrum of emotions, including neutral, calm, happy, sad, angry, surprised, fearful, and disgust, we specifically used neutral, happy, sad, angry, surprised, fear, and disgust in this paper to maintain consistency with EmoDB. The database contains recordings from 24 speakers, 12 male and 12 female. A unique feature of RAVDESS is that the speakers expressed emotions with two different intensities, and all recordings were made under controlled conditions using the same sentences.
A high-quality database is indispensable for sentiment-based analysis. In this paper, we utilized both EmoDB and RAVDESS. Due to the difference in sampling rate of the two, we resampled all data to 22,025 Hz for uniformity.
Table 1 shows the number of datasets per emotion.

4. Proposed Method

4.1. Data Preprocessing

In this paper, we used the EmoDB and RAVDESS datasets. For our experiments, nested emotions such as happiness, anger, sadness, fear, neutrality, and disgust were used from both the EmoDB and RAVDESS datasets. EmoDB has a sampling rate of 16 kHz and RAVDESS has a sampling rate of 48 kHz, so both datasets were resampled to 22,025 Hz.
To ensure consistent conditions across the datasets, we adjusted the length of the emotion speech samples by padding shorter samples to match the length of the longest sample, so that all data was 10 s long, and we grouped and reorganized the datasets according to each emotion.
Table 2 shows the emotion data information.
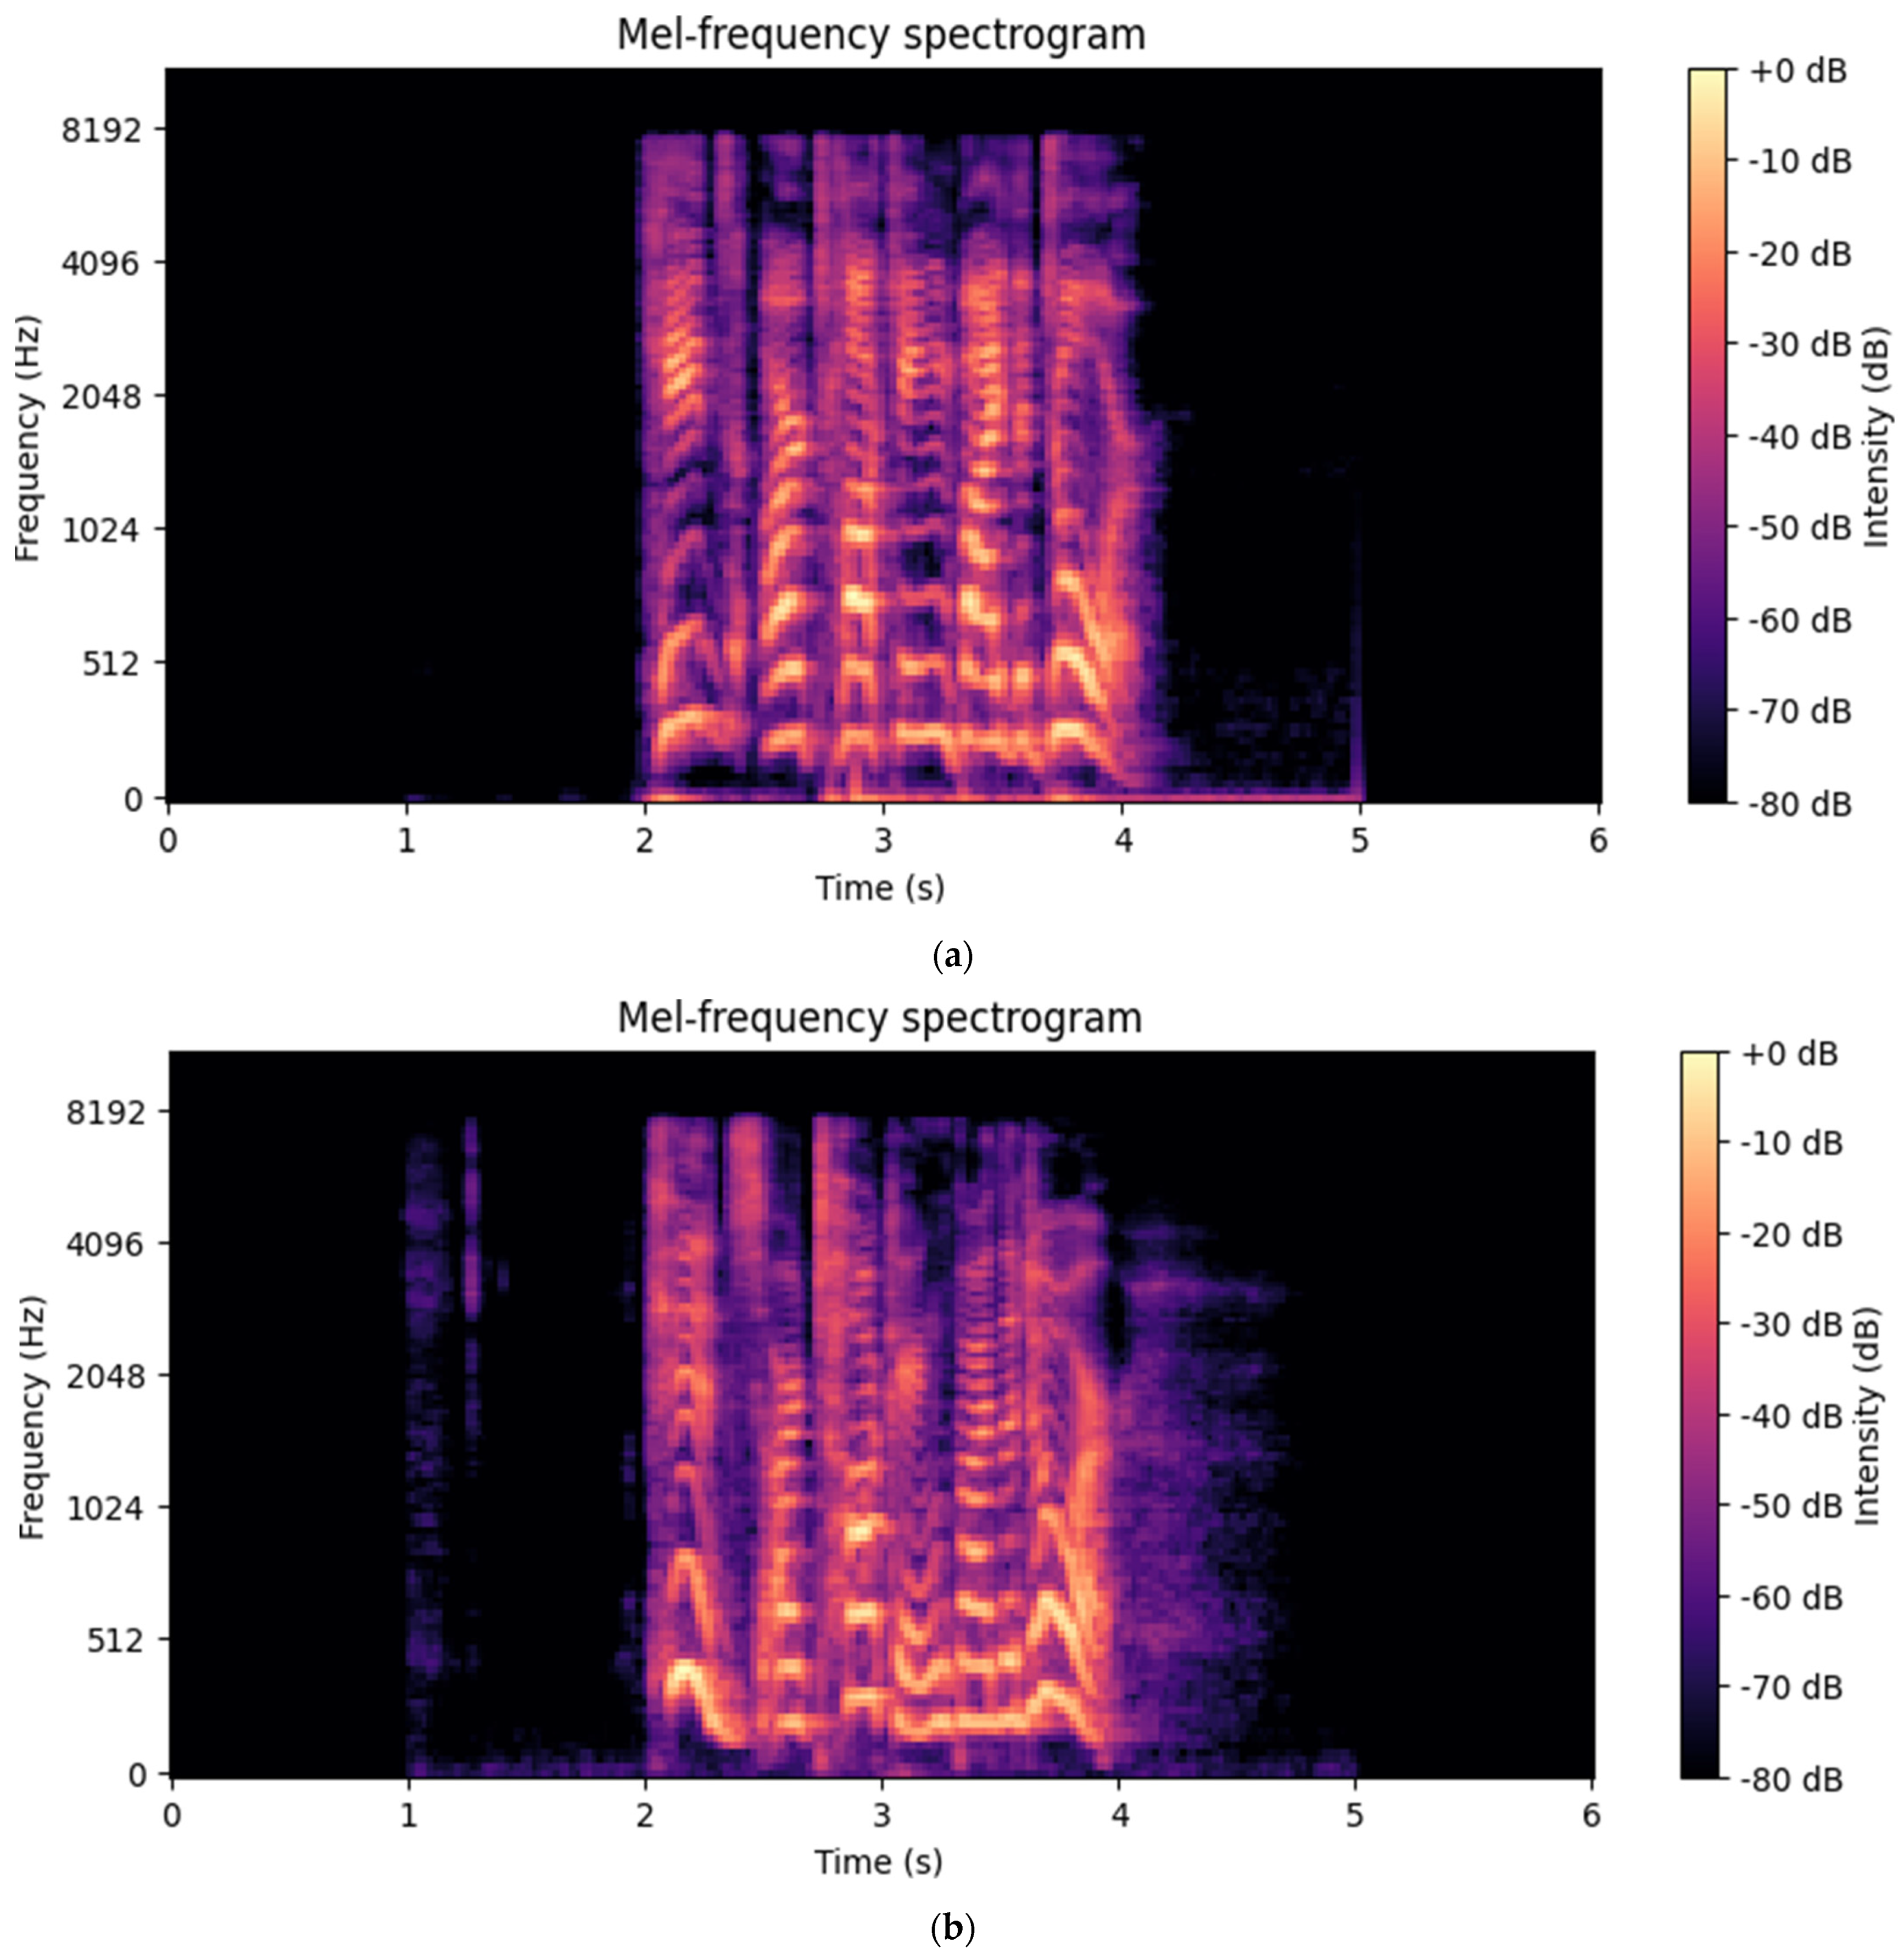
In this paper, we also considered the utilization of diffusion by treating speech like an image [22]. Therefore, all the speech data were converted into mel-spectrograms using Python’s librosa library. The reason why we do not detect utterance segments in this process is that we use mel-spectrograms like images, where noise is injected during the diffusion and inversion process and subsequently removed. This way, the firing part of the image is reconstructed according to the features of the original data, while the padded part, which has no mel-spectrogram image, is not reconstructed. This approach justified bypassing the firing part. To avoid the loss of temporal information in the data, we did not use the Fast Fourier Transform (FFT), but rather the Short Time Fourier Transform (STFT) during the conversion. As a result, the emotional speech was converted into a mel-spectrogram using the STFT, and after several iterations of parameter tuning, considering the overall length and sampling rate of the WAV file, we chose a hop length of 256 and a window size of 1024 for the STFT [23]. The converted mel-spectrograms were then subjected to Z-score normalization for standardization [24].

4.2. Speech Emotion Recognition (SER)

In this study, we used speech emotion recognition in two steps [25]. First, emotion embeddings were utilized to generate emotion information for typical utterances. Mel-spectrograms containing emotion information were used as input data, and the minibatch technique was used to reduce the amount of computation during the training process. The model was constructed using Pytorch, based on Python, and the model was implemented using the ResNet-50 model, based on CNN specialized in feature extraction and classification. The labels mapped to the data were created by integer encoding of sentiment information followed by one-hot encoding. The training data and validation data were divided 8:2 for training, Adam was used as the optimization function, the learning rate was set to 1 × 10⁻⁴, the CrossEntropyLoss function was used as the loss function, and the Epoch was set to 800 [26,
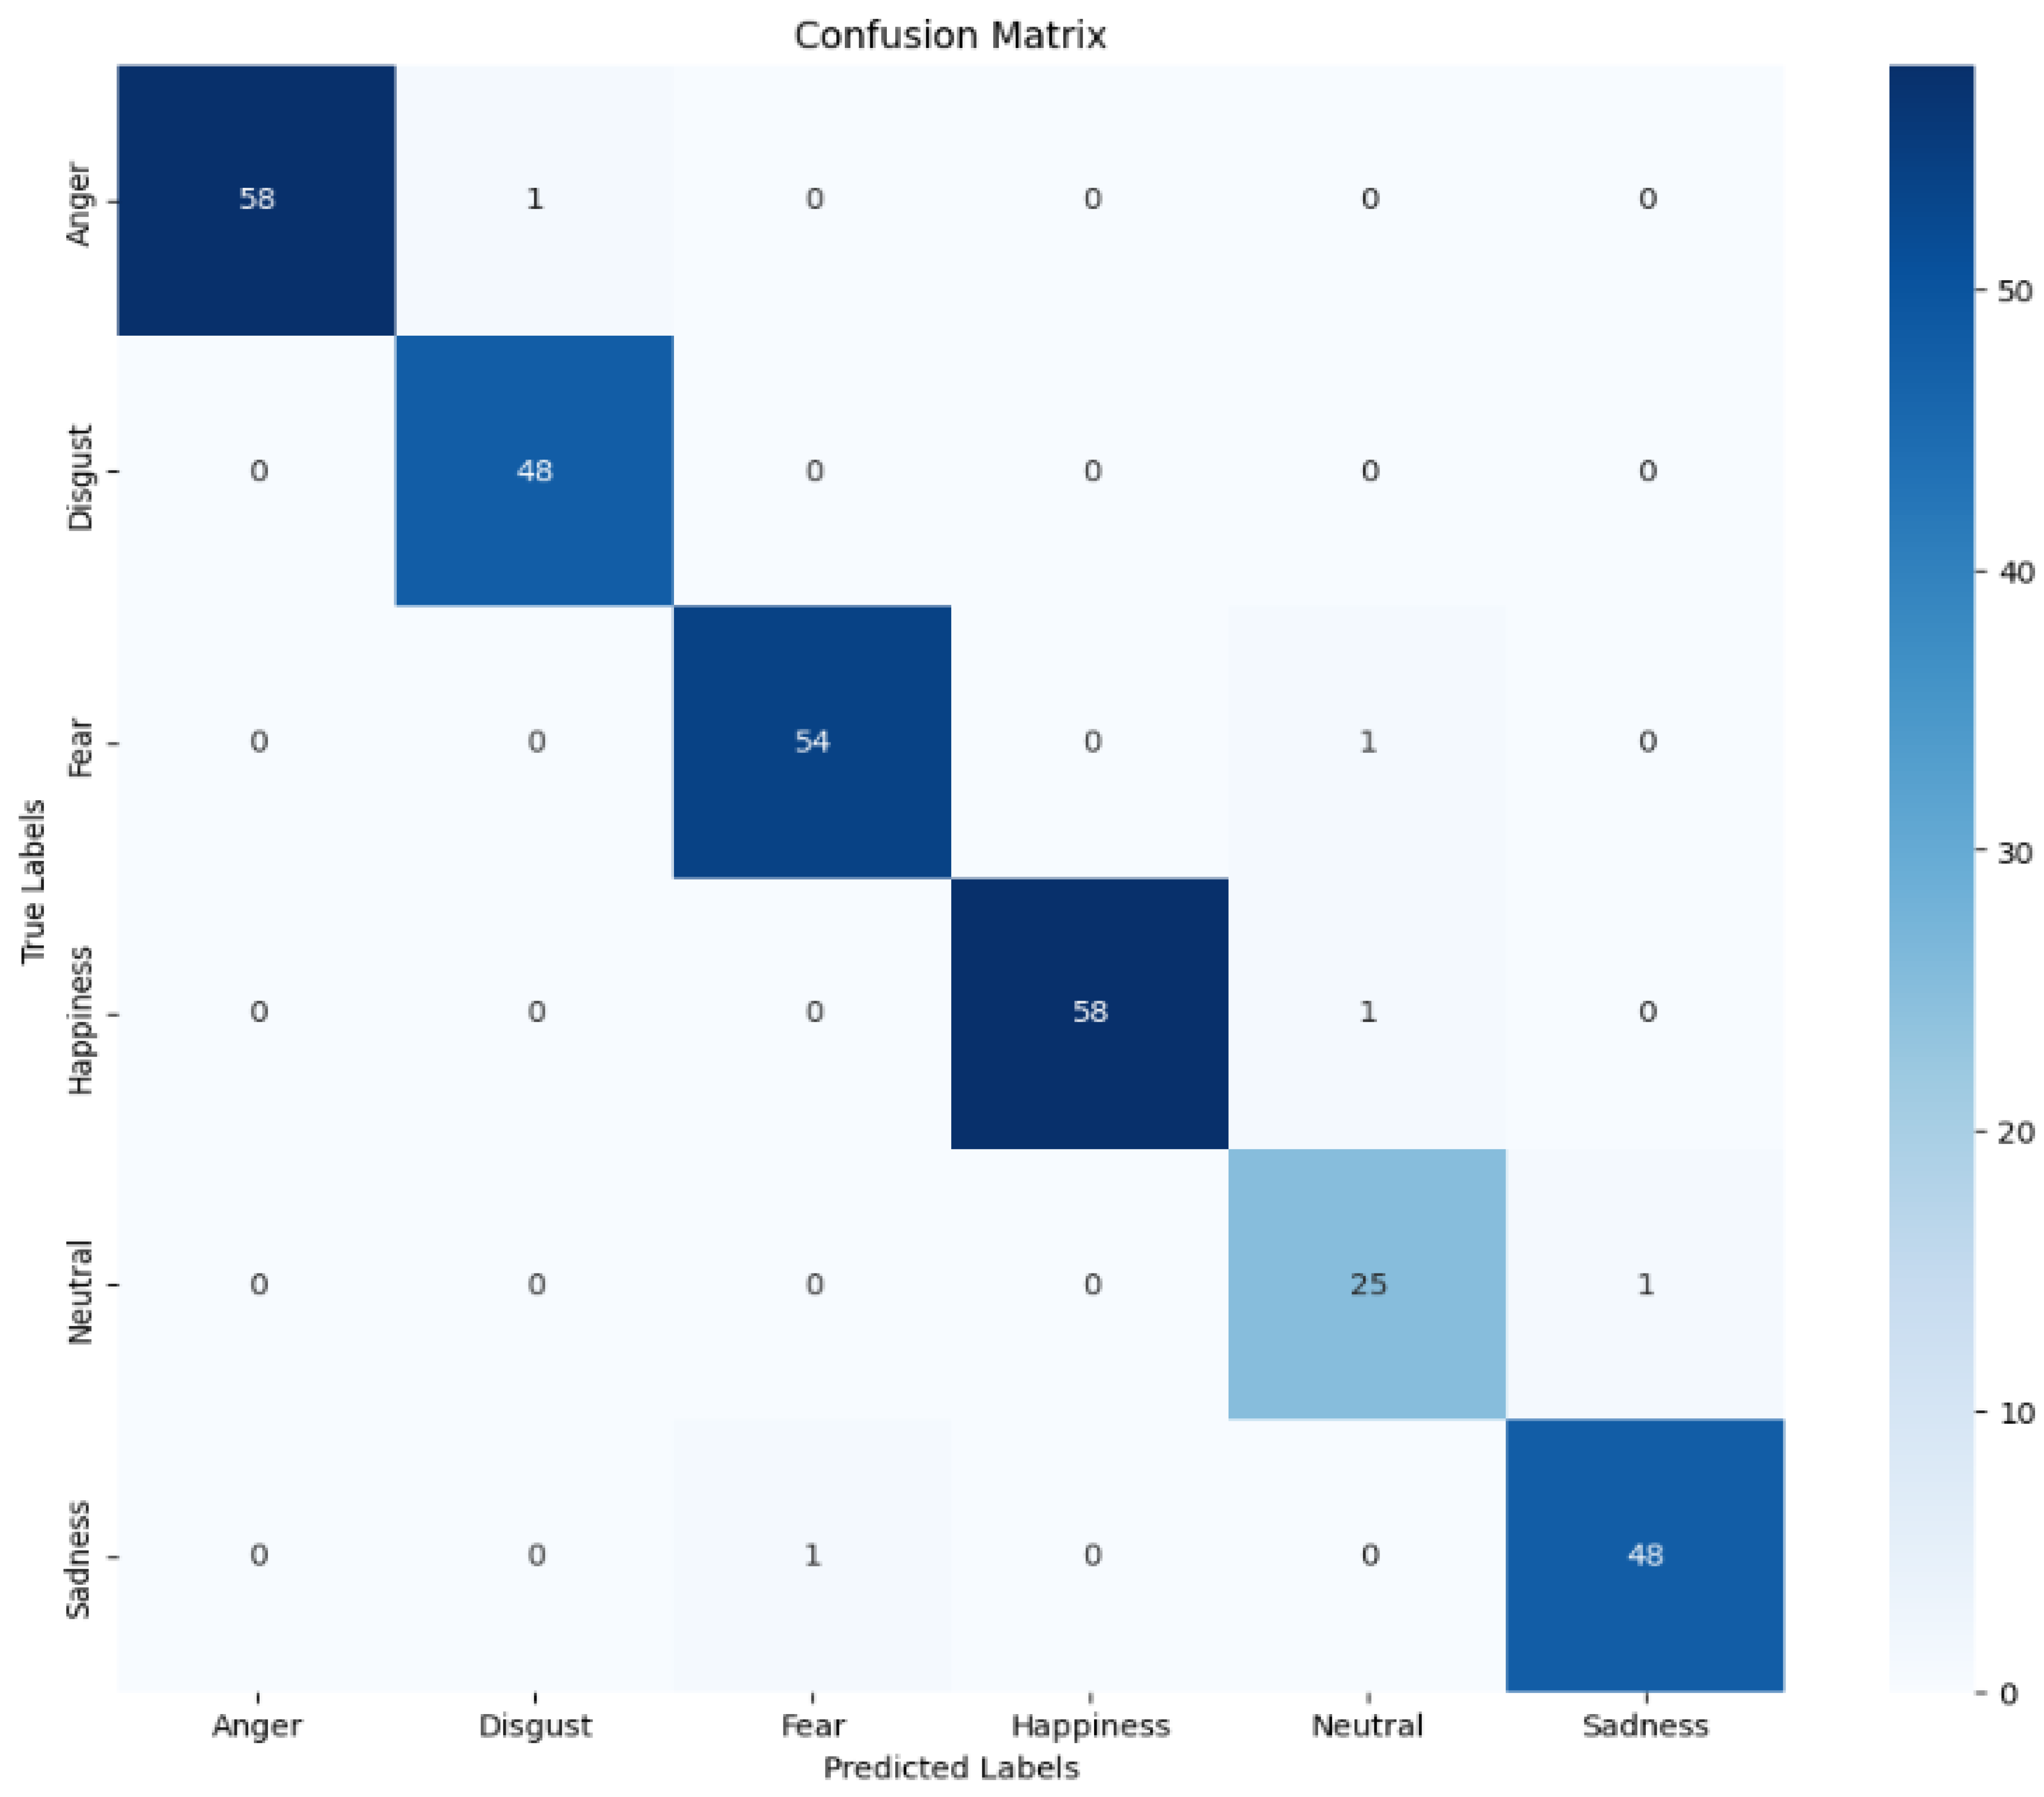
27]. After training, we measured performance based on accuracy and F1 score for each label prediction and used an emotion classification model with a classification performance of 98.31% and an F1 score of 0.9831. We used the trained model in inference mode, where the output is an embedding vector containing emotion information rather than classification results, and then combined it with the utterance-style vector to perform emotion embedding.
Table 3 shows the parameters of the emotion recognition model for emotion embedding, and Figure 1 shows the confusion matrix of the spoken emotion recognition model.
We used the generated mel-spectrograms to validate the emotion feature enrichment. We compared the input EmoDB and RAVDESS data with the generated data based on the accuracy of the confusion matrix [28].

4.3. Diffusion Models with Mel-Spectrograms

In this paper, we utilized a diffusion model to improve the quality of emotional speech data. The diffusion model is a generative AI model that generates data based on the user’s conditional input, input data, and trained data. The generation process is the process of injecting and extracting noise and producing the results requested by the user. It is mainly used in video, and we used mel-spectrograms to generate speech via a diffusion model in terms of signals like video [14].
First, we embedded the utterance. Speech embedding refits data that are not sampled at 22,025 Hz, normalizes the wav, locates the start of the speech, and includes information about the start and end of the speech. It creates a mel-spectrogram for the input wav and normalizes it to prepare the mel-spectrogram for use as input data. The model also uses the mel-spectrogram obtained from the original emotional speech as one of the input data items, the emotion vector.
To solve the memory problem in training the model, we used mel-spectrogram resizing and a batch-based training process. The model is built on Python-based Pytorch and uses a CNN and attention-based encoder to extract features from the input mel-spectrograms. During this process, the utterance style of the mel-spectrogram was extracted, and the attention layer was used in each ResNet block to further focus on the noteworthy features. The second half of the diffusion model, the decoder, was then trained. The decoder used trigonometric and sequential functions to account for temporal information about the data, and the ResNet-based model structure was used to learn based on the features of the data. When using ResNet, we added temporal embeddings and emotion embeddings to focus on information about utterance and emotion and used a linear attention mechanism to focus more on information such as emotion, time, and intonation [29].
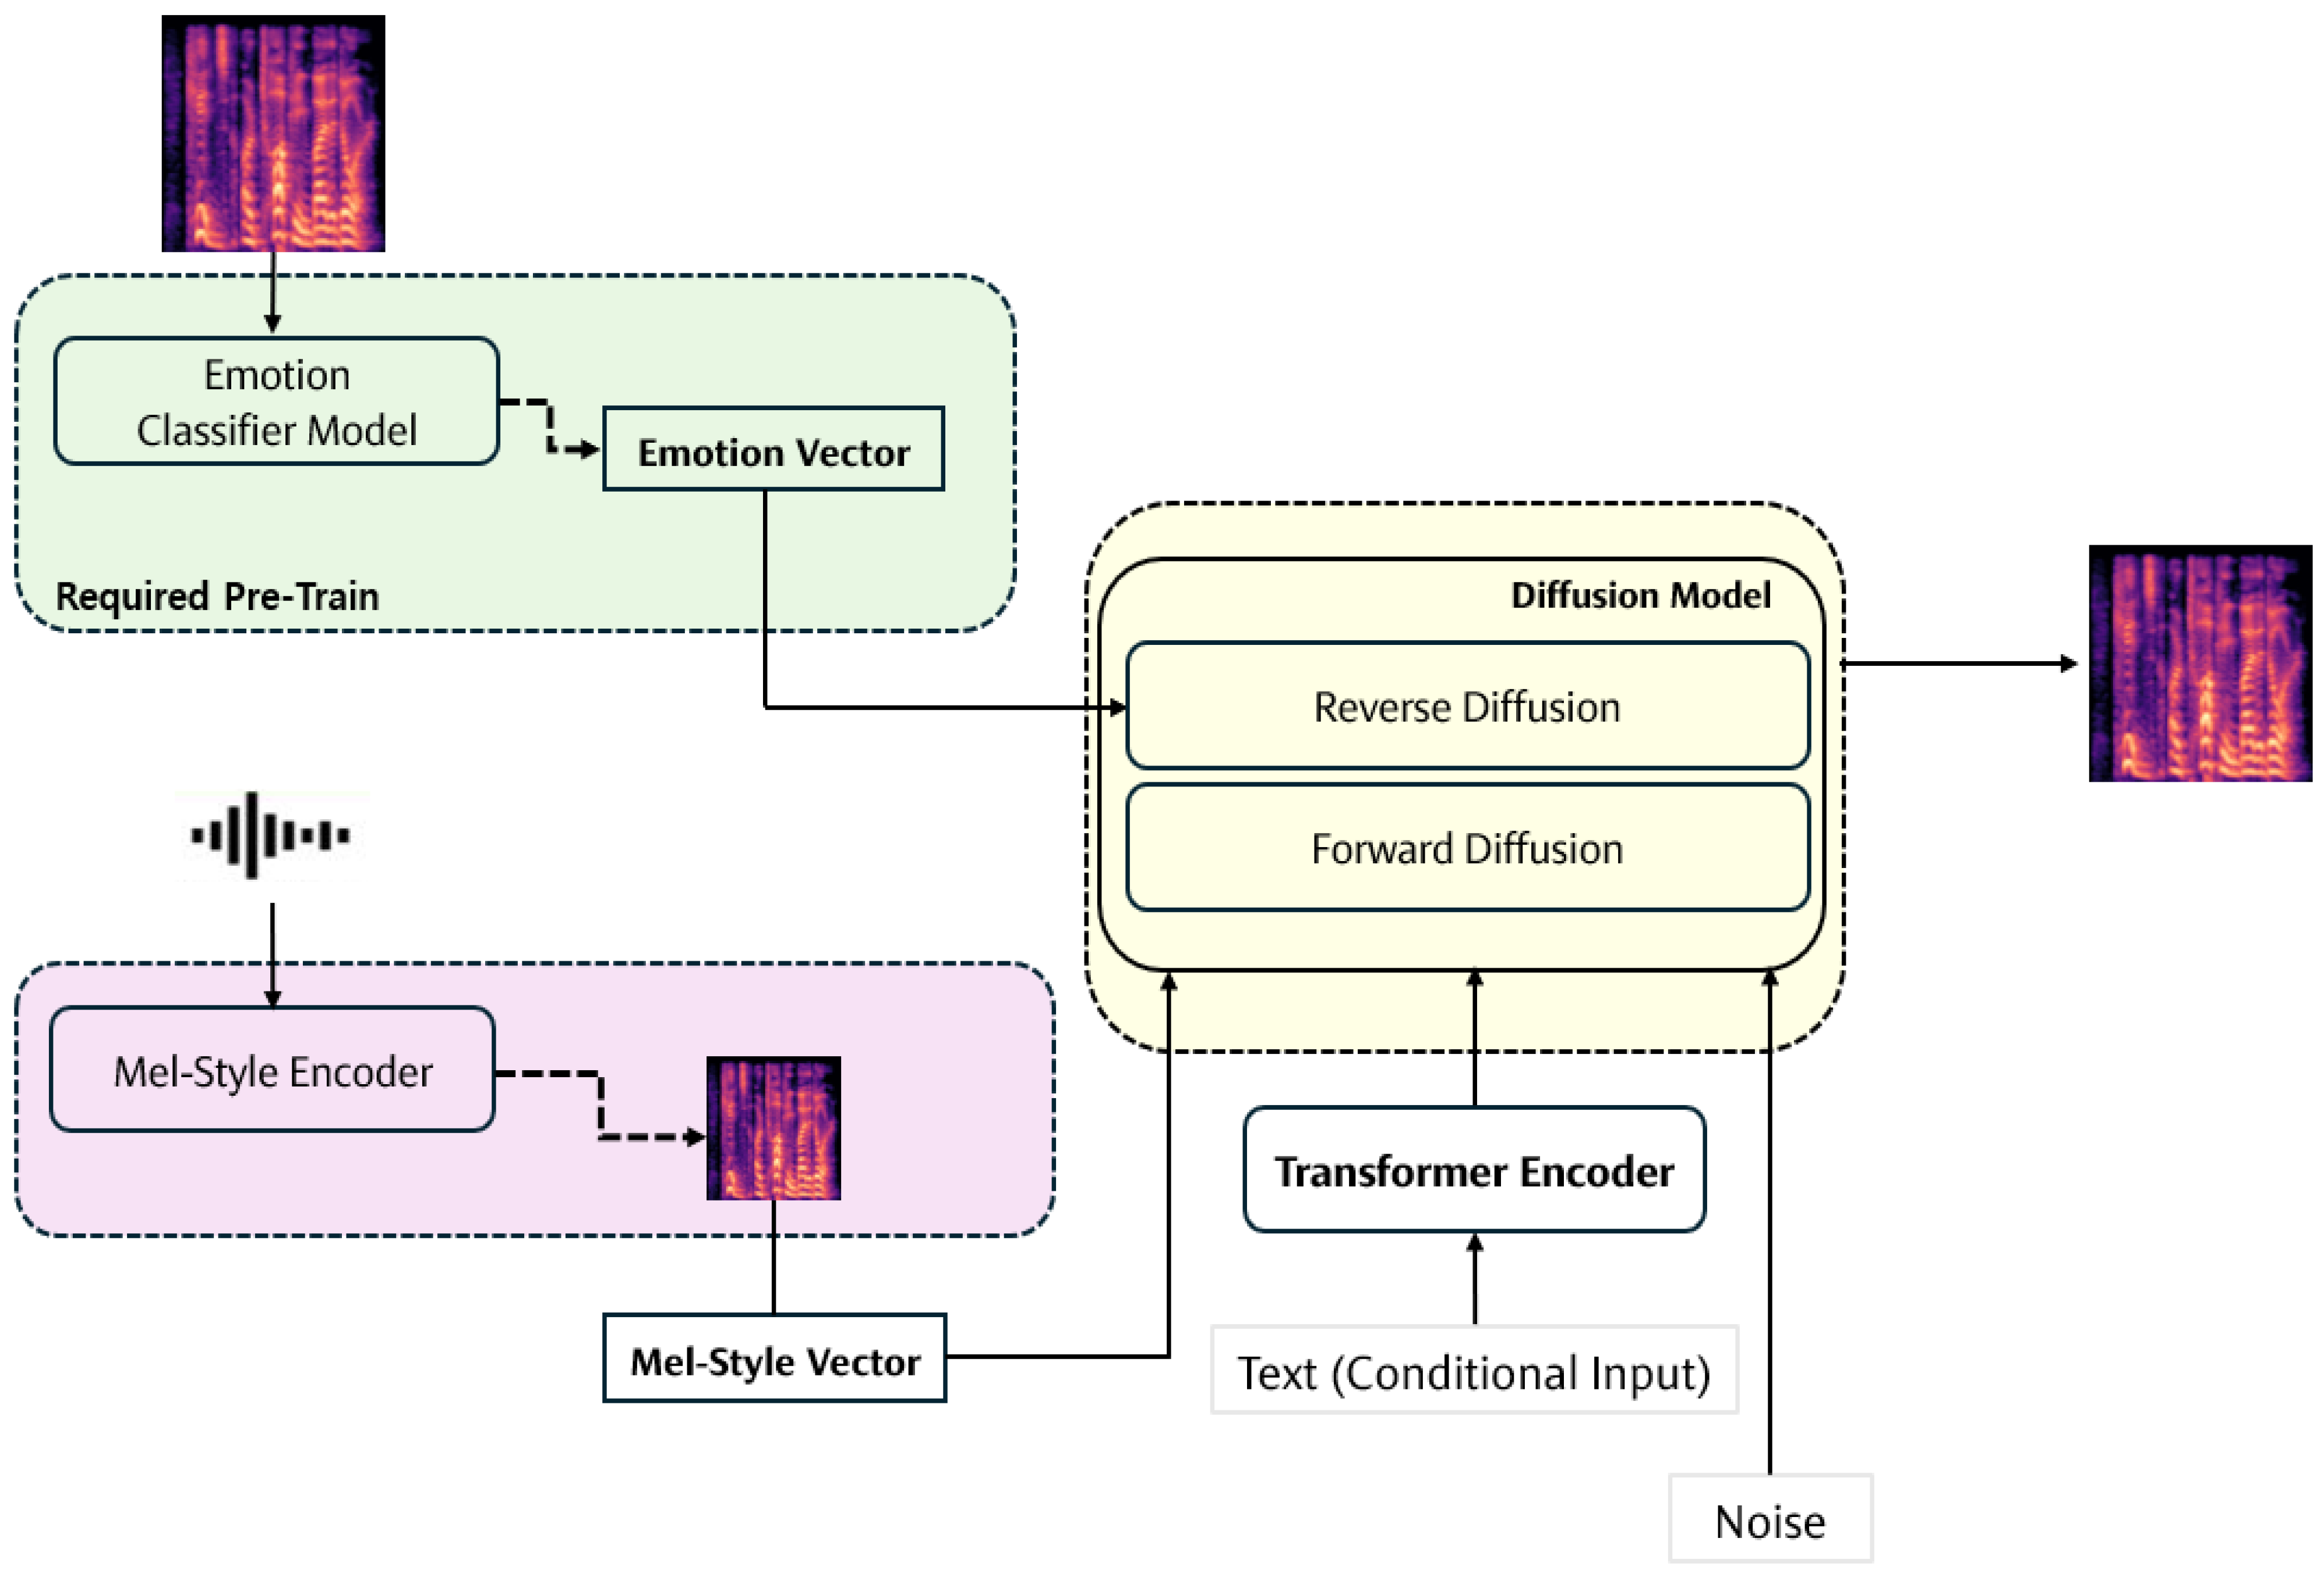
Table 4 shows the overall model design structure of the diffusion model for emotional speech generation.
The structure of the emotional speech generation model implemented in this paper is shown in Figure 2 below.
The proposed method in this paper focuses on the augmented data containing more emotions, which is an important point in related works. It can be seen that the proposed method focuses more on the augmentation of the emotional utterance dataset than the emotional speech utterance, and we note that it is very difficult to obtain good quality data in this process, because of limitations in the emotional utterance dataset for emotion-related learning of artificial intelligence. From this perspective, the authors believe it will be helpful for future emotion-related research if the dataset is augmented with more emotions.
The diffusion model-based emotion synthesis model proposed in this paper is divided into two styles [25].
The first is the emotion embedding module. The emotion embedding module requires a pre-trained emotion recognition model as mentioned above and extracts the emotion vector inferred from the emotion recognition model. It is confirmed that if the diffusion model is used without emotion embedding or in the learning process, as in [10,13], relatively little consideration is given to emotions when data augmentation is performed. Therefore, in [11,12], emotion embedding is used to extract emotion information from the emotion data to be used as training data, and then emotion embedding is performed in the learning process, such as emotion labels.
The second module is the mel-style embedding module, which focuses on utterance information. It utilizes the mel-spectrogram as training data to extract utterance information by emotion. In this paper, we consider using mel-spectrograms as images and use the mel-style embedding module to learn the progression structure, shape, and features of mel-spectrograms. In this way, emotion information can be embedded in the style of each emotion-specific mel-spectrogram to augment new emotional utterance data using a diffusion model, and it is expected that more emotion data will be augmented.
Since this paper focuses on augmenting emotional utterance data with more emotions, we evaluated the recognition rate of each emotion with an emotion recognition model, and since we use mel-spectrograms to do this, we stopped the augmentation step using the diffusion model at the mel-spectrogram.
The proposed method in this paper simplifies the emotion synthesis method into three steps: emotion, utterance information, and generation and purification, which enables the augmentation of emotional utterance data with a small amount of computing power and computation. In addition, it has the advantage of freely obtaining mel-spectrograms that can be utilized as speech features by adding conditional inputs from users to the trained model without having to spend a lot of time and money on data collection.

5. Experiment

5.1. Experimental Design

In this paper, we compare the ground-truth and prediction values of the original data and the generated data using an emotion recognition model to see if the generated data contain improved emotion information.
In addition, there are many considerations for performance improvement such as time complexity, computational cost, and data collection cost, but this paper focuses on the improvement of the generated emotional speech data, so the experiments are focused on how well the emotions are classified.
Each item of generated emotion speech data was given a percentage score for each emotion, considering the balance of the data distribution, and the comparison was performed on EmoDB and RAVDESS, which were used to train the existing emotion embedding and diffusion models for emotion speech generation.

5.2. Synthetic Emotion Speech Data

An example of the mel-spectrogram data generated by the proposed diffusion process is shown in Figure 3, which shows (a) the original mel-spectrogram of the anger emotion speech data and (b) the improved mel-spectrogram of anger emotion using the emotion speech generation diffusion model.
The mel-spectrogram image has temporal information on the x-axis and frequency information on the y-axis. As you can see from the color map information in the mel -spectrogram shown in Figure 3, it closely depicts the original tempo information, amplitude, and emphasis of the utterance. You can also see that the parts of the audio that were padded to match the length of the audio were similarly padded during the WAV generation process.
If you look at Figure 3a,b, you can see that the emotional features are captured and closely mimicked by the duration of the utterance, and the similarity of the frequency flow is very close. We can also see that the high intensity of the frequencies from the emotion of anger is also a good reflection of the characteristics of the existing emotion.

5.3. Result

The reason we used an emotion recognition model for our experiment was to see if the enhanced emotional speech data has clearer emotional attributes. Therefore, we compared the original and the generated emotional speech data. In general, weighted and unweighted accuracy are used in emotion recognition. Weighted accuracy evaluates performance by considering the distribution of each class in the dataset, while unweighted accuracy calculates the overall accuracy by giving equal importance to all classes. Therefore, we used both metrics to gain insight into the overall performance of the model and its performance on individual classes [30].
To compare the UA and WA of the generated data with the original data, we ran experiments using the EmoDB and RAVDESS datasets as shown in Table 5. For EmoDB, the recorded WA was 82.1% and the UA was 81.7% when tested with the original data only. When we also used the generated data for testing, the WA increased to 94.3% and the UA to 91.6%, an improvement of about 10–12%. Similarly, for RAVDESS, using only the original dataset, the WA was 67.7% and the UA was 65.1%. However, using the data generated for the experiment, the WA increased to 77.8% and the UA to 79.7%, a noticeable increase [14].
The above results show that data generation using latent diffusion yields meaningful results. To further measure the prediction accuracy for individual emotions, we also performed per-emotion accuracy measurements. The following table (Table 6, Table 7, Table 8 and Table 9) shows the per-emotion accuracy results for our dataset [9].
The above experimental results show that, overall, the classification accuracy of the generated emotion speech data is higher than that of the EmoDB and RAVDESS datasets, but when looking at the emotions of anger and fear, the number of misclassifications of anger as fear in RAVDESS increased by 1.3%, and the number of misclassifications of happiness as anger in EmoDB increased by 0.5%. Therefore, although improvements were made for each emotion, it was confirmed that there are generated data where the boundaries between specific emotions are blurred.
In [9], data augmentation and dataset construction using DCGAN were performed using EmoDB and RAVDESS in the same way as this paper, and it can be seen from the results of the augmented dataset that the emotion recognition model was used to complete data augmentation with a higher emotion recognition rate than the existing emotion datasets, EmoDB and RAVDESS.
This paper augments the data compared to [9], but the experimental design and process are different, so we checked the emotion recognition rate of the proposed diffusion model compared to the results of existing studies.
The following tables (Table 10 and Table 11) compare the difference between the emotion recognition accuracy results (the match between the ground-truth and the predicted emotion) of this paper and paper [9] for each emotion with the results of the datasets generated based on the RAVDESS and EmoDB datasets.
Table 10 and Table 11 compare the emotion recognition accuracy of the proposed method in this paper with the results of paper [9]. This is a comparative analysis of how much higher or lower the emotion recognition performance of the proposed method is compared to paper [9].
The results show that for the same emotion, the proposed method is more accurate than the original study [9]. The proposed method and paper [9] have the same dataset augmented with a generative model, but paper [9] only imitates the original correct answer data and does not generate it perfectly. However, the proposed method differs from paper [9] in that the diffusion model trained with emotion and speech information generates a new mel-spectrogram in response to the user’s conditional input.
Also, the accuracy of misclassification in the proposed method is high in some cases, such as nervous–angry, which is one of the points to be improved in future research, but since the purpose of this paper is to augment good emotion data, we focused on accurate emotion classification, and the comparison shows that the proposed method performs better in augmenting and generating emotion data.
Finally, the learning completeness of a classification model is evaluated by precision, recall, F1 score, etc. Therefore, we objectively checked the degree of emotion improvement of the generated data through the classification model evaluation metrics. The evaluation was conducted on the emotion labels of the existing dataset and the generated dataset, and the amount of data in EmoDB and RAVDESS was adjusted appropriately [31].
Table 12 shows the classification model evaluation metrics between the generated dataset and the existing dataset.

6. Conclusions

In this study, we generated emotional speech data using diffusion models, which have recently gained attention, and conducted experiments to verify whether the generated data represent distinct emotions. RAVDESS and EmoDB datasets were used for the experiments. We extracted mel-spectrogram features from the emotional speech data and used them as input data for the diffusion model and implemented an encoder to convert the data into training data, including mel-spectrogram feature extraction and normalization, a diffusion model, and an emotion recognition model to evaluate the generated data and embed emotions in the data.
The diffusion model is a model that is currently prominent in the image field, which injects and extracts noise to generate data that the user wants. Therefore, in this paper, in addition to mel-spectrogram data with emotion embedding through the encoder, we used text containing the user’s requirements as a conditional input to the model to generate the desired data.
To evaluate the quality of the generated data, we judged the degree of emotion enhancement with the ResNet-based model used in the emotion embedding process. We compared the recognition accuracy for each emotion with WA and UA to see if the emotion attributes of the generated data became clearer, which can be helpful for emotion recognition and synthesis. We also checked the prediction accuracy of the generated data by label with the confusion matrix, and checked whether the emotion classification of the generated data was correct in terms of recall, precision, and F1 score, which are classification model evaluation metrics.
As AI advances, the most important issue is data-related. In order to create a well-performing AI model, you need to have good quality data. It is very difficult to collect good quality data, but this paper confirmed that the diffusion model is an effective method for building a high-performance model by generating data that is improved from the existing data. In future research, along with the improvement of the diffusion model, we will explore ways to improve the regions where the boundaries are blurred in certain emotions by utilizing more datasets, and explore more emotions and situations, and apply and test it in real-world applications to increase the naturalness of the generated data and the accuracy of emotion expression.
This research shows that voice data generation technology that can accurately express emotions can make human–machine interaction more natural and humanized. This can lead to applications in various industries such as education, entertainment, and virtual reality, as well as the development of emotional AI, and will inspire new forms of communication and content creation. Therefore, this paper makes an important contribution to the field of emotional speech data generation using diffusion models and is expected to further promote research and development in this field.

Author Contributions

Conceptualization, Y.-J.K. and S.-P.L.; methodology, Y.-J.K.; investigation, Y.-J.K.; writing—original draft preparation, Y.-J.K.; writing—review and editing, S.-P.L.; project administration, S.-P.L. All authors have read and agreed to the published version of the manuscript.

Funding

This work was supported by the 2024 Research Grant from SangMyung University (2024-A001-0123).

Data Availability Statement

Experiments used publicly available datasets.

Conflicts of Interest

The authors declare no conflicts of interest.

Abbreviations

The following abbreviations are used in this manuscript:
CNNConvolutional Neural Network
ResNetResidual Network
FFTFast Fourier Transform
SDEStochastic Differential Equation
DMDiffusion Model
DDPMDenoised Diffusion Probability Model
STFTShort Time Fourier Transform
WAWeighted accuracy
UAUnweighted accuracy

References

  1. Swain, M.; Routray, A.; Kabisatpathy, P. Databased, features and classifiers for speech emotion recognition: A review. Int. J. Speech Technol. 2018, 21, 93–120. [Google Scholar] [CrossRef]
  2. Lalitha, S.; Madhavan, A.; Bhushan, B.; Saketh, S. Speech emotion recognition. In Proceedings of the 2014 International Conference on Advances in Electronics Computers and Communications, Bangalore, India, 10–11 October 2014; pp. 1–4. [Google Scholar]
  3. Akcay, M.B.; Oguz, K. Speech emotion recognition: Emotional models, databases, features, preprocessing methods, supporting modalities, and classifiers. Speech Commun. 2020, 116, 56–76. [Google Scholar] [CrossRef]
  4. Koduru, A.; Valiveti, H.B.; Budati, A.K. Feature extraction algorithms to improve the speech emotion recognition rate. Int. J. Speech Technol. 2020, 23, 45–55. [Google Scholar] [CrossRef]
  5. Liu, Z.T.; Xie, Q.; Wu, X.; Cao, W.H.; Mei, Y.; Mao, J.W. Speech emotion recognition based on an improved brain emotion learning model. Neurocomputing 2018, 309, 145–156. [Google Scholar] [CrossRef]
  6. Abdilmohsin, H.A.; Wahab, H.B.A.; Hossen, A.M.J.A. A new proposed statistical feature extraction method in speech emotion recognition. Comput. Electr. Eng. 2021, 93, 107–172. [Google Scholar] [CrossRef]
  7. Saharia, C.; Chan, W.; Chang, H.; Lee, C.; Ho, J.; Salimans, T.; Fleet, D.; Norouzi, M. Palette: Image-to-image diffusion models. In ACM SIGGRAPH 2022 Conference Proceedings; Association for Computing Machinery: New York, NY, USA, 2022. [Google Scholar]
  8. Hwang, Y.; Cho, H.; Yang, H.; Won, D.O.; Oh, I.; Lee, S.W. Mel-spectrogram augmentation for sequence to sequence voice conversion. arXiv 2020, arXiv:2001.01401. [Google Scholar]
  9. Baek, J.Y.; Lee, S.P. Enhanced Speech Emotion Recognition Using DCGAN-Based Data Augmentation. Electronics 2023, 12, 3966. [Google Scholar] [CrossRef]
  10. Malik, I.; Latif, S.; Jurdak, R.; Schuller, B. A preliminary study on augmenting speech emotion recognition using a diffusion model. arXiv 2023, arXiv:2305.11413. [Google Scholar]
  11. Tang, H.; Zhang, X.; Wang, J.; Cheng, N.; Xiao, J. Emomix: Emotion mixing via diffusion models for emotional speech synthesis. arXiv 2023, arXiv:2306.00648. [Google Scholar]
  12. Li, T.; Hu, C.; Cong, J.; Zhu, X.; Li, J.; Tian, Q.; Wang, Y.; Xie, L. DiCLET-TTS: Diffusion model based cross-lingual emotion transfer for text-to-speech—A study between English and Mandarin. IEEE/ACM Trans. Audio Speech Lang. Process. 2023, 31, 3418–3430. [Google Scholar] [CrossRef]
  13. Prabhu, N.R.; Lay, B.; Welker, S.; Lehmann-Willenbrock, N.; Gerkmann, T. EMOCONV-DIFF: Diffusion-based Speech Emotion Conversion for Non-parallel and In-the-wild Data. arXiv 2023, arXiv:2309.07828. [Google Scholar]
  14. Popov, V.; Vovk, I.; Gogoryan, V.; Sadekova, T.; Kudinov, M. Grad-tts: A diffusion probabilistic model for text-to-speech. In Proceedings of the International Conference on Machine Learning, PMLR, Virtual, 13 December 2021; pp. 8599–8608. [Google Scholar]
  15. Song, Y.; Sohl-Dickstein, J.; Kingma, D.P.; Kumar, A.; Ermon, S.; Poole, B. Score-based generative modeling through stochastic differential equations. In Proceedings of the International Conference on Learning Representations, Vienna, Austria, 4 May 2021. [Google Scholar]
  16. Jonathan, H.; Jain, A.; Abbeel, P. Denoising diffusion probabilistic models. Adv. Neural Inf. Process. Syst. 2020, 33, 6840–6851. [Google Scholar]
  17. Baevski, A.; Zhou, Y.; Mohamed, A.; Auli, M. wav2vec 2.0: A framework for self-supervised learning of speech representations. Adv. Neural Inf. Process. Syst. 2020, 33, 12449–12460. [Google Scholar]
  18. Livingstone, S.R.; Russo, F.A. The Ryerson Audio-Visual Database of Emotional Speech and Song (RAVDESS): A dynamic, multimodal set of facial and vocal expressions in North American English. PLoS ONE 2018, 13, e0196391. [Google Scholar] [CrossRef] [PubMed]
  19. Logan, B. Mel frequency cepstral coefficients for music modeling. In Proceedings of the 1st International Symposium on Music Information Retrieval (ISMIR 2000), Plymouth, MA, USA, 23–25 October 2000; Volume 270. [Google Scholar]
  20. Yenigalla, P.; Kumar, A.; Tripathi, S.; Singh, C.; Kar, S.; Vepa, J. Speech Emotion Recognition Using Spectrogram & Phoneme Embedding. In Proceedings of the Interspeech 2018, Hyderabad, India, 2–6 September 2018; Volume 2018. [Google Scholar]
  21. Jogin, M.; Madhulika, M.S.; Divya, G.D.; Meghana, R.K.; Apoorva, S. Feature extraction using convolution neural networks (CNN) and deep learning. In Proceedings of the 2018 3rd IEEE International Conference on Recent Trends in Electronics, Information & Communication Technology (RTEICT), Bangalorem, India, 18–19 May 2018; IEEE: New York, NY, USA, 2018. [Google Scholar]
  22. Lu, Y.J.; Wang, Z.Q.; Watanabe, S.; Richard, A.; Yu, C.; Tsao, Y. Conditional diffusion probabilistic model for speech enhancement. In Proceedings of the ICASSP 2022-2022 IEEE International Conference on Acoustics, Speech and Signal Processing (ICASSP), Virtual, 7–13 May 2022; IEEE: New York, NY, USA, 2022. [Google Scholar]
  23. Griffin, D.; Lim, J. Signal estimation from modified short-time Fourier transform. IEEE Trans. Acoust. Speech Signal Process. 1984, 32, 236–243. [Google Scholar] [CrossRef]
  24. Patro, S.G.K.; Sahu, K.K. Normalization: A preprocessing stage. arXiv 2015, arXiv:1503.06462. [Google Scholar] [CrossRef]
  25. Kang, M.; Han, W.; Hwang, S.J.; Yang, E. ZET-Speech: Zero-shot adaptive Emotion-controllable Text-to-Speech Synthesis with Diffusion and Style-based Models. arXiv 2023, arXiv:2305.13831. [Google Scholar]
  26. Zhang, Z.; Sabuncu, M. Generalized cross entropy loss for training deep neural networks with noisy labels. In Proceedings of the Advances in Neural Information Processing Systems, Montréal, QC, Canada, 3–8 December 2018; Volume 31. [Google Scholar]
  27. Kingma, D.P.; Ba, J. Adam: A method for stochastic optimization. arXiv 2014, arXiv:1412.6980. [Google Scholar]
  28. Luque, A.; Carrasco, A.; Martín, A.; de Las Heras, A. The impact of class imbalance in classification performance metrics based on the binary confusion matrix. Pattern Recognit. 2019, 91, 216–231. [Google Scholar] [CrossRef]
  29. Popov, V.; Vovk, I.; Gogoryan, V.; Sadekova, T.; Kudinov, M.; Wei, J. Diffusion-based voice conversion with fast maximum likelihood sampling scheme. arXiv 2021, arXiv:2109.13821. [Google Scholar]
  30. Parry, J.; Palaz, D.; Clarke, G.; Lecomte, P.; Mead, R.; Berger, M.; Hofer, G. Analysis of Deep Learning Architectures for Cross-Corpus Speech Emotion Recognition. In Proceedings of the Interspeech 2019, Graz, Austria, 15–19 September 2019. [Google Scholar]
  31. Axman, D.; Yacouby, R. Probabilistic extension of precision, recall, and F1 score for more thorough evaluation of classification models. In Proceedings of the First Workshop on Evaluation and Comparison of NLP Systems; Association for Computational Linguistics: Toronto, ON, Canada, 2020. [Google Scholar]
Figure 1. Confusion matrix for our proposed emotion recognition model.
Electronics 13 01314 g001
Figure 2. Diffusion model structure for emotional speech generation.
Electronics 13 01314 g002
Figure 3. Mel-spectrograms improved with diffusion models. (a) Original mel-spectrogram of angry emotion speech data, (b) improved mel-spectrogram of angry emotion with diffusion model.
Electronics 13 01314 g003
Table 1. The count of datasets per emotion.
EmotionsEmoDBRAVDESS
Neutrality7996
Angry127192
Sadness62192
Fear69192
Happy71192
Disgust46192
Total4541056
Table 2. Emotion data information.
EmotionsNumber of ExperimentersData Time LengthSampling Rate
EmoDB5 males, 5 females10 s22,025 Hz
RAVDESS12 males, 12 females10 s22,025 Hz
Table 3. Experiment settings of emotion recognition models for emotion embedding.
Experiment SettingsValue
LabelAnger, Sadness, Happiness, Neutral, Fear, Disgust
OptimizerAdam
Learning rate1 × 10−4
Loss functionCrossEntropyLoss
Epoch800
Table 4. Diffusion model architecture for emotional speech generation.
Block (Layers)Input DimensionStrideOutput Dimension
Diffusion Initial input(32, 80, 861)-(32, 256, 861)
ResNet block(32, 256, 861)1(32, 256, 861)
Downsample(32, 256, 861)2(32, 512, 430)
ResNet block(32, 512, 430)1(32, 1024, 215)
Upsample(32, 1024, 215)2(32, 512, 430)
ResNet block(32, 512, 430)1(32, 256, 861)
Final Conv2d(32, 256, 861)1(32, 1, 861)
Table 5. Contrast of WA and UA between original data and generated data.
DatasetWAUA
EmoDB82.1%81.7%
Generated data94.3%91.6%
RAVDESS67.7%65.1%
Generated data77.8%79.7%
Table 6. Confusion matrix for the RAVDESS dataset.
Predict
NeutralityHappinessSadnessAngerFearDisgust
TrueNeutrality82.1%7%%4.7%3.5%3.3%2.1%
Happiness9.8%72.4%0%8.8%0.3%0.3%
Sadness1.1%0.4%87.2%0.4%9.2%7.9%
Anger0.3%8.1%1.7%81.9%5.4%10%
Fear4.2%8.6%5.6%3.6%77.5%5%
Disgust2.5%3.5%0.8%1.8%4.3%74.7%
Table 7. Confusion matrix for the RAVDESS dataset and generated dataset.
Predict
NeutralityHappinessSadnessAngerFearDisgust
TrueNeutrality86.6%0.8%2.4%0%0.5%1.2%
Happiness4.4%83.4%0.7%5.1%0.3%0%
Sadness1.0%0.4%88.9%0.1%8.7%4.2%
Anger0.3%7.2%0.8%84.1%6.7%7.5%
Fear3.1%3%3.4%4.3%79.2%2.8%
Disgust0.7%3.5%0.4%3.7%3.6%81.7%
Table 8. Confusion matrix for the EmoDB dataset.
Predict
NeutralityHappinessSadnessAngerFearDisgust
TrueNeutrality96.9%8.4%5.6%2.5%0%0%
Happiness0.4%78.8%2.1%4%3.1%0%
Sadness1.1%0.8%91.4%0%8.5%0.4%
Anger0.2%4.3%0%95.1%0%0%
Fear0%0%8.7%0.1%84.2%0.3%
Disgust0%0%4.3%0%6.6%74.9%
Table 9. Confusion matrix for the EmoDB dataset and generated dataset.
Predict
NeutralityHappinessSadnessAngerFearDisgust
TrueNeutrality100%0%2.9%0%0%0%
Happiness0%87.3%0%4.5%0%0%
Sadness0%0%95.6%0.1%0%0%
Anger0%2.5%0%95.1%0%0%
Fear0%0%3.6%0%92.5%2.4%
Disgust0%0%0%1.4%4.1%86.6%
Table 10. Comparing the accuracy of emotion recognition methods using EmoDB-based augmented datasets.
Differences in
Recognition Accuracy
Proposed Method
NeutralityHappinessSadnessAngerFearDisgust
Baek, Ji-Young
et al. [9]
Neutrality0%p0%p2.9%p0%p0%p0%p
Happiness0%p5.5%p0%p−13.7%p0%p0%p
Sadness0%p0%p6.7%p0.1%p−11.1%p0%p
Anger0%p−2.8%p0%p0.4%p0%p0%p
Fear0%p0%p−5.4%p0%p1.6%p2.4%p
Disgust0%p0%p−14.3%p1.4%p4.1%p0.9%p
Table 11. Comparing the accuracy of emotion recognition methods using RAVDESS-based augmented datasets.
Differences in
Recognition Accuracy
Proposed Method
NeutralityHappinessSadnessAngerFearDisgust
Baek, Ji-Young
et al. [9]
Neutrality15.2%p0.8%p−14.8%p−7.1%p−6.6%p−13.1%p
Happiness−2.5%p31.7%p−16.5%p−5.2%p−6.6%p−6.9%p
Sadness−2.4%p−3%p6.1%p0.1%p1.8%p0.8%p
Anger0.3%p−3.1%p0.8%p1.3%p−0.2%p0.6%p
Fear−3.8%p3.1%p−13.8%p0.9%p13.7%p−4.1%p
Disgust0.7%p−3.4%p−13.4%p3.7%p3.6%p2.4%p
Table 12. Emotion classification model evaluation metrics.
EmoDB, Generated DataRAVDESS, Generated Data
Accuracy0.98310.8436
Precision0.98340.8511
Recall0.98310.8436
F1 score0.98310.8437
Disclaimer/Publisher’s Note: The statements, opinions and data contained in all publications are solely those of the individual author(s) and contributor(s) and not of MDPI and/or the editor(s). MDPI and/or the editor(s) disclaim responsibility for any injury to people or property resulting from any ideas, methods, instructions or products referred to in the content.

