Article

An Image Retrieval Method for Lunar Complex Craters Integrating Visual and Depth Features

1
School of Land Science and Technology, China University of Geosciences, Beijing 100083, China
2
Subcenter of International Cooperation and Research on Lunar and Planetary Exploration, Center of Space Exploration, Ministry of Education of the People’s Republic of China, Beijing 100083, China
*
Author to whom correspondence should be addressed.
Electronics 2024, 13(7), 1262; https://doi.org/10.3390/electronics13071262
Submission received: 4 March 2024 / Revised: 26 March 2024 / Accepted: 28 March 2024 / Published: 28 March 2024

Abstract

:
In the geological research of the Moon and other celestial bodies, the identification and analysis of impact craters are crucial for understanding the geological history of these bodies. With the rapid increase in the volume of high-resolution imagery data returned from exploration missions, traditional image retrieval methods face dual challenges of efficiency and accuracy when processing lunar complex crater image data. Deep learning techniques offer a potential solution. This paper proposes an image retrieval model for lunar complex craters that integrates visual and depth features ( LC 2 R - Net ) to overcome these difficulties. For depth feature extraction, we employ the Swin Transformer as the core architecture for feature extraction and enhance the recognition capability for key crater features by integrating the Convolutional Block Attention Module with Effective Channel Attention (CBAMwithECA). Furthermore, a triplet loss function is introduced to generate highly discriminative image embeddings, further optimizing the embedding space for similarity retrieval. In terms of visual feature extraction, we utilize Local Binary Patterns (LBP) and Hu moments to extract the texture and shape features of crater images. By performing a weighted fusion of these features and utilizing Principal Component Analysis (PCA) for dimensionality reduction, we effectively combine visual and depth features and optimize retrieval efficiency. Finally, cosine similarity is used to calculate the similarity between query images and images in the database, returning the most similar images as retrieval results. Validation experiments conducted on the lunar complex impact crater dataset constructed in this article demonstrate that LC 2 R - Net achieves a retrieval precision of 83.75%, showcasing superior efficiency. These experimental results confirm the advantages of LC 2 R - Net in handling the task of lunar complex impact crater image retrieval.

1. Introduction

Impact craters on the lunar surface are significant witnesses to the history of the Solar System. Their size, shape, and distribution provide key insights into understanding the geological history of the Moon and other celestial bodies [1,2,3,4]. With the advancement of space exploration technology, we are now able to obtain high-resolution imagery of the lunar surface. Over the past few decades, lunar exploration projects such as NASA’s Apollo program, the Lunar Reconnaissance Orbiter, and China’s Chang’e program have accumulated a vast amount of lunar data, which have been used for in-depth studies [5,6,7,8,9]. These images contain rich information, such as the morphology, structure, and geological features of impact craters, as well as the distribution of rocks related to impact events. However, this also presents a challenge: how to effectively retrieve and analyze the vast amount of crater imagery data [10]. Content-based image retrieval (CBIR) technology may be an effective solution to this problem.
Content-based image retrieval systems have a wide range of applications in lunar and planetary science research. Traditional CBIR methods typically rely on the visual content of images, such as texture, shape, and color features, to index and retrieve images. These methods depend on handcrafted features such as Speeded Up Robust Features (SURF) [11], Hu moments, and Gabor features [12]. Although these features are effective in certain scenarios, their application is limited in the complex lunar environment, where they struggle to capture detailed information within images effectively. Moreover, these methods often require meticulous feature engineering and parameter tuning, which is not only time-consuming but also limits their generalization ability and scalability. With the rise of deep learning technologies, particularly the successful application of Convolutional Neural Networks (CNNs) in remote sensing image recognition and classification tasks [13,14,15], researchers have begun to explore the use of deep features to enhance the performance of CBIR systems.
The successful application of deep learning methods in the field of remote sensing image retrieval has demonstrated their significant advantages over traditional manual feature methods [16,17,18]. Deep learning models are capable of automatically extracting abstract feature representations from images by learning from large-scale datasets. These deep features can better capture the semantic information and contextual relationships within images, thus enhancing the accuracy and robustness of CBIR systems. Given the complexity of remote sensing image description, some scholars have begun to explore strategies for feature fusion. Yan et al. have found through research that CNN features and SIFT features are highly complementary and can significantly improve the performance of image retrieval tasks [19]. Cheng et al. have proposed a distributed retrieval system architecture suitable for high-resolution satellite images by combining deep features with traditional manual features [20]. Their work indicates that the combination of deep features and traditional manual features can provide a more comprehensive image representation method. Although these methods have achieved commendable results, these models generally use the cross-entropy loss function during training, which has certain limitations in image retrieval tasks. In image retrieval tasks, we are more concerned with the similarity between images rather than just the accuracy of categories. This means that models need to be able to not only identify the categories of images but also capture the subtle differences within categories and the significant distinctions between categories. To this end, deep metric learning has become a key technology for addressing such problems.
Deep metric learning integrates the advantages of deep learning and metric learning. This approach automatically extracts image features through deep learning models and optimizes the distances between features through metric learning, making the distances in feature space closer for similar images while expanding the distances between dissimilar images. Deep metric learning has shown significant effectiveness in multiple applications in the field of remote sensing, including image retrieval [21,22,23,24,25], image classification [26,27], and object recognition [28,29], etc. However, the task of image retrieval for lunar impact craters demands more complex and meticulous feature extraction requirements, and these models do not always effectively capture all the key features of the craters. In this context, the Swin Transformer, as a novel deep learning architecture [30], has demonstrated its powerful performance in various visual tasks, which has inspired us to utilize this technology to address the challenges of lunar impact crater image retrieval.
The Swin Transformer is a neural network architecture based on the Transformer, widely applied as an efficient feature extractor in computer vision tasks [31,32,33,34,35]. Compared to traditional CNNs, the Swin Transformer not only effectively models global contextual information but also captures features at different scales through its hierarchical structure, which is crucial for understanding complex scenes and relationships within images. Inspired by this, we propose a lunar complex crater image retrieval model ( LC 2 R - Net ) that fuses visual and depth features. We employ the Swin Transformer as the core architecture for depth feature extraction and integrate LBP and Hu moments for visual feature extraction. Moreover, to evaluate the effectiveness of our method, we have constructed a lunar crater image retrieval dataset and conducted extensive experiments. Our main contributions are as follows:
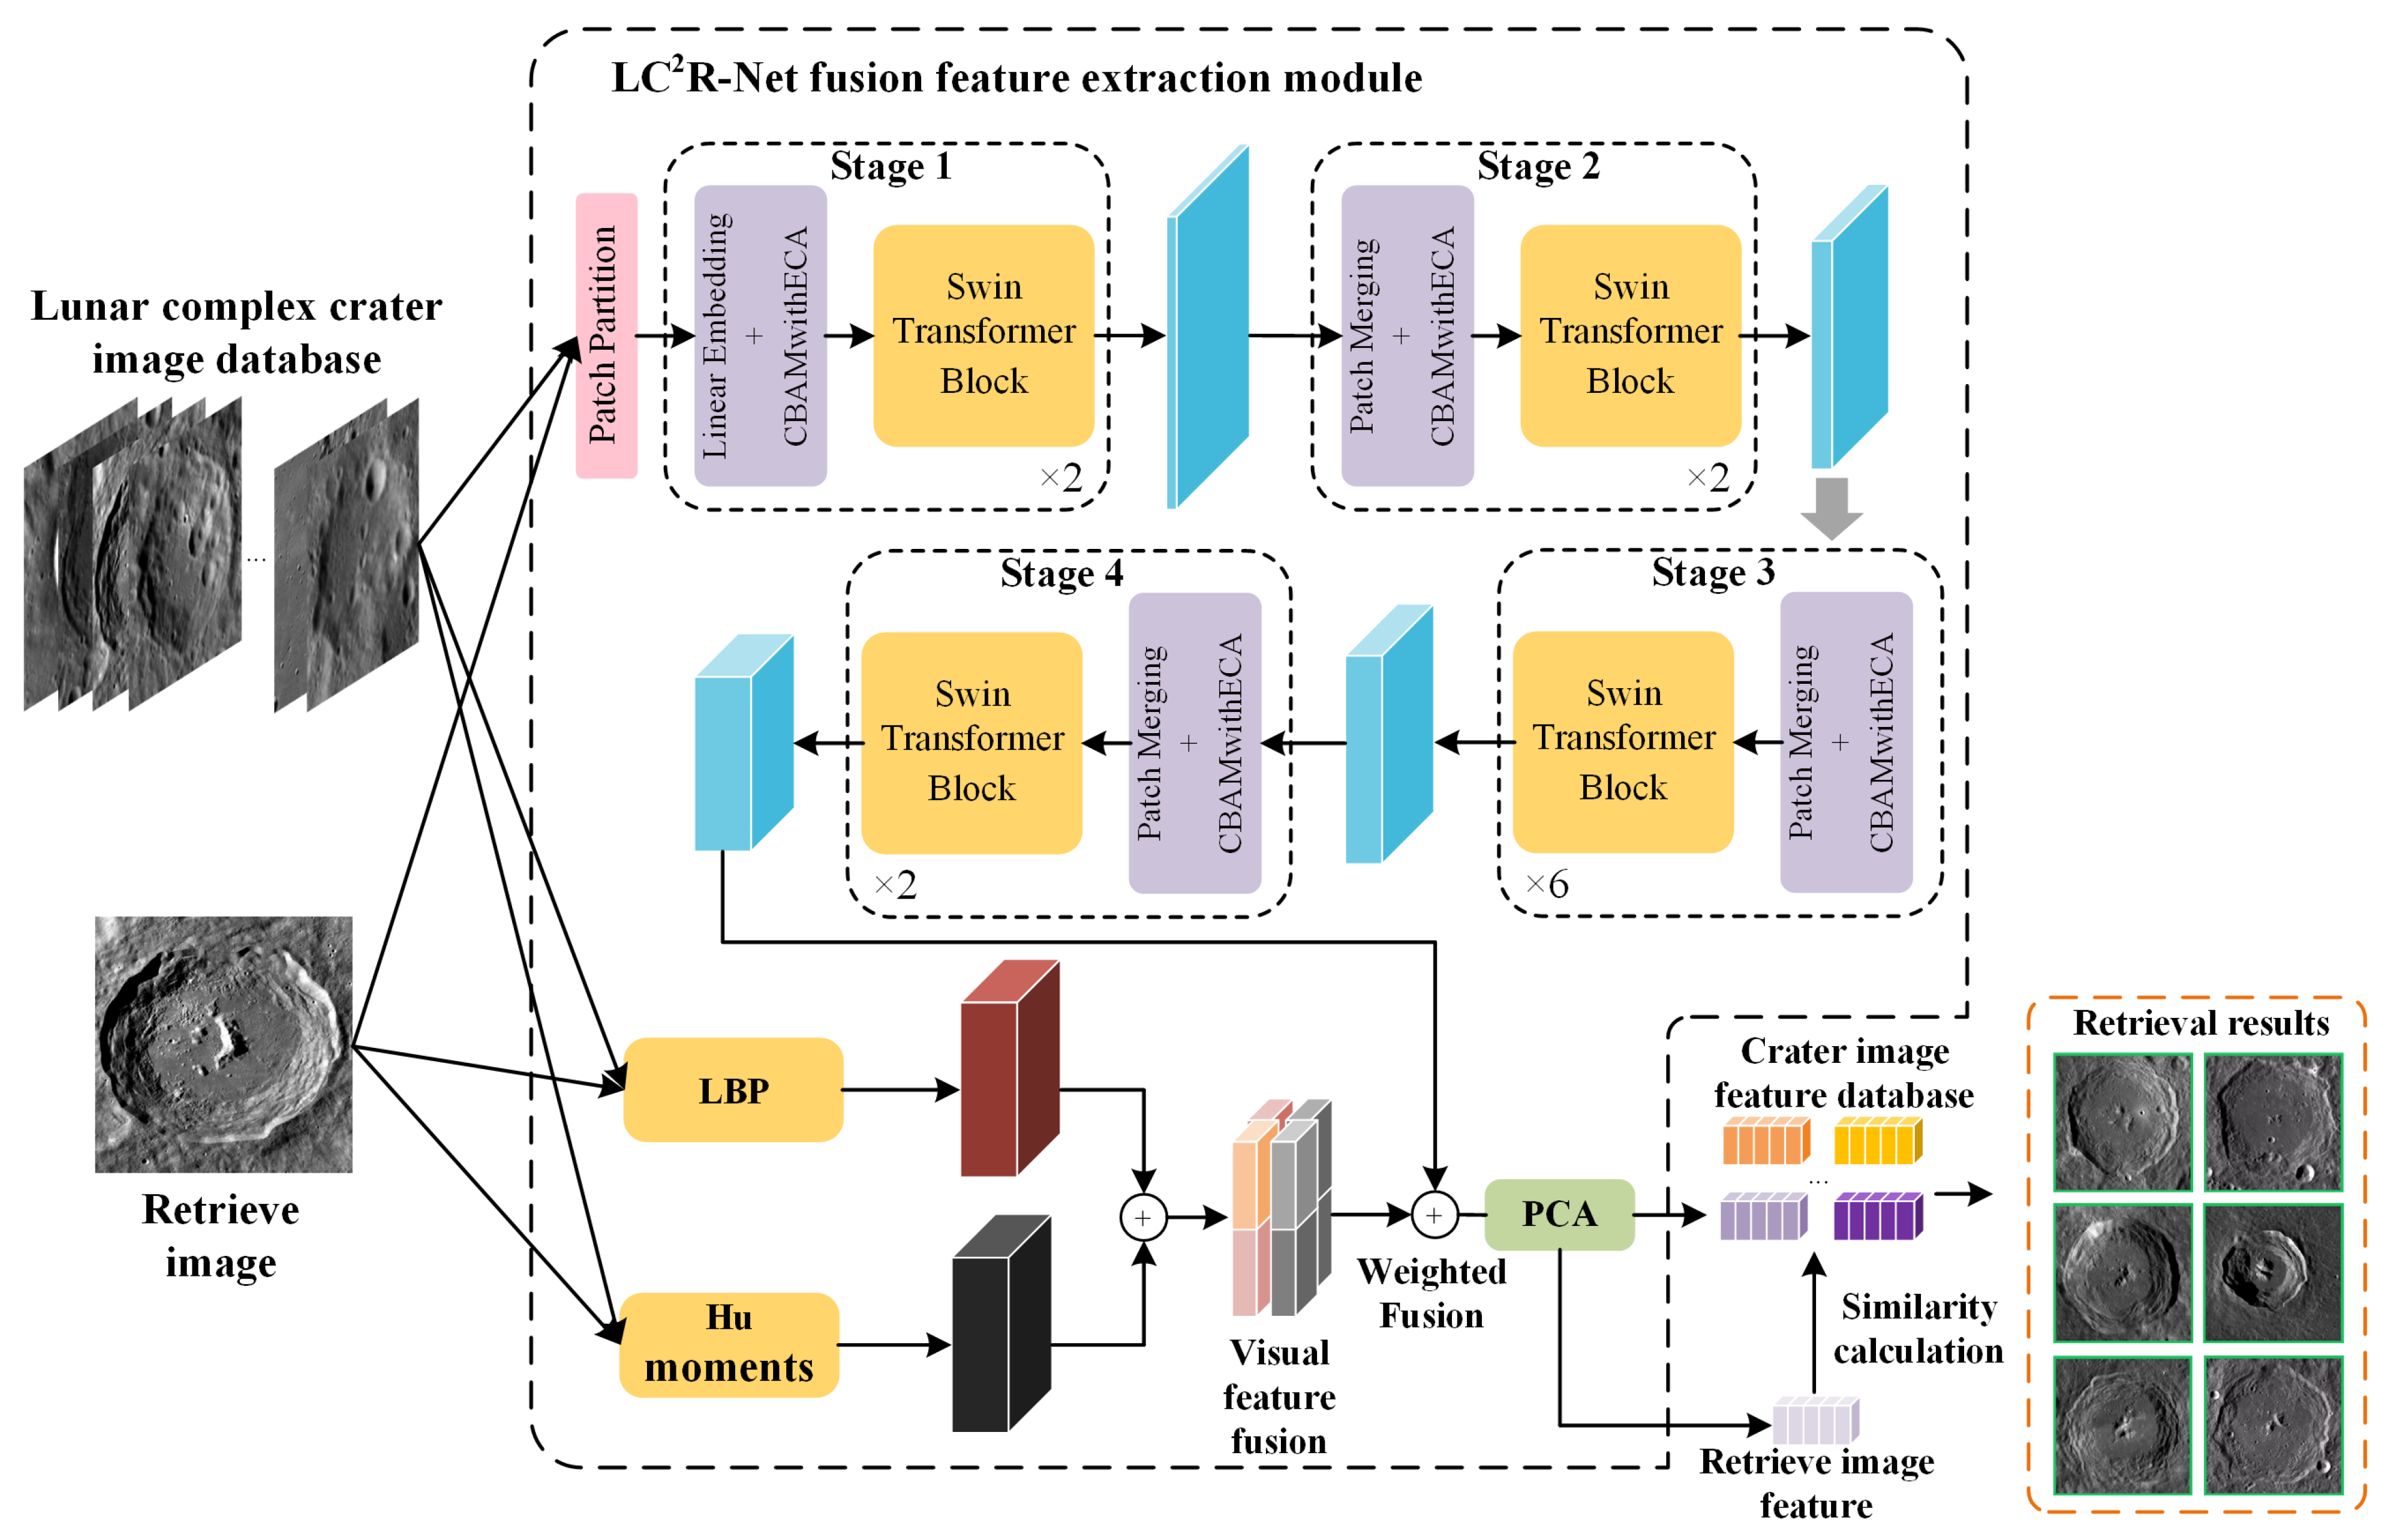
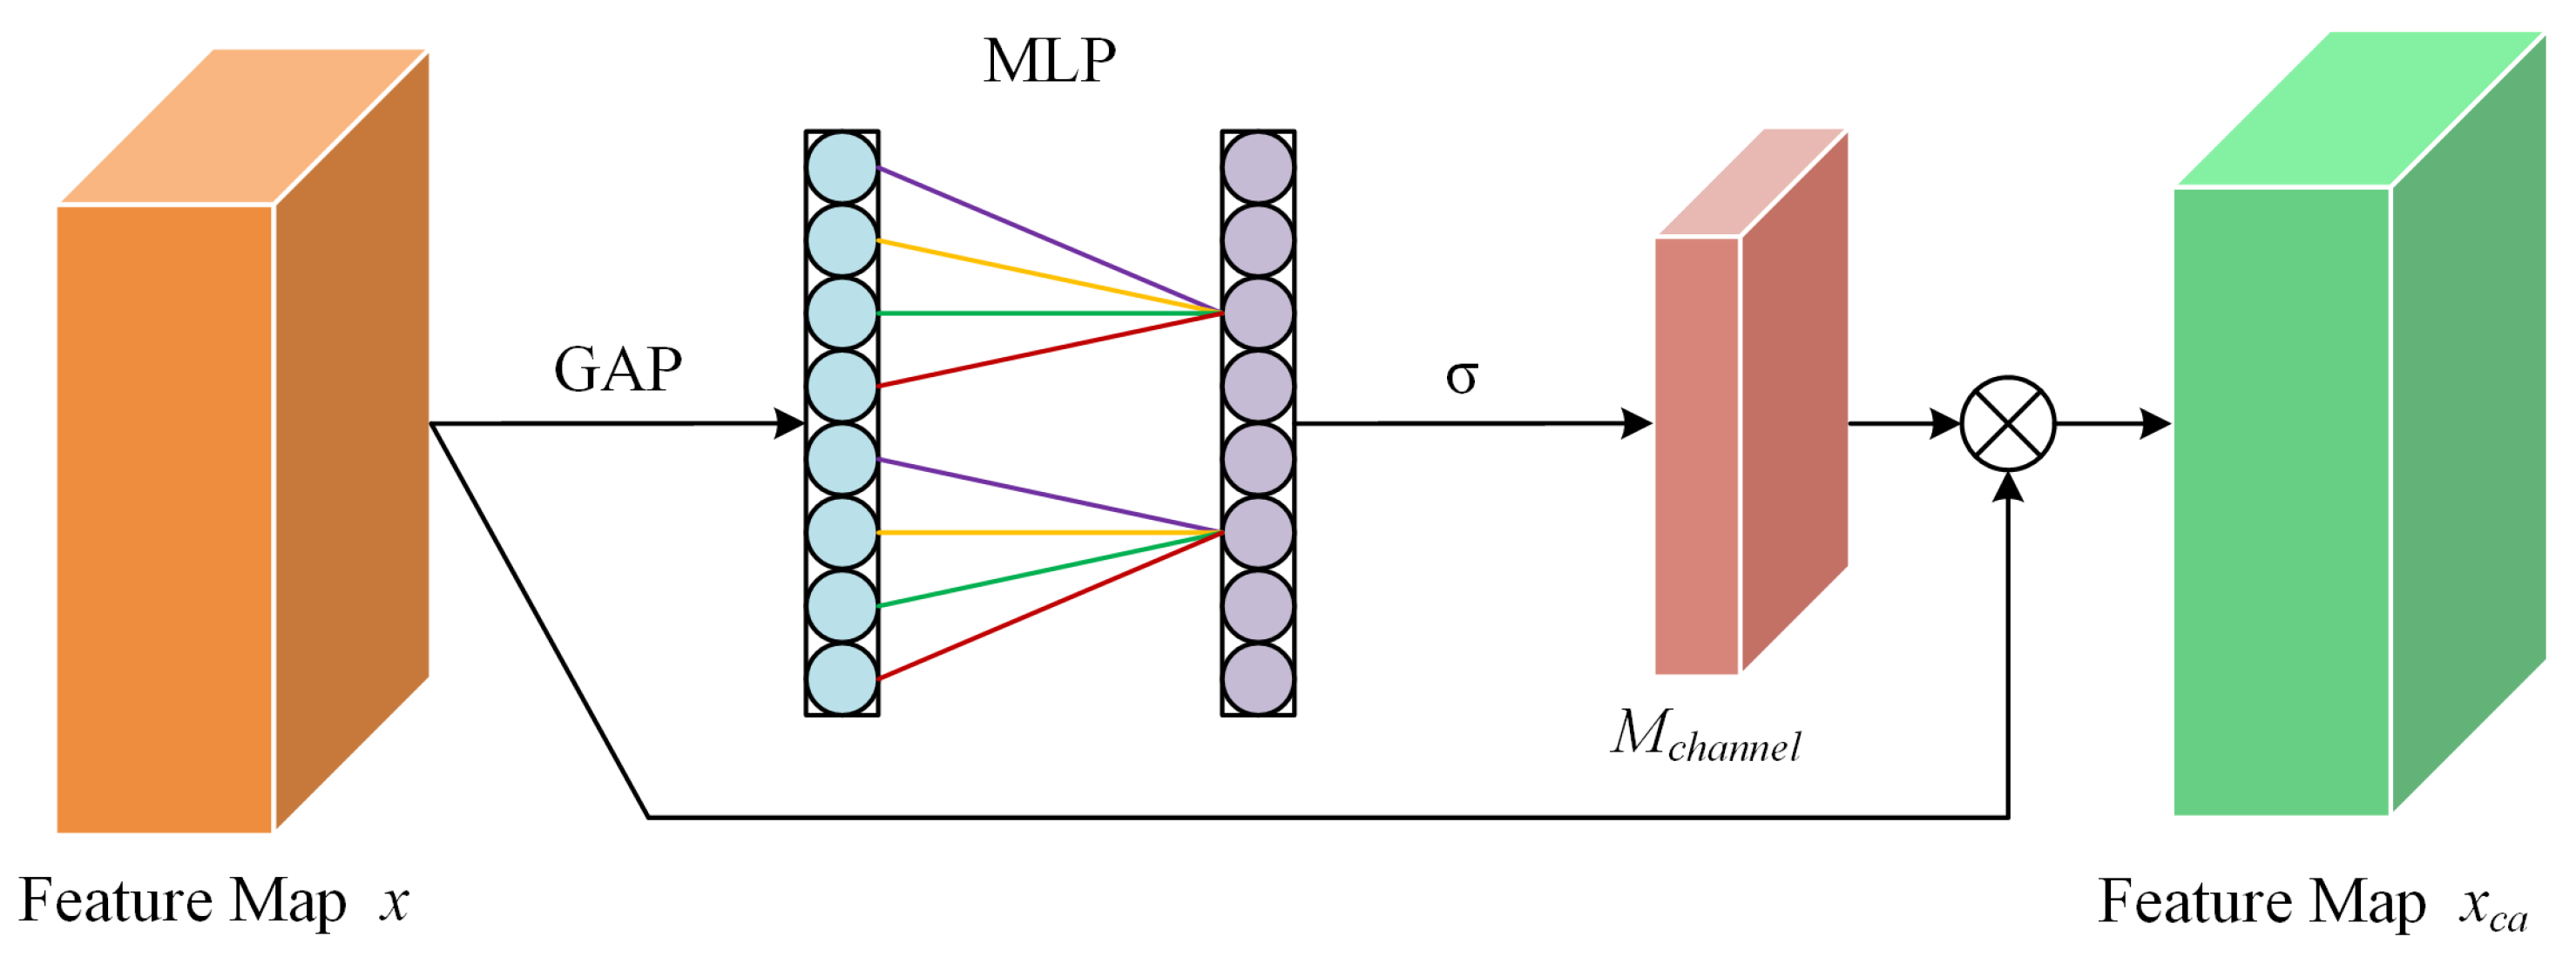
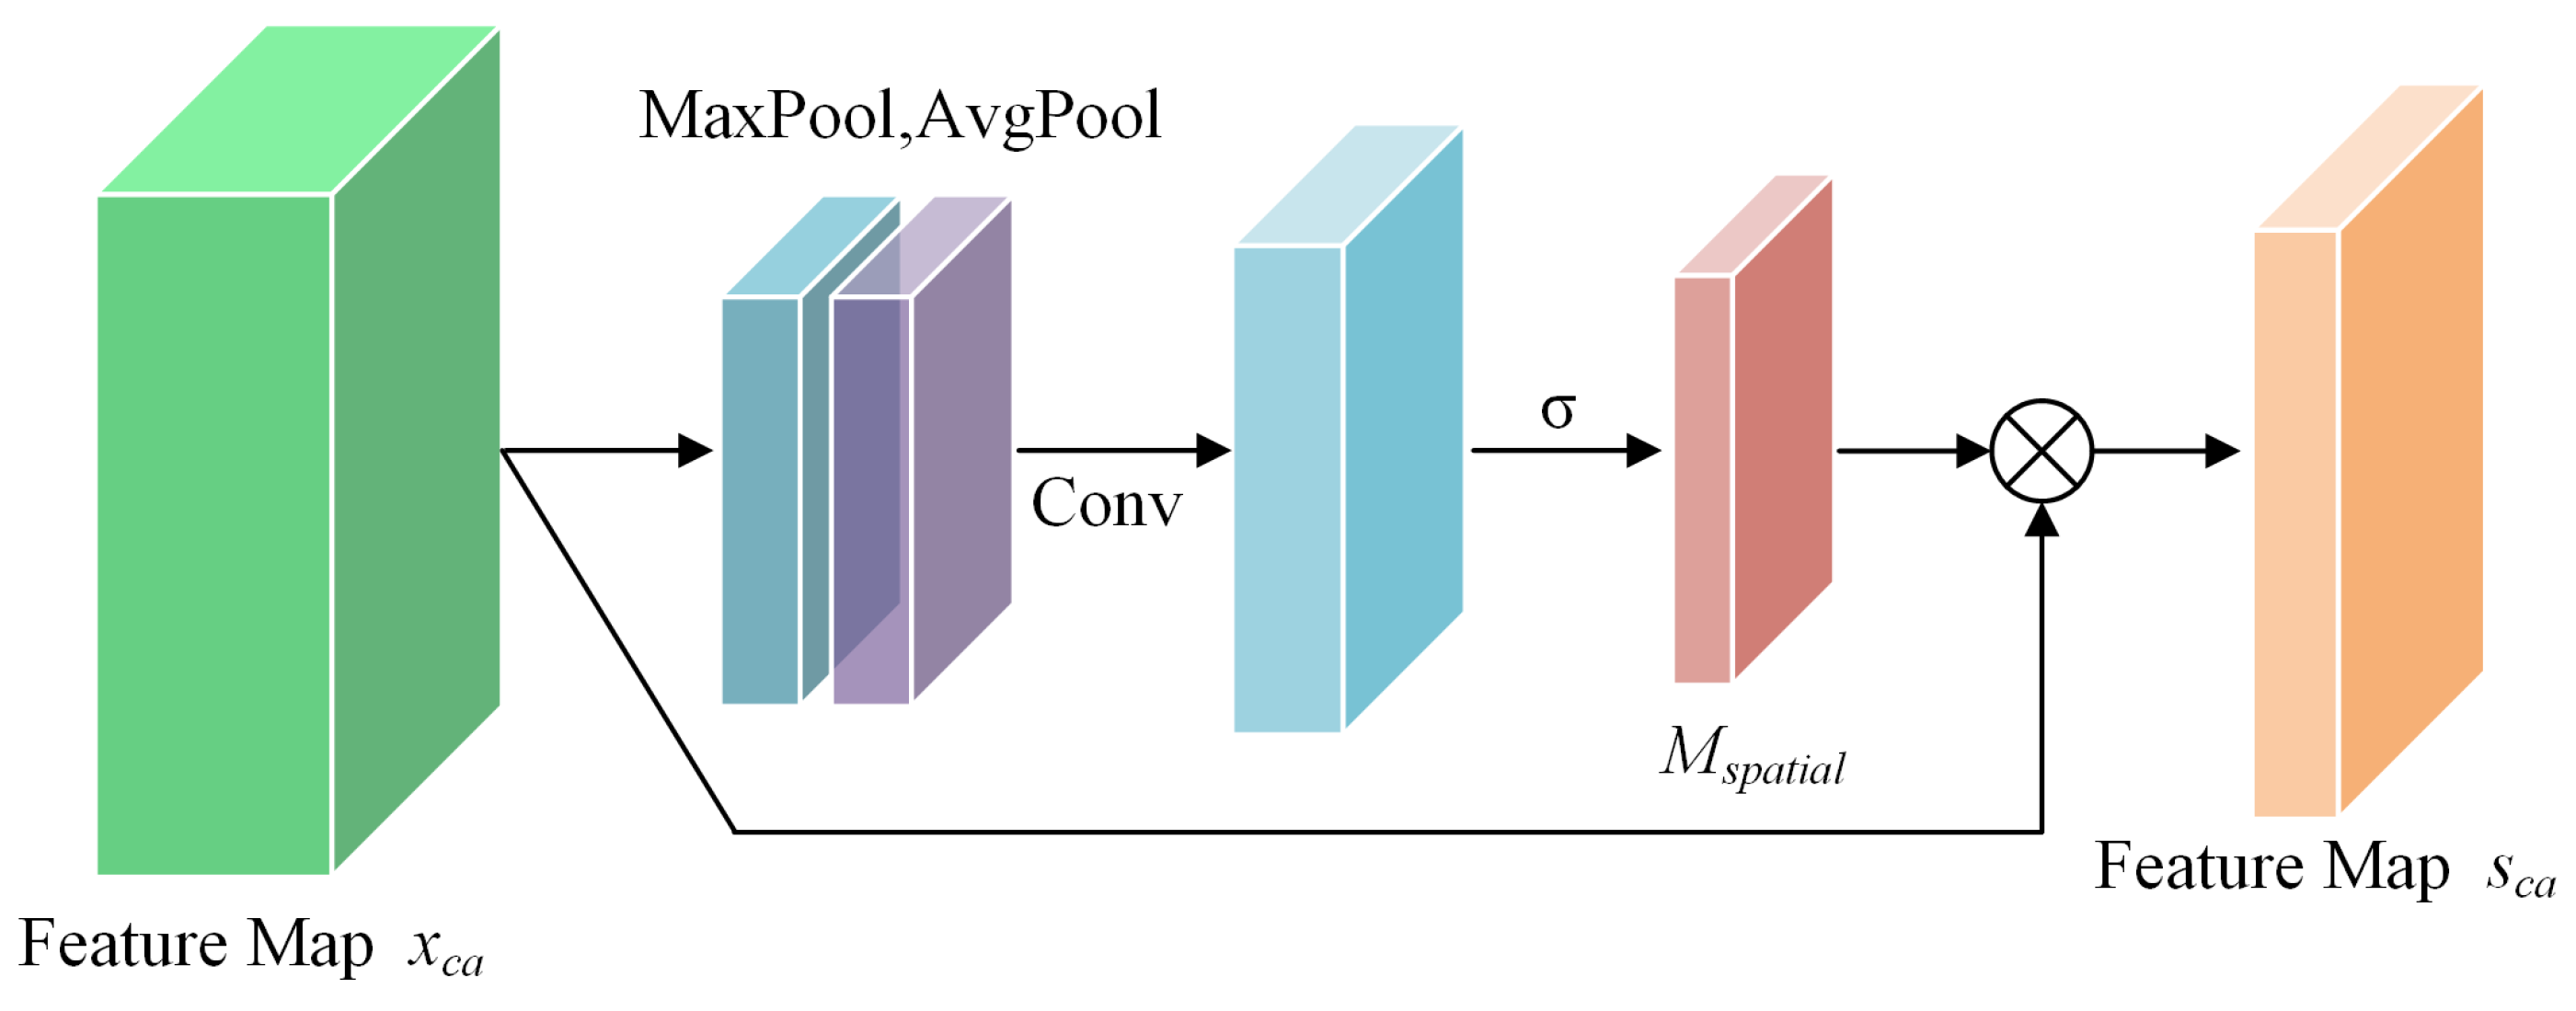
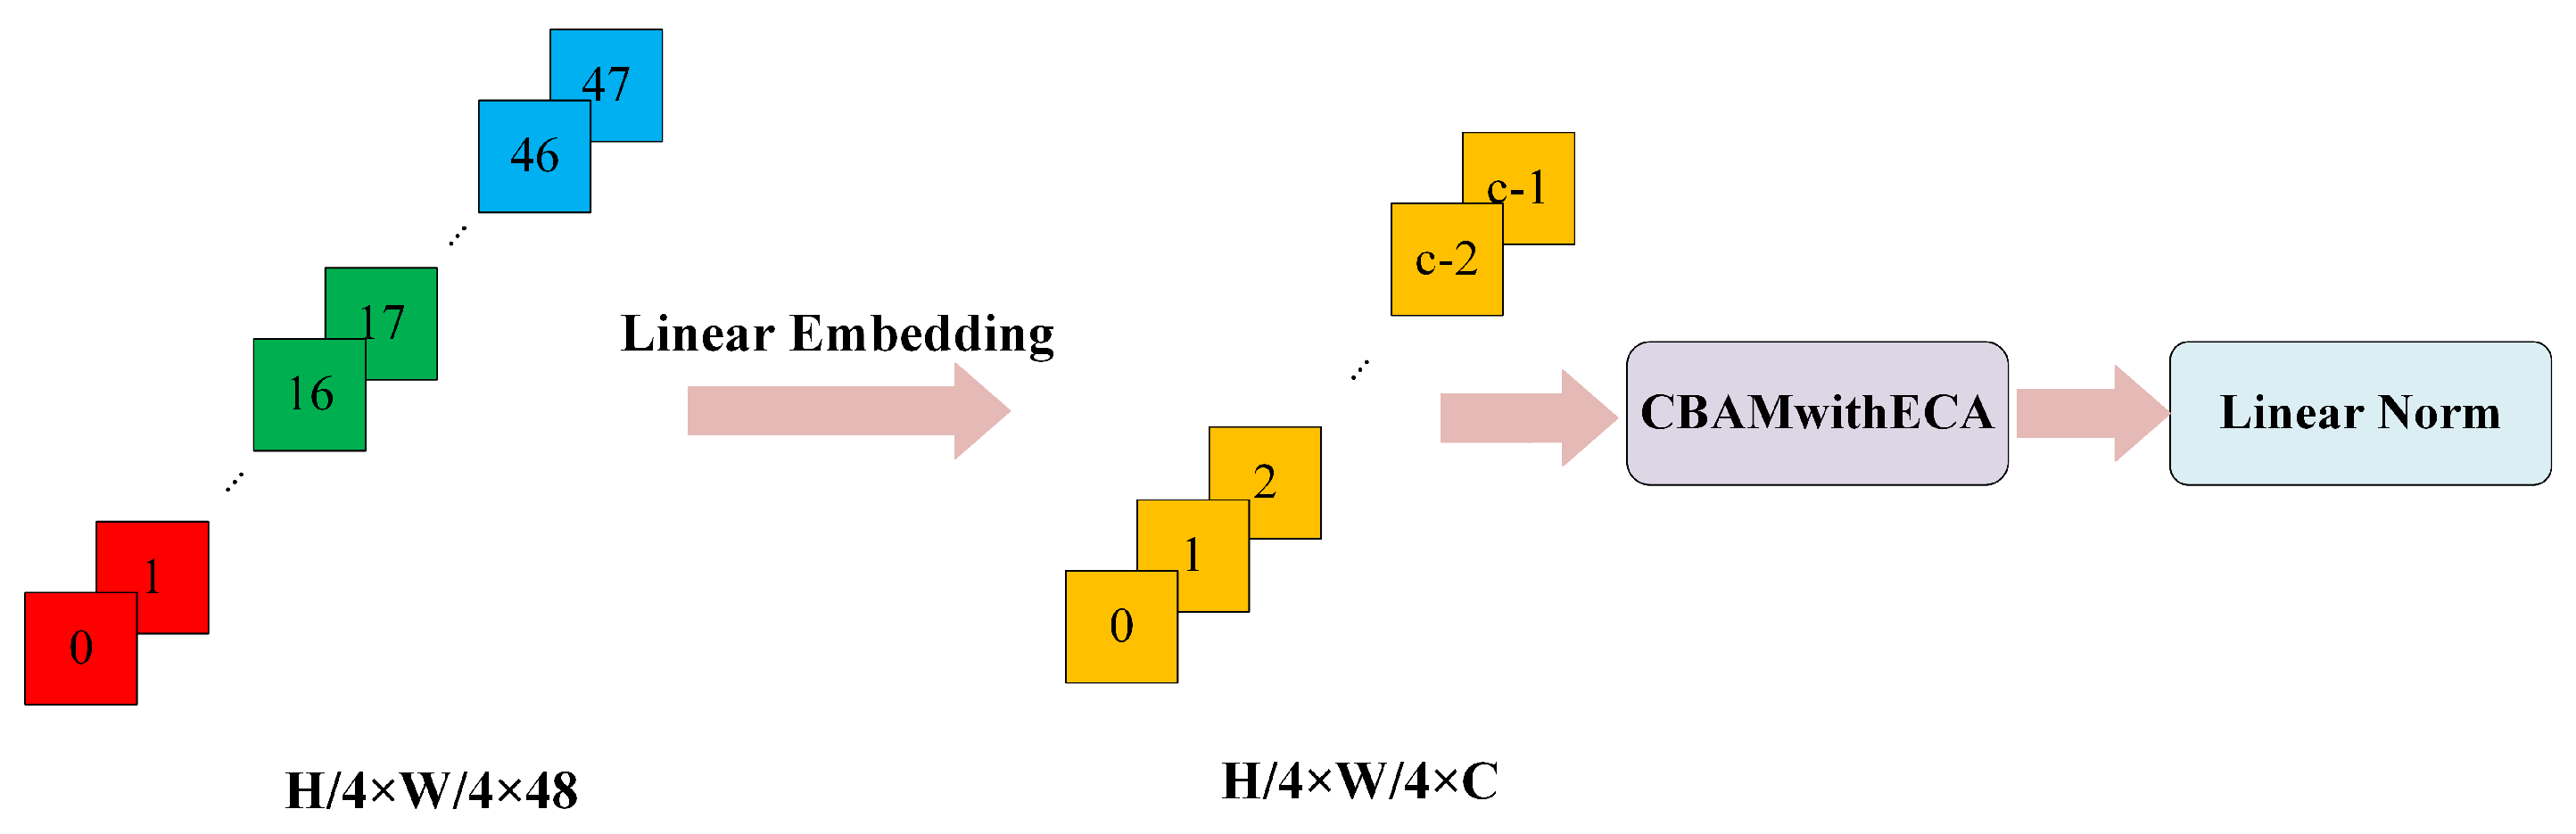
  • The Swin Transformer is utilized as the feature extraction structure, and the CBAMwithECA module is integrated into the linear embedding and patch merging modules. Through the attention mechanism, the channel and spatial relevance of features are enhanced, allowing for a comprehensive capture of the details and structural information within images. This enhancement improves the model’s capability to recognize and extract image features. It directs the model’s focus toward the global context, elevating the perceptibility of key features while concurrently suppressing less important features and noise information.
  • By integrating visual features (texture features, shape features) with deep features, we balance the contribution of different features through a weighted approach, emphasizing important features during the fusion process. Furthermore, we apply PCA to condense the dimensionality of the integrated feature set. This process not only trims down the number of feature dimensions but also amplifies the retrieval process’s swiftness and effectiveness.
  • Within the network’s training framework, we integrate a triplet loss function coupled with a strategy for mining difficult negative examples. This approach is designed to prompt the network to cultivate features with greater discrimination. By utilizing triplet loss, we optimize the embedded space, ensuring that vectors of akin images are positioned in closer proximity, whereas those of non-akin images are segregated, thereby markedly boosting the precision of our retrieval system.
The structure of this document is laid out in the following manner: Section 2 introduces the work related to content-based image retrieval. Section 3 delineates the method we propose. Section 4 details the dataset used for the retrieval of complex impact crater images on the lunar surface. Section 5 is dedicated to an in-depth presentation of experimental outcomes and their subsequent analysis. Finally, Section 6 summarizes the findings and conclusions of this study.
The related codes are publicly available at https://github.com/ZYNHYF/lunar-complex-crater-image-retrieval (released on 27 March 2024).

2. Related Works

In this section, we provide a detailed overview of prior research work related to content-based image retrieval. We categorize these studies into three groups: methods based on traditional features, methods based on deep features, and methods based on metric learning.

2.1. Methods Based on Traditional Features

Early CBIR systems primarily relied on traditional image processing techniques to extract features, such as color histograms, texture features, and shape descriptors. The advantages of these methods lie in their computational simplicity and intuitive understanding, and they have been extensively studied by scholars. Tekeste et al. conducted a comparative study to explore the impact of different LBP variants on the results of remote sensing image retrieval [36]. Aptoula applied global morphological texture descriptors to remote sensing image retrieval and, despite the shorter length of the extracted feature vectors, achieved high retrieval scores [37]. Xie et al. proposed an image retrieval method that combines a dominant color descriptor with Hu moments, leveraging the advantages of color and shape detection [38]. Chen et al. introduced a feature descriptor based on the relationships between prominent craters on the lunar surface and a composite feature model composed of different features. Based on these characteristics, similarity measurement rules and a retrieval algorithm were proposed and detailed [39]. Hua et al. utilized a general saliency-based landmark detection algorithm to identify regions of interest on the lunar surface, then indexed and retrieved them using feature vectors extracted from the region-of-interest images, evaluating the performance of saliency-based landmark detection [12]. However, these methods also have apparent limitations; they perform well under specific conditions, particularly when the image content structure is simple and changes little. Nevertheless, they often fail to effectively handle high-level semantic information and have limited robustness in complex scenes.

2.2. Methods Based on Deep Features

With the advancement of deep learning technology, methods based on Convolutional Neural Networks have become a research hotspot in the field of Content-Based Image Retrieval. These methods automatically extract deep representations of image content by learning multi-level abstract features. Compared to handcrafted features, deep features are better at capturing the complex patterns and high-level semantic information in images. Wang et al. designed a Multi-Attention Fusion Network with dilated convolution and label smoothing capabilities, using label smoothing to replace the cross-entropy loss function, which yielded competitive retrieval results [40]. Ye et al. proposed a query-adaptive feature fusion method based on a CNN regression model, which can accurately predict the DCG values of the ranked image list to assign weights to each feature, thereby enhancing retrieval precision [41]. Wang et al. introduced a novel Wide Context Attention Network (W-CAN), utilizing two attention modules to adaptively learn relevant local features in spatial and channel dimensions, thus obtaining discriminative features with extensive contextual information [42]. Chaudhuri et al. designed a GCN-based Context Attention Network, including node and edge attention. Beyond highlighting the fundamental features within each node, edge attention enables the network to learn the most critical neighborhood structures from the RAG within each target class image [43]. Furthermore, methods based on deep features can also leverage transfer learning to adapt these pre-trained models to specific domains or datasets [40], further improving retrieval performance.

2.3. Methods Based on Metric Learning

Metric learning methods aim to learn an optimized distance metric such that similar images are closer in the feature space while dissimilar images are farther apart. These methods are often combined with deep learning, adjusting the feature space through the loss function during training. Zhang et al. constructed a Triplet Non-Local Neural Network (T-NLNN) model that combines deep metric learning with non-local operations, significantly improving the performance of high-resolution remote sensing image retrieval [21]. Cao et al. proposed a method based on a triplet deep metric learning network to enhance the retrieval performance of remote sensing images [22]. Zhong et al. introduced an L2-normed attention and multi-scale fusion network (L2AMF-Net) to achieve accurate and robust lunar image patch matching [44]. Additionally, some scholars focus on constructing new loss functions to enhance retrieval performance. Fan et al. proposed a ranking loss result, thereby building a global optimization model based on feature space and retrieval outcomes, which can be optimized in an end-to-end manner [45]. Zhao et al. designed a similarity-preserving loss-based deep metric learning strategy, utilizing the ratio of easy to hard samples within classes to dynamically weigh the selected hard samples in experiments, learning the structural characteristics of intra-class samples [46]. Fan et al. introduced a distribution consistency loss to address the problem of imbalanced sample distribution in remote sensing datasets, constructing an end-to-end fine-tuned network suitable for remote sensing image retrieval, achieving state-of-the-art performance [47]. Compared to methods based on deep features, metric learning-based approaches are particularly suitable for tasks requiring refined retrieval and sensitivity to similarity.

3. Proposed Method

The LC 2 R - Net model proposed in this paper achieves the task of lunar complex impact crater image retrieval by fusing low-level visual features with deep features of images. By integrating these two complementary types of features, a more comprehensive image representation is formed, which enhances the model’s ability to recognize and differentiate complex impact craters, thereby improving the accuracy of retrieval. Figure 1 outlines the overall process by which LC 2 R - Net completes the retrieval task.
As illustrated in Figure 1, the core steps include: (1) extracting deep features of impact crater images using an improved Swin Transformer model, which, by integrating the CBAMwithECA attention module, mines potential information within feature maps across channel and spatial dimensions, achieving comprehensive calibration and meticulous optimization of features, thereby enhancing the model’s capability to represent image features; (2) utilizing LBP and Hu moments to extract texture and shape features of impact crater images as low-level visual features; (3) the extracted low-level visual and deep features are weighted and fused, followed by dimensionality reduction to create a more compact and efficient feature representation for retrieval tasks; (4) finally, the model employs the fused feature representation to perform the image retrieval task, matching query images with images in the database, and identifying the most similar images based on the queried features.

3.1. Visual Feature Extraction

In order to effectively capture the distinctive visual attributes of intricate lunar crater images, we utilized two resilient techniques for visual feature extraction: LBP [48] and Hu Moments [49]. LBP serves as a potent texture descriptor, capturing local texture nuances within an image by contrasting the grayscale intensity of a pixel with its neighboring pixels. To elaborate, the LBP value for each pixel is computed by juxtaposing the grayscale intensity of the surrounding pixels with that of the central pixel. This operation can be mathematically represented as follows:
L B P x c , y c = i = 0 P 1 s I x i , y i I x c , y c 2 i
where P is the number of pixels in the domain, and s z is a sign function defined as:
s z = 1 , z 0 0 , z < 0
In this way, for each pixel point I x c , y c is transformed into a P-bit binary number, i.e., the LBP code, which reflects the texture structure of the region around that pixel. By computing the histogram of the LBP code for the entire image, we can obtain the feature vector characterizing the texture of the image.
Hu moments are similarly employed to serve as descriptors of shape features, encapsulating the geometric characteristics of an image through the synthesis of its central moments, which are inherently invariant to transformations such as translation, scaling, and rotation of the image. The initial step in this process involves the calculation of the image’s raw moments and central moments. Raw moments are defined by the following equation:
m p q = x y x p y q I ( x , y )
where I x , y is the pixel intensity of the image at coordinate ( x , y ) , and p and q are the orders of the moments. Then, the center of mass of the image is computed using the original moments ( x ¯ , y ¯ ) :
x ¯ = m 10 m 00 , y ¯ = m 01 m 00
where m 00 is the zero-order primitive moment, representing the total luminance of the image, and m 10 and m 01 are the first-order primitive moments, related to the position of the center of mass of the image in the x and y directions. Subsequently, the center moments with respect to the center of mass are calculated:
μ p q = x y x x ¯ p y y ¯ q I ( x , y )
The central moment describes the shape of the image, and seven Hu moments are calculated from the central moment in the following form:
H 1 = μ 20 + μ 02 H 2 = μ 20 μ 02 2 + 4 μ 11 2 H 3 = μ 30 3 μ 12 2 + 3 μ 21 μ 03 2 H 4 = μ 30 + μ 12 2 + μ 21 + μ 03 2 H 5 = ( μ 30 3 μ 12 ) ( μ 30 + μ 12 ) μ 30 + μ 12 2 3 μ 21 + μ 03 2 + 3 μ 21 μ 03 μ 21 + μ 03 3 μ 30 + μ 12 2 μ 21 + μ 03 2 H 6 = μ 20 μ 02 μ 30 + μ 12 2 μ 21 + μ 03 2 + 4 μ 11 ( μ 30 + μ 12 ) ( μ 21 + μ 03 ) H 7 = 3 μ 21 μ 03 μ 30 + μ 12 μ 30 + μ 12 2 3 μ 21 + μ 03 2 ( μ 30 3 μ 12 ) ( μ 21 + μ 03 ) 3 μ 30 + μ 12 2 μ 21 + μ 03 2
where μ i j is the central moment with respect to the center of mass, and H i is the ith Hu moment.

3.2. Deep Feature Extraction

The deep features extracted through neural networks can effectively describe the semantic information of complex lunar impact crater images. The strategy for extracting deep features in this paper is to use the Swin Transformer as the backbone network, removing the classification head from the network to extract deep feature representations. In addition, this paper introduces the CBAMwithECA module at the patch merging layer and the linear embedding layer of the Swin Transformer. The CBAMwithECA module combines the spatial attention mechanism of Effective Channel Attention (ECA) and Convolutional Block Attention Module (CBAM), mining information in both the channel and spatial dimensions of the feature map. This achieves comprehensive calibration and optimization of features, further enhancing the model’s capability to express features.

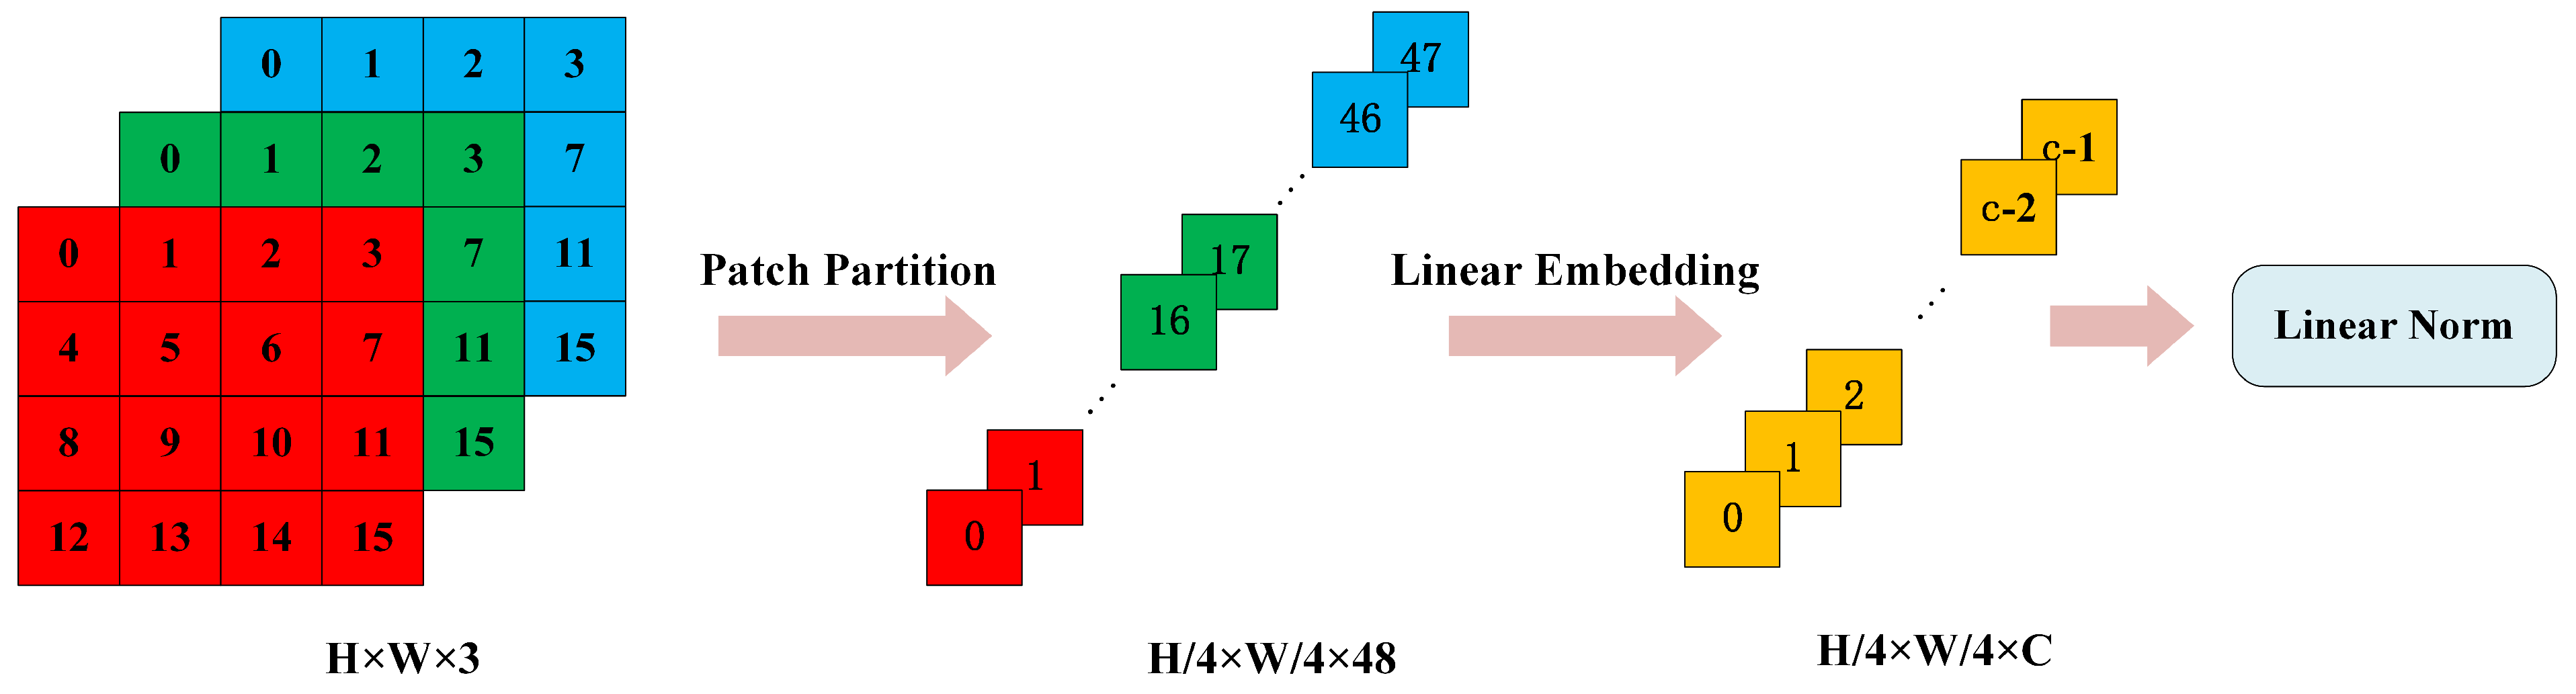
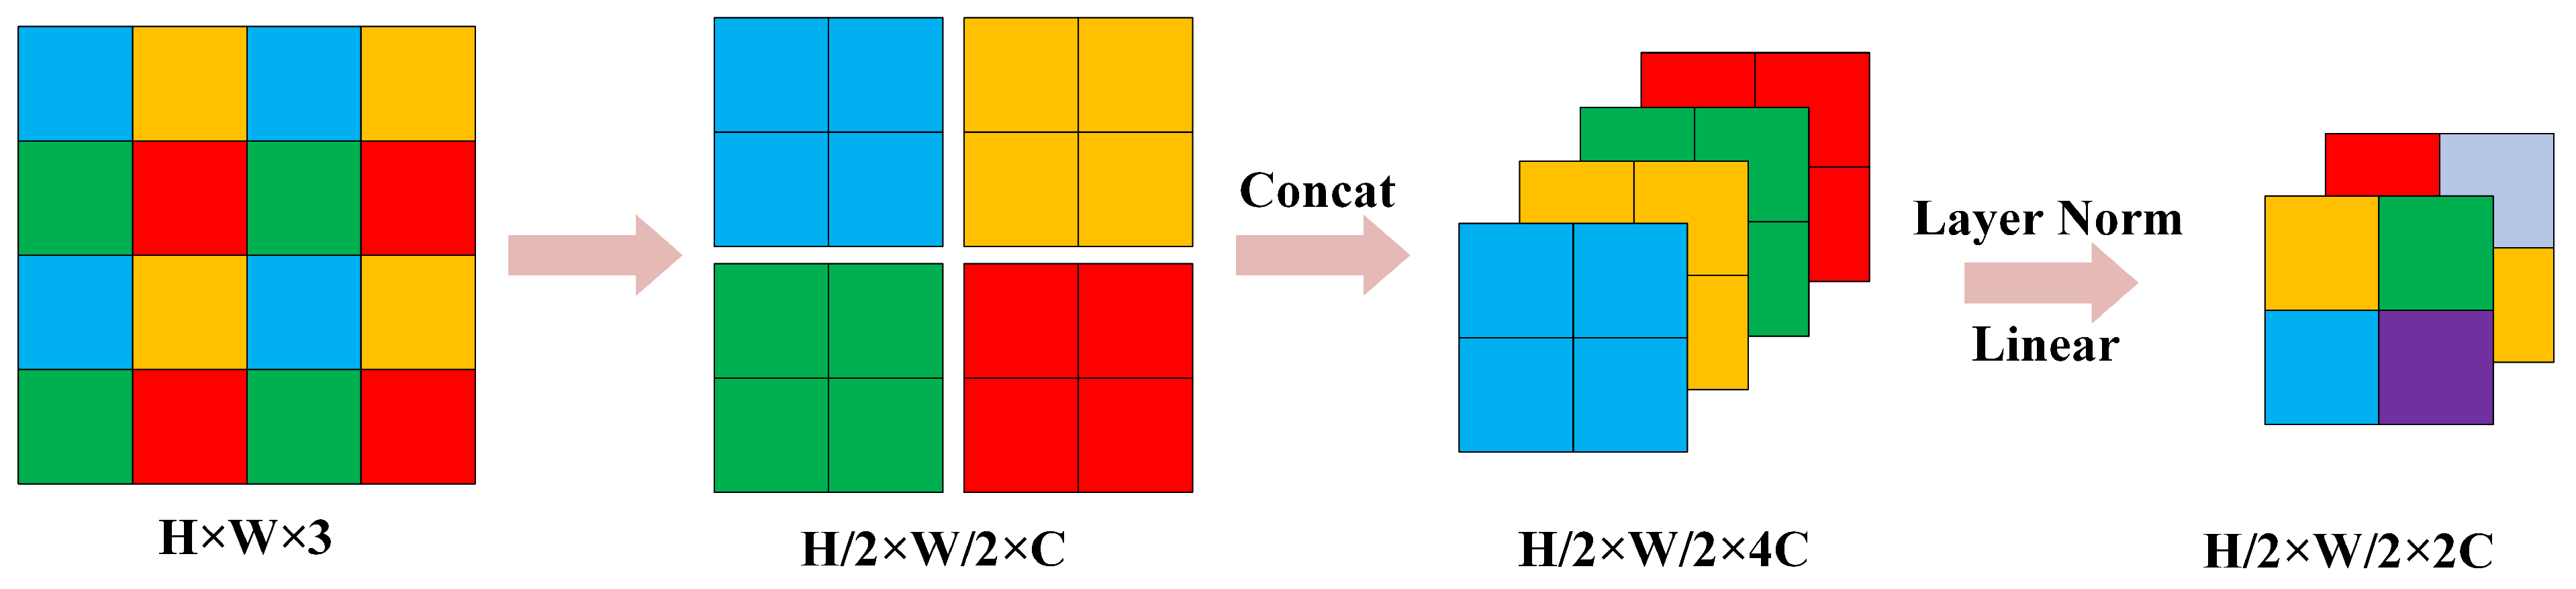
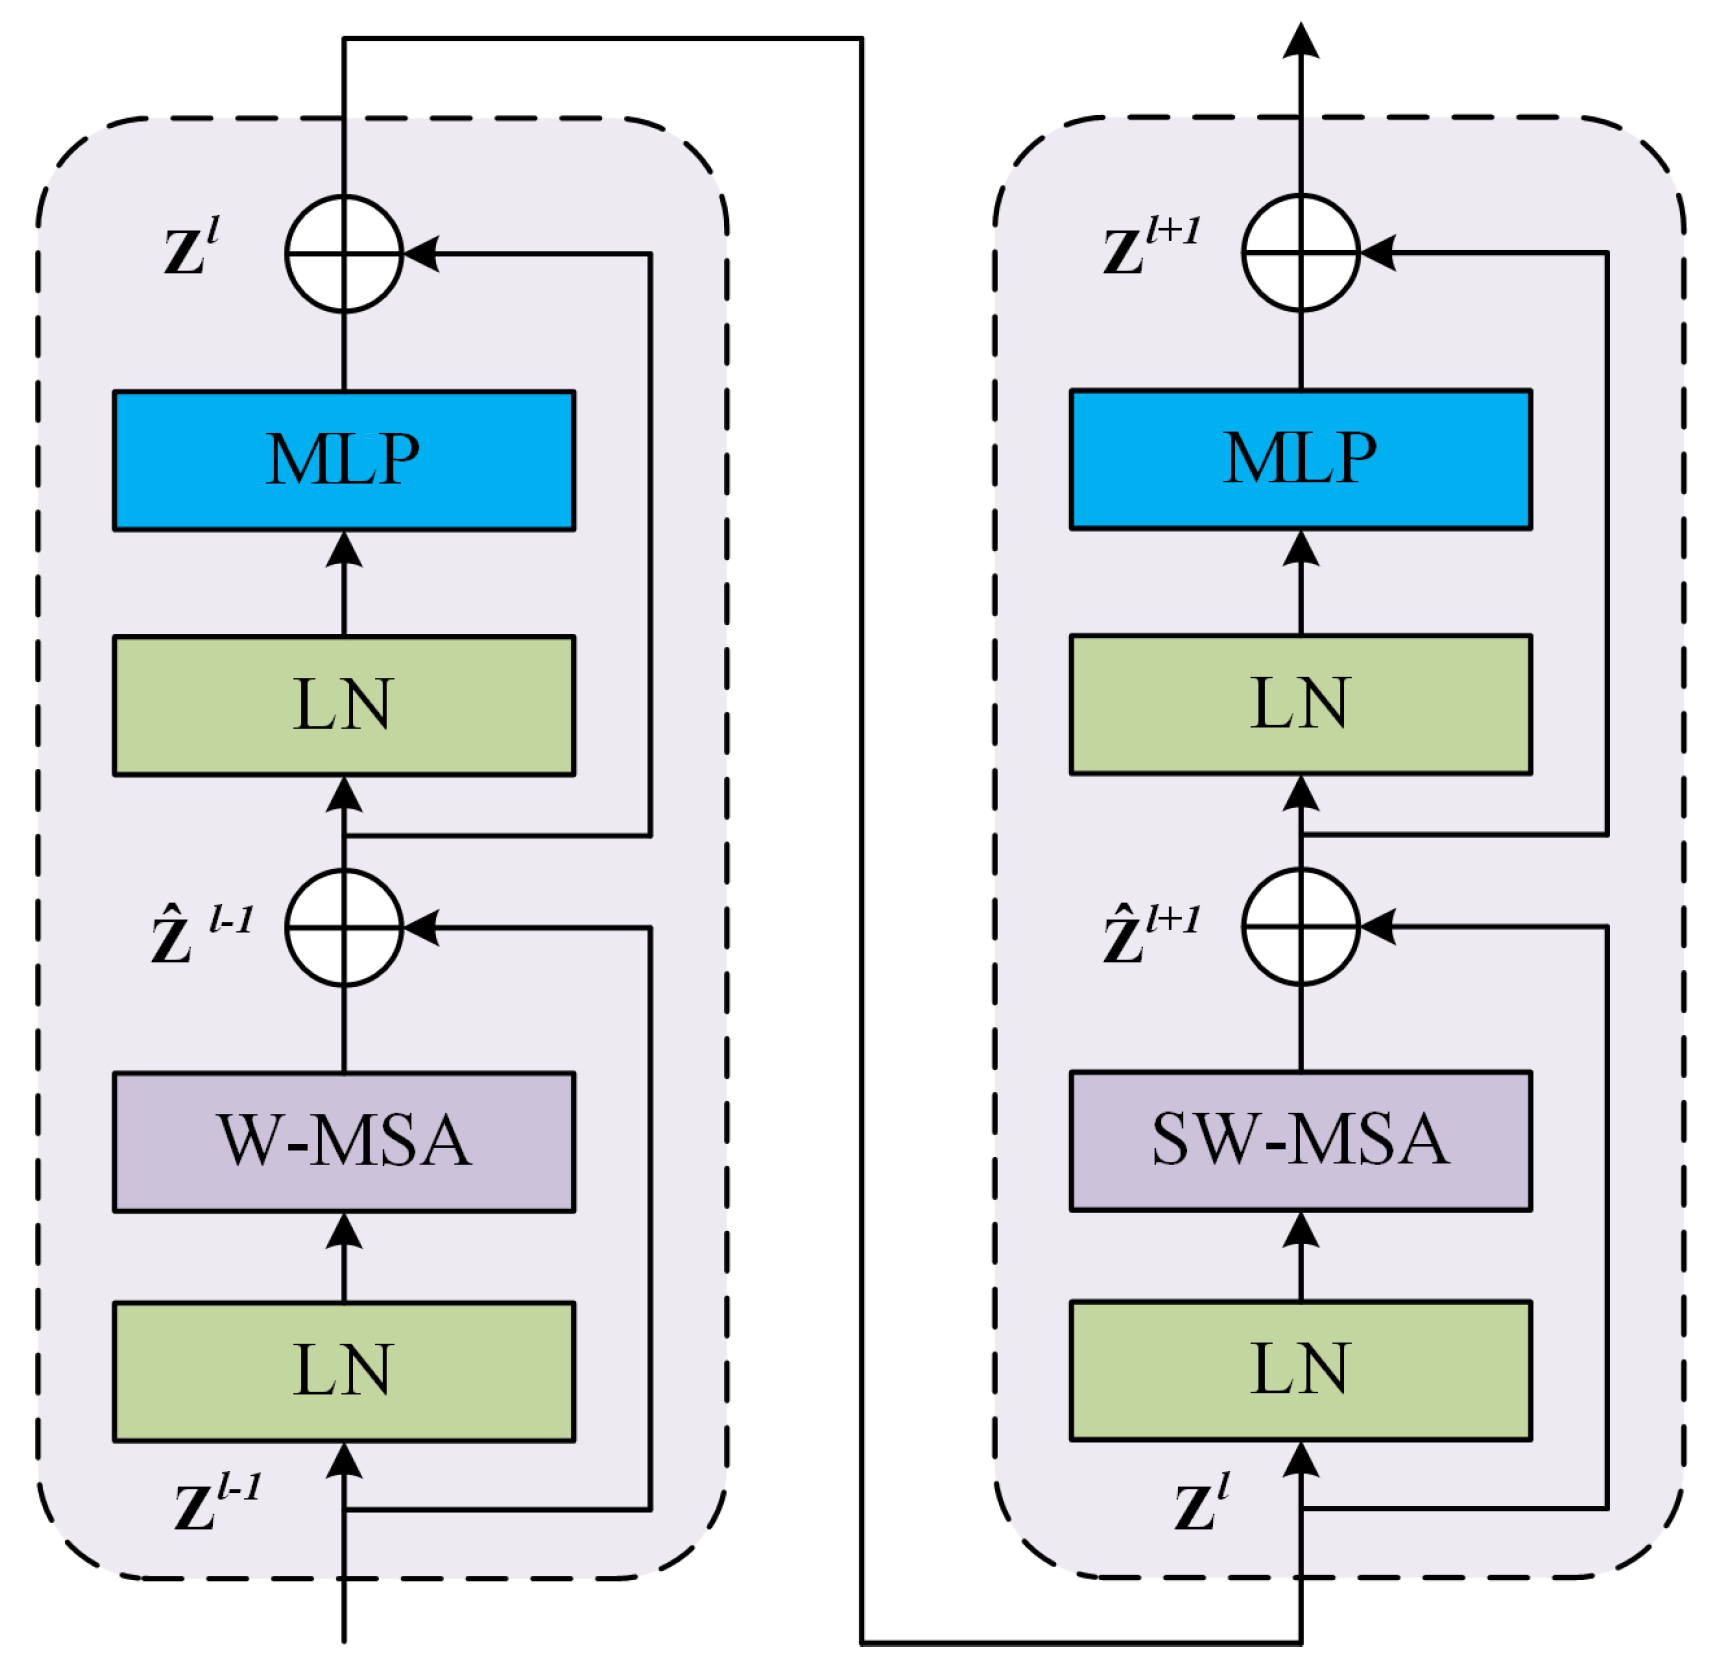
3.2.1. Backbone: Swin Transformer

The core advantage of the Swin Transformer lies in its unique hierarchical structure, which encodes images via a partitioning strategy, thereby effectively capturing multi-scale features within the image. Specifically, the input image is segmented into patches by the Patch Partition module, followed by the construction of feature maps at varying scales through four stages. Beyond the initial stage, which begins with a Linear Embedding layer, the subsequent three stages each commence with a Patch Merging operation and then proceed with a series of stacked Swin Transformer Blocks to achieve a deep feature representation of the image.
  • Patch Partition
At the outset of the Swin Transformer’s processing pipeline, the Patch Partition layer plays a pivotal role in decomposing the incoming image into a sequential array of patches. Given an image with dimensions H × W × 3 , where H and W denote the height and width, and the numeral 3 indicates the RGB color channels, this layer segments the image into a grid of 4 × 4 patches. These patches are subsequently flattened along the channel dimension and undergo a linear projection into an elevated dimensional space, culminating in a feature map with dimensions of H 4 × W 4 × 48 . This feature map is then subject to a linear transformation within the Linear Embedding layer, producing an output feature map dimensionally characterized as H 4 × W 4 × C . The ensuing feature map is channeled into the initial Swin Transformer Block, referred to as Stage 1, for additional refinement. This mechanism is conceptually analogous to the convolutional operation found in conventional convolutional neural networks, and the intricacies of this process are graphically depicted in Figure 2.
2.
Patch Merging
The Patch Merging technique in the Swin Transformer architecture functions analogously to the pooling layers found in classical convolutional neural networks, effectively generating a pyramidal hierarchy of representations through the downsampling of feature maps. Imagine an input feature map with dimensions H × W × C . The Patch Merging operation commences with the segmentation of the feature map into distinct 2 × 2 pixel blocks, treating each as a separate patch. Within these patches, corresponding pixels are extracted and amalgamated, yielding four distinct feature maps, each with a reduced size of H 2 × W 2 × C . These quartet of feature maps are then concatenated along the channel axis, resulting in a singular, enhanced feature map with dimensions H 2 × W 2 × 4 C .
Following the concatenation, the resultant feature map is normalized by a LayerNorm layer, which precedes the final transformation. A fully connected layer then undertakes a linear transformation on the concatenated feature map, specifically targeting its channel depth. This transformation modifies the channel depth from 4 C to 2 C , effectively halving it. The procedural specifics of this Patch Merging operation are visually detailed in Figure 3.
3.
Swin Transformer Block
The Swin Transformer Block represents the fundamental building block of the Swin Transformer architecture. As illustrated in Figure 4, this block is structured as a sequence of two Transformer Blocks. Each Transformer Block is crafted from a series of components: an initial layer normalization ( L N ) , a multi-head self-attention mechanism ( M S A ) , a subsequent layer normalization ( L N ) , and a multilayer perceptron ( M L P ) . To facilitate stable training and mitigate the vanishing gradient issue in deep networks, both the MSA and MLP are equipped with skip connections.
The distinguishing feature between the two Transformer Blocks within the Swin Transformer Block is the type of self-attention mechanism employed. The first block integrates a window-based multi-head self-attention ( W - M S A ), which confines the self-attention process within predetermined window boundaries to lower computational demands and hone in on local feature extraction. Conversely, the second block incorporates shifted window multi-head self-attention ( S W - M S A ). By offsetting the window alignment, SW-MSA broadens the receptive field of the model, enabling feature interactions across neighboring windows, which in turn amplifies the model’s global contextual comprehension. This operation is encapsulated in Equation (7):
Z ^ l = W - M S A L N Z l 1 + Z l 1 Z l = M L P L N Z ^ l + Z ^ l Z ^ l + 1 = S W - M S A E Z l + Z l Z l + 1 = M L P L N Z ^ l + l + Z ^ l + 1
where Z l 1 and Z l + 1 represent the input and output of the Swin Transformer Block, respectively, while W - M S A , S W - M S A , and M L P denote the window-based multi-head self-attention, the shifted window multi-head self-attention, and the multilayer perceptron modules, respectively.

3.2.2. CBAMwithECA Attention Module

Due to the high homogeneity and rich detail of lunar complex crater imagery, relying solely on the self-attention mechanism is insufficient to fully capture the prominent features of impact craters. Therefore, we have introduced the CBAMwithECA module [50], which combines the channel attention of ECA [51] and the spatial attention of CBAM [52] to further enhance the representational capability of features. As shown in Figure 5, the core of ECA-Net is the adaptive computation of the size k of the one-dimensional convolutional kernel, which depends on the number of input channels C and the hyperparameters γ and b. The formula is calculated as follows:
k = log 2 ( C ) + b γ o d d
where | t | o d d represents the odd number closest to t, ensuring that the 1 D convolutional kernel has symmetric padding. In ECA-Net, adaptive average pooling and a 1 D convolutional layer are used to learn the channel attention weights:
M c h a n n e l = σ ( C o n v 1 D ( A v g P o o l ( x ) ) )
where the input feature map is denoted by x and is a four-dimensional tensor within the real number space R B × C × H × W , where B, C, H, and W represent the batch size, number of channels, height, and width, respectively. The channel attention mechanism is encapsulated by M c h a n n e l , which is a tensor of dimensions R B × C × 1 × 1 , capturing the importance of each channel. The Sigmoid function, symbolized by σ , is utilized to activate and normalize the elements of M c h a n n e l . Subsequently, the feature map x is modulated by M c h a n n e l to produce the channel-wise enhanced feature map x c a , which is formulated as follows:
x c a = M c h a n n e l x
Concerning the mechanism for spatial attention, illustrated in Figure 6, the process begins by subjecting the feature map x c a to both average pooling and max pooling operations across the channel axis, resulting in a pair of distinct feature descriptors. Subsequently, these descriptors are merged and proceed through a convolutional layer with a kernel size of 7 × 7 , culminating in the formation of the spatial attention map.
M s p a t i a l = σ C o n v 2 D C o n c a t A v g p o o l x c a , M a x p o o l x c a
The spatial attention map is then applied to the feature map x c a , resulting in a weighted feature map.
x s a = M s p a t i a l x c a
Finally, the feature map weighted by the attention mechanism is added to the original input feature map to realize a residual connection, resulting in the enhanced feature map x e n h a n c e d :
x e n h a n c e d = x + x s a
The process of inserting the CBAMwithECA module into the linear embedding module is illustrated in Figure 7.
The process of inserting the CBAMwithECA module into the patch merging module is shown in Figure 8.

3.2.3. Loss Function

In our research, the training phase utilized a triplet loss function [53] to guide the optimization. This loss function operates on triplets, which include an anchor image, a corresponding positive image, and a contrasting negative image. The primary objective is to amplify the model’s ability to discriminate between varying classes. This is achieved by diminishing the distance metric between the anchor and the positive instance while concurrently enlarging the gap between the anchor and the negative instance. The functional form of the triplet loss is delineated below:
L t r i p l e t = i = 1 N m a x 0 , f a i f p i 2 f a i f n i 2 + α
where f ( · ) denotes the output of the feature mapping function derived from the Gempool layer. The terms a i , p i , and n i correspond to the anchor, positive, and negative images within the i-th triplet, respectively. Here, N signifies the aggregate count of triplets, while α represents a predetermined margin parameter that delineates the threshold between the proximities of positive and negative pairs. This loss function is instrumental in clustering akin features of images and concurrently dispersing the features of dissimilar images, an aspect that is crucial in areas where the terrain, such as the lunar surface, exhibits high degrees of similarity.
During training, a hard negative sample mining strategy [53] was employed to enhance the effectiveness of the triplet training. For each anchor image, we select negative samples with lower structural similarity by calculating the Structural Similarity Index S S I M with all negative samples in the dataset. S S I M is used to quantify the visual similarity between two images, and its formula is as follows:
S S I M x , y = 2 μ x μ y + c 1 2 σ x y + c 2 μ x 2 + μ y 2 + c 1 σ x 2 + σ y 2 + c 2
where x and y are utilized to denote two distinct image windows. The terms μ x and μ y refer to their respective mean intensity values. Variance for each window is indicated by σ x 2 and σ y 2 , while σ x y represents the covariance between the two windows. Constants c 1 and c 2 are incorporated within the formulation to prevent the occurrence of division by zero, ensuring numerical stability.
During the hard negative sample mining process, for each anchor image a, we select the negative sample n with the smallest S S I M value from all negative sample images, satisfying the following condition:
n = arg min n d f ( a ) , f ( n )
The hard negative mining strategy ensures that the anchor image and the selected negative sample image have significant structural differences, providing more challenging samples for training and enhancing the model’s discriminative ability.

3.3. Feature Fusion and Retrieval

Feature fusion is used to concatenate visual features and depth features to get a fused feature vector. Let the visual feature be F V C and the depth feature be F D C . Set the feature weight of F V C to λ and the feature weight of F D C to 1 λ . Change the importance of the feature by adjusting the size of λ . The fused feature is shown in Equation (17).
F = ( λ F V C , ( 1 λ ) F D C )
Since the dimensionality of the fused feature vectors is too high, the fused features are downscaled using PCA. The principle is to maximize the variance of the downscaled features, and if the downscaled features are uncorrelated, then it can be expressed as an optimization problem, as shown in Equation (18).
max W t r W T S t W , s , t , W T W = I
where S t represents the covariance matrix of the sample features, t r W T S t W is the variance of the sample features after dimensionality reduction, w T w T = I denotes the constraint conditions, and I is the identity matrix.
After the dimensionality reduction in the fused features, cosine similarity is used to calculate the similarity between different impact crater images, as shown in Equation (19).
c o s θ = i = 1 n A i × B i i = 1 n A i 2 × i = 1 n B i 2
where A i denotes the composite feature vector derived from the query image, whereas B i signifies the composite feature vector corresponding to the lunar impact crater images within the image repository. The ultimate retrieval outcomes are the k highest-ranked images determined by their respective cosine similarity measures.

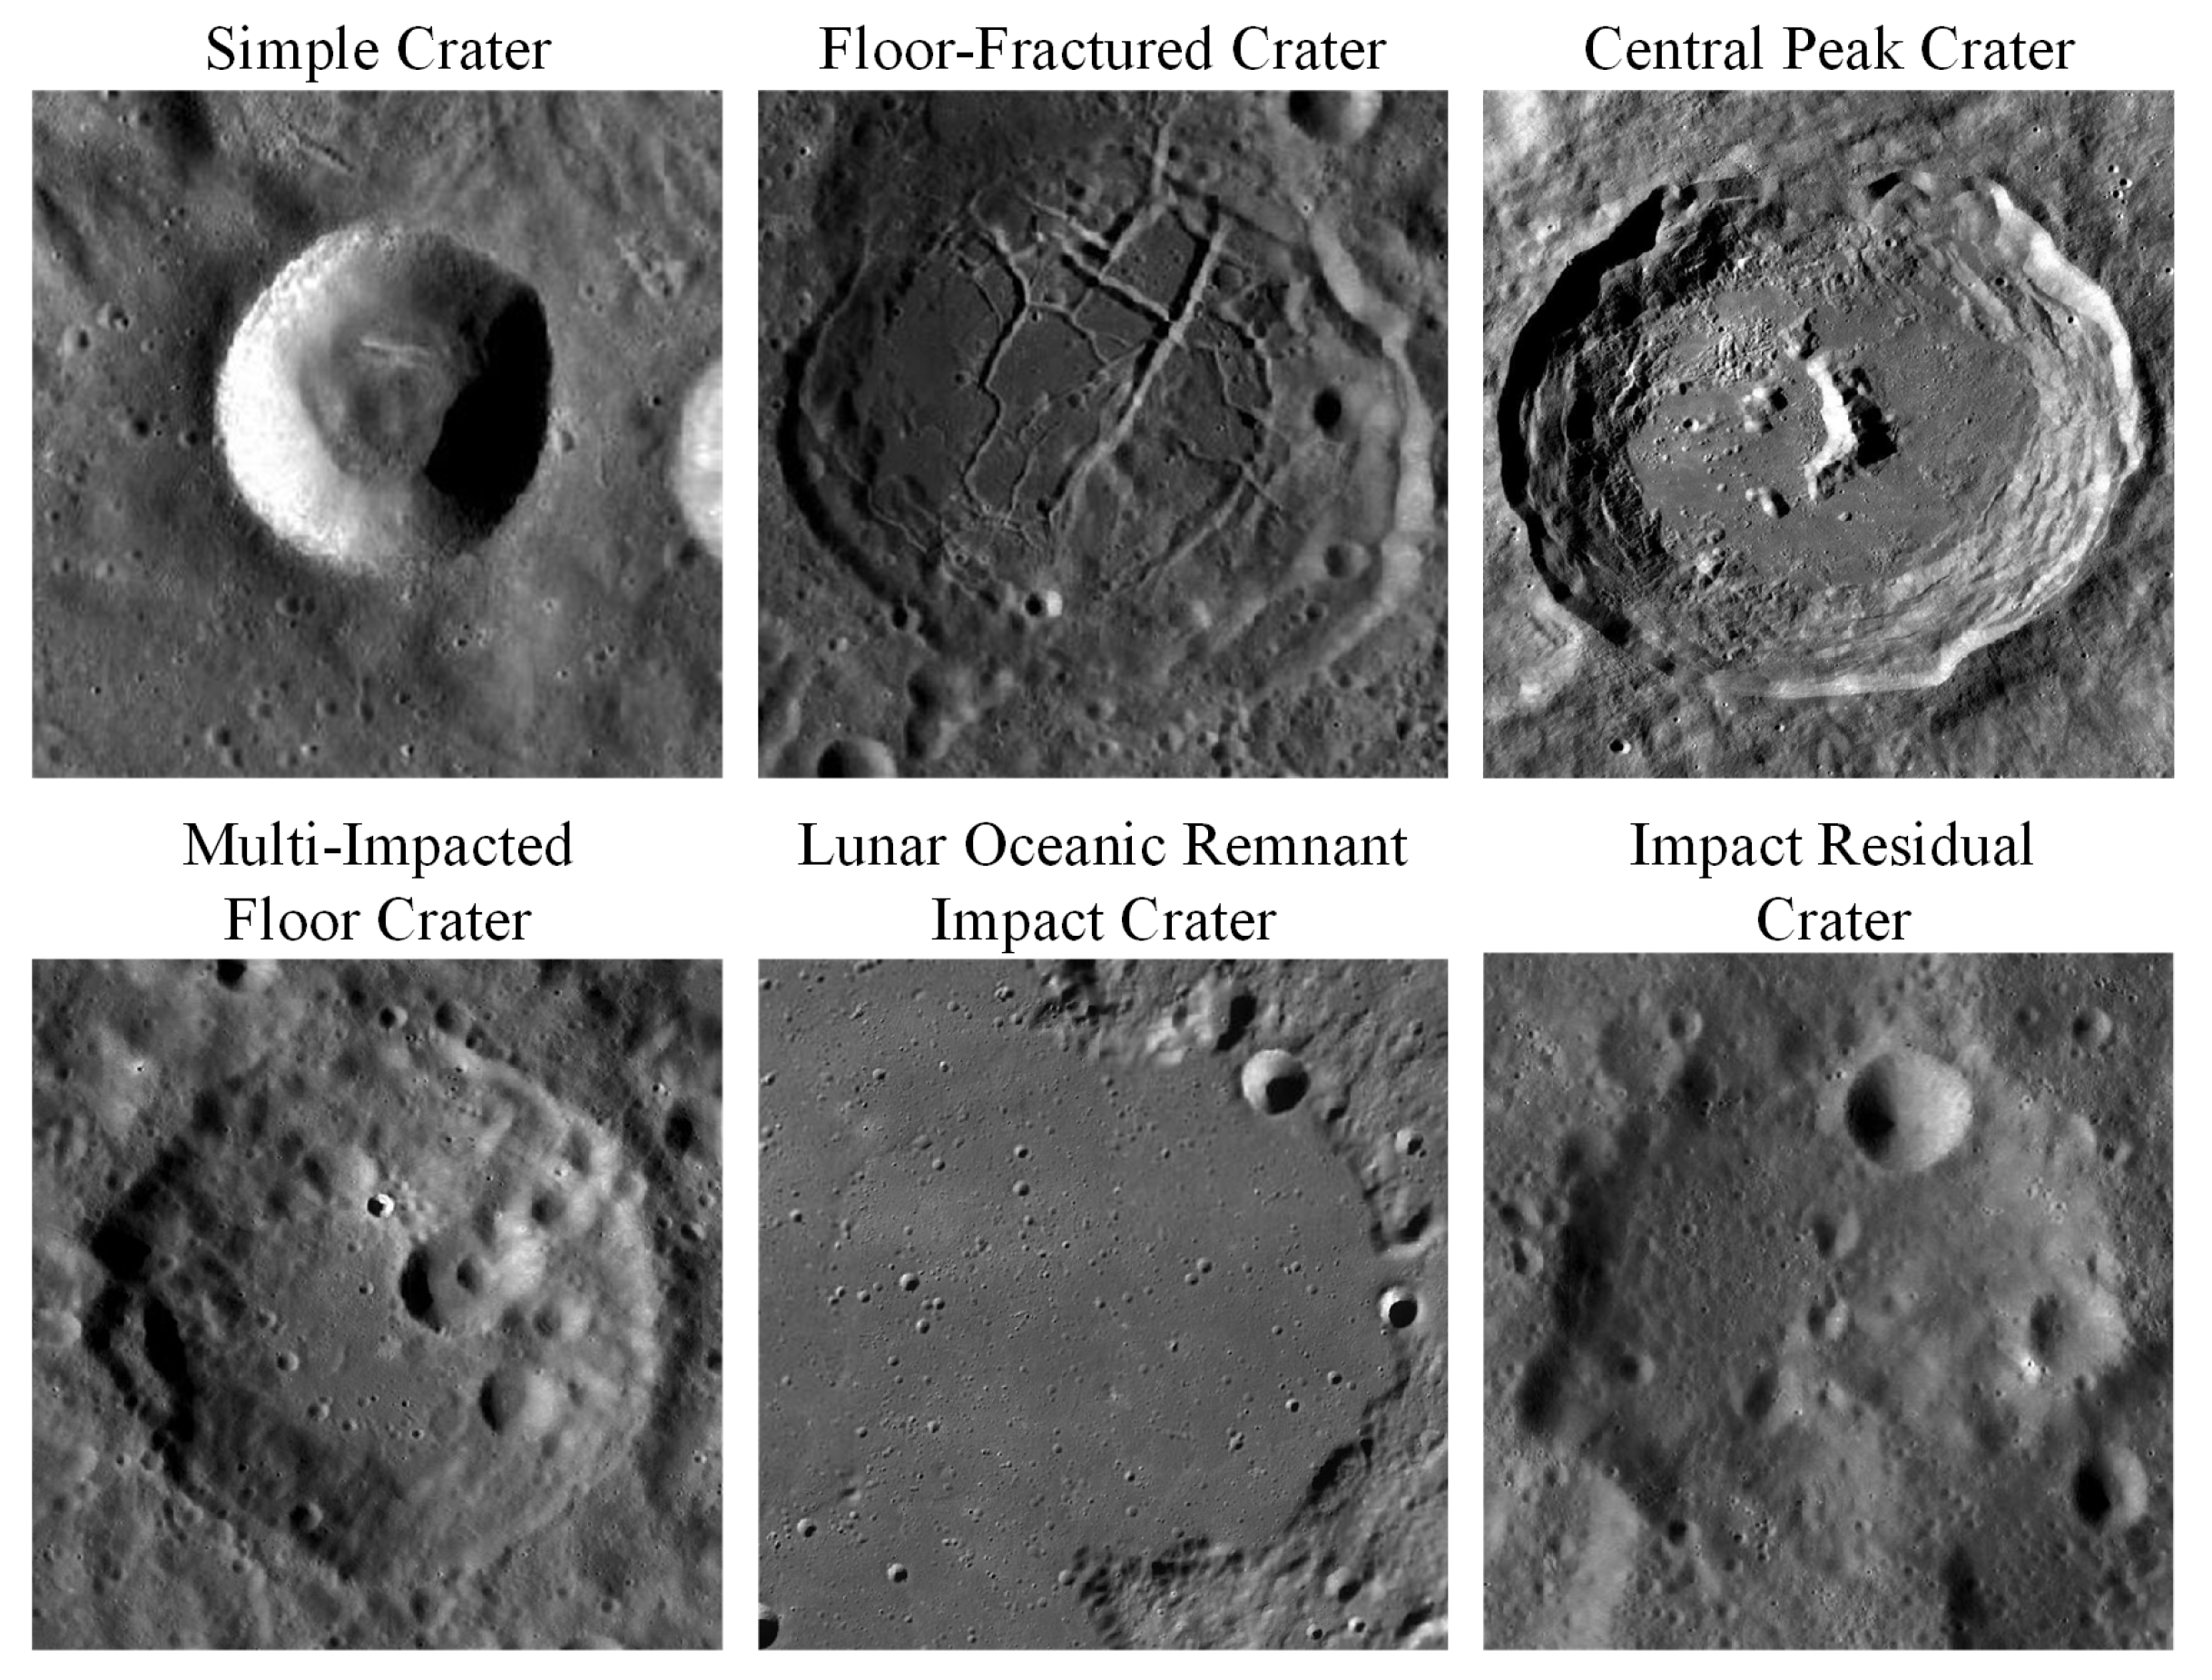
4. Lunar Complex Crater Dataset

The lunar surface is home to a multitude of impact craters that cover much of its terrain. To date, a vast number of lunar craters have been identified in images and Digital Elevation Model (DEM) data through expert visual inspection as well as automated detection methods, leading to the establishment of numerous crater databases. This paper selects 3234 craters ranging from 20 to 30 km in diameter from the lunar impact crater database (2015 revision) maintained by the Lunar and Planetary Institute as the research subjects to construct the Lunar Complex Impact Crater Dataset; the data can be obtained from https://www.lpi.usra.edu/lunar/surface/Lunar_Impact_Crater_Database_v08Sep2015.xls (accessed on 1 January 2020). Utilizing 100-m resolution imagery and DEM data provided by the Lunar Reconnaissance Orbiter (LRO), an analysis based on the morphological texture features and profile characteristics of the craters is conducted (when a crater contains two or more types of local structures, the most prominent feature is chosen as the basis for classification). These craters are categorized into six types, including simple craters, floor-fractured craters, central peak craters, multi-impacted floor craters, lunar oceanic remnant impact craters, and impact residual craters. Example images for each category are shown in Figure 9.
Due to the specificity of impact crater types, the number of different categories of impact craters in the constructed dataset is severely imbalanced. To prevent overfitting during network training, we employed a series of data augmentation techniques to expand the original dataset. These techniques include random rotation, random horizontal flipping, color jittering, random affine transformations, and random Gaussian blur, all aimed at simulating the various conditions that impact craters may encounter during actual imaging processes. Ultimately, we obtained 5597 images, of which 80% were randomly selected to constitute the training data, with the remainder used for model validation.

5. Experiments and Analysis

This section presents a comprehensive evaluation of the performance of the proposed method through a series of extensive experiments and provides a clear and accurate description of the experimental results.

5.1. Implementation Details

5.1.1. Experimental Setup

All experiments in this study were conducted on a deep learning server equipped with an Intel(R) Xeon(R) Platinum 8255C CPU and an RTX 3090 (24GB) GPU. The software environment consisted of Pytorch 1.10.0 and Python 3.8, with the operating system being Ubuntu 20.04. During the model training phase, weights trained on the ImageNet dataset were used as the initial parameters. The model was optimized using the Adam optimizer, and a cosine annealing algorithm was employed to dynamically adjust the learning rate. Parameters were updated every 4 batches, with each batch containing 16 samples. The detailed parameters are shown in Table 1. The experiments returned the top 20 images in the retrieval results to evaluate the model’s retrieval accuracy.

5.1.2. Evaluation Metrics

During the experimental phase of this research, we employed three principal metrics to assess the efficacy of the lunar complex crater image retrieval system: mean average precision m A P , average normalized modified retrieval rank A N M R R , and the time taken for retrieval.
  • Mean Average Precision ( m A P )
When performing image retrieval for lunar complex craters, for a given query image and an image database with a total of N images, the Average Precision ( A P ) is defined as follows:
A P = 1 n k = 1 N P ( k ) · r e l ( k )
where n is indicative of the aggregate count of images in the repository which are categorized under the identical impact crater classification as the query image. The index k refers to the ordinal position within the ranked retrieval outcomes. The function P ( k ) quantifies the precision attained at the juncture of the k-th result in the retrieval sequence. The function r e l ( k ) operates as a binary indicator, assigning a value of 1 when the k-th result in the retrieval sequence is of the same impact crater category as the query image, and 0 in all other instances. The m A P , is derived by computing the mean of precision values across all query instances, which is elucidated in Equation (21).
m A P = 1 Q q = 1 Q A P q
where Q stands for the cumulative quantity of all the queries processed, while A P ( q ) signifies the Average Precision A P computed for each distinct query. The m A P value, which falls within the interval [0, 1], serves as a performance indicator for the retrieval system; a value approaching 1 denotes the superior performance of the system.
2.
Average Normalized Modified Retrieval Rank ( A N M R R )
In the dataset of images, every image is allocated a ranking R a n k ( i ) , with i denoting the image’s sequence in the outcome set. Given a query’s reference image S K , the count of analogous images within the dataset is denoted as G ( S K ) . Within the uppermost K images of the search outcomes, should the R a n k ( i ) of an image surpass K, the R a n k ( i ) is recalibrated as per the subsequent expression:
R a n k i = R a n k i R a n k i K 1.25 × K R a n k i > K
For each query S K , its average rank A ν g R a n k ( S K ) is calculated as follows:
A ν g R a n k S K = 1 G ( S K ) i = 1 G ( S K ) R a n k i
The normalized and corrected retrieval rank is defined as N M R R ( S K ) :
N M R R ( S K ) = A ν g R a n k ( S K ) 0.5 × ( K + 1 ) 1.25 × K 0.5 × ( K + 1 )
In assessing the efficacy of image retrieval approaches within a collection of images, suppose that M queries have been executed. To compute the aggregate mean normalized modified retrieval rank, denoted as A N M R R , the following procedure is adopted:
A N M R R = 1 M j = 1 M N M R R S K j
The value of A N M R R is within the range [0, 1]. It should be noted that the lower the value of A N M R R , the higher the retrieval precision.
3.
Retrieval Time
The retrieval duration stands as a crucial metric for gauging the performance of an image retrieval system. It spans from the moment the query image is submitted to the point when a full set of search outcomes is obtained. The efficiency of the system is inversely proportional to the retrieval time; the less time it takes to complete the search, the more efficient the system is considered to be.

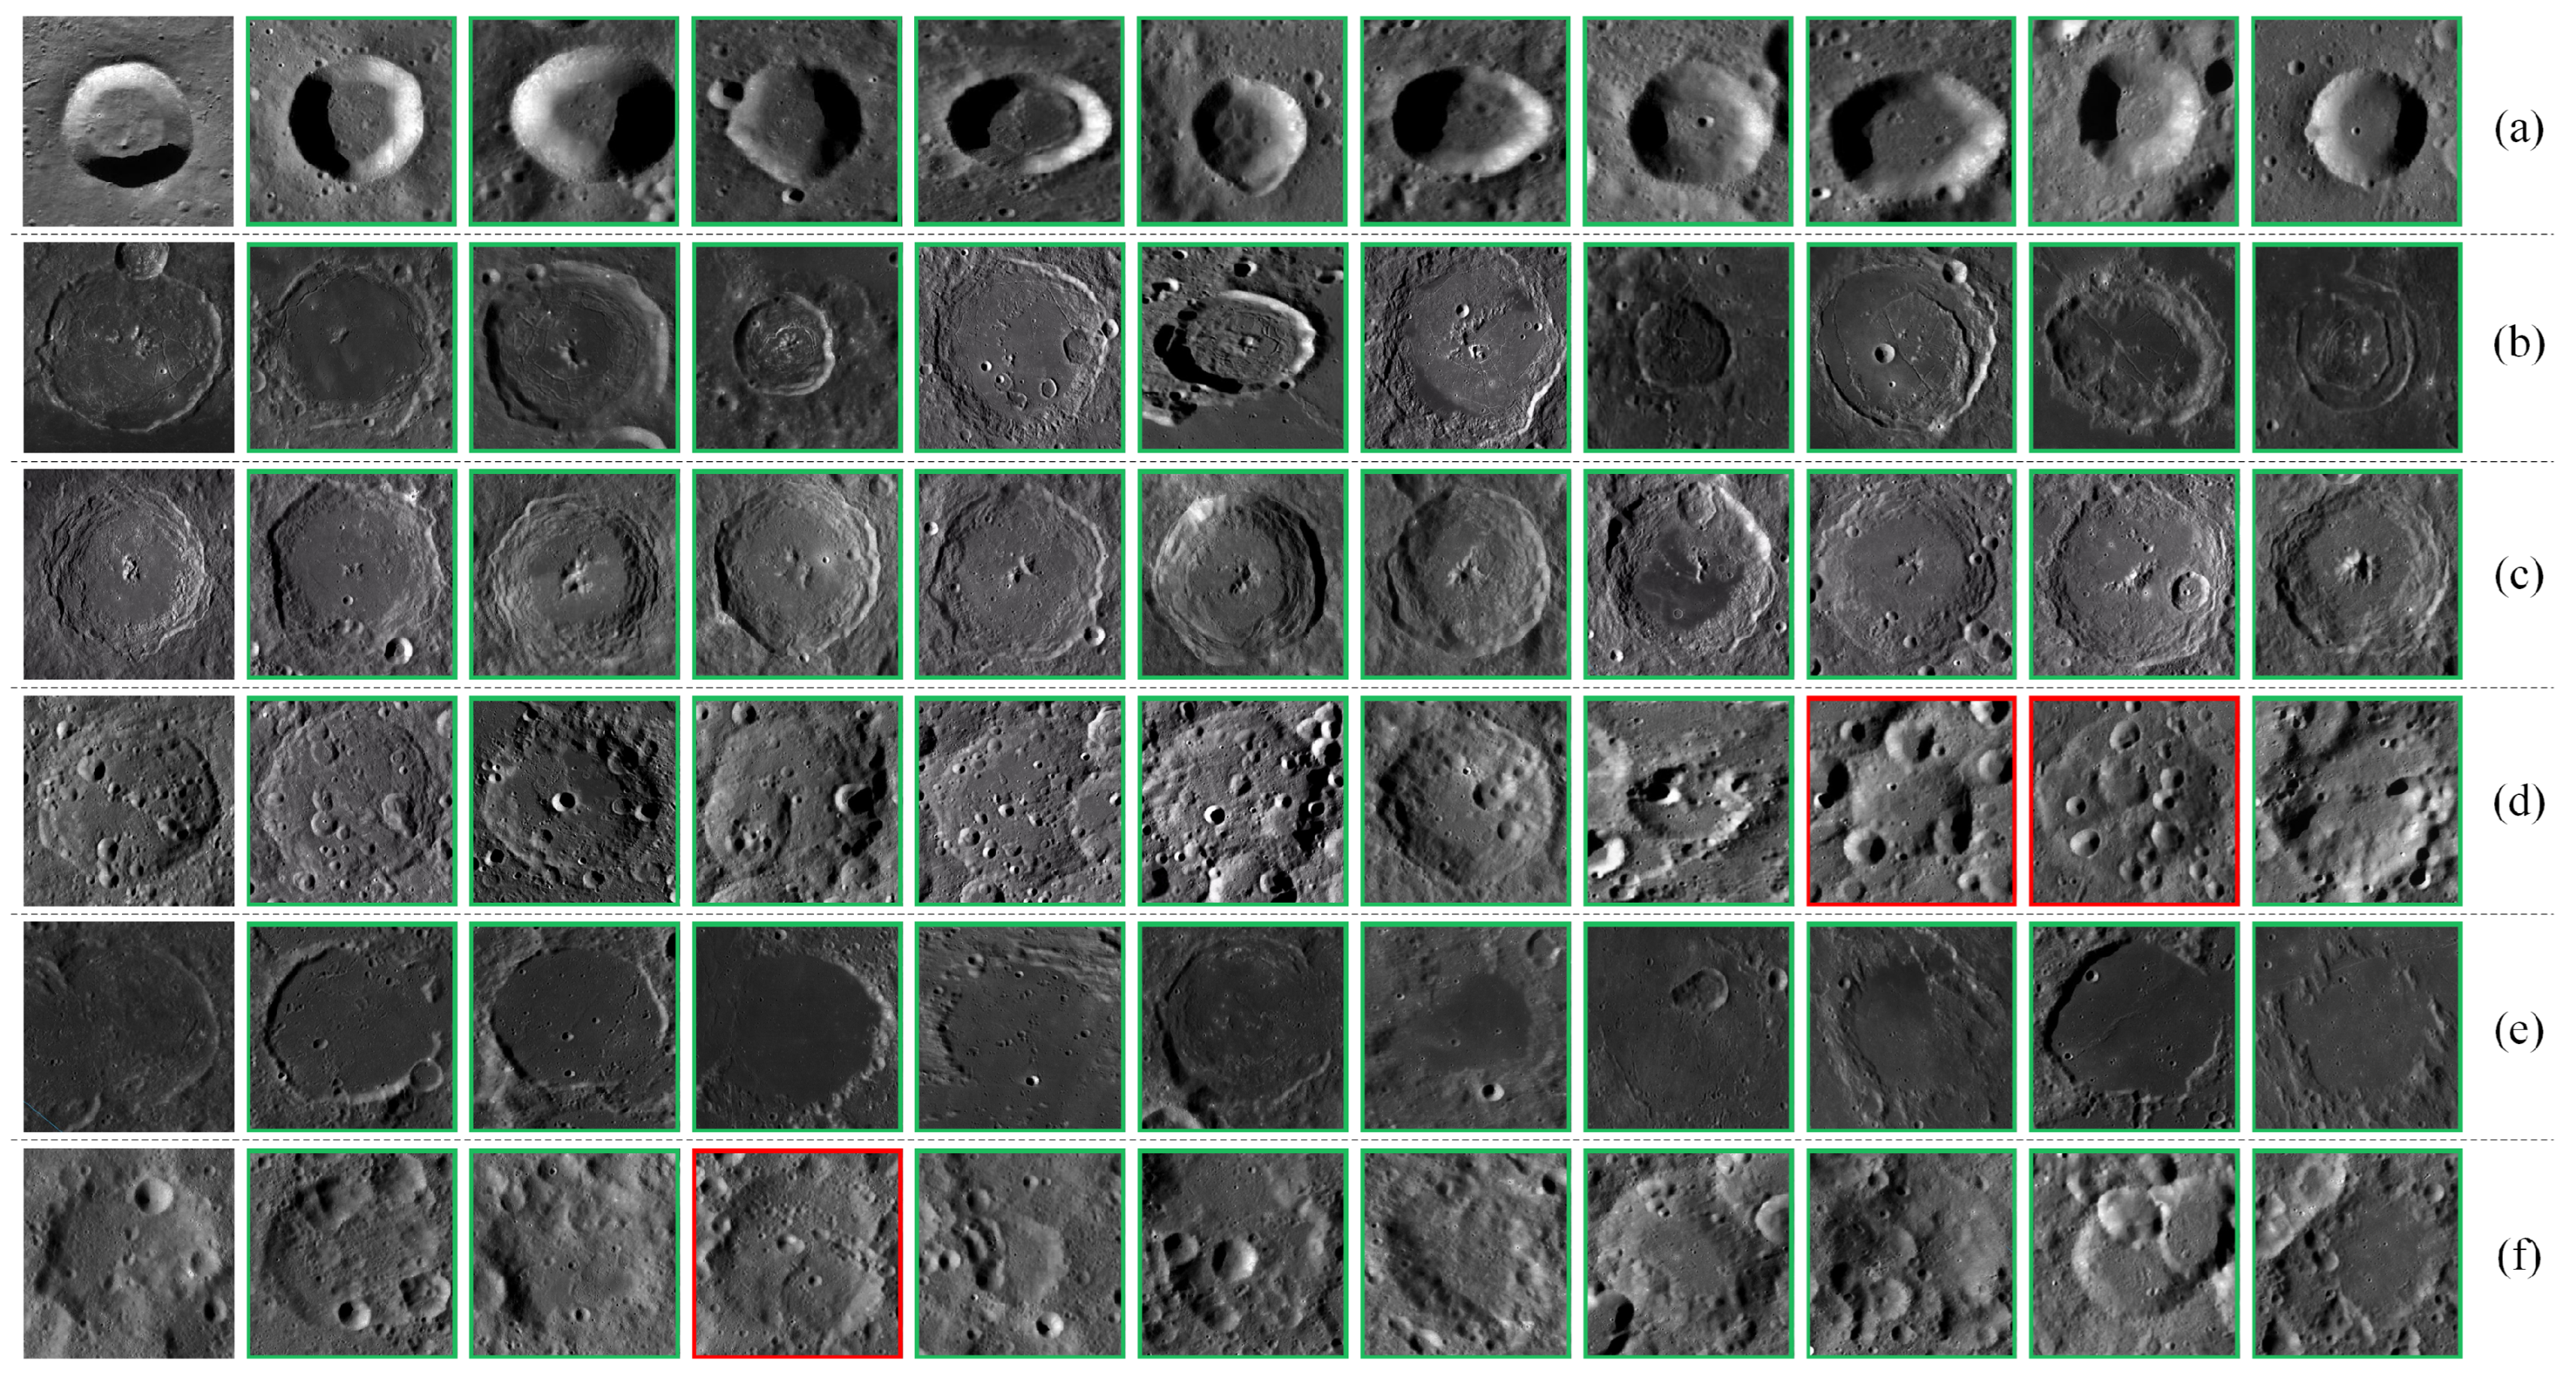
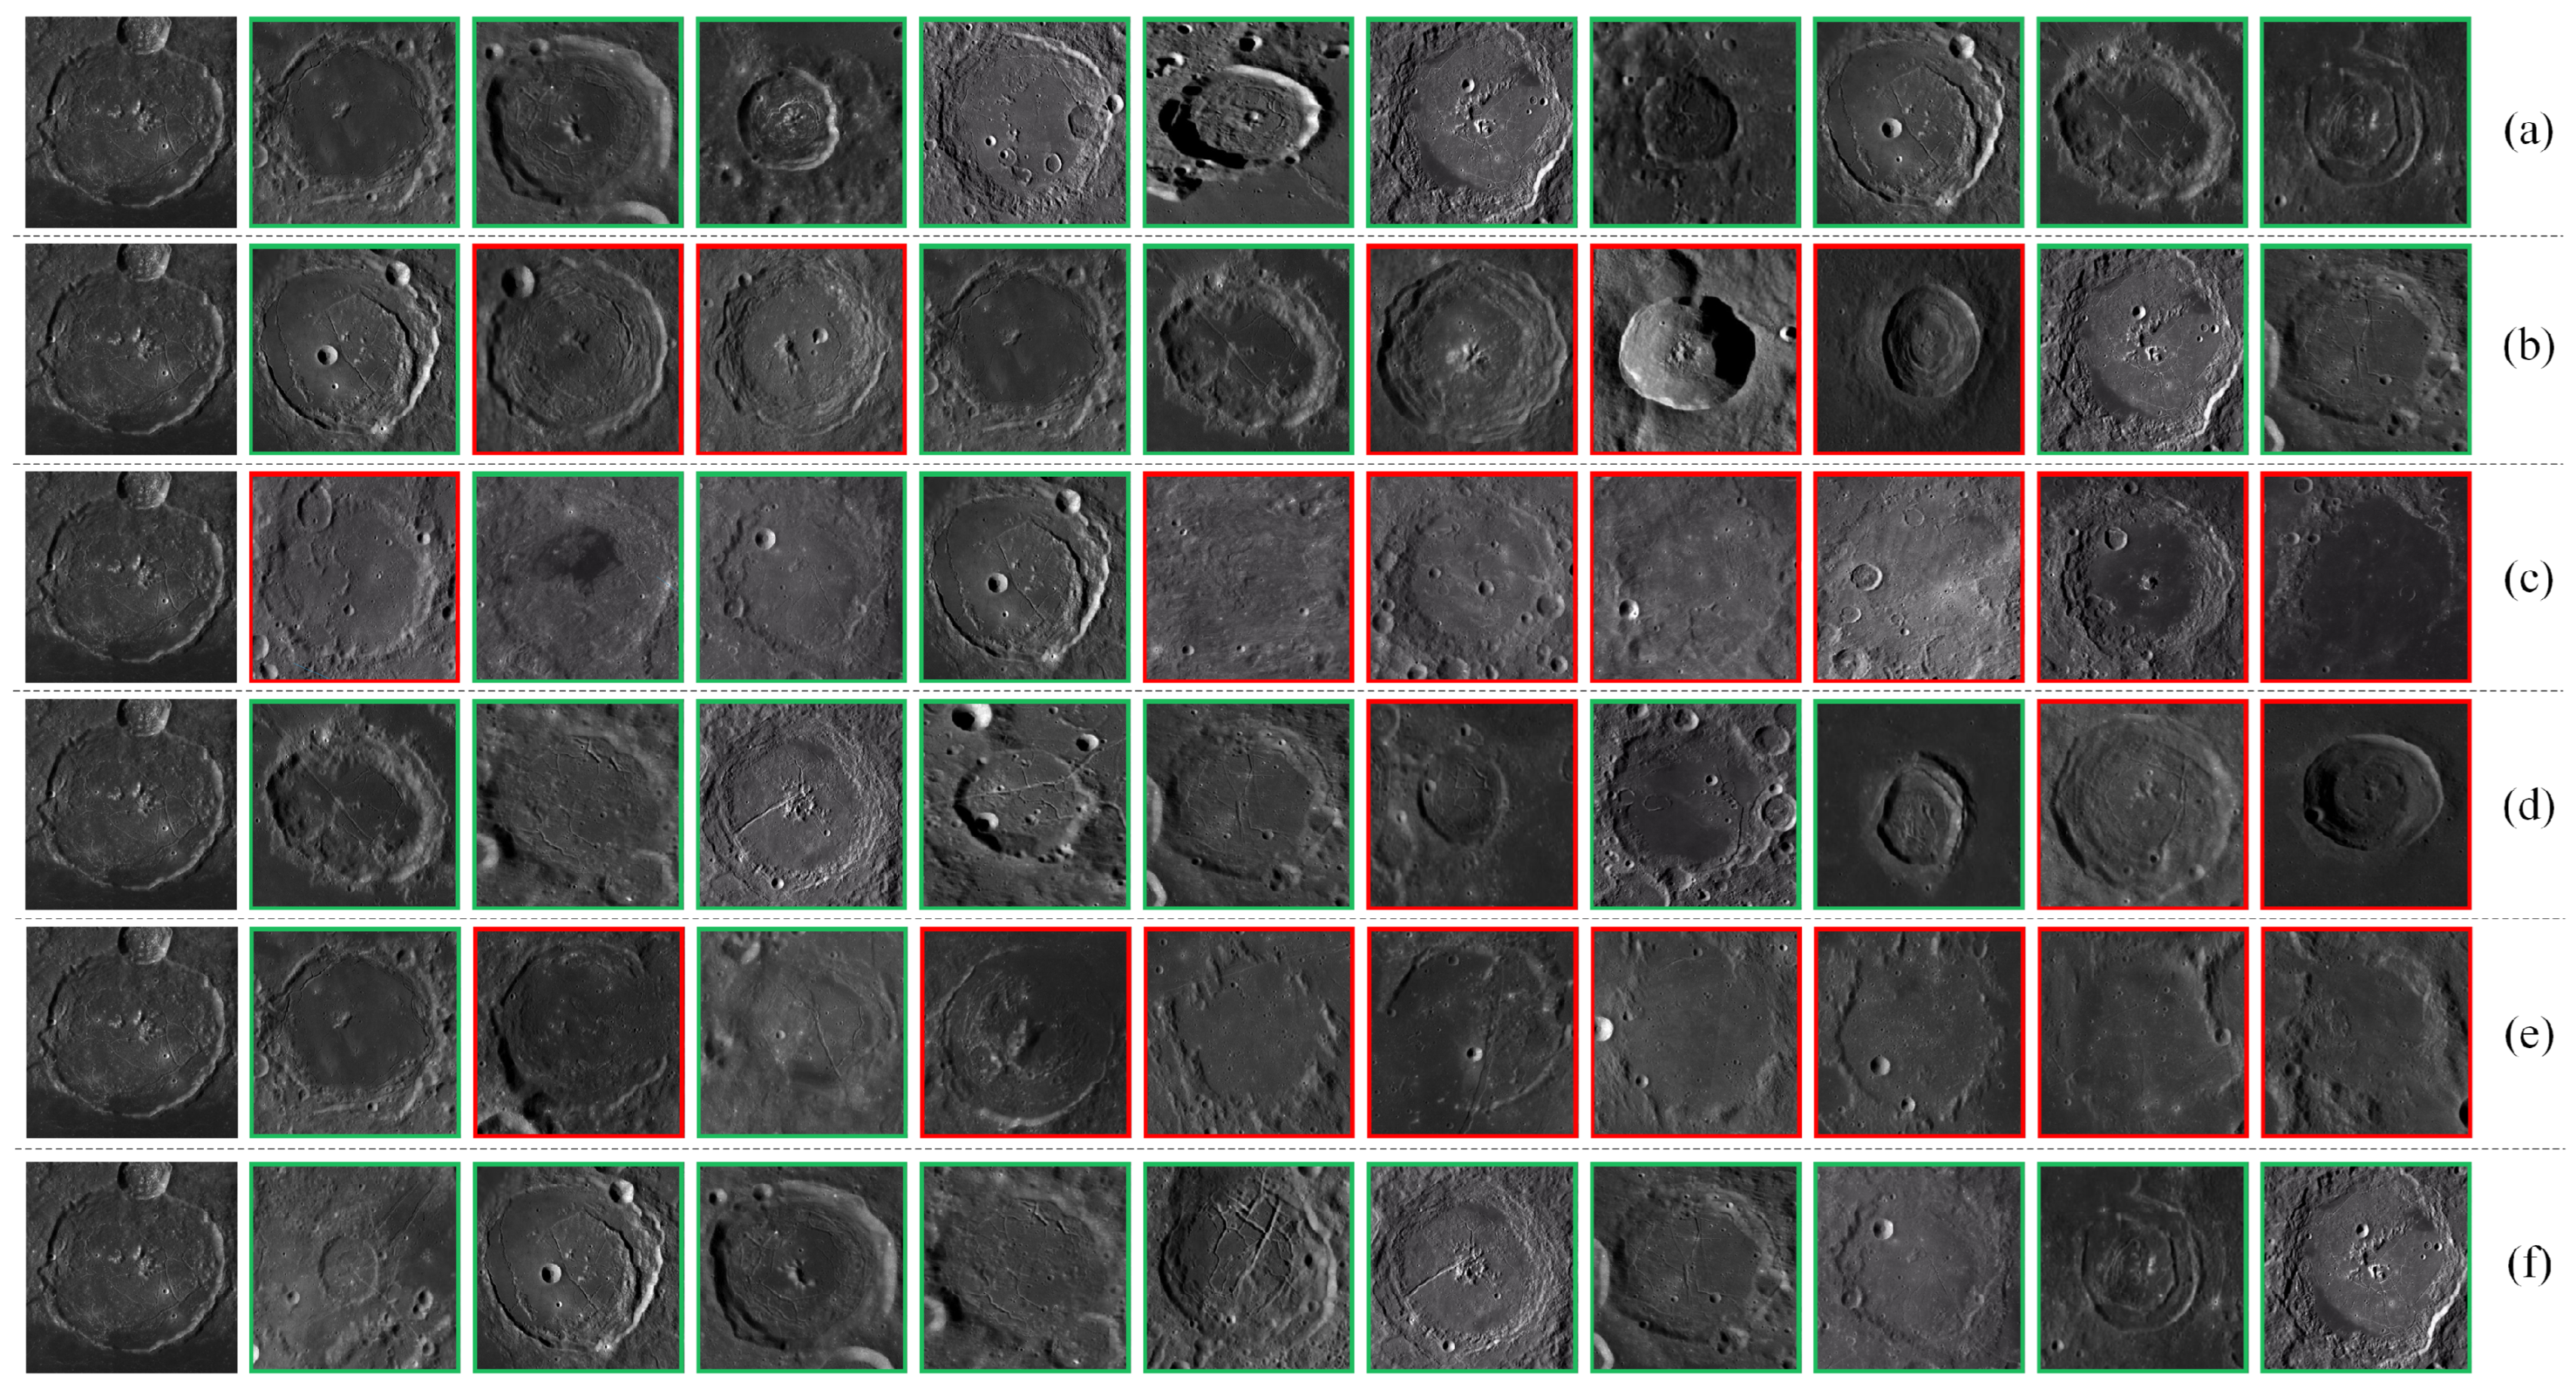
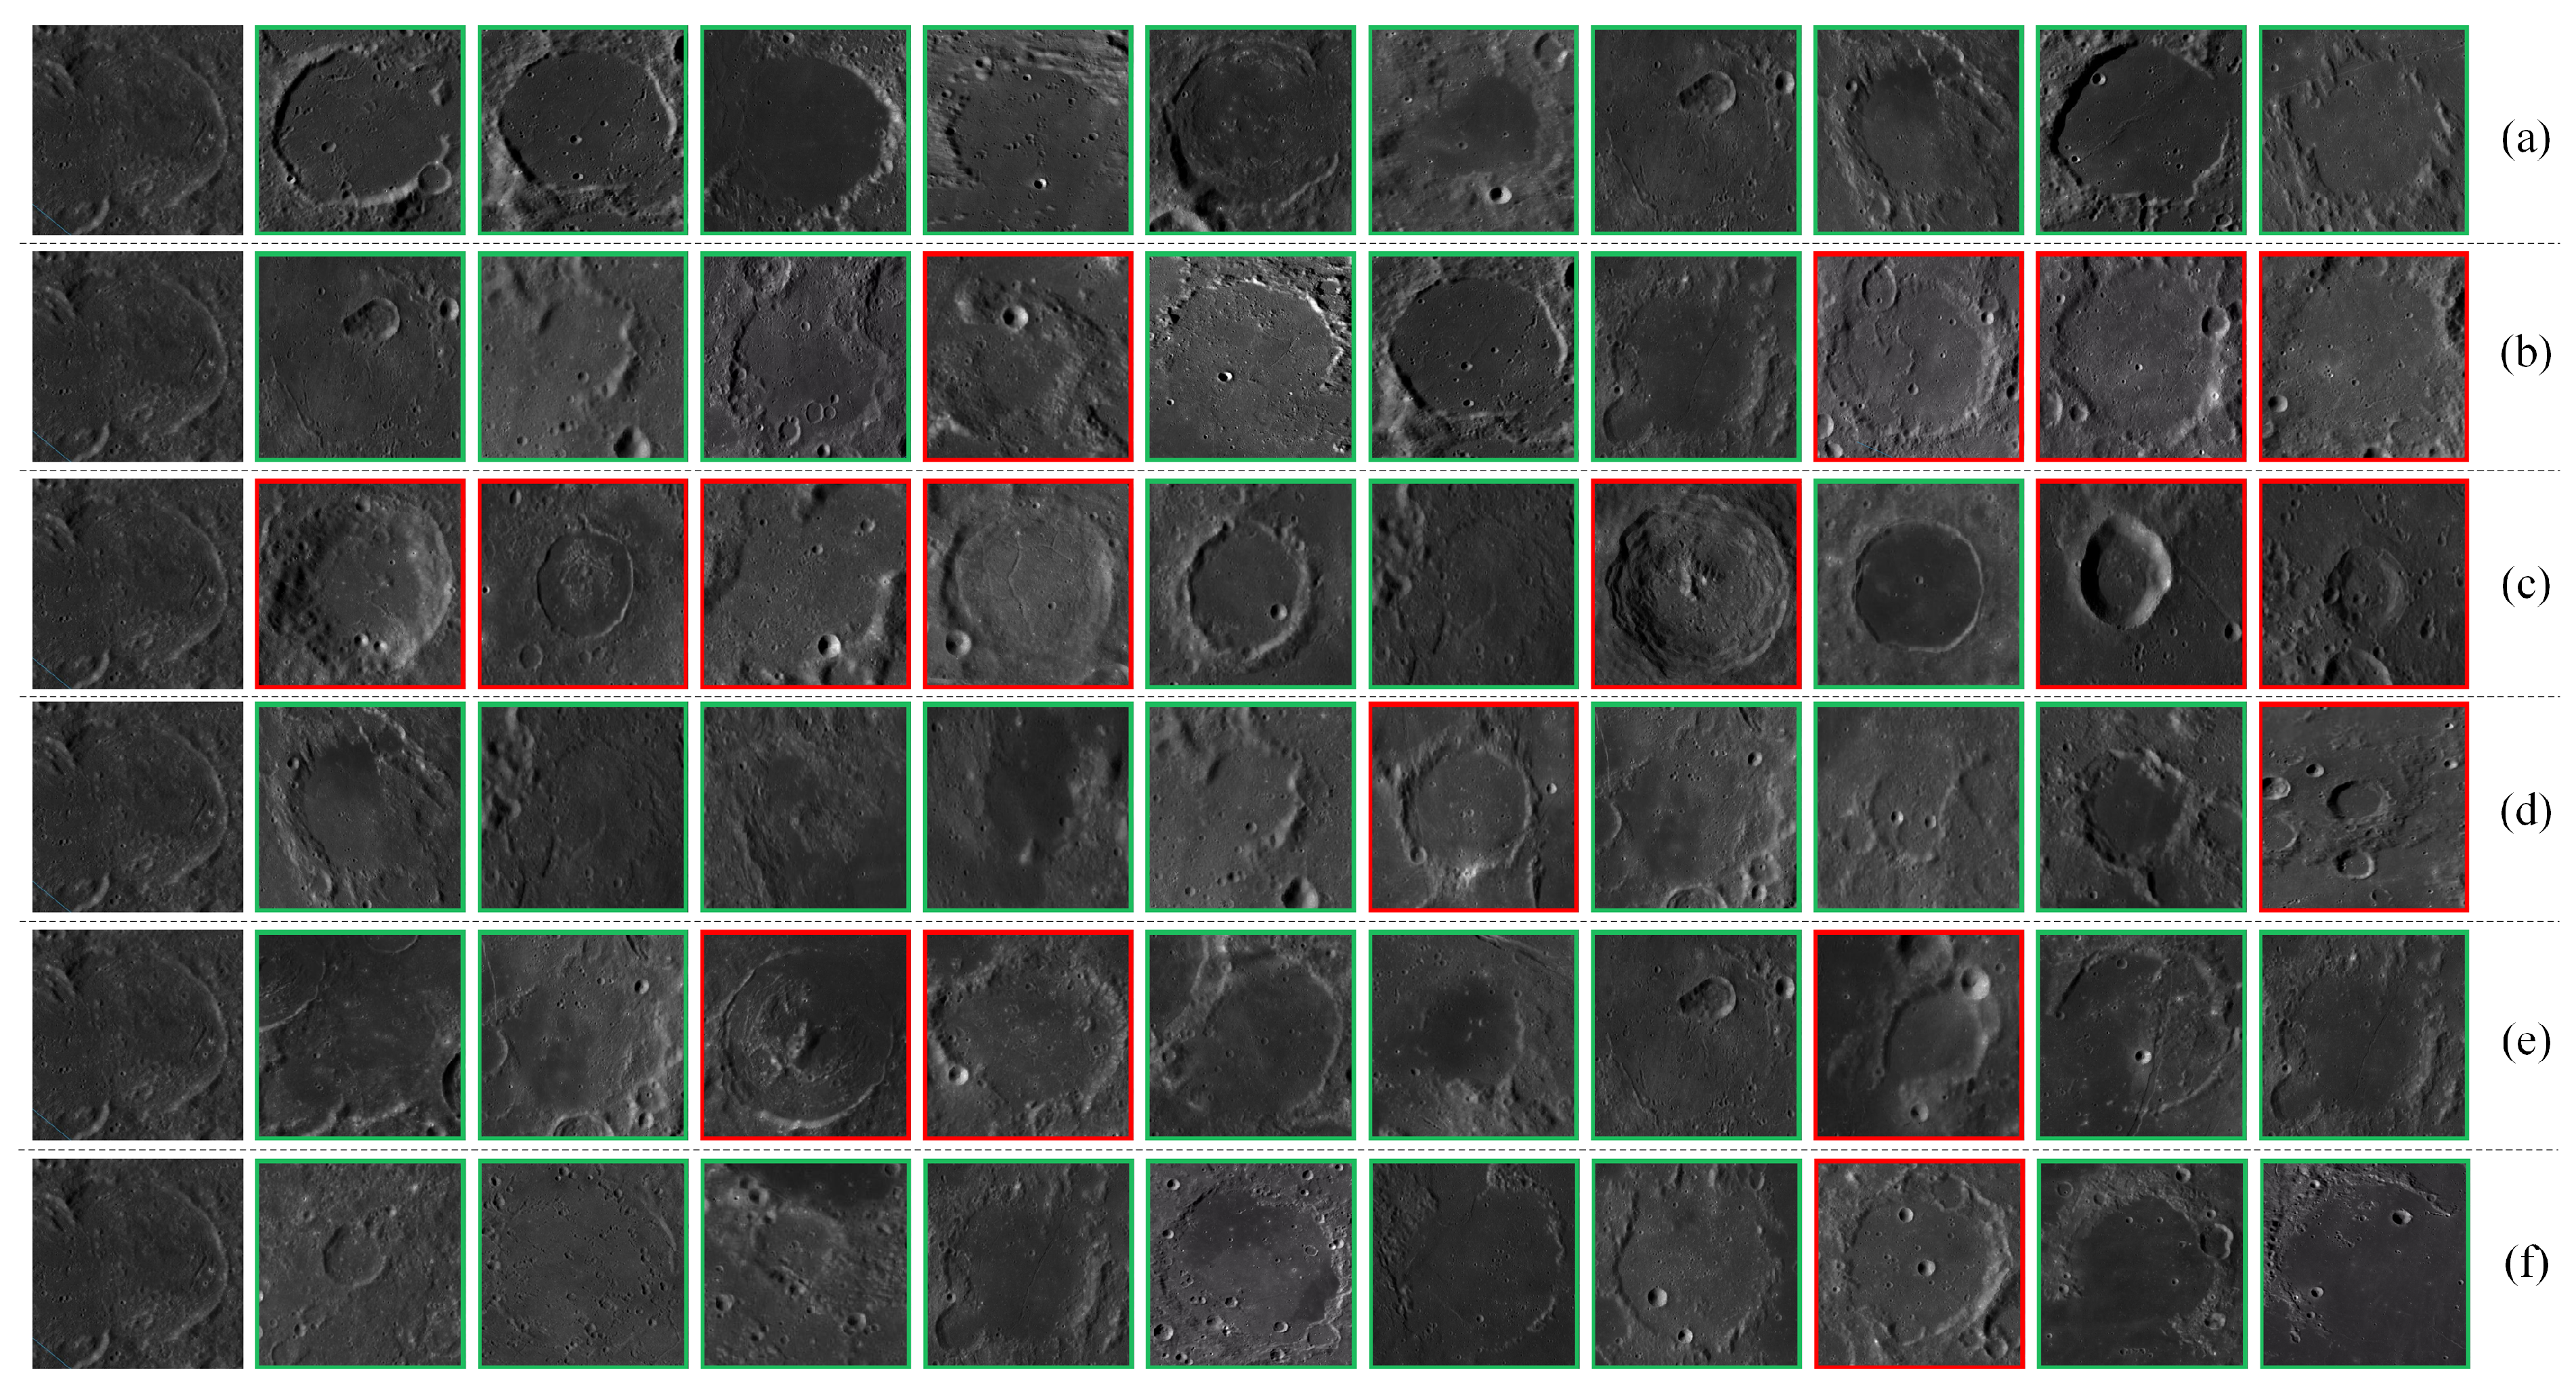
5.2. Comparison of LC2R-Net with Other Methods

To verify the effectiveness of the LC 2 R - Net model and its advantages over traditional methods in the task of complex lunar crater image retrieval, we selected several widely used convolutional neural network models and Transformer models for comparative analysis. These included VGG16 [54], ResNet101 [55], DenseNet121 [56], EfficientnetV2-S [57], and Vision Transformer (ViT) [58]. The dataset, optimization algorithms, loss functions, and hyperparameters during training were consistent with those used for LC 2 R - Net . In LC 2 R - Net , λ was set to 0.2, and features were reduced to 128 dimensions using the PCA method. The augmented dataset was used for training, while the original, unmodified dataset was used for testing. The retrieval precision of each model was compared by calculating the m A P for each category. Table 2 presents a detailed comparison of the performance between LC 2 R - Net and the aforementioned models. The results indicate that LC 2 R - Net achieves better retrieval precision, with the m A P of 83.75%. Compared to VGG16, ResNet101, DenseNet121, EfficientnetV2-S, and Vision Transformer, the m A P of LC 2 R - Net is higher by 32.31%, 39.85%, 30.65%, 26.58%, and 21.52%, respectively. These results further demonstrate the significant advantage of LC 2 R - Net in integrating low-level visual features and deep features for lunar image retrieval, achieving more precise retrieval results compared to methods relying on the deep features of traditional CNN models.
In Table 2, the retrieval accuracy for Multi-Impacted Floor Craters and Impact Residual Craters is significantly lower compared to other categories. The reason is that the features of the crater images in these categories bear a high visual similarity to those of other categories, making it difficult to distinguish between them even with the use of fused features. Nonetheless, in the face of such challenges of feature similarity, the LC 2 R - Net model still demonstrates superior performance compared to traditional convolutional neural network models that rely solely on deep features. This indicates the effectiveness of LC 2 R - Net in integrating multi-level features, particularly in dealing with image categories with high feature similarity, significantly enhancing the accuracy of retrieval. It is noteworthy that among the mentioned convolutional neural networks, EfficientNetV2-S significantly outperforms VGG16, ResNet-101, and DenseNet121. The reason lies in EfficientNetV2-S’s effective balancing of model depth, width, and resolution through scaling methods and the introduction of several novel architectures, thereby preserving more image detail information, which is crucial for retrieval tasks. Furthermore, the Vision Transformer surpasses traditional convolutional neural network models in performance, indicating that models based on self-attention mechanisms can more effectively capture global dependencies, thereby enhancing the model’s generalization capability.
To more visually demonstrate the effectiveness of LC 2 R - Net , Figure 10, Figure 11 and Figure 12 present some retrieval examples. Taking the top 10 returned images as an example, the retrieval results of LC 2 R - Net are shown in Figure 10, and the comparative retrieval results of LC 2 R - Net and other methods are shown in Figure 11 and Figure 12.

5.3. Ablation Study

To evaluate the performance of the LC 2 R - Net model in the task of image retrieval for complex lunar craters, this section conducts ablation experiments on the feature fusion and attention mechanisms within the LC 2 R - Net network. The experiments are carried out on the complex lunar crater dataset constructed for this paper, utilizing m A P and A N M R R as metrics to assess retrieval performance. Table 3 presents the ablation study for the attention mechanism.
Figure 10. Retrieval results of LC 2 R - Net for various crater categories (the first image in each row is the query image, green borders indicate correct retrieval results, and red borders indicate incorrect retrieval results): (a) Simple crater. (b) Floor-fractured crater. (c) Central peak crater. (d) Multi-impacted floor crater. (e) Lunar oceanic remnant impact crater. (f) Impact residual crater.
Electronics 13 01262 g010
Figure 11. Examples of retrieving central peak craters using different methods (the first image in each row is the query image, green borders indicate correct retrieval results, and red borders indicate incorrect retrieval results): (a) LC 2 R - Net . (b) VGG-16. (c) ResNet-101. (d) DenseNet-121. (e) EfficientNetV2-S. (f) ViT.
Electronics 13 01262 g011
Figure 12. Examples of retrieving Lunar Oceanic Remnant Impact Craters using different methods (the first image in each row is the query image, green borders indicate correct retrieval results, and red borders indicate incorrect retrieval results): (a) LC 2 R - Net . (b) VGG-16. (c) ResNet-101. (d) DenseNet-121. (e) EfficientNetV2-S. (f) ViT.
Electronics 13 01262 g012
Table 3. Ablation study on the attention mechanism.
MethodsmAP/%ANMRR
Swin-T83.010.0755
Swin-T + CBAMwithECA83.650.0725
LC 2 R - Net 83.750.0721
As shown in Table 3, the features extracted using the Swin-T network achieve m A P and A N M R R of 83.08% and 0.0755, respectively, on the dataset. By integrating the CBAMwithECA attention module, the model’s m A P is improved by 0.64%, and the A N M R R is reduced by 0.003. These results confirm that the introduction of attention mechanisms can more effectively highlight key features in images, enhance the discrimination ability for images of different categories, and thereby improve the accuracy of lunar complex crater image retrieval tasks.
Ablation studies were conducted on the feature fusion module with the value of λ set to 0.2. The results are shown in Table 4, where LBP represents texture features, and Hu denotes shape features.
The data in Table 4 reveal the limitations of relying solely on visual features for retrieving complex images such as lunar impact craters, resulting in lower image retrieval accuracy. Furthermore, although combining texture (LBP) and shape (Hu) features (LBP + Hu) can improve retrieval performance to some extent, the retrieval accuracy on the complex lunar crater dataset only increased by 1.52% and 11.56%, respectively, when using these features in isolation. However, when deep features were fused, the m A P increased by 43.9% and 53.94%, and the A N M R R decreased by 0.2996 and 0.3343, respectively. It is noteworthy that the contribution of texture features to retrieval performance was greater than that of shape features, which may be due to the high visual similarity of lunar crater images. These results fully demonstrate the effectiveness of fusing deep and visual features in improving image retrieval accuracy.

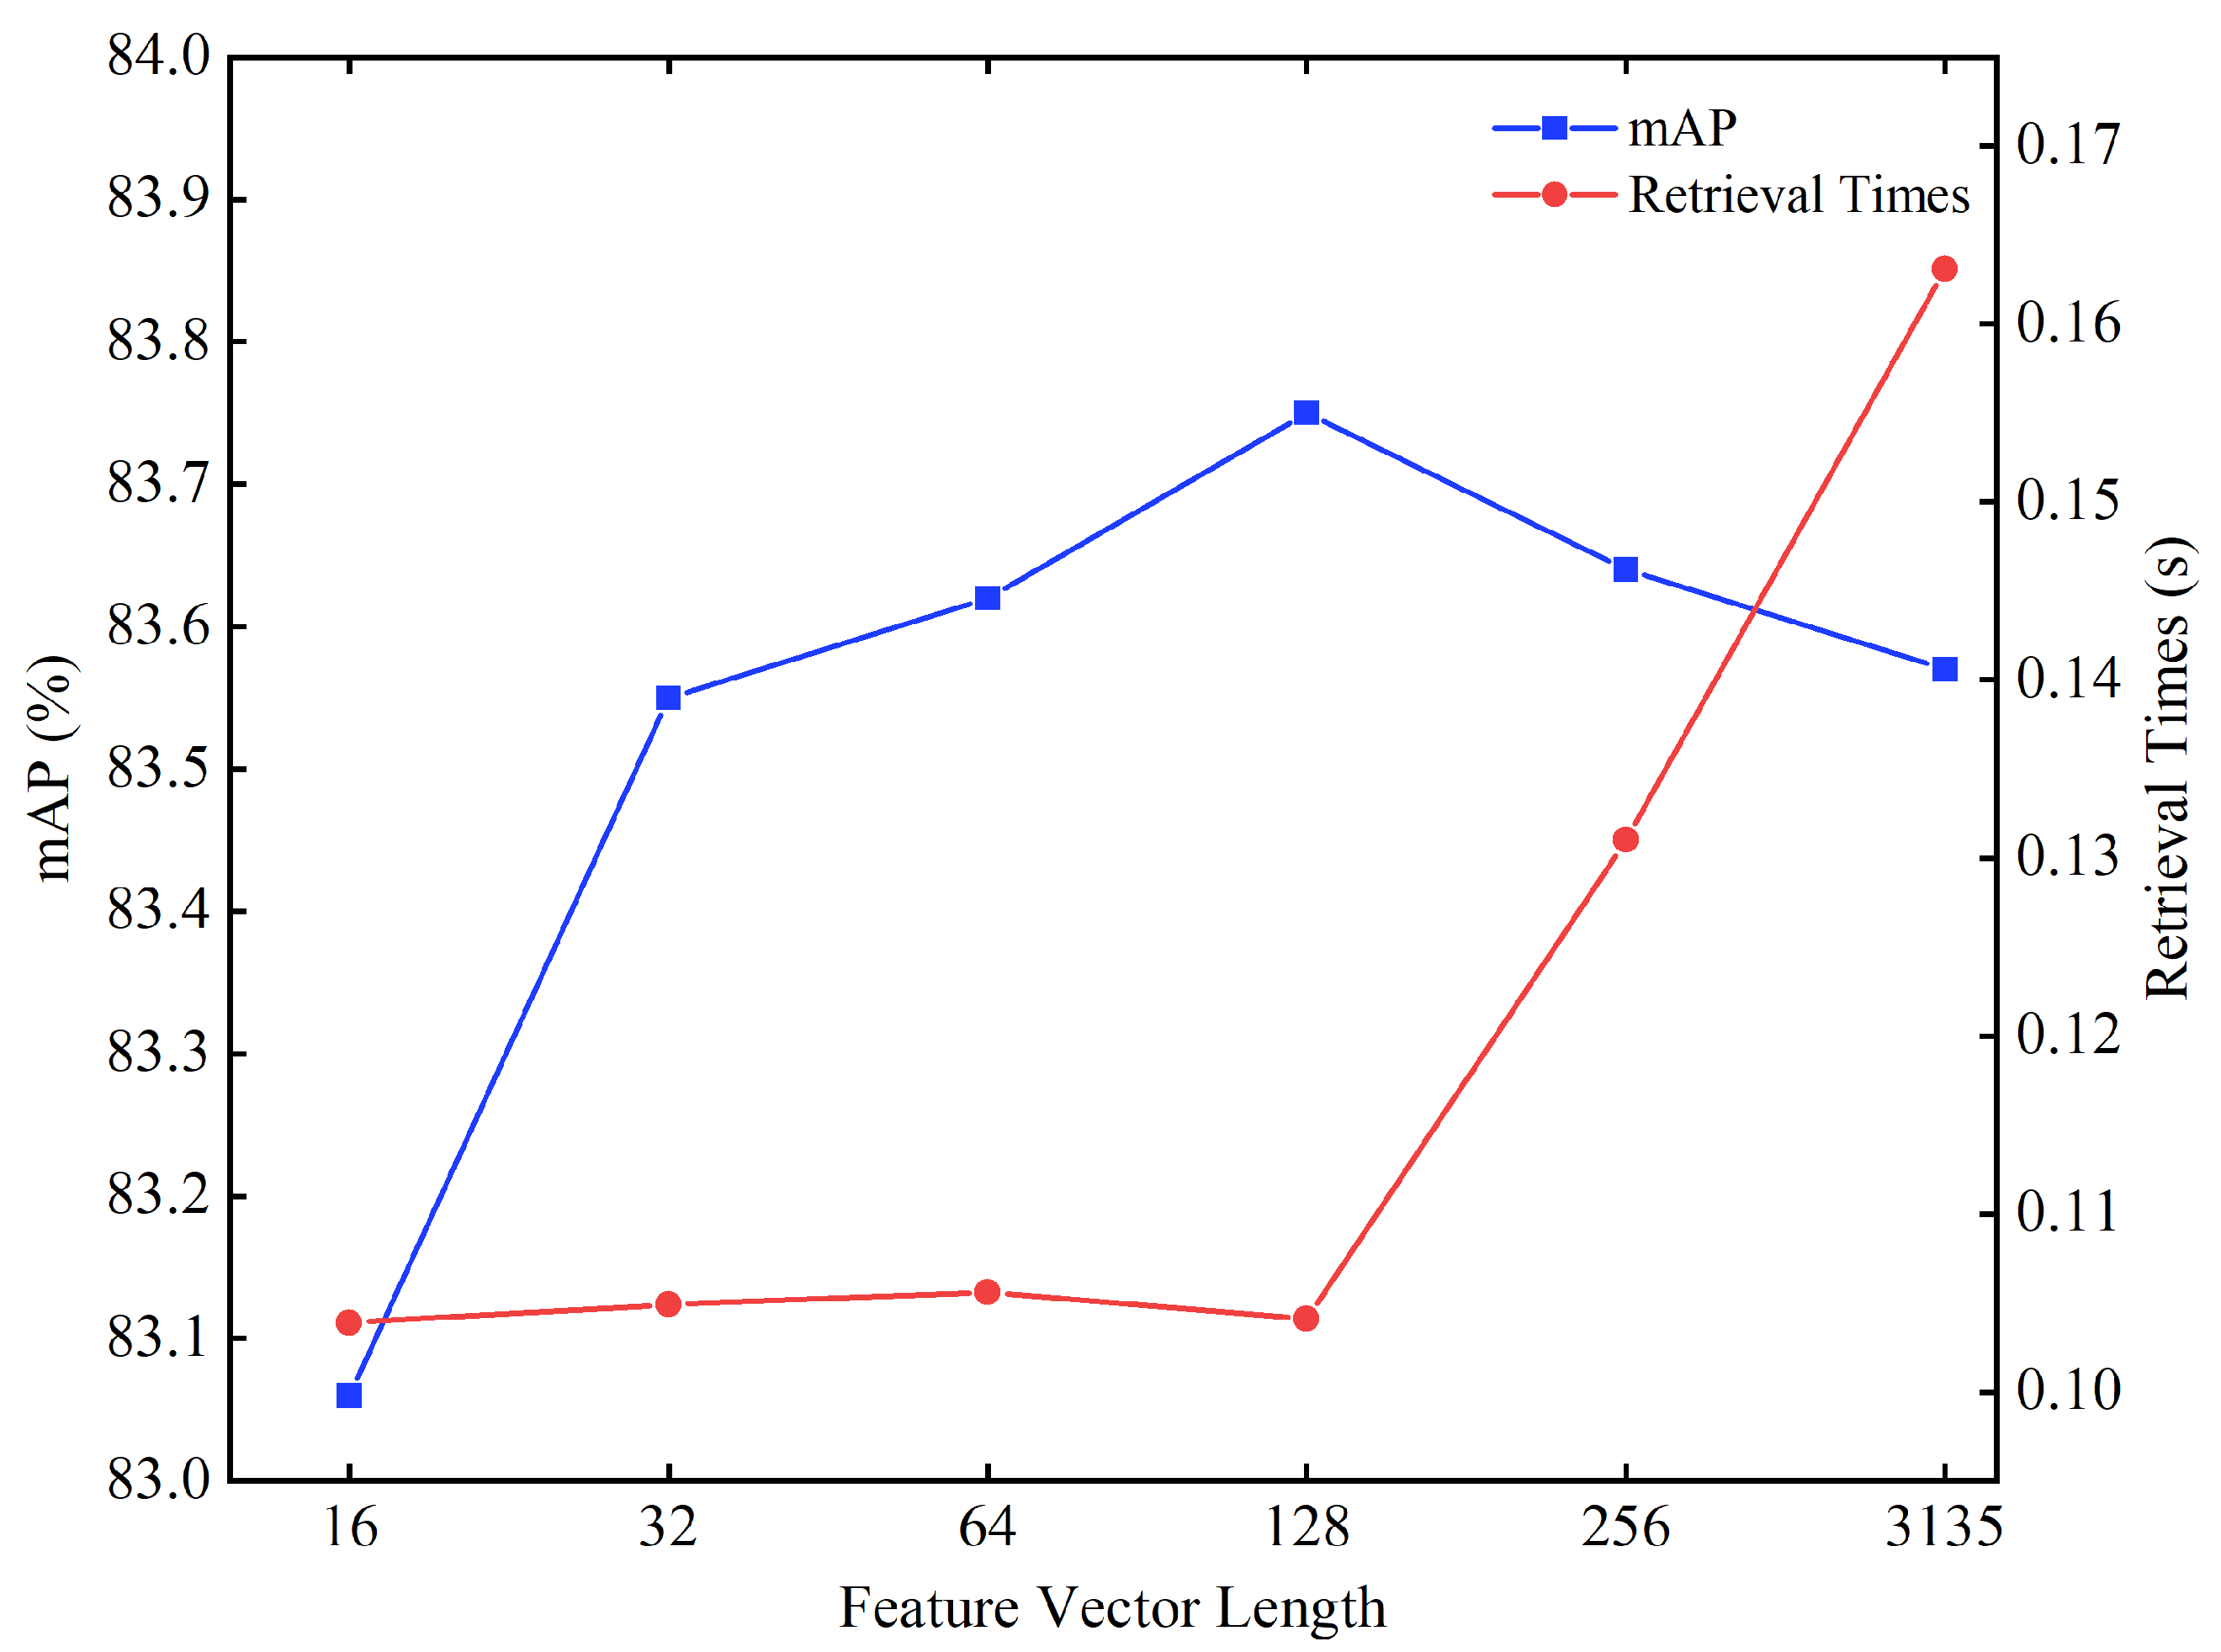
5.4. Parametric Analyses

In the LC 2 R - Net model, the fusion of visual and deep features involves a key parameter λ , which is used to adjust the weight between different features. The specific calculation method is detailed in Section 3.3. This section designs a series of experiments to illustrate the impact of the value of λ on the performance of LC 2 R - Net by adjusting its value (ranging from 0 to 1, with an interval of 0.1). The features are reduced to 128 dimensions using the PCA method, and the results are shown in Table 5.
From Table 5, it is evident that when the value of λ is set to 0.2, the m A P of the LC 2 R - Net in the lunar complex crater dataset reaches 83.75%, with the A N M R R of 0.0721. The retrieval accuracy of the fused features is higher than that of using depth features alone when the value of λ ranges from 0 to 0.3. However, when the value of λ exceeds 0.4, the retrieval accuracy using fused features or visual features alone is lower than that of using depth features alone. This indicates that the depth features extracted by the Swin Transformer are more effective than traditional visual features in performing image retrieval tasks for lunar complex craters.

5.5. Comparison of Retrieval Time

In addition to accuracy, retrieval efficiency is also extremely important in practical applications. To evaluate the performance of different models, we conducted tests on the retrieval time for each model using the lunar complex crater dataset. Each model was subjected to 20 retrieval trials, and the average retrieval time was calculated. The retrieval time consumed by each model is shown in Table 6.
The data in Table 6 indicate that as the dimensionality of deep features is reduced, there is a downward trend in model retrieval time. The incorporation of the CBAMwithECA module results in a slight increase in the retrieval time for the Swin-T model. Among all the models compared, the LC 2 R - Net model, which employs PCA for dimensionality reduction, achieves the shortest retrieval time of only 0.1041 s, performing the best among all models. This result demonstrates that the LC 2 R - Net model successfully reduces the dimensionality and complexity of features while maintaining retrieval efficiency. Additionally, the retrieval time for traditional visual features is also short, which is due to the fact that deep features are denser; even with lower dimensions, they incur greater computational and storage costs compared to sparse visual features. These results highlight the efficiency advantages of the LC 2 R - Net model in the task of lunar crater image retrieval.

5.6. Impact of PCA Dimensionality Reduction on Retrieval Accuracy

The LC 2 R - Net model proposed in this paper initially integrates the low-level visual features with the deep features of lunar crater images to generate a feature vector with 3135 dimensions. Subsequently, to enhance the efficiency of retrieval, PCA is employed for feature dimensionality reduction, enabling more efficient retrieval. Therefore, experiments were conducted with different feature dimensions (16, 32, 64, 128, 256, and the original 3135 dimensions) to observe the impact on retrieval accuracy and retrieval time, with the value of λ set to 0.2. The results are shown in Figure 13.
In Figure 13, the retrieval accuracy peaks at a feature vector dimensionality of 128, with the m A P reaching 83.75%. Within the range of increasing feature dimensions from 16 to 128, the retrieval accuracy consistently improves. This phenomenon indicates that within this range of dimensions, as the richness of feature information increases, the system is able to more accurately distinguish and retrieve lunar crater images. However, when the feature vector dimensionality exceeds 128, the retrieval accuracy begins to decline. This decrease is due to the excessive expansion of the feature space, which introduces redundant information or increases noise, thereby negatively impacting the model’s discriminative ability. When the feature dimensionality is below 128, the retrieval time remains relatively stable, suggesting that at this level of dimensionality, the system’s computational efficiency is less affected by the number of features. In contrast, retrieval time significantly increases when the dimensionality exceeds 128, reflecting the computational burden brought about by higher dimensions. These results demonstrate that the PCA dimensionality reduction technique plays a significant role in enhancing the accuracy and efficiency of lunar crater image retrieval.

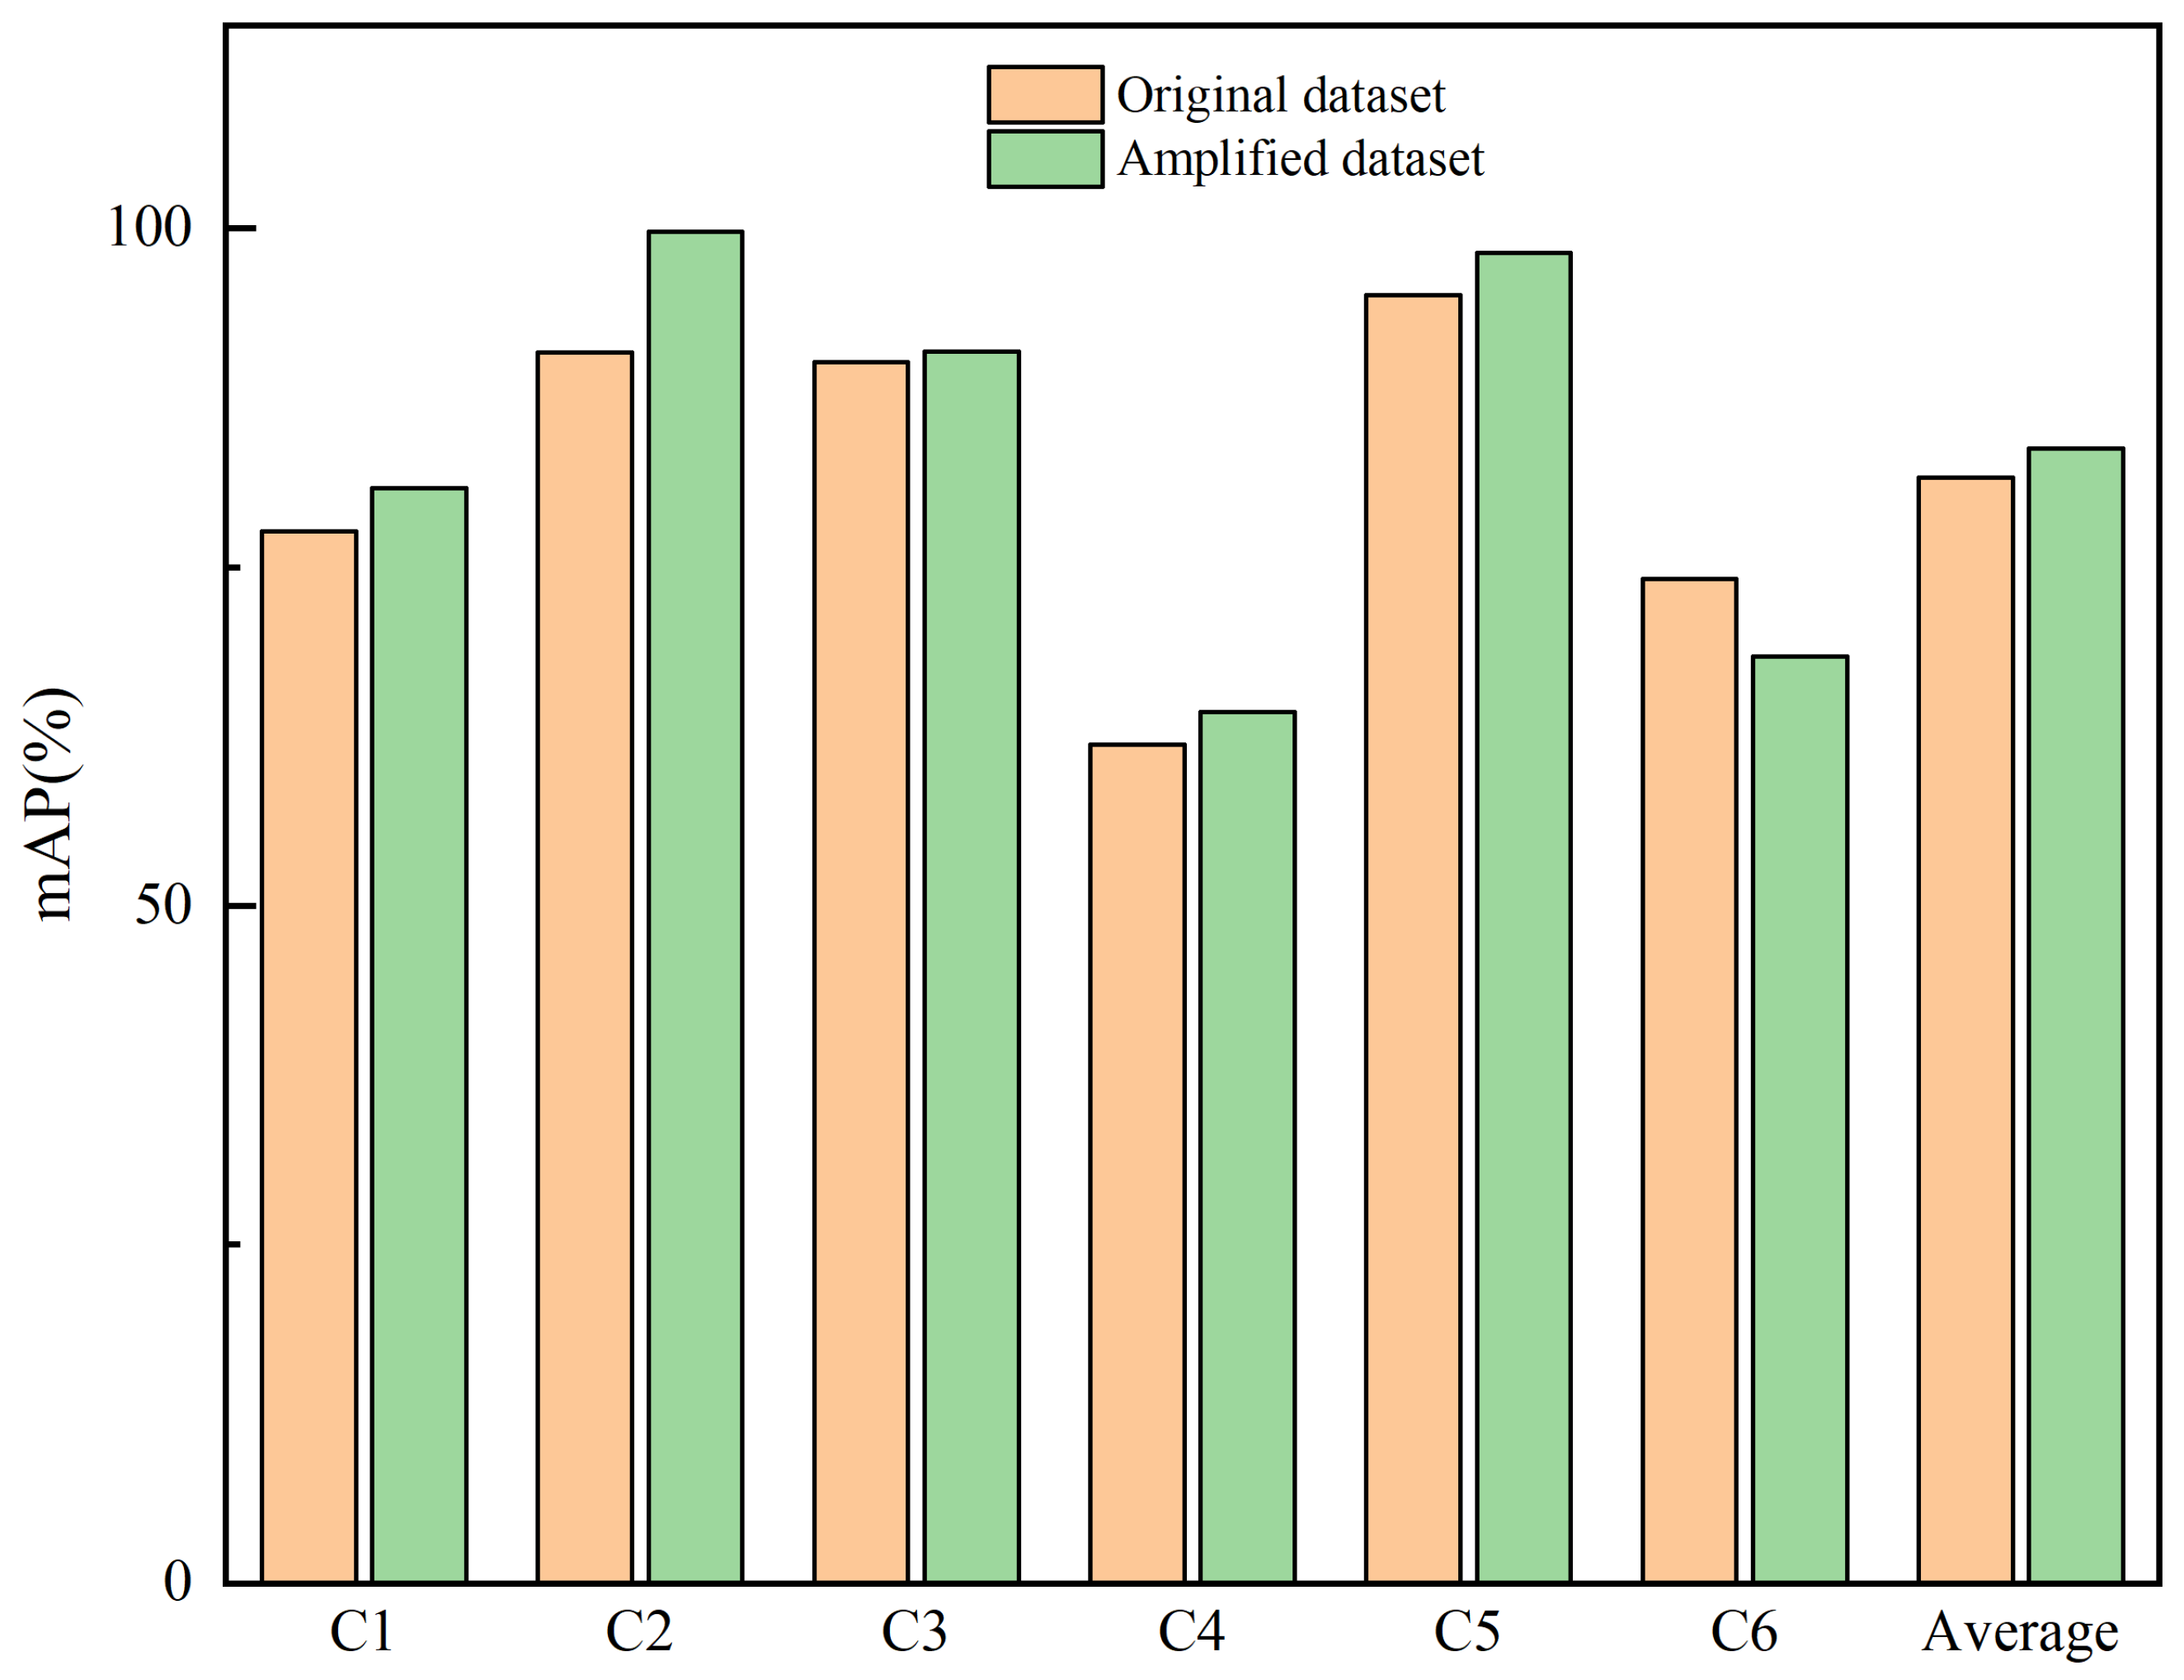
5.7. The Impact of Data Augmentation on Retrieval Accuracy

In this study, we address the challenge of imbalanced class distribution within our dataset of lunar impact craters, a factor that may lead to overfitting of certain classes by the neural network during the training process. To mitigate this issue, we have employed data augmentation algorithms to expand our dataset and enhance the model’s generalization capabilities. To assess the specific impact of data augmentation on the performance of lunar impact crater image retrieval, we conducted model training on both the original dataset and the augmented dataset. Throughout the training process, to ensure comparability of results, we maintained consistency in our algorithmic optimization strategies, loss function, and hyperparameter settings. For LC 2 R - Net , the λ was set to 0.2, and feature dimensionality was reduced to 128 dimensions using the PCA method. The experimental results are presented in Figure 14.
In Figure 14, it is observed that when the model is trained on the augmented dataset, its performance on the retrieval task is significantly superior to that of the model trained directly on the original dataset. Specifically, the m A P saw a notable increase, improving from 81.63% on the original dataset to 83.75%. This enhancement is reflected not only at a global average level but also across the majority of individual classes, indicating the universality of data augmentation in boosting model performance. However, it is important to note that for the specific category of impact residual crater, the m A P of the model trained on the augmented dataset was actually lower than that of the model trained on the original dataset. This phenomenon suggests that data augmentation does not invariably lead to positive effects. The performance decline in this particular category is attributed to the failure to consider its unique characteristics during augmentation, which hindered the model’s ability to effectively discern the differences between impact residual craters and other categories. Therefore, when implementing data augmentation, it is crucial to adopt targeted strategies for different categories to ensure that data augmentation effectively enhances the model’s learning and recognition of the distinctions between categories rather than merely increasing the quantity of data.

5.8. Further Discussion

In this study, in order to enhance the model’s capability to capture and represent the features of lunar complex crater images, we utilized the CBAMwithECA attention mechanism module during deep feature extraction. To discuss the impact of different attention modules on feature extraction and image retrieval tasks, we conducted comparative experiments by introducing the SE attention mechanism module and the CBAM attention mechanism module at the same position, respectively. The experimental results are shown in Table 7.
As shown in Table 7, the introduction of the SE module and the CBAM module into the Swin-T model did not enhance the model’s performance. On the contrary, the addition of these attention mechanisms had a negative impact on the performance of the original Swin-T model. However, upon integrating the CBAMwithECA attention module, the model’s performance saw a significant improvement, with the m A P increasing by 0.64% and the A N M R R decreased by 0.003. It is noteworthy that, in comparison to the attention modules, the SE module outperformed the CBAM module because the SE module provided a more effective feature weighting strategy in channel recalibration. These results indicate that the CBAMwithECA attention module outperforms both the SE and CBAM attention modules in the task of lunar crater image retrieval.
The experimental results adequately substantiate the efficacy of the method we proposed. By integrating the CBAMwithECA module into both the patch embedding and merging modules, LC 2 R - Net is enabled to capture image details with greater finesse, markedly boosting the model’s capability in feature recognition and extraction when dealing with complex crater imagery. Furthermore, we employed a weighted strategy to merge visual and depth features, which not only facilitated an effective complementarity between the two but also accentuated their individual significance. Concurrently, the introduction of a triplet loss function and a hard negative sample mining strategy further encouraged the network to learn more distinctive feature representations, thereby realizing a significant improvement in precision for image retrieval tasks. These results demonstrate that our approach can substantially enhance the model’s ability to learn and extract features, significantly improving the accuracy of image retrieval for complex lunar crater imagery.

6. Conclusions

In this paper, we propose the LC 2 R - Net model, which achieves lunar complex crater image retrieval by fusing the underlying visual features with deep features of images. During the model training phase, we employed a triplet loss function and a hard negative sample mining strategy to generate more distinctive features. In the deep feature extraction stage, we integrated the CBAMwithECA module into the Swin Transformer, successfully capturing the rich details and significant information in lunar crater images, thus enabling better differentiation between different types of lunar complex crater images. In the visual feature extraction stage, we extracted texture and shape features, which effectively complement the deep features. During the feature fusion stage, we introduced feature fusion weights to highlight the importance of different features in retrieval and performed PCA dimensionality reduction after feature fusion, significantly improving the model’s retrieval efficiency. We conducted extensive experiments on the lunar complex crater dataset generated in this paper, and the results show that compared to traditional deep learning methods, LC 2 R - Net achieved the highest retrieval accuracy of 83.75% when the feature fusion weight was set to 0.2 and PCA dimensionality was reduced to 128 while maintaining a fast retrieval speed. Through ablation experiments, we detailed the key role of the CBAMwithECA module and the feature fusion strategy in improving retrieval performance. We explored the impact of different dimensionality reductions on retrieval performance and found that the setting of 128 dimensions offered the best retrieval performance. In addition, we compared the effects of different attention mechanisms on retrieval results, and the experiments proved that the CBAMwithECA attention module performed the best in this study. The LC 2 R - Net model not only advances the technology of lunar crater image retrieval but also provides a new perspective for the application of deep learning in the analysis of complex geological images.
In future work, we will consider adopting deep hashing techniques to replace PCA dimensionality reduction to further optimize the precision and efficiency of image retrieval. Secondly, we will explore the feasibility of applying our method to video stream processing. Although current research focuses on single image frames, our proposed network architecture and algorithms can be extended through time series analysis to handle consecutive frames within video streams. This will involve additional training of the network to adapt to dynamic changes. Lastly, we plan to combine object detection methods with image retrieval techniques to explore the detection of different types of impact craters within single image frames to address more realistic application scenarios.

Author Contributions

Y.Z. analyzed the data and wrote the Python source code. Z.K. and Z.C. helped with project and study design, paper writing, and data analysis. All authors have read and agreed to the published version of the manuscript.

Funding

This research received no external funding.

Data Availability Statement

The data used to support the findings of this study are available from the corresponding author upon request.

Conflicts of Interest

The authors declare no conflicts of interest.

References

  1. Hartmann, W.K. Lunar cratering chronology. Icarus 1970, 13, 299–301. [Google Scholar] [CrossRef]
  2. Ryder, G. Mass flux in the ancient Earth-Moon system and benign implications for the origin of life on Earth. J. Geophys. Res. Planets 2002, 107, 6–11. [Google Scholar] [CrossRef]
  3. Chapman, C.R.; Cohen, B.A.; Grinspoon, D.H. What are the real constraints on the existence and magnitude of the late heavy bombardment? Icarus 2007, 189, 233–245. [Google Scholar] [CrossRef]
  4. Bottke, W.F.; Norman, M.D. The late heavy bombardment. Annu. Rev. Earth Planet. Sci. 2017, 45, 619–647. [Google Scholar] [CrossRef]
  5. Chen, M.; Lin, H.; Wen, Y.; He, L.; Hu, M. Sino-VirtualMoon: A 3D web platform using Chang’e-1 data for collaborative research. Planet. Space Sci. 2012, 65, 130–136. [Google Scholar] [CrossRef]
  6. Di, K.; Li, W.; Yue, Z.; Sun, Y.; Liu, Y. A machine learning approach to crater detection from topographic data. Adv. Space Res. 2014, 54, 2419–2429. [Google Scholar] [CrossRef]
  7. Sawabe, Y.; Matsunaga, T.; Rokugawa, S. Automated detection and classification of lunar craters using multiple approaches. Adv. Space Res. 2006, 37, 21–27. [Google Scholar] [CrossRef]
  8. Vijayan, S.; Vani, K.; Sanjeevi, S. Crater detection, classification and contextual information extraction in lunar images using a novel algorithm. Icarus 2013, 226, 798–815. [Google Scholar] [CrossRef]
  9. Yang, C.; Zhao, H.; Bruzzone, L.; Benediktsson, J.A.; Liang, Y.; Liu, B.; Zeng, X.; Guan, R.; Li, C.; Ouyang, Z. Lunar impact crater identification and age estimation with Chang’E data by deep and transfer learning. Nat. Commun. 2020, 11, 6358. [Google Scholar] [CrossRef]
  10. Meyer, C.; Deans, M. Content based retrieval of images for planetary exploration. In Proceedings of the 2007 IEEE/RSJ International Conference on Intelligent Robots and Systems, San Diego, CA, USA, 29 October–2 November 2007; pp. 1377–1382. [Google Scholar]
  11. Chen, H.Z.; Jing, N.; Wang, J.; Chen, Y.G.; Chen, L. A novel saliency detection method for lunar remote sensing images. IEEE Geosci. Remote Sens. Lett. 2013, 11, 24–28. [Google Scholar] [CrossRef]
  12. Hua, K.A.; Shaykhian, G.A.; Beil, R.J.; Akpinar, K.; Martin, K.A. Saliency-based CBIR system for exploring lunar surface imagery. In Proceedings of the 2014 ASEE Annual Conference & Exposition, Indianapolis, Indiana, USA, 15–18 June 2014; pp. 24–1065. [Google Scholar]
  13. Tombe, R.; Viriri, S. Adaptive deep co-occurrence feature learning based on classifier-fusion for remote sensing scene classification. IEEE J. Sel. Top. Appl. Earth Obs. Remote Sens. 2020, 14, 155–164. [Google Scholar] [CrossRef]
  14. Zhang, Z.; Jiang, T.; Liu, C.; Zhang, L. An effective classification method for hyperspectral image with very high resolution based on encoder–decoder architecture. IEEE J. Sel. Top. Appl. Earth Obs. Remote Sens. 2020, 14, 1509–1519. [Google Scholar] [CrossRef]
  15. Zhang, Y.; Zheng, X.; Yuan, Y.; Lu, X. Attribute-cooperated convolutional neural network for remote sensing image classification. IEEE Trans. Geosci. Remote Sens. 2020, 58, 8358–8371. [Google Scholar] [CrossRef]
  16. Li, Y.; Zhang, Y.; Huang, X.; Zhu, H.; Ma, J. Large-scale remote sensing image retrieval by deep hashing neural networks. IEEE Trans. Geosci. Remote Sens. 2017, 56, 950–965. [Google Scholar] [CrossRef]
  17. Napoletano, P. Visual descriptors for content-based retrieval of remote-sensing images. Int. J. Remote Sens. 2018, 39, 1343–1376. [Google Scholar] [CrossRef]
  18. Ye, F.; Xiao, H.; Zhao, X.; Dong, M.; Luo, W.; Min, W. Remote sensing image retrieval using convolutional neural network features and weighted distance. IEEE Geosci. Remote Sens. Lett. 2018, 15, 1535–1539. [Google Scholar] [CrossRef]
  19. Yan, K.; Wang, Y.; Liang, D.; Huang, T.; Tian, Y. Cnn vs. sift for image retrieval: Alternative or complementary? In Proceedings of the 24th ACM international conference on Multimedia, Amsterdam, The Netherlands, 15–19 October 2016; pp. 407–411. [Google Scholar]
  20. Cheng, Q.; Shao, K.; Li, C.; Li, S.; Li, J.; Shao, Z. A distributed system architecture for high-resolution remote sensing image retrieval by combining deep and traditional features. In Proceedings of the Image and Signal Processing for Remote Sensing XXIV, Berlin, Germany, 10–13 September 2018; Volume 10789, pp. 413–432. [Google Scholar]
  21. Zhang, M.; Cheng, Q.; Luo, F.; Ye, L. A triplet nonlocal neural network with dual-anchor triplet loss for high-resolution remote sensing image retrieval. IEEE J. Sel. Top. Appl. Earth Obs. Remote Sens. 2021, 14, 2711–2723. [Google Scholar] [CrossRef]
  22. Cao, R.; Zhang, Q.; Zhu, J.; Li, Q.; Li, Q.; Liu, B.; Qiu, G. Enhancing remote sensing image retrieval using a triplet deep metric learning network. Int. J. Remote Sens. 2020, 41, 740–751. [Google Scholar] [CrossRef]
  23. Liu, Y.; Ding, L.; Chen, C.; Liu, Y. Similarity-based unsupervised deep transfer learning for remote sensing image retrieval. IEEE Trans. Geosci. Remote Sens. 2020, 58, 7872–7889. [Google Scholar] [CrossRef]
  24. Zhang, Y.; Zheng, X.; Lu, X. Remote Sensing Image Retrieval by Deep Attention Hashing With Distance-Adaptive Ranking. IEEE J. Sel. Top. Appl. Earth Obs. Remote Sens. 2023, 16, 4301–4311. [Google Scholar] [CrossRef]
  25. Ding, C.; Wang, M.; Zhou, Z.; Huang, T.; Wang, X.; Li, J. Siamese transformer network-based similarity metric learning for cross-source remote sensing image retrieval. Neural Comput. Appl. 2023, 35, 8125–8142. [Google Scholar] [CrossRef]
  26. Cheng, G.; Li, Z.; Han, J.; Yao, X.; Guo, L. Exploring hierarchical convolutional features for hyperspectral image classification. IEEE Trans. Geosci. Remote Sens. 2018, 56, 6712–6722. [Google Scholar] [CrossRef]
  27. Chaudhuri, U.; Dey, S.; Datcu, M.; Banerjee, B.; Bhattacharya, A. Interband retrieval and classification using the multilabeled sentinel-2 bigearthnet archive. IEEE J. Sel. Top. Appl. Earth Obs. Remote Sens. 2021, 14, 9884–9898. [Google Scholar] [CrossRef]
  28. Li, Y.; Zhang, Y.; Huang, X.; Yuille, A.L. Deep networks under scene-level supervision for multi-class geospatial object detection from remote sensing images. ISPRS J. Photogramm. Remote Sens. 2018, 146, 182–196. [Google Scholar] [CrossRef]
  29. Cheng, G.; Li, Q.; Wang, G.; Xie, X.; Min, L.; Han, J. SFRNet: Fine-Grained Oriented Object Recognition via Separate Feature Refinement. IEEE Trans. Geosci. Remote Sens. 2023, 61, 5610510. [Google Scholar] [CrossRef]
  30. Liu, Z.; Lin, Y.; Cao, Y.; Hu, H.; Wei, Y.; Zhang, Z.; Lin, S.; Guo, B. Swin transformer: Hierarchical vision transformer using shifted windows. In Proceedings of the IEEE/CVF International Conference on Computer Vision, Montreal, BC, Canada, 11–17 October 2021; pp. 10012–10022. [Google Scholar]
  31. Lin, A.; Chen, B.; Xu, J.; Zhang, Z.; Lu, G.; Zhang, D. Ds-transunet: Dual swin transformer u-net for medical image segmentation. IEEE Trans. Instrum. Meas. 2022, 71, 4005615. [Google Scholar] [CrossRef]
  32. Ma, J.; Tang, L.; Fan, F.; Huang, J.; Mei, X.; Ma, Y. SwinFusion: Cross-domain long-range learning for general image fusion via swin transformer. IEEE/CAA J. Autom. Sin. 2022, 9, 1200–1217. [Google Scholar] [CrossRef]
  33. He, X.; Zhou, Y.; Zhao, J.; Zhang, D.; Yao, R.; Xue, Y. Swin transformer embedding UNet for remote sensing image semantic segmentation. IEEE Trans. Geosci. Remote Sens. 2022, 60, 4408715. [Google Scholar] [CrossRef]
  34. Gao, L.; Liu, H.; Yang, M.; Chen, L.; Wan, Y.; Xiao, Z.; Qian, Y. STransFuse: Fusing swin transformer and convolutional neural network for remote sensing image semantic segmentation. IEEE J. Sel. Top. Appl. Earth Obs. Remote Sens. 2021, 14, 10990–11003. [Google Scholar] [CrossRef]
  35. Liu, Z.; Tan, Y.; He, Q.; Xiao, Y. SwinNet: Swin transformer drives edge-aware RGB-D and RGB-T salient object detection. IEEE Trans. Circuits Syst. Video Technol. 2021, 32, 4486–4497. [Google Scholar] [CrossRef]
  36. Tekeste, I.; Demir, B. Advanced local binary patterns for remote sensing image retrieval. In Proceedings of the IGARSS 2018-2018 IEEE International Geoscience and Remote Sensing Symposium, Valencia, Spain, 22–27 July 2018; pp. 6855–6858. [Google Scholar]
  37. Aptoula, E. Remote sensing image retrieval with global morphological texture descriptors. IEEE Trans. Geosci. Remote Sens. 2013, 52, 3023–3034. [Google Scholar] [CrossRef]
  38. Xie, G.; Guo, B.; Huang, Z.; Zheng, Y.; Yan, Y. Combination of dominant color descriptor and Hu moments in consistent zone for content based image retrieval. IEEE Access 2020, 8, 146284–146299. [Google Scholar] [CrossRef]
  39. Chen, H.z.; Jing, N.; Wang, J.; Chen, Y.g.; Chen, L. Content Based Retrieval for Lunar Exploration Image Databases. In Proceedings of the Database Systems for Advanced Applications: 18th International Conference, DASFAA 2013, Wuhan, China, 22–25 April 2013; Proceedings, Part II 18. Springer: Berlin/Heidelberg, Germany, 2013; pp. 259–266. [Google Scholar]
  40. Wang, S.; Hou, D.; Xing, H. A novel multi-attention fusion network with dilated convolution and label smoothing for remote sensing image retrieval. Int. J. Remote Sens. 2022, 43, 1306–1322. [Google Scholar] [CrossRef]
  41. Ye, F.; Chen, S.; Meng, X.; Xin, J. Query-adaptive feature fusion base on convolutional neural networks for remote sensing image retrieval. In Proceedings of the 2021 International Conference on Digital Society and Intelligent Systems (DSInS), Chengdu, China, 3–4 December 2021; pp. 148–151. [Google Scholar]
  42. Wang, H.; Zhou, Z.; Zong, H.; Miao, L. Wide-context attention network for remote sensing image retrieval. IEEE Geosci. Remote Sens. Lett. 2020, 18, 2082–2086. [Google Scholar] [CrossRef]
  43. Chaudhuri, U.; Banerjee, B.; Bhattacharya, A.; Datcu, M. Attention-driven graph convolution network for remote sensing image retrieval. IEEE Geosci. Remote Sens. Lett. 2021, 19, 8019705. [Google Scholar] [CrossRef]
  44. Zhong, W.; Jiang, J.; Ma, Y. L2AMF-Net: An L2-Normed Attention and Multi-Scale Fusion Network for Lunar Image Patch Matching. Remote Sens. 2022, 14, 5156. [Google Scholar] [CrossRef]
  45. Fan, L.; Zhao, H.; Zhao, H. Global optimization: Combining local loss with result ranking loss in remote sensing image retrieval. IEEE Trans. Geosci. Remote Sens. 2020, 59, 7011–7026. [Google Scholar] [CrossRef]
  46. Zhao, H.; Yuan, L.; Zhao, H. Similarity retention loss (SRL) based on deep metric learning for remote sensing image retrieval. ISPRS Int. J. Geo-Inf. 2020, 9, 61. [Google Scholar] [CrossRef]
  47. Fan, L.; Zhao, H.; Zhao, H. Distribution consistency loss for large-scale remote sensing image retrieval. Remote Sens. 2020, 12, 175. [Google Scholar] [CrossRef]
  48. Ojala, T.; Pietikäinen, M.; Harwood, D. A comparative study of texture measures with classification based on featured distributions. Pattern Recognit. 1996, 29, 51–59. [Google Scholar] [CrossRef]
  49. Hu, M.K. Visual pattern recognition by moment invariants. IRE Trans. Inf. Theory 1962, 8, 179–187. [Google Scholar]
  50. Zhu, L.; Geng, X.; Li, Z.; Liu, C. Improving YOLOv5 with attention mechanism for detecting boulders from planetary images. Remote Sens. 2021, 13, 3776. [Google Scholar] [CrossRef]
  51. Wang, Q.; Wu, B.; Zhu, P.; Li, P.; Zuo, W.; Hu, Q. ECA-Net: Efficient channel attention for deep convolutional neural networks. In Proceedings of the IEEE/CVF Conference on Computer Vision and Pattern Recognition, Seattle, WA, USA, 13–19 June 2020; pp. 11534–11542. [Google Scholar]
  52. Woo, S.; Park, J.; Lee, J.Y.; Kweon, I.S. Cbam: Convolutional block attention module. In Proceedings of the European conference on computer vision (ECCV), Munich, Germany, 8–14 September 2018; pp. 3–19. [Google Scholar]
  53. Balntas, V.; Riba, E.; Ponsa, D.; Mikolajczyk, K. Learning local feature descriptors with triplets and shallow convolutional neural networks. Bmvc 2016, 1, 3. [Google Scholar]
  54. Simonyan, K.; Zisserman, A. Very deep convolutional networks for large-scale image recognition. arXiv 2014, arXiv:1409.1556. [Google Scholar]
  55. He, K.; Zhang, X.; Ren, S.; Sun, J. Deep residual learning for image recognition. In Proceedings of the IEEE Conference on Computer Vision and Pattern Recognition, Las Vegas, NV, USA, 27–30 June 2016; pp. 770–778. [Google Scholar]
  56. Huang, G.; Liu, Z.; Van Der Maaten, L.; Weinberger, K.Q. Densely connected convolutional networks. In Proceedings of the IEEE Conference on Computer Vision and Pattern Recognition, Honolulu, HI, USA, 21–26 July 2017; pp. 4700–4708. [Google Scholar]
  57. Tan, M.; Le, Q. Efficientnetv2: Smaller models and faster training. In Proceedings of the International Conference on Machine Learning, Virtual, 18–24 July 2021; pp. 10096–10106. [Google Scholar]
  58. Dosovitskiy, A.; Beyer, L.; Kolesnikov, A.; Weissenborn, D.; Zhai, X.; Unterthiner, T.; Dehghani, M.; Minderer, M.; Heigold, G.; Gelly, S.; et al. An image is worth 16x16 words: Transformers for image recognition at scale. arXiv 2020, arXiv:2010.11929. [Google Scholar]
Figure 1. Image retrieval framework for lunar complex crater images based on the LC 2 R - Net .
Electronics 13 01262 g001
Figure 2. Schematic diagram of the Patch Partition operation.
Electronics 13 01262 g002
Figure 3. Schematic diagram of the Patch Merging operation.
Electronics 13 01262 g003
Figure 4. Swin Transformer Block.
Electronics 13 01262 g004
Figure 5. ECA channel attention module.
Electronics 13 01262 g005
Figure 6. CBAM spatial attention module.
Electronics 13 01262 g006
Figure 7. Insertion of the CBAMwithECA module into the linear embedding module.
Electronics 13 01262 g007
Figure 8. Insertion of the CBAMwithECA module into the patch merging module.
Electronics 13 01262 g008
Figure 9. Images of six different types of impact crater samples: simple craters, floor-fractured craters, central peak craters, multi-impacted floor craters, lunar oceanic remnant impact craters, and impact residual craters.
Electronics 13 01262 g009
Figure 13. The impact of feature dimensions on the retrieval of lunar complex crater images.
Electronics 13 01262 g013
Figure 14. The impact of image augmentation algorithms on the retrieval of lunar complex craters. C1: Simple crater. C2: Floor-fractured crater. C3: Central peak crater. C4: Multi-impacted floor crater. C5: Lunar oceanic remnant impact crater. C6: Impact residual crater.
Electronics 13 01262 g014
Table 1. Experimental parameter configuration.
Parameter NameParameter Configuration
Initial learning rate 5 × 10 6
Weight decay 1 × 10 5
Margin α 2
Training epochs25
Table 2. Mean average precision by category on the lunar complex crater dataset for different methods.
CategoryMethods
VGG16ResNet101DenseNet121EfficientnetV2-SViTLC2R-Net
Simple Crater 55.33 % 54.99 % 58.73 % 63.77 % 61.91 % 80.82 %
Floor-Fractured Crater 31.32 % 24.05 % 53.51 % 42.08 % 55.33 % 99.77 %
Central Peak Crater 50.80 % 43.83 % 47.06 % 58.33 % 52.87 % 70.52 %
Multi-Impacted Floor Crater 43.50 % 38.99 % 41.88 % 45.44 % 46.08 % 64.32 %
Lunar Oceanic Remnant Impact Crater 80.62 % 59.98 % 73.61 % 81.40 % 89.78 % 98.22 %
Impact Residual Crater 47.09 % 41.56 % 43.81 % 52.03 % 52.23 % 68.44 %
Average 51.44 % 43.90 % 53.10 % 57.17 % 62.23 % 83.75 %
Table 4. Feature fusion ablation study.
MethodsmAP/%ANMRR
LBP39.850.3717
Hu29.810.4064
LBP + Hu41.370.3616
LC 2 R - Net 83.750.0721
Table 5. Impact of different a values on the retrieval performance of LC 2 R - Net .
Method λ mAP/%ANMRR
LC 2 R - Net 083.650.0725
0.183.670.0716
0.283.750.0721
0.383.710.0728
0.483.290.0756
0.583.190.0769
0.682.910.0752
0.782.460.0798
0.881.730.0811
0.978.790.0934
1.037.990.3943
Table 6. Comparison of retrieval time by different methods on the lunar complex drater dataset.
MethodsFeature Vector LengthRetrieval Times/s
VGG-1640960.2134
ResNet10120480.2046
DenseNet12110240.1922
EfficientNetV2-S12800.1942
ViT7680.1878
Swin-T7680.1884
Swin-T + CBAMwithECA7680.1907
LBP + Hu23670.1630
LC 2 R - Net 1280.1041
Table 7. The impact of different attention mechanisms on lunar complex crater image retrieval tasks.
MethodsmAP/%ANMRR
Swin-T83.010.0755
Swin-T + SE82.160.0795
Swin-T + CBAM78.230.1038
Swin-T + CBAMwithECA83.650.0725
LC 2 R - Net 83.750.0721
Disclaimer/Publisher’s Note: The statements, opinions and data contained in all publications are solely those of the individual author(s) and contributor(s) and not of MDPI and/or the editor(s). MDPI and/or the editor(s) disclaim responsibility for any injury to people or property resulting from any ideas, methods, instructions or products referred to in the content.

