1. Introduction
The importance of hand function is paramount in our ability to perform a diverse range of daily activities, from basic self-care to complex tasks. In particularly in the elderly and people with neurological disorders, the loss of motor skills of the hands markedly affects their autonomy and quality of life. Highlighted in a study by Gianluca et al., the importance of hand motor function is evident, noting its profound impact on activities of daily living (ADL) [
1]. This issue is especially critical for older adults, as a decrease in muscle strength, including grip strength, is a hallmark of aging and is directly correlated with a reduced quality of life. Further supporting this, the research of Melissa et al. reveals a distinct connection between grip strength and quality of life in the elderly [
2], emphasizing the need to preserve the independence of hand function in both ADL and Instrumental Activities of Daily Living (IADL).
In the context of the pandemic, remote rehabilitation, an innovative medical service model, has emerged as a crucial and potential-filled approach. However, it faces several practical challenges. According to Jansen et al., many rehabilitation facilities are located in remote locations [
3], which pose difficulties for medical professionals in providing care outside their usual work settings, potentially impacting care quality. However, remote rehabilitation offers a promising supplement to existing rehabilitation resources, with significant market demand. Otto et al. have made strides in this area, developing a biomedical device specifically for hand motor rehabilitation [
4]. This device helps professionals track and monitor rehabilitation results, actively engaging patients in their recovery and thus increasing the success rate of rehabilitation processes.
The structure of this study is organized methodically as follows:
Section 2 dives deeper into related research.
Section 3 outlines a comprehensive IoT architecture for wearable devices aimed at assessing hand function and details the technical approach for wearable EMG wristbands.
Section 4 describes the experimental procedure and the implementation method for assessing hand function.
Section 5 presents the scoring criteria and results of various models. Lastly,
Section 6 concludes the study with a comprehensive summary and discussion.
2. Related Work
The traditional approach to assessing hand function is based predominantly on the subjective judgment of clinicians, augmented by established assessment scales such as the Fugl-Meyer and Brunnstrom scales. These tools are widely used to evaluate hand motor function and rehabilitation progress in stroke patients. However, the inherent subjectivity of clinician evaluations and potential observational errors can lead to unavoidable inaccuracies. To mitigate this, the use of wearable devices and sensors to monitor physiological signal changes offers a more precise, scientific, and quantitative solution.
The assessment of hand function, when grounded in electromyography (EMG) signals, presents a more objective and accurate method. It excels at detecting minute variations in muscle activity and hand movements. The work of Supachai et al. is particularly noteworthy, as they explored the connection between EMG signals and grip strength using the Myo armband [
5]. This study affirmed the relationship between grip strength and EMG signals and demonstrated the potential of the Myo armband in remote rehabilitation. Achmad et al. advanced this field by effectively integrating therapeutic gloves with the Myo armband for rehabilitation treatment [
6]. Similarly, Ho et al. used the Myo armband alongside steady-state grip strength data [
7], using classification models to differentiate dumbbell weights with a notable accuracy of 77.1%. Furthermore, a comprehensive review by Mario et al. recognized EMG signals as a valuable resource to evaluate muscle strength and fatigue [
8].
The adoption of wearable devices for the assessment of hand function is growing, particularly in the rehabilitation training of stroke patients. The study by Fardipour et al. investigated the therapeutic impacts of wearable robotic gloves on improving hand function in these patients [
9], revealing promising results. Furthermore, the integration of virtual reality systems with assistive gloves has led to advances in rehabilitation assessment [
10]. Despite these developments, there is a noted need for more detailed evaluations, particularly in areas such as grip strength assessment.
3. Framework of the Wearable Hand Function Evaluation System
3.1. Architecture of Wearable Hand Function Assessment Products
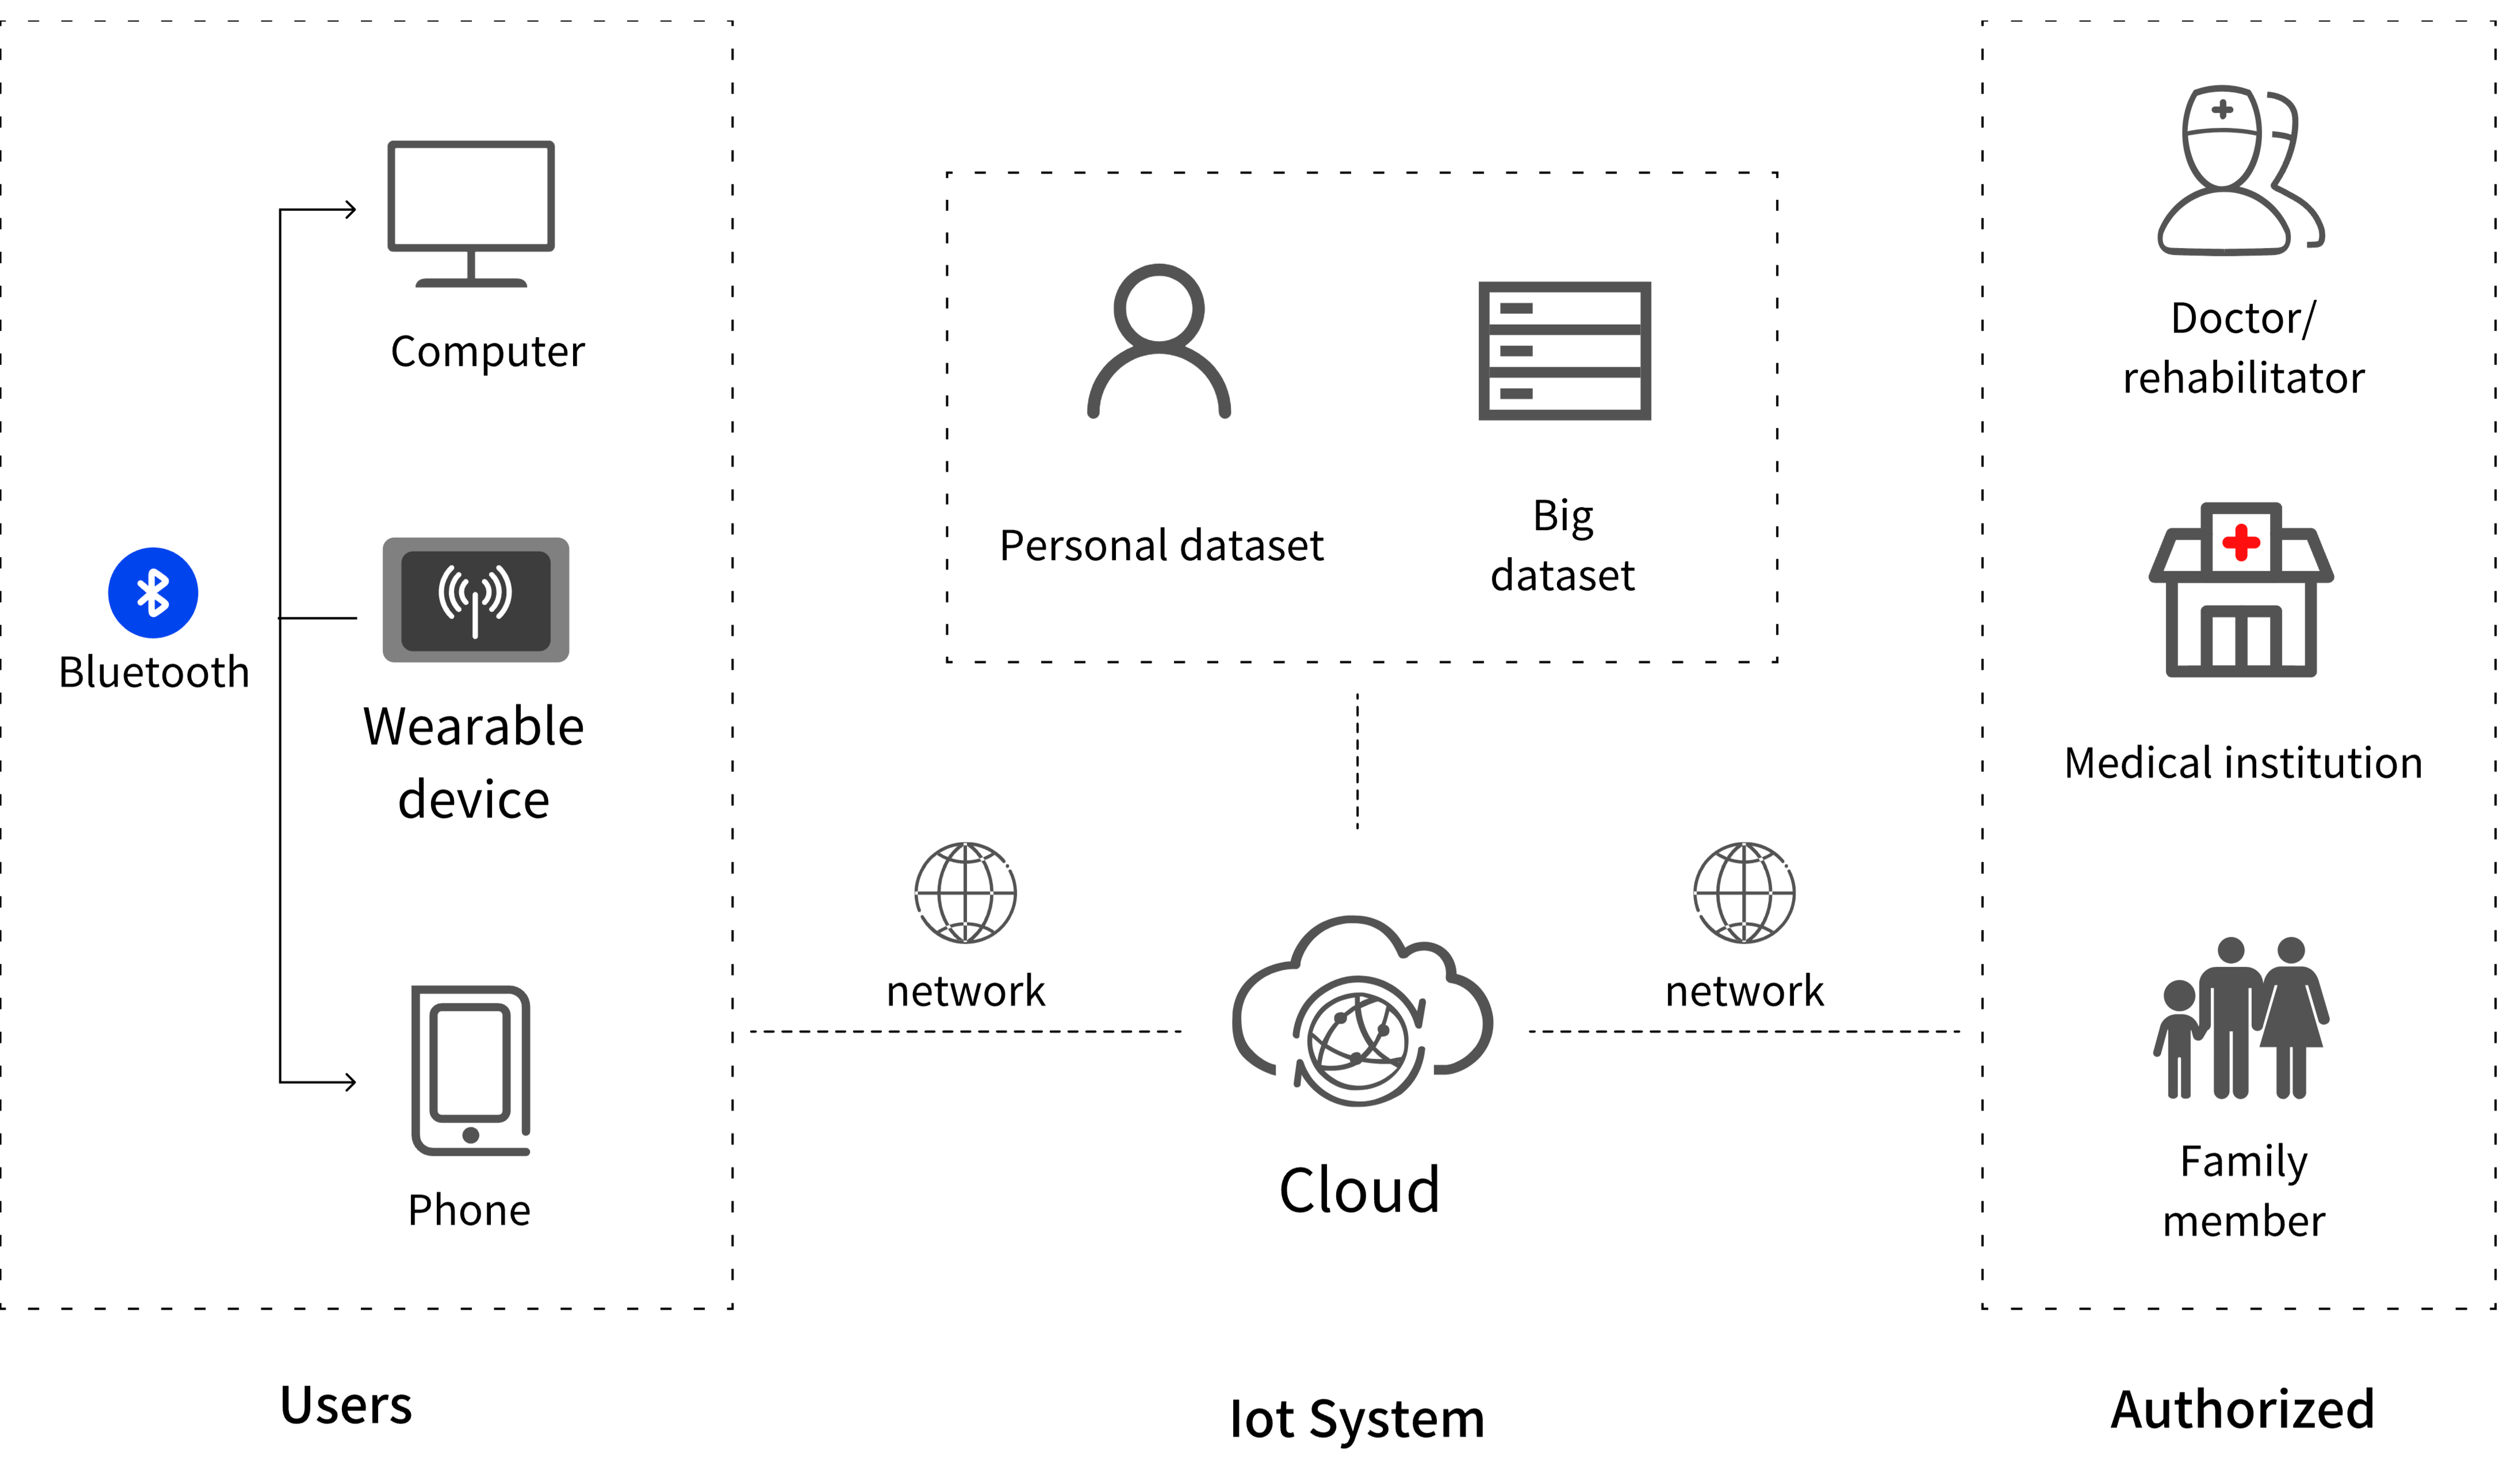
The process of information transmission in wearable hand function assessment devices is intricately detailed in
Figure 1. The data captured by these devices can either be exchanged locally with other devices via Bluetooth or directly transmitted to the server cloud through network connections. Within the cloud server, both personal privacy data and common health big data are stored and utilized to refine the wearable device’s data processing capabilities. Importantly, these data can be shared with doctors, medical institutions, or family members, provided there is appropriate authorization, thus facilitating remote medical care and helping to develop and execute rehabilitation plans.
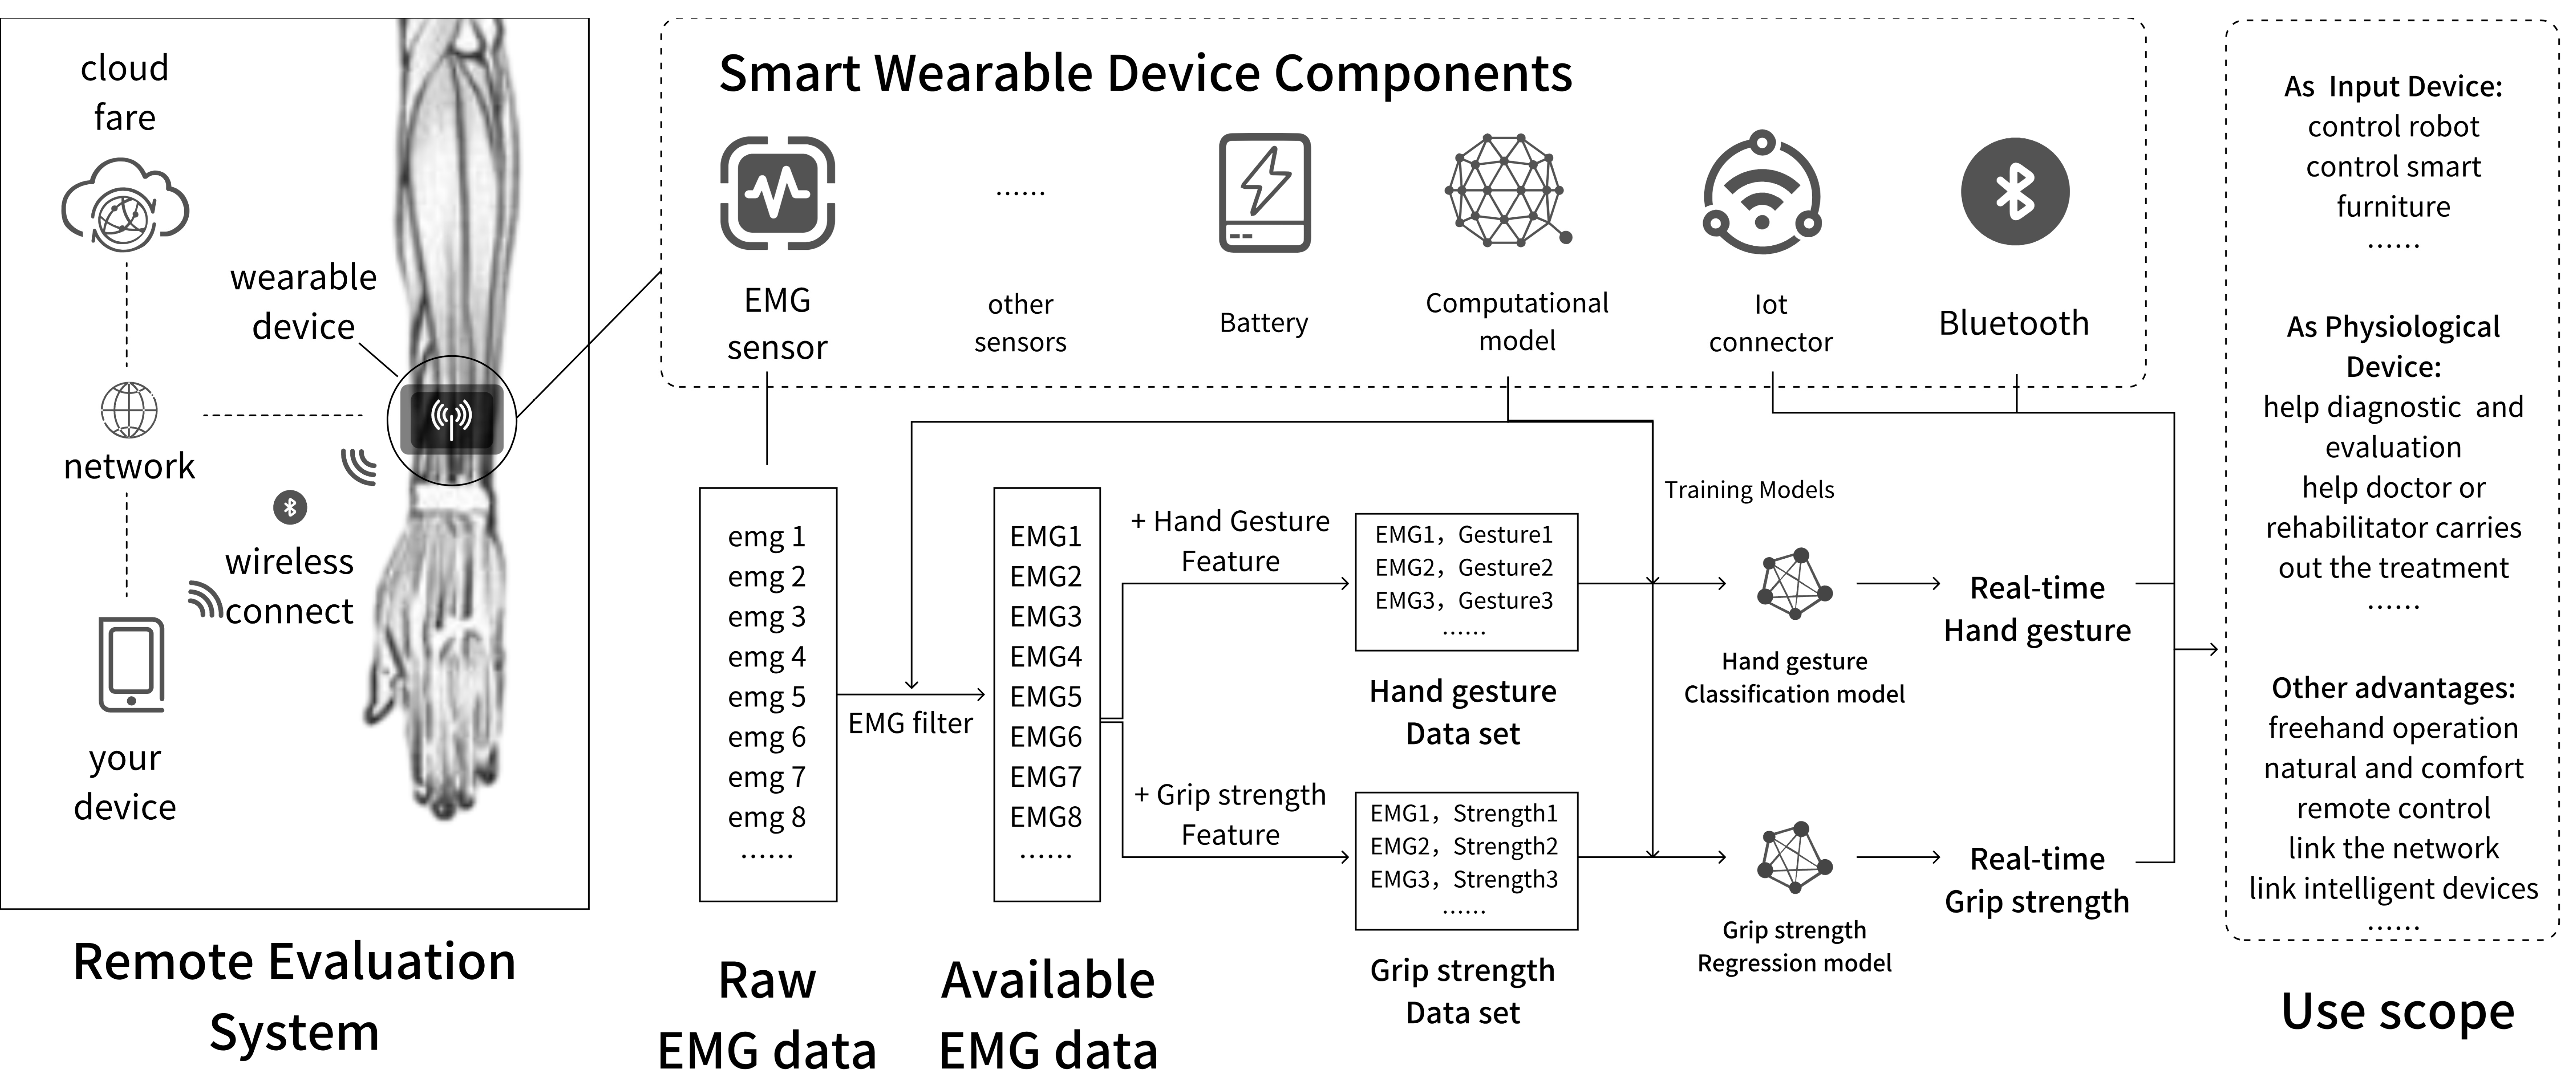
3.2. Wearable EMG Device
Figure 2 presents the product composition diagram of the wearable wristband. Designed to be worn on the patient’s forearm, a region well-suited for EMG signal collection due to its rich musculature and minimal fat, this product ensures effective data collection. The wristband comprises several components, including an EMG sensor, various other sensors (such as heart rate, body temperature, accelerometer, etc.), a power unit, a computing unit, and an IoT unit, among others. The EMG sensor is the cornerstone of the device and meets most requirements for assessing hand function through EMG signal analysis. The raw EMG data undergoes filtration and rectification by the computing unit before becoming analyzable. The processed EMG data, coupled with the corresponding feature labels, is used to train gesture classification models and grip strength curve regression models. By incorporating these trained models into the computing unit, the device can automatically determine gestures and evaluate grip strength. These effectively transformed information streams are then distributed to other devices or cloud platforms through IoT modules such as WIFI, cellular networks, or Bluetooth, playing a crucial role in remote health monitoring, user interaction, and device control.
4. Evaluation of Hand Function
Gesture recognition and grip strength assessment constitute fundamental components in evaluating hand function. Given the extensive research already conducted on EMG-based gesture recognition, this paper eschews redundant validation. However, existing research uses primarily dumbbells to test grip strength, with a focus on weight classification. This study posits that fitting a continuously varying force curve is more appropriate for authentic hand function evaluation. Thus, the research centers on the regression adjustment of the grip strength curve.
4.1. Data Collection and Processing
4.1.1. Experimental Equipment
The experimental setup encompasses both hardware and software components:
- (1)
Hardware Environment: As illustrated in
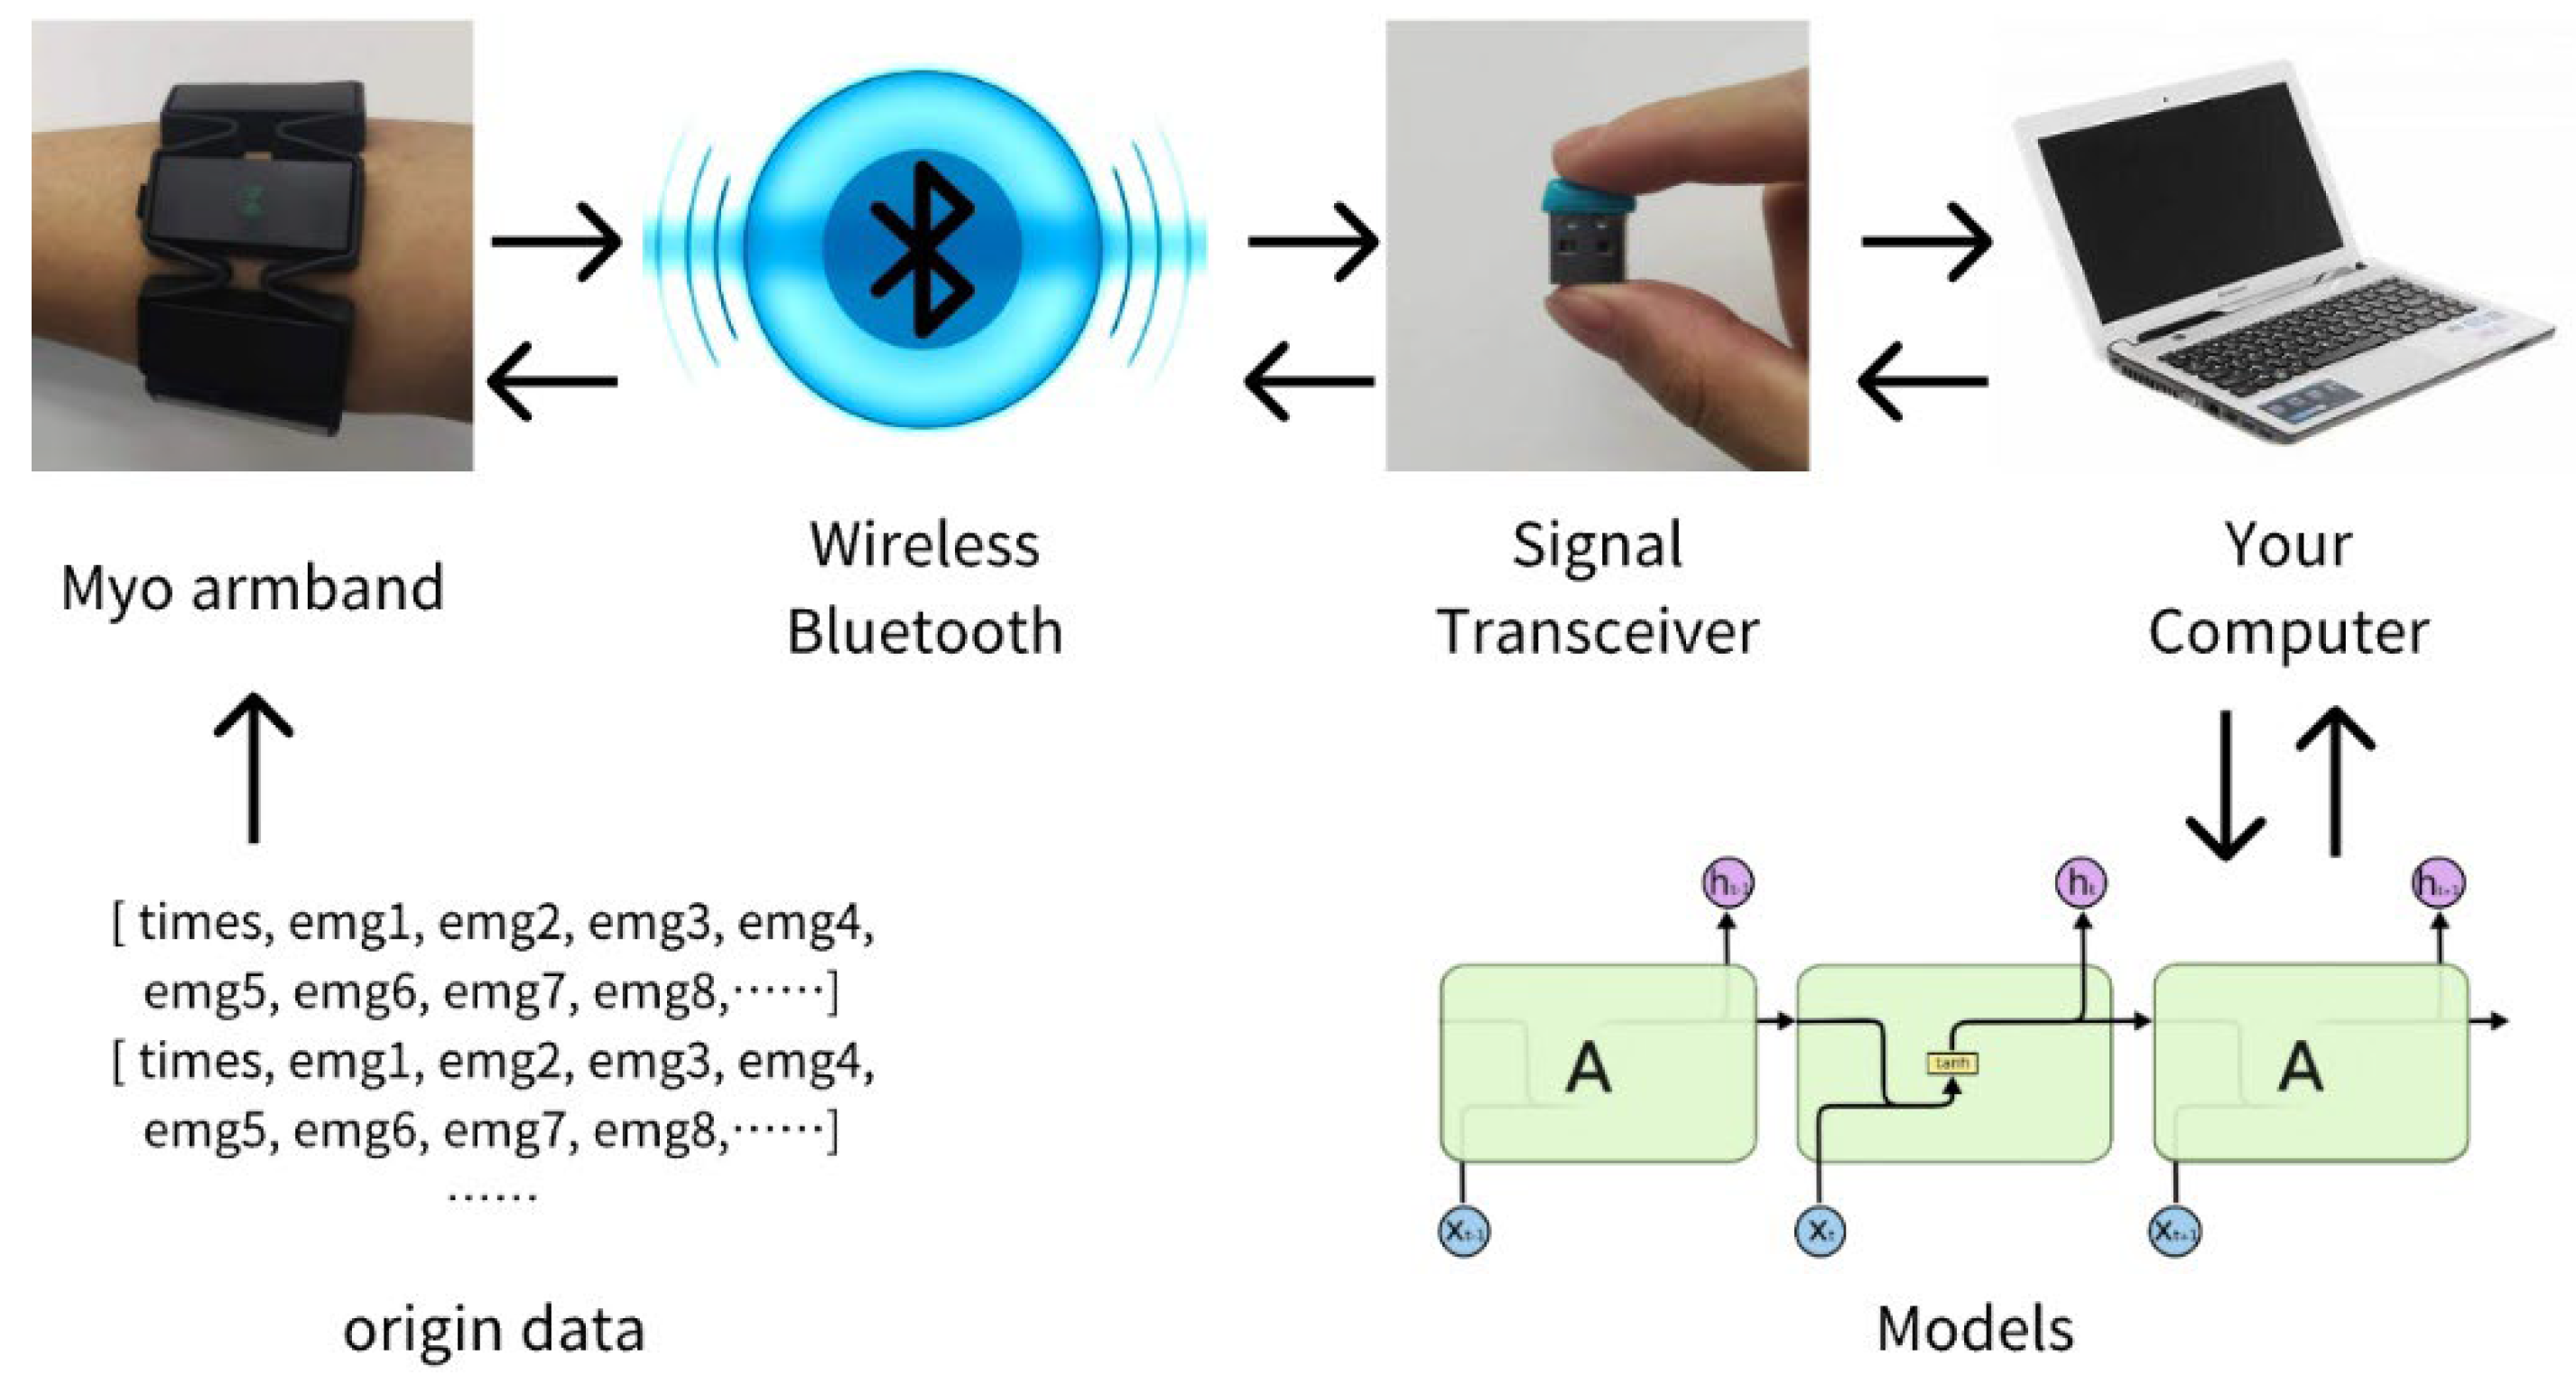
Figure 3, the apparatus for collecting EMG data comprises the Myo armband by THALMICLABS, the EH102R type electronic hand dynamometer from Xiangshan, and various dumbbells with different weights. The Myo armband, capable of rapidly capturing EMG data from eight regions and transmitting them wirelessly via Bluetooth at a 200 Hz frequency, constitutes a vital part of the set-up. The experimental environment utilizes the Windows 10 operating system and a Lenovo E570 laptop for model training.
- (2)
Software Environment: The software for data collection and processing is custom-developed. Using the PyCharm 2021 platform, it incorporates the pyomyo library for Myo armband integration and the sklearn library for training and evaluating SVR, KNN, and RF models, as well as the Keras library for LSTM model training.
4.1.2. Preparation of the Experiment
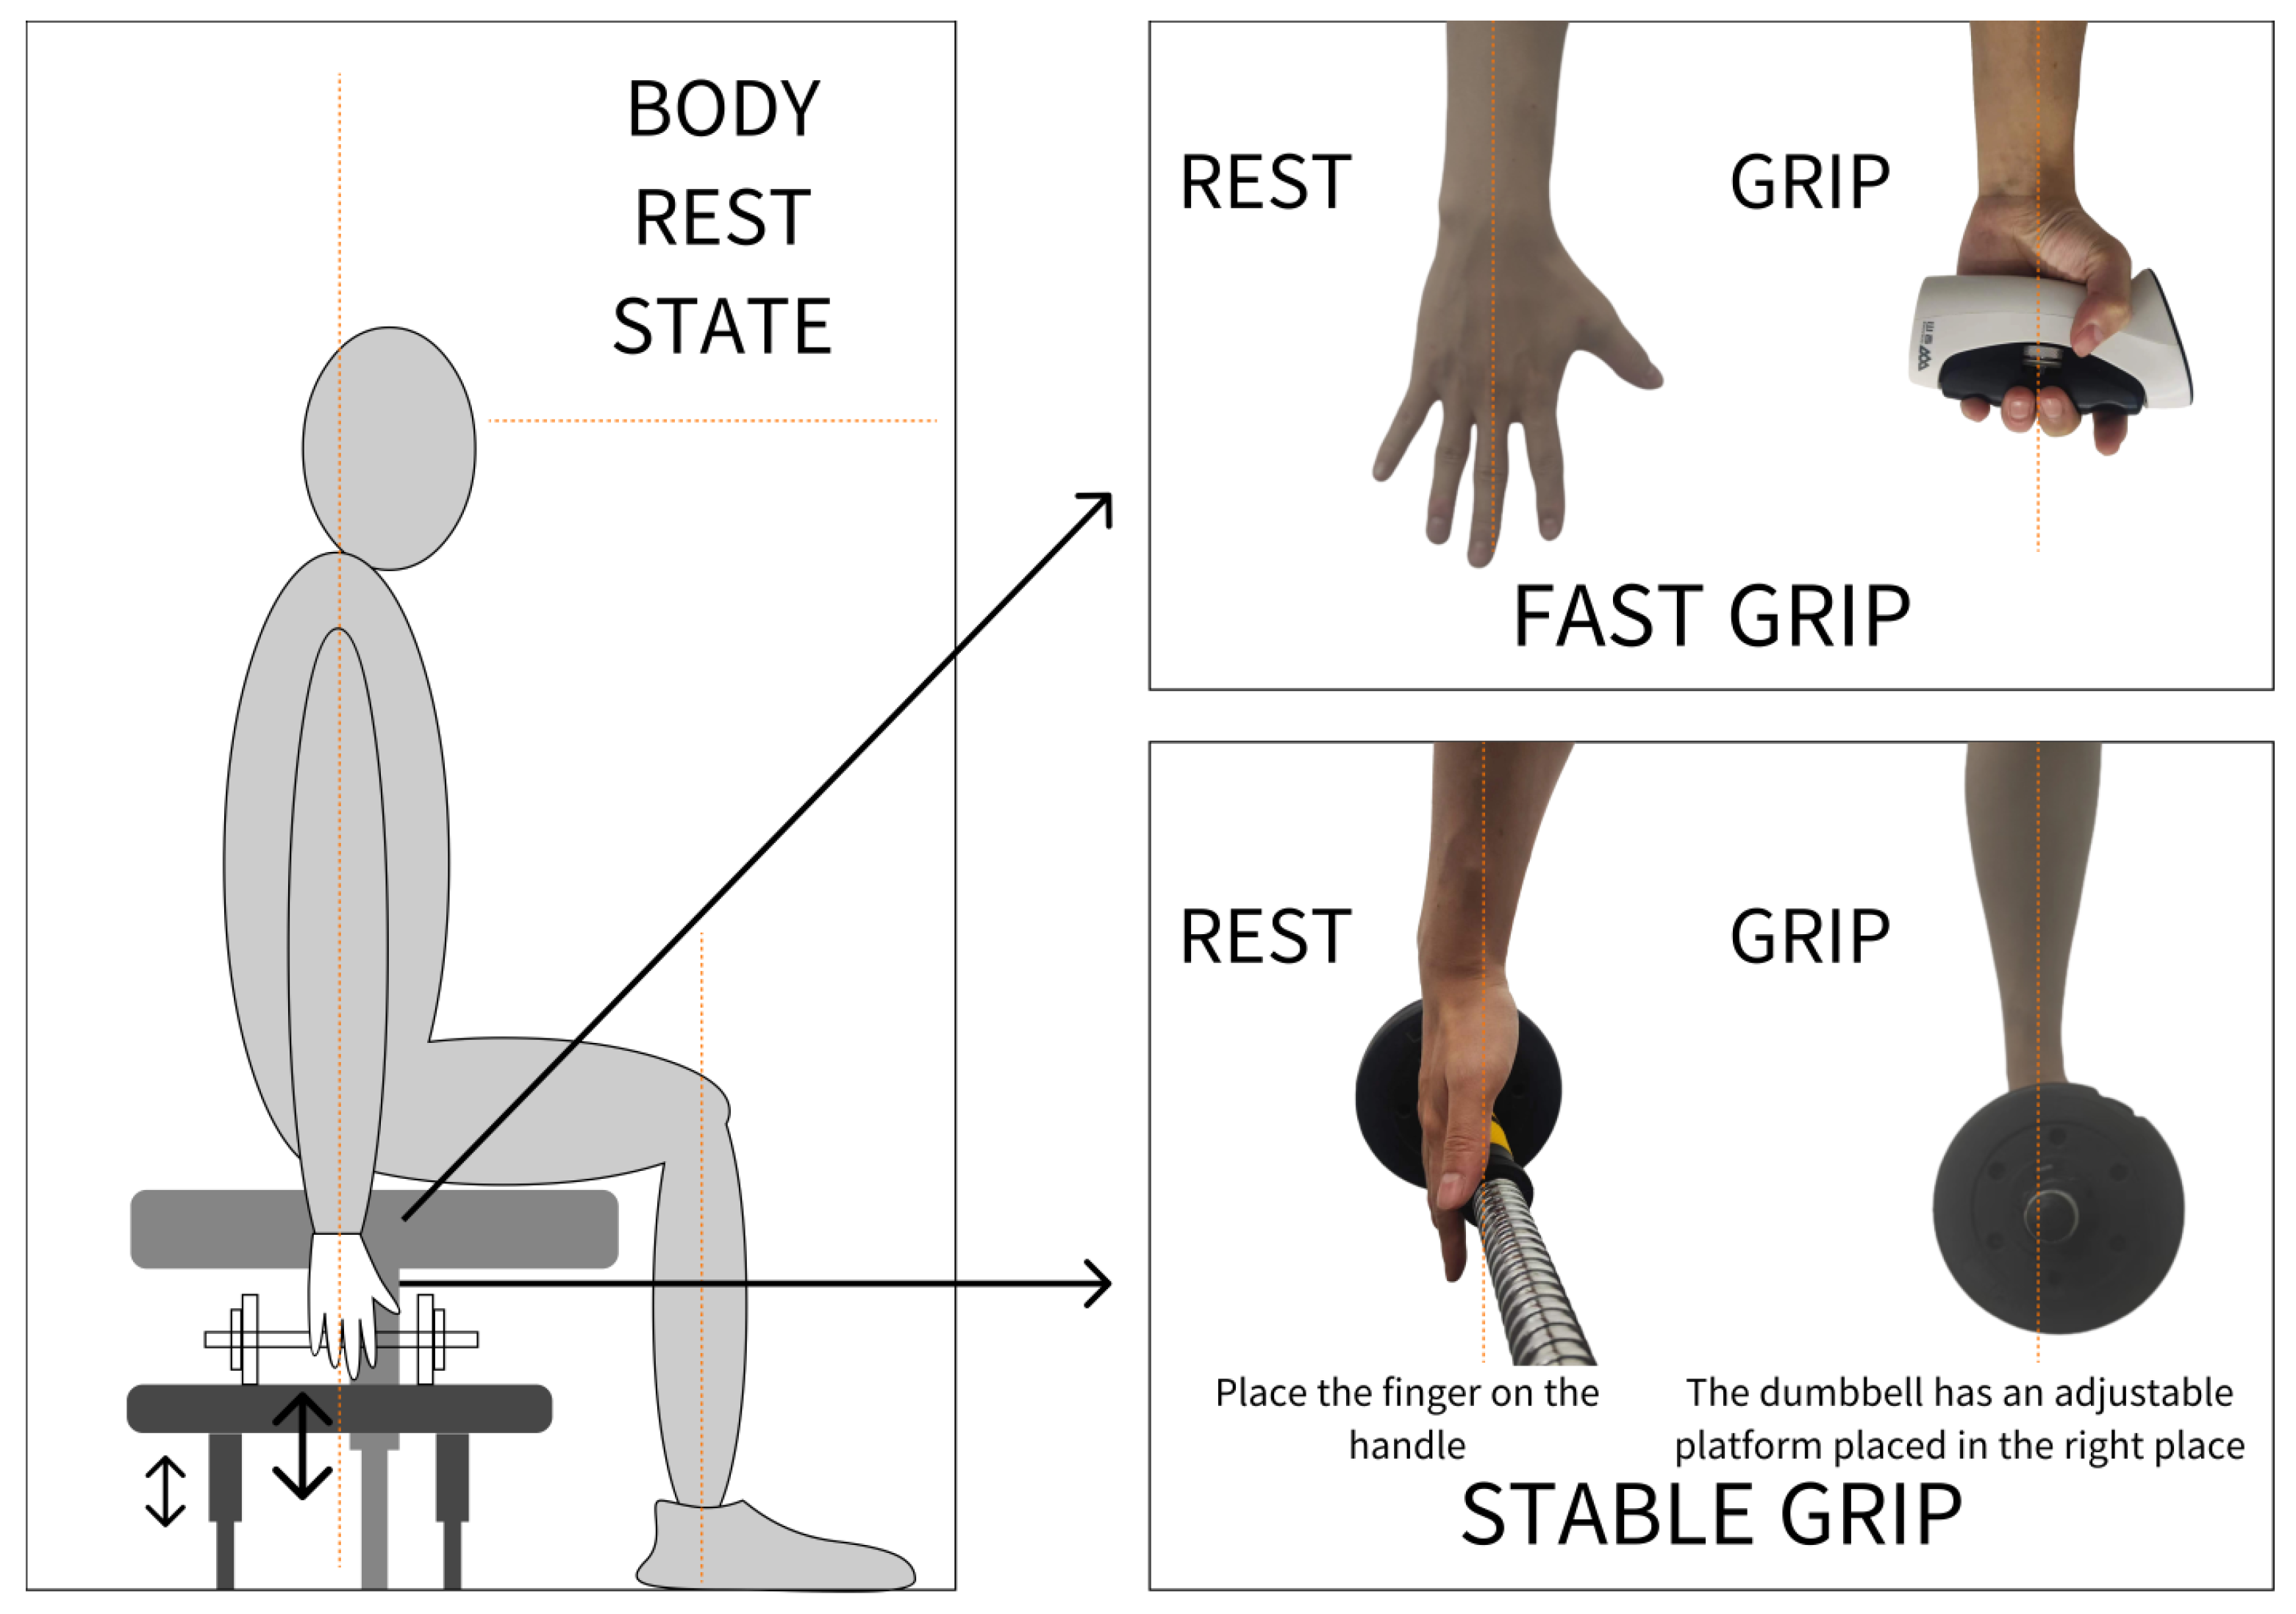
The study categorizes the force into two types: instantaneous and stable. The Myo armband records EMG signal variations during force application.
Figure 4 demonstrates the experimental methodology, where the instantaneous force is measured using the EH102R type electronic hand dynamometer and stable force through 5 kg and 8 kg dumbbells. Before testing, subjects sit upright with their arms naturally hanging, ensuring no external hand support. The experiment proceeds after confirming the comfort of the subject. During stable force tests, the seat height is adjusted to allow natural finger positioning on the dumbbell bar, reducing the force of the auxiliary muscle.
The subjects gave written informed consent for the study after receiving a detailed explanation of the purposes, potential benefits, and risks associated with participation. All procedures used in this study were approved by the Research Ethics Committee of Zhejiang Sci-Tech University and were in accordance with the Declaration of Helsinki.
4.1.3. Data Collection and Processing
The participants were all young people, but relevant studies have shown that in sustained isometric tasks, the older adults’ susceptibility to fatigue is the same as or even better than that of the younger adults [
11]. Furthermore, when the maximal voluntary contraction (MVC) of older adults and younger adults is the same [
12], there is no significant difference in most cases, and only when they are at 20% MVC or 25% MVC will the RMS show a significant difference, whereas the EMG will not show a difference, so the present study concluded that under this scenario condition, the use of younger adults’ data is informative.
Table 1 details information about the six volunteers who participated in the experiment, balanced between sexes and aged 23–26 years. They refrained from intense physical activity 24 h before the experiment. All right-handed, they provided uniform EMG data from their right forearms. Pre-experiment grip strength tests were conducted three times to determine the average value (1). Using different weights or a hand dynamometer, data was collected over two trials per set, repeated over five sets with a 15 s intermission. More than 45,000 sample groups were ultimately collected after processing.
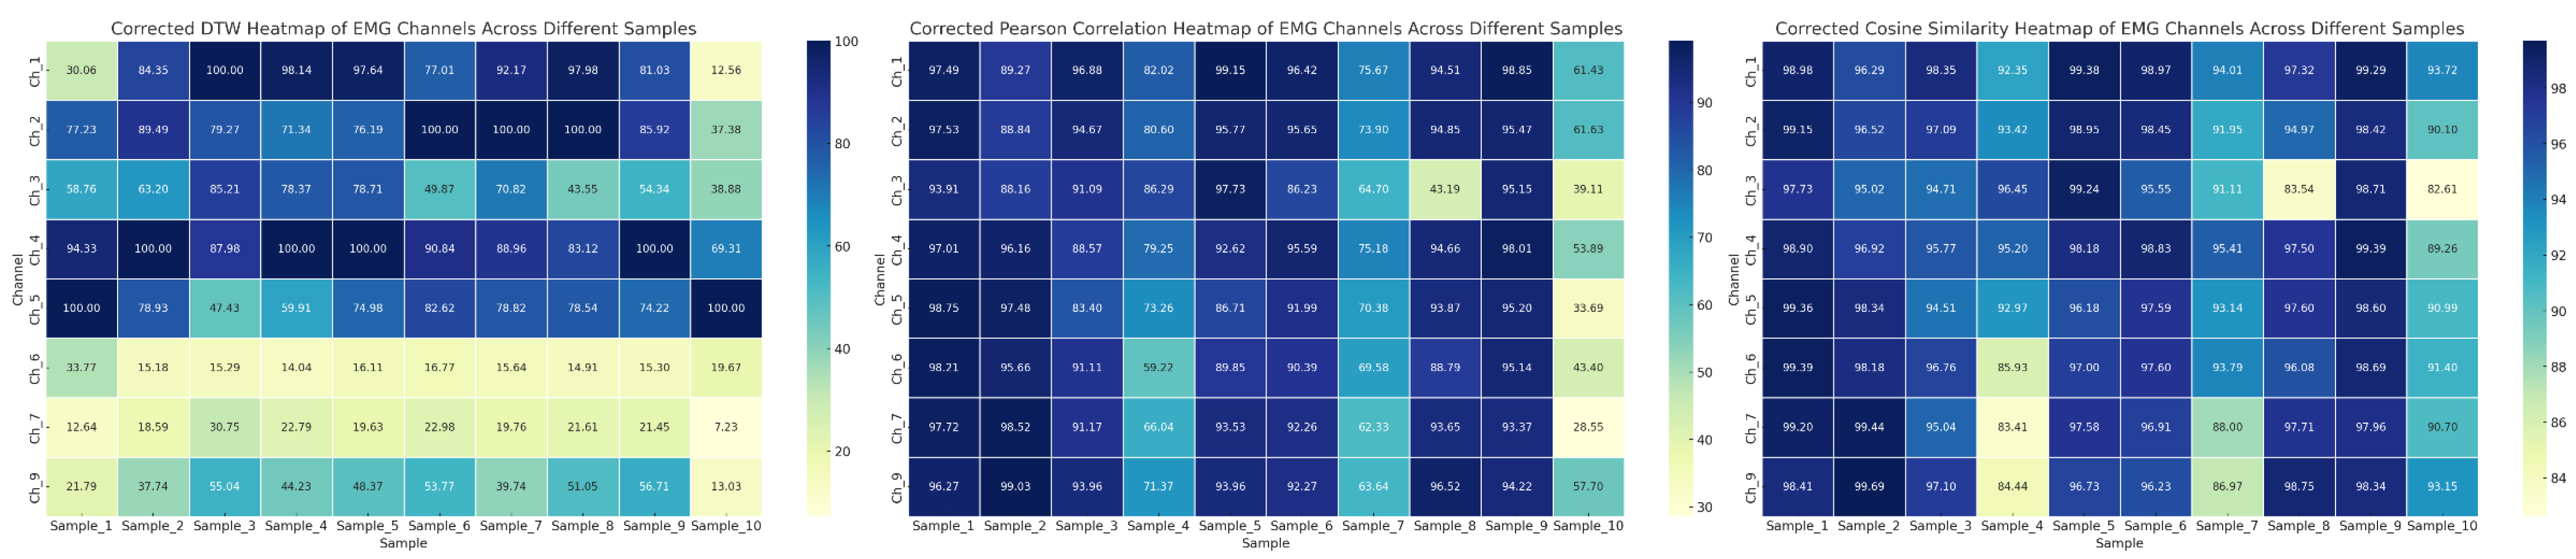
The study combines EMG data from eight regions with grip strength data, aligned through linear interpolation (2). DTW, Pearson, and cosine correlation tests were conducted, with results shown in
Figure 5. Deeper colors indicate stronger correlations between regions and grip strength. This suggests a correlation between EMG signals and grip strength.
Table 2 presents the results of the nonparametric correlation test between various sizes of grip strength and EMG signals from eight regions, employing the Kruskal-Wallis H-value as an indicator. Analysis of H-values and
p-values leads to the conclusion that EMG signals from specific regions are more sensitive to changes in grip strength, affirming the relevance of the experiment.
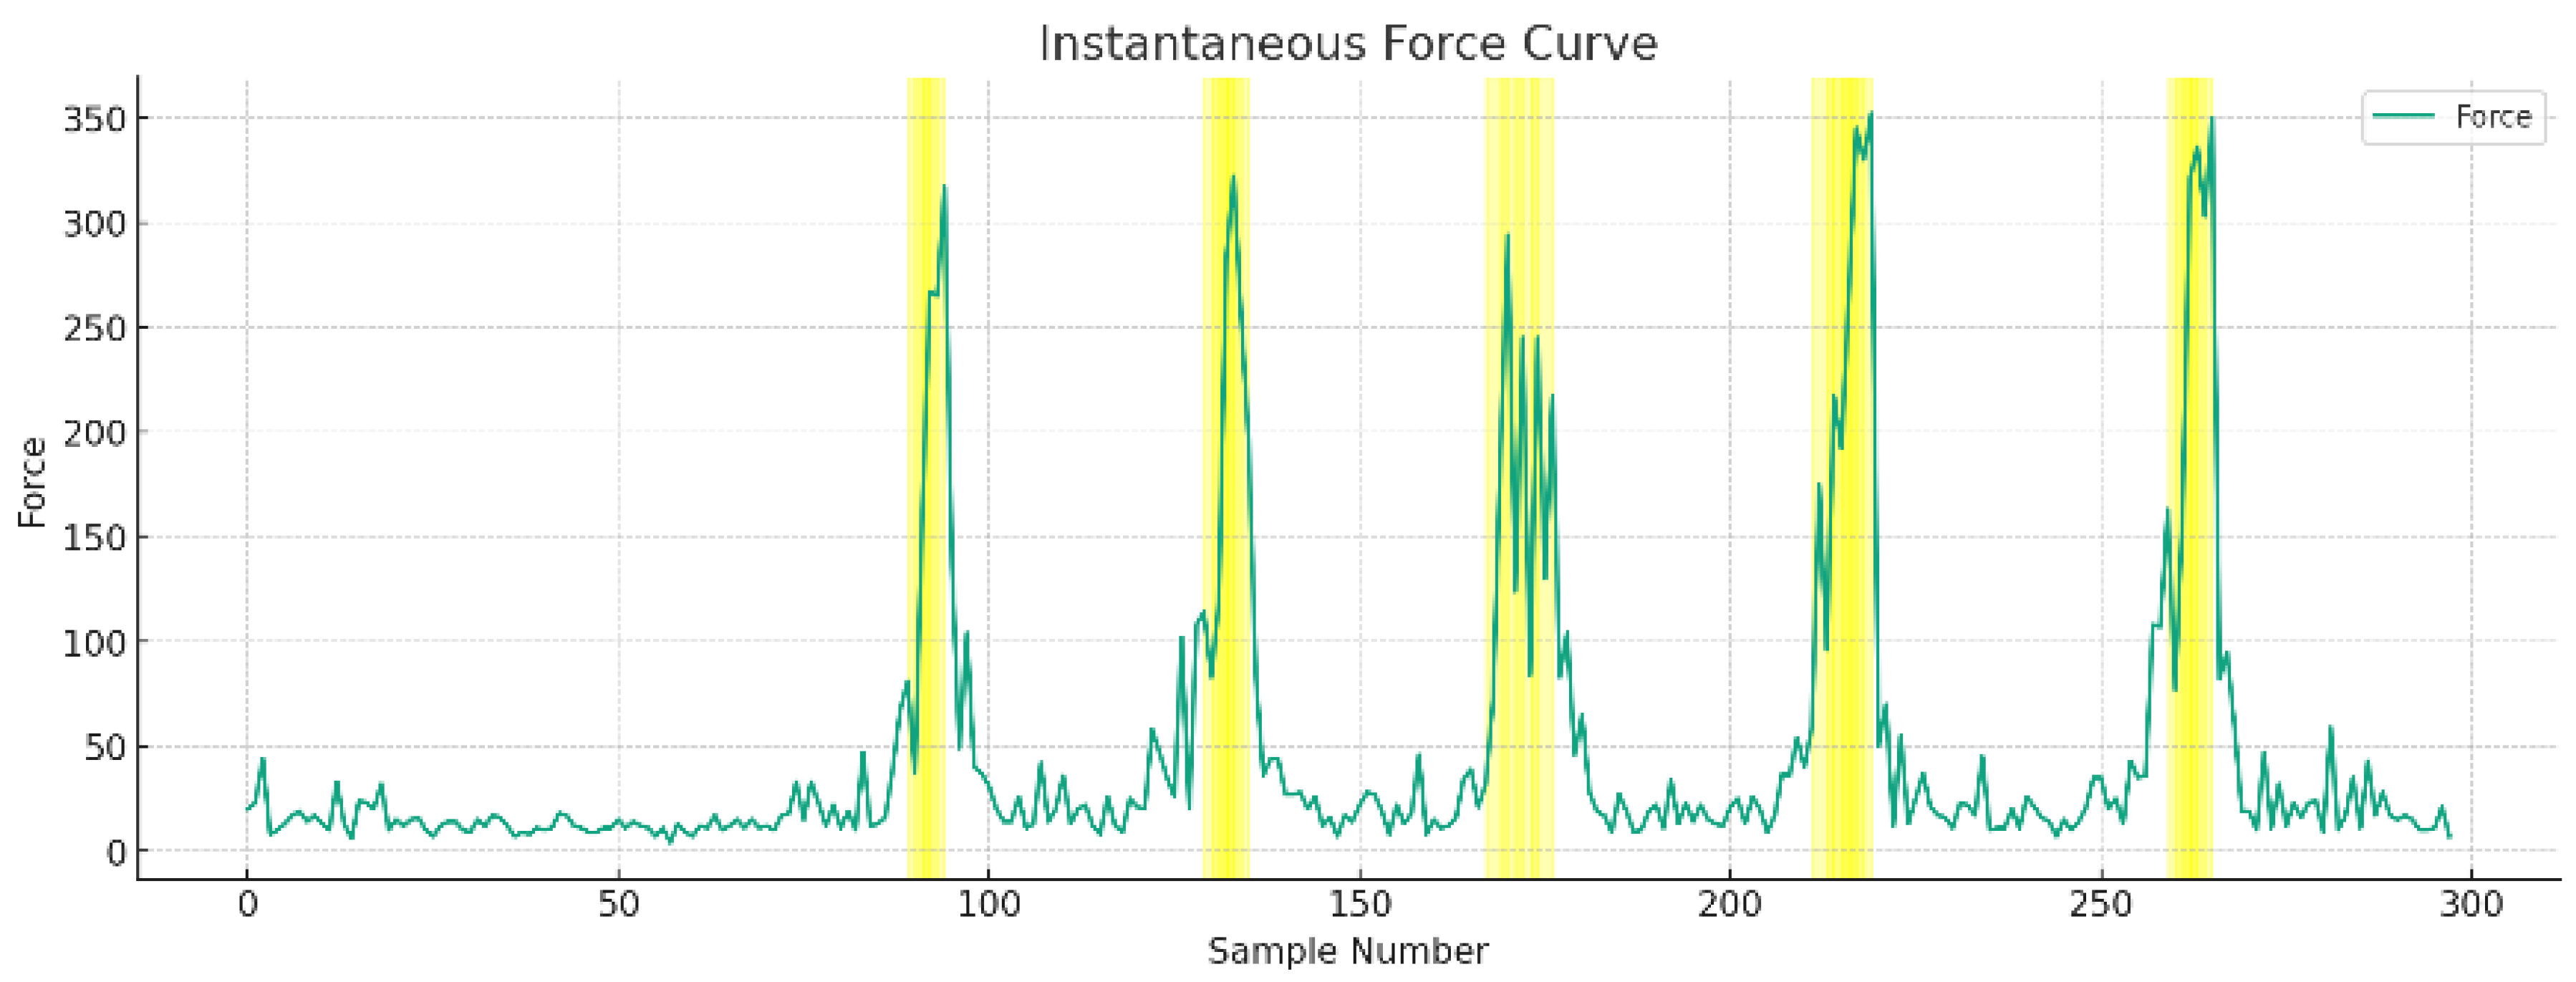
Different data selection strategies were applied for different exertion states.
Figure 6 displays the total strength curve of the EMG signals for instantaneous force, identifying the peak samples closest to the maximum grip strength. Three samples preceding each peak, including the peak, were selected, with the corresponding grip strength as an EMG feature.
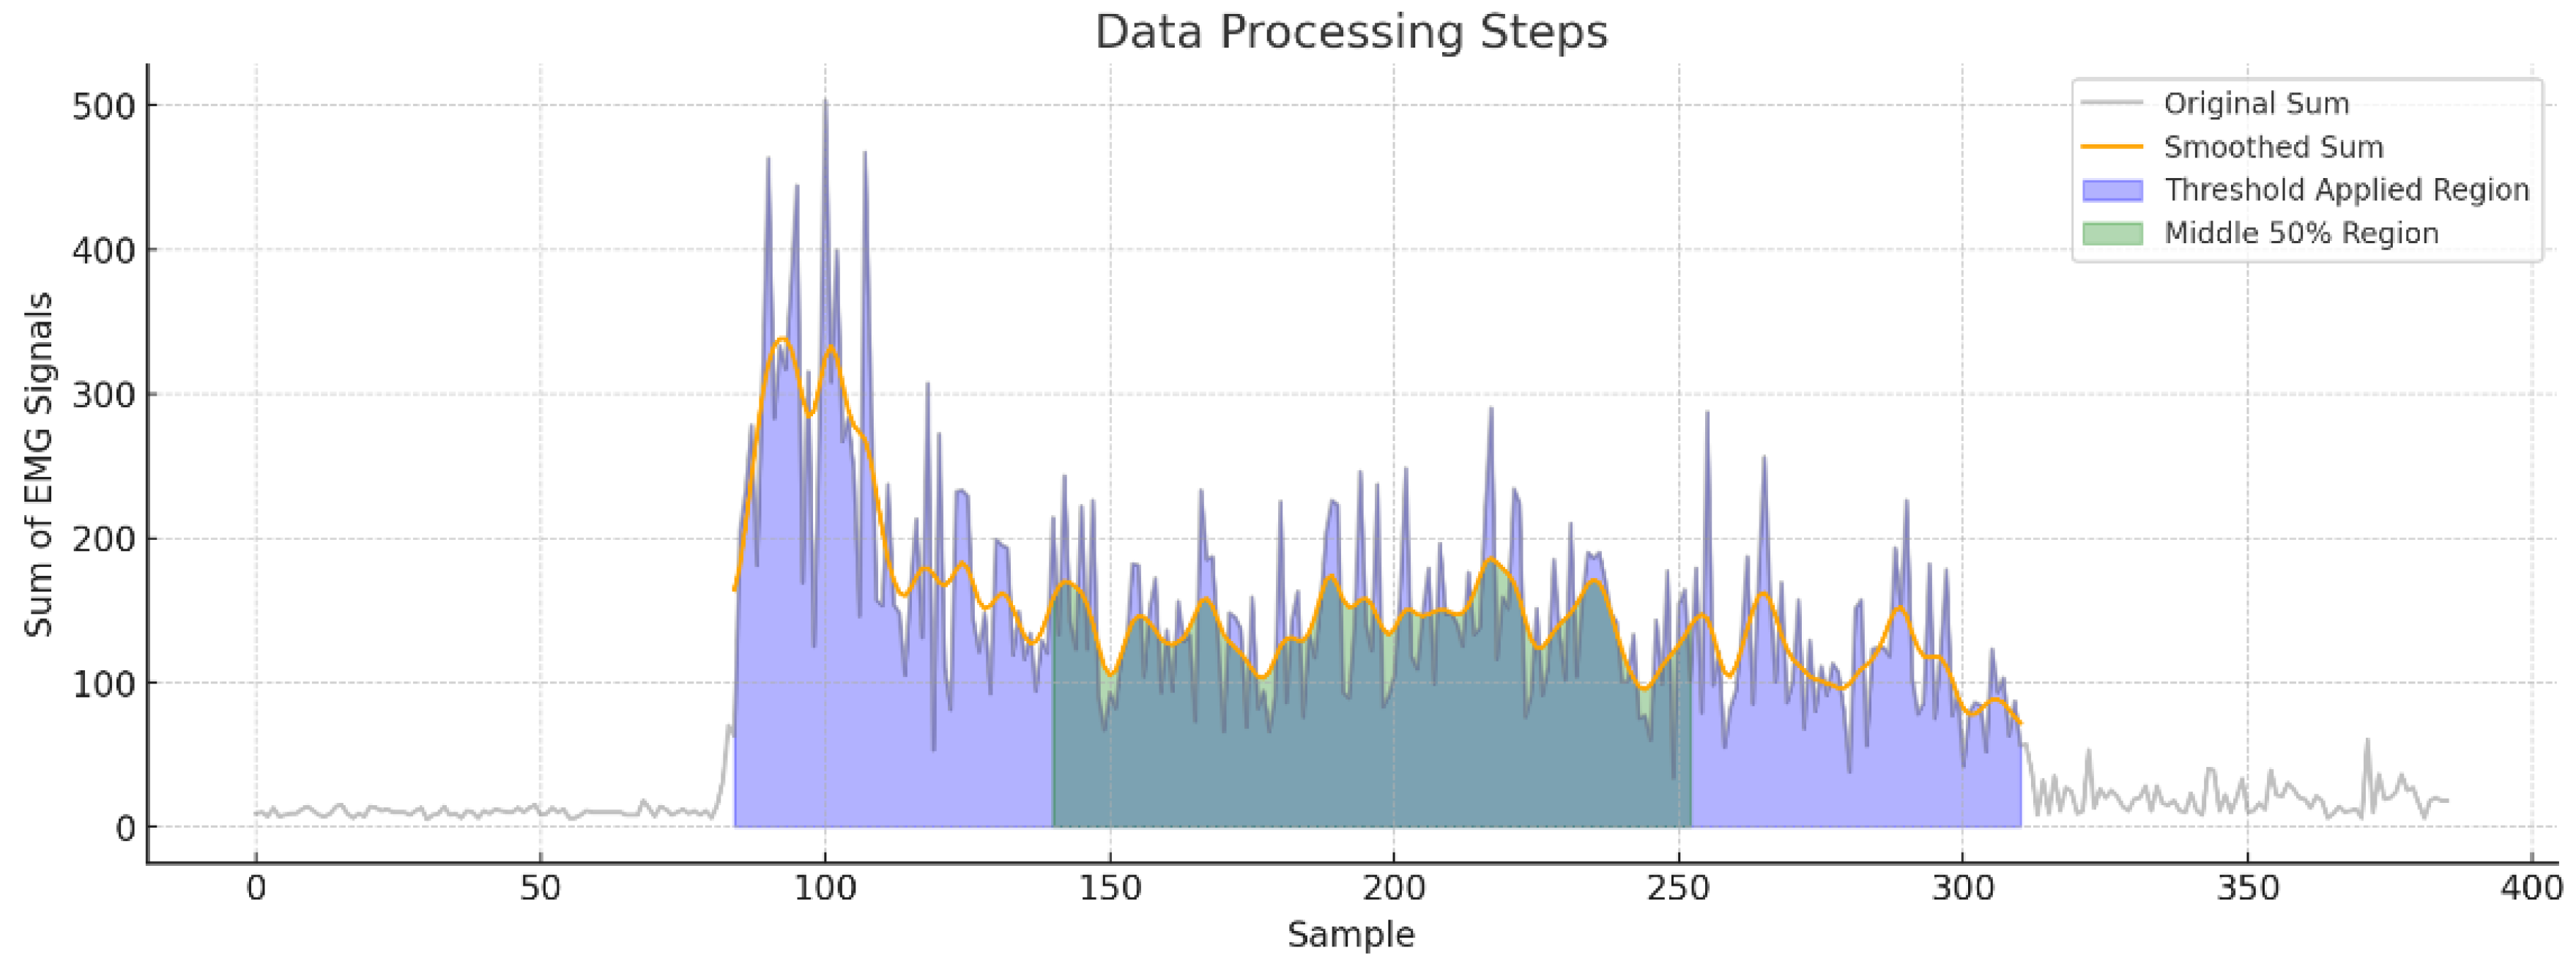
Figure 7 depicts the total strength curve of EMG signals for a stable force. This study interprets the curve’s progression from excessive to appropriate exertion, with the excessive force phase occupying about one-fourth of the exertion period and the stable force phase three-fourths. Consequently, the data in the post-peak stable force phase are deemed more relevant and referential. Initially, the study delineated the movement phase data using a total signal strength of 50 as a boundary, applying forward and reverse ordering for boundary delineation. To avoid misjudgments due to occasional fluctuations, a boundary is considered valid only if two out of three data points exceed the threshold. Furthermore, to prevent signal fluctuation from declining due to muscle fatigue, the 50% middle section of the exercise area is selected as the stable force phase. However, this section still contains a large number of samples, and using all would likely lead to overfitting in subsequent models. Therefore, the data in the stable force phase are further reduced by dividing it into three equal parts in a matrix (3),
representing the average EMG signal value for each area in
(4), where
. Ultimately, each trial yields three sets of data samples with ten labels.
4.1.4. Dataset
Table 3 includes a compilation of 483 effective samples, including 183 stable forces, 153 instantaneous forces, and 147 relaxation balance samples. This table represents a comprehensive data set containing 5313 data points, which encompass EMG signals from eight distinct regions, corresponding grip strength measurements, overall signal strength, and inter-time intervals. To discern the disparities between instantaneous and stable forces, the dataset for instantaneous force alongside the complete dataset will be utilized to evaluate the stable force data, thus affirming the versatility of multistate force data in practical applications.
4.2. Methods and Models
To identify the optimal algorithm for fitting the force curve, the study selects several regression algorithms for comparison, including traditional machine learning and deep learning algorithms. Before processing, the data is standardized (5), where
is the standardized value,
is the original data point,
is the mean of the original data and
is the standard deviation of the original data. This standardization results in a dataset with a mean of 0 and a standard deviation of 1, making the data more comparable across different features and also aiding in algorithm convergence and performance enhancement. 20% of the data are used as a test set, with a random seed of 42.
4.2.1. KNR Parameters
K-Nearest Neighbors Regression (KNR) is a regression model derived from the KNN algorithm, adept at predicting and analyzing data. In the realm of EMG signal analysis or grip strength analysis, KNR can forecast muscle activity or grip strength levels considering the characteristics of the nearest neighbors. A notable application of KNR is found in the research conducted by Shin et al., where KNR was used to analyze the data and predict the reaction time of the grip strength and the changes in muscle strength using EMG and the grip strength data [
13]. This research highlights KNR’s proficiency in accurately assessing and comprehending the intricacies of hand movements and strength.
Neighbor numbers: [3, 5, 7, 9, 11, 13, 15, 17, 19, 21, 23, 25].
Modes: [‘uniform’, ‘distance’] combined to retain the advantages of both proximity modes.
Algorithms: [‘auto’, ‘ball_tree’, ‘kd_tree’].
Leaf sizes: [20, 30, 40, 50], affecting tree construction and query speed.
Minkowski distance power: [2, 3].
Cross-validation folds for learning curve generation: 5.
4.2.2. SVR Parameters
Support Vector Regression (SVR), a regression methodology based on SVM, proves effective in predicting muscle strength or grip levels, particularly when processing EMG signals or grip strength data. For example, the approach proposed by Liu et al. involved the use of an optimized SVR algorithm for training regression models based on sEMG signals [
14]. This method demonstrated its precision in forecasting muscle strength and its value in comprehending muscle fatigue levels and optimizing rehabilitation training plans.
Number of trees: 100.
Maximum depth of trees: 200.
Minimum samples required to split an internal node: 2.
Minimum samples required at a leaf node: 5.
Cross-validation folds for learning curve generation: 10.
4.2.3. RFR Parameters
Random Forest Regression (RFR) stands as a powerful machine learning approach, especially suitable for complex data sets and prediction tasks. In the context of the EMG signal or grip strength analysis, RFR is capable of predicting muscle activity or grip levels. The research of Manuel et al., which employed RFR to analyze variations in maximum force [
15], maximum muscle activity, and muscle thickness during handshake gestures, exemplifies the capacity of RFR to manage numerous features and offer precise predictions. Such capabilities are vital for deciphering complex biomechanical patterns and improving rehabilitation strategies.
4.2.4. LSTM Parameters
Long-Short-Term Memory (LSTM) networks, a specialized category of recurrent neural networks, are particularly adept at processing time series data, such as EMG signals. In analyses involving grip strength or muscle activity, LSTM networks are capable of capturing long-term dependencies in time series data, providing a profound understanding of muscle activity patterns. The study by Ravi et al. utilized LSTM networks in conjunction with fuzzy inference systems (FIS) to classify movement states based on EMG signals [
16]. This research underscores the effectiveness of LSTM in accurately classifying different hand movements and yielding interpretable outcomes, making it a valuable asset for applications in rehabilitation and the medical device industry.
Number of units in the LSTM layer: 128.
The addition of a dropout layer with a dropout rate of 20% will reduce overfitting.
The addition of a dense layer with one unit for the output of prediction values.
Training epochs: 300, batch size: 32.
5. Results
5.1. Evaluation Metrics
To ensure a precise evaluation of model performance, this study uses mean square error (MSE), root mean square error (RMSE), and R squared (R2) scores as the primary evaluation metrics.
The
MSE, denoted as a metric (6), represents the average of the squared discrepancies between the model predictions and the actual values. Lower
MSE figures are indicative of higher accuracy of the prediction model.
RMSE, labeled as a metric (7), calculates the square root of the squared deviation of the predictions from the actual values, divided by the number of observations. This metric is particularly sensitive to outliers within the data.
The
R2 score, referred to as a metric (8), serves as a performance metric to evaluate the correlation between the data applied to the regression models and the model itself.
R2 scores range from 0 to 1, with values approaching 1 indicating a stronger correlation between the regression model and the applied data.
5.2. Experimental Results Analysis
Table 4 enumerates the training and test scores for the four models under consideration. These scores illustrate that both traditional machine learning models and advanced deep learning models possess substantial capabilities for fitting grip strength curves effectively. The KNR (TEST) and KNR (TRAIN) display the lowest
MSE and
RMSE values, which signifies a superior model to fit compared to other models. Furthermore, the high
R2 scores of the KNR model indicate an excellent match with the data. However, the
MSE and
RMSE for KNR (TRAIN) exhibit significantly anomalous values, suggesting issues in its computational method that make it prone to overfitting. Therefore, this paper concludes that KNR may not be the optimal choice for this type of data fitting.
Both RFR (TEST) and RFR (TRAIN) demonstrate low MSE and RMSE values, along with exceptionally high R2 scores, indicating that the model predicts values very close to the actual data. The success of the RFR model can be attributed to its proficiency in handling complex non-linear relationships in the data and its reduced sensitivity to outliers. In contrast, SVR (TEST) and SVR (TRAIN) exhibit relatively high MSE and RMSE values, possibly due to SVR’s sensitivity to outliers or noise in the EMG data. However, its R2 score, though lower, remains within a commendable range, indicating a strong correlation between predicted and actual values. LSTM (TEST) and LSTM (TRAIN) maintain a balance between accuracy and fit, displaying satisfactory MSE, RMSE, and R2 scores. While RFR emerges as the most accurate and reliable model for fitting grip strength curves in this dataset, the time-series nature of EMG signals might be better suited for LSTM.
5.3. Model Graph Analysis
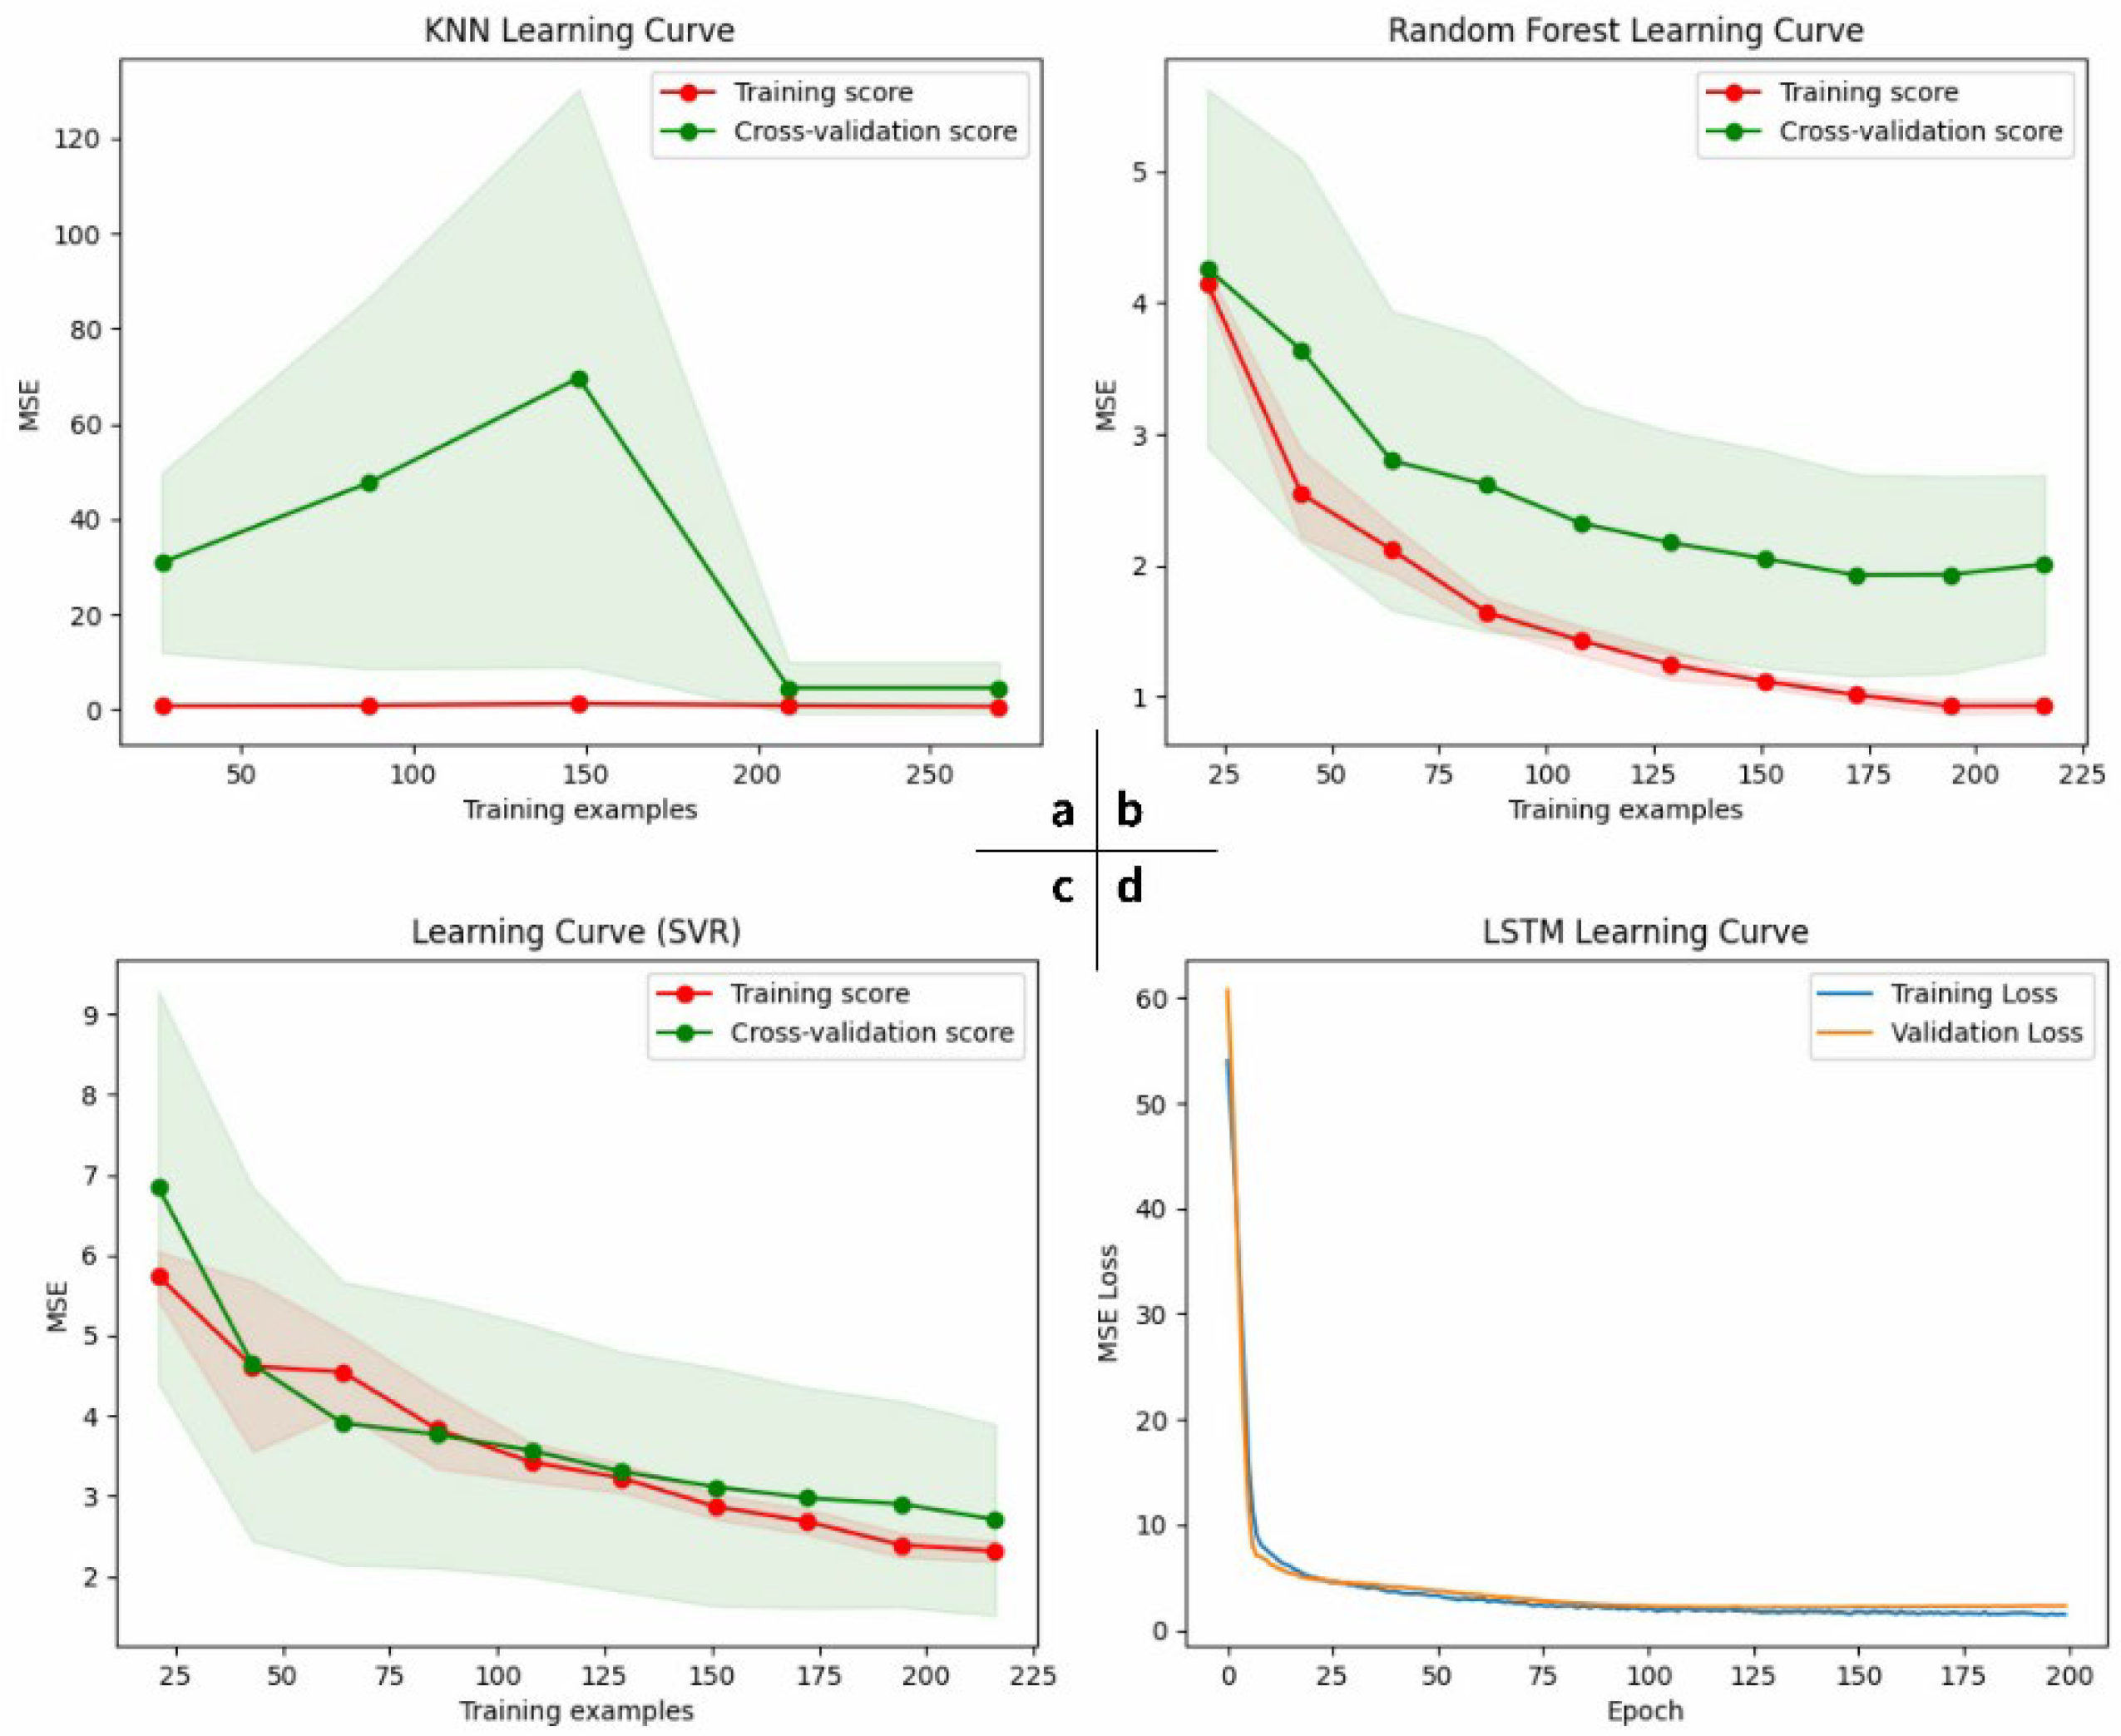
Monitoring training and testing changes in models is crucial for optimizing the model structure and identifying problems. Accordingly, learning curves were generated for each model, providing a more intuitive visualization of changes during the training process.
Figure 8 illustrates the learning curves for training the four models using hair power data. The KNR model, in the region of the graphs, shows significantly abnormal training results, persisting even after several debugging attempts, suggesting a mismatch between the KNR model and this kind of data. Other graphs show a more effective fitting process, with training and test sets maintaining a generally consistent trend, indicating minimal overfitting. The d region of the LSTM model is particularly noteworthy, as it demonstrates rapid decreases in training and validation losses while maintaining a fit, with increased training enhancing the model’s fit without overfitting. The RFR model in area b and the SVR model in area c show similar trends, with the RFR model’s cross-validation score decreasing faster and remaining more stable with increased training. Taking into account these findings, this article concludes that RFR is the optimal model in terms of the performance-to-speed ratio, while the LSTM model can also achieve high accuracy and fitting effectiveness with increased epochs.
6. Conclusions
The IoT system for remote rehabilitation devices, as an augmention force in medical resources, is experiencing rapid growth, especially in the market for wearable devices. Products about hand function evaluation are showing expansive prospects. This paper introduces an architecture of an IoT system for home-based assessment of hand function using wearable devices, detailing its composition and technical foundations. The crucial aspect of the evaluation of hand function based on EMG signals involves regression fitting of the grip strength curve, comparing four traditional machine learning and deep learning models. The assessment method is natural, precise, and comfortable. Experiments demonstrated that RFR performed best in regression fitting of force curves, achieving an R2 score of 0.9563 for its test data. Although the fit accuracy is already notable, there is potential for further enhancement, particularly in aspects such as model training speed. Future efforts will focus on integrating additional sensors to capture a wider array of data types for composite experiments, thereby enriching the assessment’s dimensionality and comprehensiveness.
Author Contributions
Conceptualization, Z.Z. and Q.W.; Methodology, Z.Z. and Q.W.; Software, Z.Z.; Validation, Z.Z.; Formal analysis, Z.Z.; Investigation, Z.Z.; Resources, Z.Z.; Data curation, Z.Z.; Writing—original draft, Z.Z.; Writing—review and editing, Q.W.; Visualization, Z.Z.; Supervision, Q.W.; Project administration, Q.W.; Funding acquisition, Q.W. All authors have read and agreed to the published version of the manuscript.
Funding
This research was funded by Zhejiang Province philosophy and social science planning project, grant number 20NDJO084YB; Key Research & Development Program of Zhejiang Province, grant number 2023C01041; and Key Research & Development Program of Zhejiang Province, grant number 2021C02012.
Institutional Review Board Statement
The study was conducted in accordance with the Declaration of Helsinki, and approved by the Ethics Committee of Zhejiang Sci-Tech University (protocol code 01/1010/2023 and date of approval: 10 October 2023).
Informed Consent Statement
Informed consent was obtained from all subjects involved in the study.
Data Availability Statement
Data are contained within the article.
Acknowledgments
These research activities are currently supported by Zhejiang Sci-Tech University. The authors of this manuscript would like to thank their colleagues from the above-mentioned institutions, who have largely contributed to the success of this work.
Conflicts of Interest
The authors declare no conflicts of interest.
References
- Amprimo, G.; Ferraris, C.; Masi, G.; Pettiti, G.; Priano, L. GMH-D: Combining Google MediaPipe and RGB-Depth Cameras for Hand Motor Skills Remote Assessment. In Proceedings of the 2022 IEEE International Conference on Digital Health (ICDH), Barcelona, Spain, 10–16 July 2022; pp. 132–141. [Google Scholar]
- Van Omen, M. Relationship of Grip Strength and Quality of Life among Community-Dwelling Older Adults. Honors Thesis, Western Michigan University, Kalamazoo, MI, USA, 2019. [Google Scholar]
- Jansen, E.; Haenel, P. Social Integration of Migrant Physicians in Inpatient Rehabilitation. Eur. J. Public Health 2020, 30, ckaa166-624. [Google Scholar] [CrossRef]
- Arboleda, O.F.P.; Andrade, B.B.C.; Figueroa, E.C.P. Device for Hand Motor Rehabilitation, Using Grip Force Sensing. South Fla. J. Dev. 2021, 2, 3126–3134. [Google Scholar] [CrossRef]
- Vorapojpisut, S.; Hillairet, K.; Boriboonsak, A.; Misa, P. A Myo Armband-Based Measurement Platform for Hand Rehabilitation Applications. In Proceedings of the International Convention on Rehabilitation Engineering & Assistive Technology, Singapore, 25–28 July 2016; Singapore Therapeutic, Assistive & Rehabilitative Technologies (START) Centre: Singapore, 2016; pp. 1–4. [Google Scholar]
- Alfian Hidayat, A.; Arief, Z.; Happyanto, D.C. LOVETT Scaling with Flex Sensor and MYO Armband for Monitoring Finger Muscles Therapy of Post-Stroke People. Emit. Int. J. Eng. Technol. 2016, 3, 60–76. [Google Scholar] [CrossRef]
- Ho, B.-J.; Liu, R.; Tseng, H.-Y.; Srivastava, M. MyoBuddy: Detecting Barbell Weight Using Electromyogram Sensors. In Proceedings of the 1st Workshop on Digital Biomarkers, Niagara Falls, NY, USA, 23 June 2017; Association for Computing Machinery: New York, NY, USA, 2017; pp. 27–32. [Google Scholar]
- Cifrek, M.; Medved, V.; Tonković, S.; Ostojić, S. Surface EMG Based Muscle Fatigue Evaluation in Biomechanics. Clin. Biomech. 2009, 24, 327–340. [Google Scholar] [CrossRef] [PubMed]
- Hekmatmanesh, A. Investigation of EEG Signal Processing for Rehabilitation Robot Control; Lappeenranta-Lahti University of Technology LUT: Lappeenranta, Finland, 2019; ISBN 978-952-335-479-1. [Google Scholar]
- Tsoupikova, D.; Stoykov, N.S.; Corrigan, M.; Thielbar, K.; Vick, R.; Li, Y.; Triandafilou, K.; Preuss, F.; Kamper, D. Virtual Immersion for Post-Stroke Hand Rehabilitation Therapy. Ann. Biomed. Eng. 2015, 43, 467–477. [Google Scholar] [CrossRef] [PubMed]
- Wallace, J.W.; Power, G.A.; Rice, C.L.; Dalton, B.H. Time-Dependent Neuromuscular Parameters in the Plantar Flexors Support Greater Fatigability of Old Compared with Younger Males. Exp. Gerontol. 2016, 74, 13–20. [Google Scholar] [CrossRef] [PubMed]
- Watanabe, K.; Kouzaki, M.; Ogawa, M.; Akima, H.; Moritani, T. Relationships between Muscle Strength and Multi-Channel Surface EMG Parameters in Eighty-Eight Elderly. Eur. Rev. Aging Phys. Act. 2018, 15, 3. [Google Scholar] [CrossRef] [PubMed]
- Shin, S.-W.; Jeong, S.-H.; Chung, S.-T. Evaluation of Hand Grip Strength and EMG Signal on Visual Reaction. Korean J. Appl. Biomech. 2014, 24, 161–166. [Google Scholar] [CrossRef]
- Qijun, L.; Fangteng, Z. Research on Improved SVR Strength Smart Prediction Using Support Vector Machine Regression Algorithm and sEMG. In Proceedings of the 2021 IEEE International Conference on Data Science and Computer Application (ICDSCA), Dalian, China, 29 October 2021; pp. 142–143. [Google Scholar]
- Trinidad-Fernández, M.; González-Molina, F.; Moya-Esteban, A.; Roldán-Jiménez, C.; González-Sánchez, M.; Cuesta-Vargas, A.I. Muscle Activity and Architecture as a Predictor of Hand-Grip Strength. Physiol. Meas. 2020, 41, 075008. [Google Scholar] [CrossRef] [PubMed]
- Suppiah, R.; Kim, N.; Sharma, A.; Abidi, K. Fuzzy Inference System (FIS)-Long Short-Term Memory (LSTM) Network for Electromyography (EMG) Signal Analysis. Biomed. Phys. Eng. Express 2022, 8, 065032. [Google Scholar] [CrossRef] [PubMed]
| Disclaimer/Publisher’s Note: The statements, opinions and data contained in all publications are solely those of the individual author(s) and contributor(s) and not of MDPI and/or the editor(s). MDPI and/or the editor(s) disclaim responsibility for any injury to people or property resulting from any ideas, methods, instructions or products referred to in the content. |
© 2024 by the authors. Licensee MDPI, Basel, Switzerland. This article is an open access article distributed under the terms and conditions of the Creative Commons Attribution (CC BY) license (https://creativecommons.org/licenses/by/4.0/).


