1. Introduction
The Internet of Things (IoT) has emerged as a revolutionary technology that connects various devices and systems to a network, allowing them to communicate and exchange data, thus revolutionizing the way we interact with the world around us. The proliferation of the IoT has ushered in a new era of smart and interconnected systems capable of improving efficiency, automating processes, and improving quality of life. This technology has found uses in a variety of industries, including healthcare, agriculture, transportation, smart cities, and energy [
1]. In recent years, the integration of IoT in education has been a growing trend, offering innovative solutions for teaching and learning [
2]. IoT technology has the potential to create interactive and immersive learning experiences that can improve student engagement, motivation, and learning outcomes due to the low-cost functionalities of smart devices [
3]. These devices can collect and analyze data to improve educational quality and help educators make informed decisions [
4]. As a consequence, they promote creativity, critical thinking, communication, and collaboration, leading to the development of higher-order thinking skills among learners [
5]. Furthermore, the IoT can help bridge the digital divide by providing students with equal access to education regardless of their location or socioeconomic status [
6].
Children, in particular, are benefiting from the incorporation of the IoT in education, since their daily activities primarily focus on the manipulation of physical materials such as toys [
7]. Various IoT integration methods for child users have been investigated in this regard. For example, a study presented in [
8] sought to improve the vocabulary learning of foreign language children by using multimodal cues in a task-based learning system composed of an educational robot and a 3D book powered by the IoT. According to the findings of the user study, the researchers believed that the use of multimodal cues can improve vocabulary learning for children learning a foreign language. The research presented in [
9] focuses on the design and development of an IoT device that teaches children about smart agriculture and the programming of smart farm systems.
Modern-day children are commonly referred to as digital natives, as they have grown up with current technology being ubiquitous and seamlessly integrated into their daily lives [
10]. They are known for their natural and intuitive ability to interact with technology and use digital devices effectively. This proficiency has revolutionized the way they learn, resulting in new methods and modalities of knowledge acquisition [
11]. One major area that has been impacted by the rise of digital natives is science, technology, engineering, and mathematics (STEM) education [
12]. With the growing importance of technology in almost every aspect of our lives, including IoT applications, the demand for skilled professionals in the STEM field has increased significantly. In response, countries around the world, such as in the European Union, are placing a renewed focus on STEM education and revising their school curricula to make it more engaging and relevant for young learners [
13,
14]. Therefore, to facilitate meaningful and deeper learning in these areas, future IoT educational applications should be specifically designed to promote the development of abstract mathematical concepts [
11,
15].
In this regard, both scientific research and commercial applications have focused on toys with IoT features such as software and sensors, commonly referred to as smart toys [
16]. These toys are characterized by their ability to facilitate two-way interactions between children and toys, using both tangible objects and electronic components. Smart toys offer a unique play experience that differs from traditional toys by providing an interactive environment that promotes general child development [
17]. Moreover, as such, they have the potential to aid in the development of thinking and problem-solving skills, particularly in relation to abstract mathematical concepts such as geometry [
18]. Although geometry is an essential subject in mathematics, many students struggle to visualize its concepts, which can impede their ability to learn and apply geometric principles effectively in the future [
15].
Recent studies emphasize that there are currently limited empirical studies on STEM education in young children [
19]. According to a rather novel study, there is little research on how children interact with IoT-based geometry learning systems and how these systems can be effectively integrated into educational settings [
20]. In general, additional research is required to evaluate the effectiveness of smart toys in facilitating the learning process [
17], while the authors in [
21] suggest that the incorporation of such technology has the potential to revolutionize education.
This study introduces a novel approach to early childhood education by designing and evaluating the first prototype of a smart learning toy for preschool geometry education.
Section 2 provides a review of the current state of the art in smart toys for STEM education, highlighting their benefits, limitations, and gaps that the present study aims to address.
Section 3 outlines the materials and methods used for prototype design, including hardware components and machine learning algorithms for gesture-initiated feedback. The hardware components include sensors to detect movement and position, a microcontroller for data processing, and a speaker for feedback delivery. Machine learning algorithms were tested and utilized to recognize complex gestures that form a particular geometric shape.
Section 4 reports the findings of a pilot user study that involved preschool-aged children interacting with the prototype toy in an experiment session. The study aimed to assess the usability, level of engagement, and motor aspects of interactions with the IoT smart toy designed to promote geometry learning among preschool children.
Section 5 and
Section 6 provide a comprehensive discussion and conclusions, respectively, on the design, usability, and performance of the smart learning toy for preschool geometry education. The study’s findings contribute valuable insights to the field of education technology, demonstrating the potential of IoT-based learning systems to improve early childhood education.
2. State of the Art
The application of technology to toys and its impact on children’s interaction with them has become an area of increasing focus for the scientific community due to the vital role that toys play in the development of children [
17]. Smart toys, which incorporate digital features such as software or sensors, provide a more interactive environment than traditional toys, fostering the development of cognitive, social, and behavioral skills in children [
16,
22]. According to toy manufacturers and marketers, the possibilities of using smart and connected toys in education appear to offer rich, interactive, innovative, and mobile learning experiences for preschool children [
23]. As such, smart toys have emerged as a promising tool for STEM education in preschool children [
24]. For successful STEM education, research has emphasized the importance of improving mathematical skills, programming skills, and problem-solving skills. The design and implementation of technology for learning cannot take place without taking into account the psychological aspects of a child’s development that affect their ability to learn and interact with technology, on the one hand, and the pedagogical practices that improve those abilities, on the other [
12,
15,
25]. STEM education for children is based on the principle of introducing them to programming through a high-level language, which was pioneered by Seymour Papert [
26] with his development of Logo Turtles. This approach is based on Piaget’s theory of cognitive constructivism [
27]. In recent decades, educational technology research has been influenced by Piaget’s theory of cognitive development and Montessori’s educational approach, which emphasize the importance of hands-on learning and the manipulation of objects in the development of logical–mathematical knowledge [
27,
28]. Studies have shown that physical manipulation plays a critical role in the development of thinking skills, enabling the transition between physical and virtual representations and simplifying abstract concepts for young children [
29]. Interactive features such as sound, animation, and movement-initiated feedback can also provide rich contextual information to enhance learning and motivate children to complete tasks successfully [
11].
A study presented in [
17] provides a review of smart toys from the last 30 years, focusing on toys for children in early childhood and primary school by analyzing and categorizing smart toys based on their technological and educational capabilities. One of the major findings of the study emphasizes that, in recent years, smart toys have focused on special sciences (programming) and some skills of the 21st century (STEM and computational thinking). On the contrary, in the first 20 years, a greater emphasis was placed on cross-disciplinary skills such as collaboration, emotional thinking, symbolic thinking, storytelling, and problem solving. We have adopted the smart toy categorizations from this research. Another novel research study presented in [
30] aimed to review 30 computational toys and kits designed for children aged 7 years and under, including physical, virtual, and hybrid kits. Qualitative analysis examined the kits’ design, support for exploring computational concepts and practices, participation in projects and activities, and exploration of other domains of knowledge. The study presents design suggestions and opportunities to expand the exploration of computational concepts, new modes of expression, and expanded support for children from underrepresented groups in computing. The findings reveal commonalities between existing kits and suggest ways for designers and researchers to improve the possibilities for children to create, explore, and play with computing.
Smart toys are now being scientifically researched in the STEM context for preschool education. For example, the KIBO Robot Demo is an educational robot designed to teach young children (ages 4 to 8) programming and engineering concepts [
31]. The children can program the robot using wooden blocks with barcodes, learning basic programming concepts such as sequencing, loops, and conditional statements. The system has been tested in a variety of settings and has been shown to effectively engage children in programming and engineering. Research presented in [
32] focused on the development of a smart toy called ABBOT, designed to motivate children to become outdoor explorers. ABBOT is equipped with sensors that allow it to collect environmental data such as temperature, humidity, and light levels. The device is also designed to encourage children to participate in outdoor activities and learn about their environment by providing feedback and rewards. The research study presented in [
33] described the anthropomorphic design, development, and testing of a prototype called OBSY, which is an observation learning system aimed at facilitating the learning of scientific concepts for primary school children in Thailand. The system consists of a ubiquitous sensor-based device that resembles an octopus with a mobile web application hosted on the device. Sensors attached to the OBSY device collect environmental data, which is then interpreted using the web application accessed through tablet computers. The system was developed through a user-centered design approach and aims to promote learning science in an engaging and interactive way. The study presented in [
34] described the design and interactive behavior of a tangible augmented reality toy kit that teaches preschool children about color mixing, mathematics, and geometric 2D–3D shapes. The game allows children to interact with both physical and on-screen objects using touch-screen and AR interactions. The researchers conclude that the game has the potential to improve the learning experience for young children and to promote interest in STEM fields. Through tangible programming, the study presented in [
9] investigated the use of IoT technology in the smart farming education of children. It involved creating a tangible programming kit that simulates a smart farming system using sensors and Internet of Things devices. User testing revealed that the kit was effective in promoting engagement and learning in young children and has the potential to improve learning in the fields of agriculture and technology.
Research in [
24,
35] investigated coding with two commercial smart toy robots, Dash and Botley, as part of playful learning in the context of Finnish early education. The results of our study show how Finnish preschoolers aged 5–6 years approached, conducted, and played coding with the two toy robots. The study’s main conclusion was that preschoolers used toy robots with coding affordances primarily in developing gamified play around them by designing tracks for the toys, programming the toys to solve obstacle paths, and competing in player-generated dexterity, speed, and physically mobile play contests.
A rather recent study presented in [
36] examined the effects of didactic approaches in guiding early childhood children in learning computational logic and programming concepts. To develop the students’ cognitive skills, a teaching methodology was developed that utilizes a commercial smart mBot Arduino robot. mBot is a beginner-friendly educational robot that makes programming and learning robots simple and enjoyable. mBot also helps develop logical thinking and design skills. The study concluded that the developed method enhances learning processes and computational thinking abilities.
In recent years, due to the development of smart toys that are enhanced with the Internet of Things (IoT) and can connect to the Internet, there has been a growing body of research on cyber security and privacy risks of smart toys. The studies presented in [
37,
38] focused on reviewing major smart toy-related children’s privacy risks and the major mitigations to such risks.
Despite requests from the scientific community to investigate how to best incorporate new technology into the formal and informal learning contexts of young children, the design and development periods of new smart toys have not been adequately emphasized, as highlighted by the research in [
39]. Therefore, these authors applied a design and development research method to create guidelines for designing and using smart toys for preschool children. The research examined a smart toy developed in a pilot study, held focus group meetings with early childhood teachers, created two prototypes, and tested them with preschool children, teachers, and scholars. The study divided the design guidelines into three categories: content, visual design, and interaction.
Based on the literature, the use of smart toys in preschool education represents a promising approach to fostering STEM skills in young children, and, in that regard, learning geometry at an early age is crucial for the development of spatial reasoning skills. Studies indicate that it is critical to introduce geometry in the preschool period, when the first critical geometrical observations are made [
40,
41]. In that regard, recent studies on gestures emphasize the body’s significance in spatial and geometric reasoning, highlighting the importance of kinetic movement in the genesis and development of abstract geometrical cognition in early years [
42,
43,
44,
45].
Aligned with the aforementioned rationale, the present study was designed to explicate the design, development, and evaluation of a plush smart toy prototype aimed at facilitating the teaching of geometric shapes to young children. Through the pilot study user evaluation, we intend to investigate the nature of the children’s engagement with the smart toy prototype, to test its feasibility, and to gather some initial data on the toy’s effectiveness. Thus, we will be able to gain valuable insights into the experiences of children as they use the toy and identify potential areas for design improvement.
3. Materials and Methods
3.1. Toy and Interaction Design
In order to design a smart toy for learning geometry, we chose to integrate IoT sensing technology in conjunction with appropriate machine learning algorithms into a commercially available plush giraffe toy. This allowed us to take advantage of the softness, familiarity, and flexibility of the design of the plush toy while also providing a dynamic and engaging learning experience for children. The flexibility of the design of the plush toy allows for the seamless integration of IoT technology. Sensors and other electronic components can easily be embedded within the toy while still maintaining the overall aesthetic and feel of the toy. Plush toys are considered soft and safe for children to play with, making them an ideal platform for designing interactive toys. Second, plush toys are often familiar to children, providing a comforting and appealing object to interact with [
46,
47]. This familiarity can help children form an emotional connection with their smart toy, making the experience more personalized and enjoyable. Research has indicated that animal (plush included) and robot toys are generally regarded as gender neutral, which provided us with an intriguing opportunity to determine whether or not children of different genders prefer one toy over another [
48]. Plush toys have been applied and investigated throughout the years of research, as in [
39,
49,
50,
51].
The main hardware components of the smart toy are presented in
Figure 1. The specific functions of the components are elaborated in the rest of this section.
The proposed interactions with the toy occur in the following manner: Digital representations of geometrical shapes are displayed on the LCD screen, followed by an audible signal. The child is required to map the shape presented on the screen by drawing the shape above the sensor module detection area using hand movements. This allows the child to map an abstract geometric shape from its digital representation on screen into its embodied representation. The machine learning algorithm incorporated in the smart toy detects whether the gesture outline drawn by the child matches the shape presented on the LCD screen. This provides immediate feedback to the child, allowing them to understand if they have correctly identified and drawn the shape. This approach reduces the child’s cognitive effort and promotes effortless interaction with the system [
52]. The use of hand gestures to interact with the device improves its usability, particularly for young children, and can contribute to the development of fine motor skills. Fine motor skills are increasingly recognized as an important aspect of early childhood development and have been linked to better learning capabilities and overall cognitive development [
53]. Current studies on gestures emphasize the role of kinetic movement in the origin and development of abstract geometrical cognition in childhood [
42,
44,
45]. The audio and visual feedback provided by the toy also enriches the learning experience, making it more engaging and enjoyable for the child. Furthermore, this type of activity can also promote the development of spatial skills, which are critical to success in STEM fields such as mathematics and science [
54].
3.2. Hardware
The main functionality of our proposed system is simple in design (as originally planned) and is based on a microcontroller with additional modules attached. We considered several commercially available microcontroller boards for use as the core of the proposed system, where the minimum requirement was the ability to log data onto a microSD card and perform real-time acquisition from the utilized sensors. As most of the considered sensors outputted simple analog signals and did not require any other on-the-fly communication with the microcontroller, any microcontroller board with at least four multiplexed 10-bit A/D inputs would be sufficient for the data acquisition task. In a scenario where four analog sensors are used with 50 readings per second, 400 Bytes would be required for every second of measurement. This led us to a simple calculation that 10 s of acquisition required at least 4 KB of RAM. ATMEGA328P-based microcontroller boards are widely available (used mostly in the Arduino family of microcontroller boards), but only 2 KB of RAM made it nearly impossible to perform real-time acquisition for a prolonged period. As additional data preprocessing was considered (and was finally implemented), together with the possibility of ML inference on the microcontroller itself, a more capable 32-bit microcontroller board was required.
The Teensy 3.6 microcontroller board features an ARM Cortex-M4 MK66FX1M0VMD18 core with 1024 KB Flash and 256 K RAM and clocked at 180 MHz (overclockable at 240 MHz). This computer board is not the fastest microcontroller board available on the market today (even within the Teensy family of microcontroller boards), but it was capable of performing all the planned tasks during the development stage of the proposed system. A compatible pinout with the fastest Teensy 4.1 Development Board (ARM Cortex-M7 at 600 MHz, 7936 K Flash, and 1024 K RAM) made a seamless upgrade possible, if more complex, and resource-hungry ML were to be implemented during future development. Teensy microcontrollers are compatible with the SdFat library (
https://github.com/greiman/SdFat (accessed on 11 April 2023)) that allows extremely fast file writing, reading, and handling. A SanDisk Class 10 MicroSD card was used for logging the measured data, but any other class 10 microSD card would be sufficient for the task.
As feedback to the user, we implemented both audio and visual components. A piezoelectric speaker (buzzer) could provide limited and short monophonic melodies used for indicating the start and end of the measurement or the error state within the system. Visual feedback was provided using a Newhaven 4.3 inch TFT display with an integrated FTDI FT800 TFT Controller. The display featured a 480 × 272 px resolution, could display up to 262 K colors, and interfaced with the microcontroller using SPI, which can be clocked up to a 30 MHz clock rate. The advanced library provided by Newhaven (
https://github.com/NewhavenDisplay/FTDI_FT800/ (accessed on 11 April 2023)) enabled easy integration into the system and the effortless creation of simple geometrical objects to be displayed together with progress bar objects. The extremely fast SPI interfacing did not interfere with the measurement process at all as the TFT content was refreshed only once per second. Additionally, the pushbutton was connected via a long cable to the interrupt-enabled GPIO pin and used as a trigger for the measurement start.
During the development and testing stage of the system, the microcontroller board was directly connected to the PC using a 480 Mbit/s USB 2.0 interface. This configuration allowed insight into all raw sensor data, more flexibility when testing different ML models, and deeper information on the performance of each ML classification algorithm tested. Model training and inference were performed on a dedicated laptop computer. To be more precise, the machine features an Intel(R) Core(TM) i7-7700HQ@2.80 GHz processor, 16 GB of RAM, and NVIDIA GeForce GTX 1050 Ti CUDA capable graphics card and ran a 64-bit Windows 10 operating system. For more efficient computing with GPU, the NVIDIA CUDA deep neural network library (cuDNN) was applied. All PC-based code was written for Python 3.8 with Tensorflow 2.2.0 on top.
A schematic of all electronic components and interfaces between devices is presented in
Figure 3. As the USB 2.0 interface used to connect the examiner PC was relatively long (≈2 m), the PC could be placed away from the tested device, thus not obstructing the subject’s concentration or interfering with the measurements in any way. In the development stage, the microcontroller board together with all the attached components could be powered via a USB cable or by its own battery source (via a power bank connected directly to the Vin and GND pins).
3.3. Sensing Technology
To locate a hand in space, several possibilities were considered, including visual recognition, capacitive sensors, ultrasonic sensors, TOF sensors, and finally, selected infrared sensors. Our aim, on the hardware side, was to create the simplest possible gesture recognition device that could be completely embedded into a plush toy body and could run data acquisition, ML model inference, and visualization using a single embedded microcontroller. The whole system is based around the microcontroller rather than a single-board computer (such as the Raspberry PI) due to power requirements (longer battery autonomy) and faster boot-up times. Using an RGB (or RGBD) camera as a sensor in real-time was a plausible option that would require a powerful embedded computer to process data in real-time [
55,
56]. As an alternative, proximity sensors were primarily selected due to their low price, minimal power requirements, and relatively simple 1D output. Ultrasonic distance sensors HC-SR04 (
https://cdn.sparkfun.com/datasheets/Sensors/Proximity/HCSR04.pdf (accessed on 11 April 2023)) initially showed themselves to be a valid choice for the proposed system, where their conical-shaped sensing area enabled the detection and distance measurement in large volumes. Unfortunately, the use of several ultrasonic sensors in overlapping sensing areas showed unsatisfactory performance due to interference and achieved a useful acquisition rate lower than 10 Hz. The third type of sensor initially considered was an array of TOF VL53L0X (
https://www.st.com/en/imaging-and-photonics-solutions/vl53l0x.html (accessed on 11 April 2023)) distance sensors. TOF sensors are superior in tasks involving precise distance measurement and a high refresh rate due to their principle of operation and small sensing area (which is point-sized); the proposed system would require a dense array of sensors to reliably detect and track hand movement. Like the camera in the visual recognition approach, this sensor type was also discarded due to the overall cost and complexity of the system.
An in-house developed capacitive proximity sensor [
57] was selected for the initial prototype version of the device. Featuring a ≈10 cm sensing range and low power consumption, this presented an adequate candidate for gesture sensing. In order to allow for gesture recognition in a two-dimensional plane, a set of two sensors was employed. As presented in
Figure 4, two capacitive sensors were mounted on the neck of a plush toy. This arrangement created a kind of virtual canvas, spreading behind the neck and above the back of the plush toy, for users to perform their gestures on. This broadened the number of discernible gestures when compared to a single-sensor scenario.
One of the most critical parts of the capacitive sensor is its sensing element. The material of which it is made as well as its shape and size extremely determine the sensing range of the device. This is caused by different amounts of ambient capacitance added to the sensing oscillator. This capacitance is compensated for during the calibration procedure by adjusting a digital potentiometer in the reference oscillator. The conductivity of the sensing element greatly influences the charge distribution along its surface. As the exact behavior of the sensor with different sensing elements is impossible to determine, we decided to use an experimental approach by switching materials as well as sizes. In the end we opted for a copper sheet because it allowed for the greatest sensing range. The final size of the sensing element was also experimentally determined in terms of being large enough to provide an adequate sensing range but not introducing an enormous amount of ambient capacitance, which would interfere with the calibration procedure.
The calibration procedure is based on equalizing the frequencies of two oscillators (sensing and reference) while there are no moving objects present within the sensing range of the device. As a result, after a successful calibration, the output voltage from the sensor is at its maximum value. Bringing an object within a sensing range reduces the output voltage in proportion to the distance from the object. If the device operates in a static environment, a single calibration run should be sufficient. By default, the calibration is activated during each power-on or reset sequence. However, if the device needs to be recalibrated for gesture recognition purposes, this can be performed at the user’s discretion. Geometrical shapes are displayed on the LCD screen, followed by an audible signal. The user interacts with the toy by making a gesture in the sensing field of the capacitive sensors, thus mapping the presented shape. This interaction produces two time-series vectors (one for each sensor) that are stored on the microSD card.
Another sensor that was considered was an infrared beam sensor, particularly a Sharp GP2Y0A21YK0F Analog Distance Sensor (
https://global.sharp/products/device/lineup/data/pdf/datasheet/gp2y0a21yk_e.pdf (accessed on 11 April 2023)). This sensor can obtain measurements up to 80 cm. There are a few similar models that are electrically compatible but have different ranges, such as GP2Y0A21YK0F, which works up to a 30 cm distance. All the aforementioned sensors are analog, which means that they yield a signal roughly in the range of 0–5 V, which can be read using the microcontroller’s integrated AD converter. The relationship of the measured distance and the output analog signal is not linear, thus recalculations must be performed to obtain the exact distance. Additionally, the IR-type distance sensors have relatively large minimal measurement distances (4 cm for GP2Y0A21YK0F model and 10 cm for GP2Y0A21YK0F model), where readings follow different non-linear relations and thus are unusable. The sensor was composed of an IR LED emitter that projects a light beam and a receiver in the form of a simple 1D camera that measures the reflected light that is returned from the object. Since the sensor measures the light reflected by the object, it may be affected by the environmental lighting conditions. Another aspect that must be considered to obtain a reliable measure is the internal update period of approximately 40 ms, where the sensor outputs faulty readings during a short period of recalculation. A solution was proposed of increasing the system refresh rate to 50 Hz and data preprocessing, as described in
Section 3.5. The 30 cm and 80 cm IR sensors were tested in real scenarios, and the readings were compared to select the optimal solution. The 30 cm version had a shorter minimal distance, thus users’ hands can be closer to the sensor module, but a shorter maximum distance also showed in practice that some gestures performed in the larger area over the sensor module can be misinterpreted. On the contrary, the 80 cm sensor version has a longer minimal distance; consequently, the distance to an object closer to a sensor module is misinterpreted. A longer maximum distance allowed the sensor to track gestures performed in larger volumes and was thus selected as optimal (but not perfect) for our system.
3.4. Data Collection
The scientific literature has extensively investigated the use of machine learning models for complex hand gesture recognition, and various approaches have been proposed for conducting preliminary testing. Hand gestures are an important part of nonverbal communication with other humans and are an integral part of interaction with the environment [
58]. They are characterized by trajectories of the hand key points in the space and can be recorded by a variety of devices, which can be divided into two types: wearable and non-wearable. Wearable devices use miniature body-borne computational and sensory components, such as various inertial sensors placed on hand key points [
59] or glove-like devices that can even track complex finger movements [
60]. These types of devices require wearing cumbersome equipment or cables that connect the device to a computer and require preparation before use. Non-wearable devices are commonly vision-based devices [
61,
62] or employ simple proximity/distance sensors to track the location of the hand in space [
63,
64]. The main drawbacks of most vision-based systems are their inability to track hand position beyond the camera’s field of view, their sensitivity to challenging lighting conditions (in outdoor applications), and their computational complexity. Time-of-flight (TOF) cameras are special types of cameras that measure the distance to a large number of points in space and are commonly employed as input devices to game consoles, where they can track hand movements and detect some specific gestures [
65,
66]. Both devices are complex and require a computer instead of a microcontroller to read and process measured data. The development of small and simple HCI systems based on proximity and distance sensors using relatively inexpensive components has created new opportunities for novel and cost-effective human–computer interface designs [
67]. A similar approach is considered in our research, where the developed sensor module relies on an array of simple and inexpensive distance measurement sensors.
Building accurate and robust models for complex hand gesture recognition is challenging due to the diversity and complexity of hand gestures. Therefore, preliminary testing of machine learning models with collected data is critical to ensuring their reliability and effectiveness.
Data were collected from eight adult individuals to serve as data for building a machine learning model. The research employed a non-probability sampling method known as convenience sampling, which entails selecting study participants who are easily accessible and willing to participate. In this case, those were academic staff involved in the research project on a wider scope. All subjects signed an informed consent form in accordance with the Declaration of Helsinki and approved by the Ethics Committee of the Faculty of Electrical Engineering, Mechanical Engineering, and Naval Architecture. Each individual performed gesture movements for around an hour. In general, around 200 gestures (depending on the sensing technology) were gathered per individual and were later processed, depending on the sensing technology.
3.5. Data Preprocessing
Raw sensor data were pre-processed before input to ANN to improve the accuracy and efficiency of the machine learning models. Due to the nature of the sensors used, the raw data are noisy and inconsistent, making it difficult to extract meaningful information. Data preprocessing helps to address these issues and prepares the data for analysis through data transformation, data cleaning, and data reduction. Data transformation converts data into a more suitable format by performing linear or non-linear scaling and normalization of numerical values. As a notable example, the IR distance sensor outputs non-linear analog data that could be transformed into a linear distance [
68].
By performing non-linear scaling before feeding data to an ML model, the first layers of our machine learning model do not have to find relations between non-linear voltage input and actual linear distance and can focus on resolving hand gestures from transformed linear distance data. The data cleaning technique removes or corrects errors and inconsistencies and predicts missing values. This requirement is again presented on the IR distance sensor, which internally updates readings with a 25 Hz refresh rate while our system is set to a fixed 50 Hz refresh rate. The faster refresh rate was required as the IR distance sensor outputs faulty readings during short periods of internal distance recalculation, and there is the possibility of reading the sensor output during that exact moment. By having more readings than required, simple data filtering can be performed, and outliers are simply removed and replaced with mean neighboring values (using a mean filter). The data reduction technique effectively reduces the size of the dataset while still preserving important information. As reported in the literature, human self-paced movements are within the 3.3 Hz bandwidth (ref), thus the system’s 50 Hz sampling rate is excessive for recognizing complex hand gestures. Additionally, the training and inference times of any ML model are significantly reduced by reducing the input size. By our conservative estimation and general experience, a 10 Hz refresh rate was selected as optimal as it balanced the performance and complexity of the ML model. Data reduction was performed by resampling 500 inputs per sensor (for a 10 s measurement time) to 100 inputs using cubic spline interpolation. When data are resampled at a five-fold lower rate, noisy sensor inputs are filtered, and readings are smoothed, as shown in
Figure 5. By resampling the data to a 1:5 rate, we effectively achieved low-pass filtering and simplification (reduction) of the ML model. With this approach, we effectively reduced the 50 Hz sensor acquisition rate to a 20 Hz acquisition rate, which is still suitable to recognize complex hand gestures. If a lower acquisition rate were to be used, some faster movements may be tracked with an inadequate number of samples, thus preventing accurate recognition. Additionally, when the original input vector (4 × 500 samples) is used for ML training with a similar ML model (only the input size was modified), the categorical accuracy of the test is significantly reduced to 0.86 and the model size to around 6.3 MB (1.4 MB for resampled inputs), which may be inadequate for ML implementation on microcontrollers.
An additional pre-processing step was also considered, where only data belonging to the performed gesture are extracted and forwarded to an ML model. This is usually conducted by observing the first and the last samples, where the object is detected by sensors, and extracting all the samples in between. This approach was shown to be unreliable in practice, as the subject may place the hand in the sensed area long before or keep it there long after the required gesture is performed. An example of movement is depicted in
Figure 5, where some readings exist throughout the measurement time and do not represent the gesture performed. Thus, an alternative approach was considered, where the complete measurement is forwarded to an ML model with the task of recognizing which gesture was executed at any moment during the allowed measurement time. This was achieved by relying on 1D convolution, which is described in the next section.
3.6. Machine Learning: Test and Training
Machine learning has a wide range of applications across various industries and research fields. Some of the most common applications of machine learning today are image and speech recognition, natural language processing, autonomous vehicles and robotics, the Internet of Things, and predictive analytics [
69,
70,
71,
72]. As technology advances and data become more abundant, the use of machine learning is expected to increase and be implemented in almost every aspect of life. There are many microcontrollers available today that have enough processing power and memory to run machine learning algorithms, with benefits including reduced latency, lower power consumption, and improved privacy and security [
73,
74].
An artificial neural network (ANN) is a type of machine learning model inspired by the biological structure and functioning of the human brain. It consists of interconnected processing nodes (neurons) that work together to solve a specific problem. Neural networks are typically arranged in a series of interconnected layers, where each layer is made up of a set of neurons that perform a specific mathematical function on the received input. A typical fully connected ANN consists of several types of ANN layers, including input layers, hidden layers, and output layers. Input layers receive input data, (several) hidden layers perform computations where the output of one hidden layer is then passed as input to the next layer, and finally, the output layer produces the final output. Biological neural networks exhibit similar architecture and learning methods for a variety of tasks, where, due to computer power constraints and training time limitations, ANN architectures must be optimized for a specific task. This is usually performed by combining different types of layers into a specific architecture, such as feedforward neural networks, convolutional neural networks, and recurrent neural networks. Our ANN is tasked with classifying hand gestures, and the network input is data acquired from the sensor module. All tested sensor modules are quite similar and perform distance measurements to the subject hand with different properties, as discussed in
Section 3.3.
Preliminary ML Results
In order to select the most appropriate sensing technology, the collected data from all sensors were first tested by applying a fully connected neural network constructed using the Keras API with TensorFlow as the backend. The training data were pre-processed and normalized. The architecture of the preliminary NN consisted of a sequence of layers that were stacked on top of each other, starting with an input layer, followed by three hidden layers and an output layer. The first hidden layer contained 1024 neurons, with the activation function used in this layer being a rectified linear unit (ReLU). The second hidden layer had 512 neurons and also used the ReLU activation function. The third hidden layer included a dropout layer, used to prevent over-fitting. The dropout rate was set to , which means that of the randomly selected neurons in this layer were ignored during each training iteration. The fourth hidden layer had 64 neurons and used the ReLU activation function. The final layer was the output layer, which had three, four, or five neurons (depending on the number of different gestures we tested). It used the softmax activation function. The softmax function is used to output a probability distribution over the 3–5 possible output classes, where the highest probability corresponds to the predicted class label. Due to the fact that this is a multi-class classification problem, for this experiment, the categorical cross-entropy loss function was applied as the loss (cost) function and adaptive moment optimization (Adam) as the optimizer.
The highest accuracy of classification was obtained for three gestures, namely, the circle, square, and pentagon. For each of the sensing technologies, the accuracy of the preliminary NN model is presented in
Table 1.
Based on these results, the IR long-range data were further employed for machine learning utilization in this research.
3.7. The Final Architecture of Machine Learning
The final architecture of the NN model displayed in this investigation is constructed of eight layers, as depicted in
Figure 6. The first is the input to a 1D convolution layer with 32 filters and 16 kernel sizes. The convolution layer is followed by a flattening, which is then followed by a dense layer with 32 neurons. The dense layer is followed by a dropout layer with a dropout rate of 0.2 and another dense layer with 32 neurons, which is again followed by another dropout layer with a dropout rate of 0.1. The last two layers are the dense layer with 32 neurons and the final output layer. The applied activation functions were ReLU (in dense layers) and softmax (in the output layer). Our proposed architecture is a 1D convolutional neural network, where the convolution layer extracts characteristic features from the signal input and where dense layers try to find relations between the extracted features to classify signals. The dropout rate (probability of setting output from the hidden layer to zero) must be included because of the small training dataset, which prevents the overfitting of the network to a training dataset.
Since the classification of the hand gestures is a multiclass classification problem, the categorical cross-entropy loss function was applied as the loss function. Another key aspect of the ANN model architecture that was thoroughly examined is the selection of optimizers, learning rates, number of epochs, and batch size. Adam provided the most accurate estimation results on the test dataset, with a 0.0005 learning rate. Optimal training results were obtained with 100 epochs and a 128 batch size.
ML models were originally trained in all shapes, but the performance of the test dataset showed unsatisfactory results with a categorical precision of 87.3%. By removing one gesture from the training and test datasets, the categorical accuracy with the remaining four gestures increased to 89.8%, which was also unsatisfactory. Finally, by keeping only three gestures (namely, circle, square, and pentagon), we achieved better categorical accuracy. After performing several repetitions of the classification, the accuracy ranged from 93.8% to 98.3%, depending on the repetition. The results in the form of a confusion matrix for all three models are presented in
Figure 7, and do not show which shape or gesture is to blame for the poor performance of the model with the five gestures in the training dataset.
We analyzed raw training data from different subjects in search of a solution that could eventually improve performance. An example of the analysis is presented in the form of a plot in
Figure 8 for all five gesture-shapes for a single sensor and the same subject. As the system captures raw data in 10 s intervals, useful data (when the user is performing a gesture) take only a few seconds and can be found anywhere inside the original signal. As seen from the sample data presented in
Figure 8, useful data take only 2 s intervals per sensor, while the rest of the data are extremely noisy. Relative timings and shapes of slopes between sensors capturing the same gesture are actual features that have to be extracted and used for gesture recognition and classification. By visual inspection of the raw data for several examples (the same person performing the same gesture), some obvious similarities between signals cannot easily be found. Thus, this non-trivial task was delegated to our proposed ML model, which can extract those features and decide which gesture is performed. A more detailed analysis of measured raw data from all four sensors on several subjects in the training set suggested that shapes 3 and 4 (namely, the triangle and rhombus) are similar to shape 1 (circle). We presume that acquiring more training data would improve the performance of a five-shape ML model by allowing it to find more specific features for each shape and consequently build a better model. Due to the aforementioned reasons, we removed shapes 3 and 4 from the training and test datasets.
4. Exploratory Pilot Study
The purpose of this pilot user evaluation was to collect data on children’s experiences and perceptions of using IoT technology for educational purposes and to identify potential areas for improvement. The evaluation concentrated on some aspects of usability, levels of engagement, and motor aspects of interactions with the proposed smart toy for early childhood geometry education.
Exploratory pilot studies with children are a crucial step in identifying potential issues in usability testing before conducting a larger usability study. The importance of pilot testing and small sample sizes in child-related research has been highlighted in several studies. To design new technologies for children, Druin [
75] used cooperative inquiry with children and found that pilot testing was crucial in refining the design of the technologies. Similarly, in [
76], Druin emphasized the importance of pilot testing when designing mobile technology for children and highlighted the need to involve children in the design process. A group size of five–ten participants is a sensible baseline range for usability studies related to problem discovery, as discussed in [
77]. Small sample sizes in exploratory pilot studies can also be useful for identifying design flaws or other issues that might not be apparent in larger-scale studies. The small sample size allows for more iterative design processes, which can lead to better user engagement with technology [
78]. Additionally, scientific references support the use of small sample sizes in exploratory pilot studies with child participants. For example, in their study of toddlers’ use of visual information from video to guide behavior, Schmitt and Anderson [
79] used a sample size of 16 children, which allowed for detailed observations of individual children’s behaviors and provided rich data for exploring how visual information influences children’s actions. Faulkner’s research, presented in [
80], found that a group size of 10 participants will likely reveal a minimum of 82% of the problems. Nielson in [
81] also noted that elaborate usability tests are a waste of resources and that the best results come from testing no more than five users and running as many small tests as possible.
This study was exploratory in nature, and the objective was to test the feasibility and gather preliminary data before conducting a larger and more rigorous study.
The evaluation involved a small group of children aged 4 to 7 years old, who were given the opportunity to interact with the toy and provide feedback on their experiences. The initial idea was to examine the movements of the child’s hands while interacting with the prototype toy. The results of the testing provide design guidelines for future interaction realization and movement-initiated feedback. The collected data and findings will be useful for our future research into the design of the toy as well as the performance of the machine learning model.
In order to conduct the pilot study, the faculty Ethics Committee gave their positive opinion on the experimental procedure, stating that the proposed scientific research would be carried out in accordance with the ethical principle of scientific integrity. All parents signed a consent form before their children participated in the experiment.
4.1. Experiment Design and Procedure
This user evaluation study aimed to assess the usability, levels of engagement, and motor aspects of interactions with an IoT smart toy designed to promote geometry learning among preschool children. The study used a mixed-methods approach, combining quantitative data from pre- and post-test tasks and usability testing with qualitative and quantitative data from video recordings, questionnaires, and interviews with children.
Based on our analysis of the scientific literature, it was found that most of the studies combined a few techniques: an interactive Cyberheroes e-book was evaluated with structured interviews and questionnaires and engaged eight children aged 7 to 9 years [
34]; a tangible, interactive learning tool, CyberPLAYce, was assessed with observations, surveys, questionnaires, and audio/video recordings and involved eleven 11- to 12-year-old children [
82]; Word Mania, a fun educational game app for children, was evaluated with a Fun Toolkit v3 instrument and enrolled twelve children aged 4 to 9 years [
83]; a study looking at STEM in early childhood education involved 14 pre-kindergarten children and used semi-structured interviews, focus groups, and a questionnaire [
84]. Hourcade and colleagues [
85] recommend using age-appropriate language, providing clear and concise instructions, and using visual aids to support comprehension. Child-friendly data collection methods, such as observation, video recordings, and non-intrusive sensors, can help to minimize disruption and enhance engagement [
86].
The study was carried out in a controlled laboratory setting, with one-on-one interaction between the researcher, participants, and the proposed smart toy. The experimental design, along with materials and methods, is further described.
The assessment process was based on a set of criteria that includes several quantitative and qualitative measures, which are expressed in terms of:
Time-related aspects of interaction (time taken by the user to draw a shape and overall interaction duration;
Hand gestures used to interact with the toy;
Perceived ease of use (mapping of the particular shape);
User mapping accuracy per particular shape;
Engagement;
Returnance (as one of the endurability dimensions);
Fun and subjective satisfaction;
Obtained knowledge.
Several measuring instruments were used to acquire the aforementioned quantitative and qualitative measures:
Pre-test and post-test tasks: employed to evaluate the level of information acquisition as an indicator of the educational value.
Attitude questionnaires (Smileyometer and the Again-Again table) [
87]: used to measure children’s fun and subjective satisfaction.
Structured interview: used as an instrument to measure children’s fun and subjective satisfaction, level of engagement, and their perceived ease of use (mapping of the particular shape).
Video recording: used as an instrument to measure motor aspects of interaction (hand gestures), time-related aspects of interaction, and engagement.
Observation checklist: used as an instrument during the assessment process to record notes, document identified problems, and fill in additional information related to task completion accuracy.
Figure 9 represents the overall framework of the experiment.
Laboratory equipment utilized for the experiment was as follows:
Cardboard geometric shapes and boxes;
Smart toy for geometry learning;
Computer for data collection;
Consent forms for parents/guardians.
Figure 10 gives the graphical representation of the laboratory setup and equipment applied in the experiment.
Experiment Procedure
The experiment procedure was as follows:
Recruitment: The study employed a convenience sampling strategy, which is a non-probability sampling method. Convenience sampling entails selecting study participants who are readily available and willing to participate. The preschool children were recruited by the university staff, including non-scientific personnel and personal research networks, aiming to ensure that the study sample was as diverse as possible. The study was explained to parents/guardians, who were asked to consent to their child’s participation. Overall, fourteen children (seven girls and seven boys) aged from 4 to 7 years old participated in the pilot study. The inclusion criteria included no previous exposure to the smart toy used in the study, as well as no history of developmental or learning disabilities.
Pre-test task: Before interacting with the smart toy, each child was given a pre-test task to assess their current knowledge of basic geometric shapes. Children were given 30 simple cardboard geometric shapes (namely, 10 circles, 10 squares, and 10 pentagons) of different colors and sizes and were asked to put them in the appropriate box for each of the shapes. The evaluation was administered orally by the researcher.
Interaction with the smart toy: Each child had 30 min to play with the toy. The researcher observed the child and documented their level of participation, motor aspects of interaction, interest, and overall behavior while interacting with the smart toy.
Data collection: A video camera was used to record the participants during the experiment. It recorded the duration of the interaction, the accuracy of the completed task, and any errors made by the participants. It also captured the levels of engagement and other aspects of interactions that children had with the toy. Furthermore, the data were also collected by the smart toy in terms of sensor output data obtained from gesture movements.
Post-test task: After interacting with the smart toy, each child completed a post-test task that was the same as the one in the pre-test task. They were again given 30 (new) simple cardboard geometric shapes (namely, 10 circles, 10 squares, and 10 pentagons) of different colors and sizes and were asked to put them in the appropriate box (new) for each of the shapes. The evaluation was administered orally by the researcher. The pre- and post-test tasks were further utilized to examine the effectiveness of the smart toy for geometry learning.
Follow-up interview and questionnaire: The researcher asked close-ended questions about the child’s engagement with the smart toy, its ease of use, their learning experience, and their subjective satisfaction while interacting.
Data Analysis: Analyses of the overall collected data included statistical analysis while focusing on several aspects, such as fun and subjective user satisfactions, ease of use, engagement, returnance, and motor aspects of interaction. The pre- and post-test task results were compared to see if the interaction with the smart toy significantly improved geometry knowledge. The results of the questionnaire, interviews, and video recordings were also analyzed in order to gain insights into the child’s level of engagement and overall satisfaction with the smart toy.
Experimental materials and methods for pilot testing included several techniques. Firstly, for the pre-test and post-test tasks, simple cardboard geometric shapes were utilized. Scientific studies, such as the ones presented in [
88,
89,
90,
91,
92], have shown that cardboard cutouts are a valid and reliable tool in user evaluation studies. Simple cardboard geometric shapes can provide tangible representations of geometric concepts, making them appropriate for young children’s learning. This method can also be used to establish a baseline to assess the effectiveness of educational toys and games in promoting geometric learning. These shapes offer a simple, low-cost, and effective method of assessing children’s geometry skills and knowledge before and after using geometry learning technology. Secondly, a structured interview, as presented in
Table 2, was used to gain insight into the children’s fun and subjective satisfactions, as well as their perceived ease of use (mapping of the particular shape) while playing with the smart toy. During usability evaluations, interviews are another way to investigate the user experience, as was shown in many user evaluation studies with children [
84,
86,
93,
94,
95,
96]. Post-task interviews allow for the collection of observational and verbalization data quickly and without the need for tape analysis. Post-task interviews have the potential to provide benefits at the expense of slightly longer evaluation sessions with children [
86].
Furthermore, to evaluate the children’s experiences in terms of subjective satisfaction, fun, and returnance, this study used two instruments from the Fun Toolkit: a survey instrument designed to help researchers and developers gather opinions about technology from children [
87]. The Fun Toolkit has been used in numerous studies [
20,
93,
97,
98,
99] to assess the usability of interactive technology with children, such as educational games, mobile applications, and interactive toys. It has been found to be a highly effective method to gain insight into children’s technological experiences and identify opportunities for improvement in the design of interactive products and services [
83,
100,
101].
Namely, this research employed two instruments from the Fun Toolkit: the Smileyometer and the Again-Again table. The Smileyometer is a simple tool used to measure children’s subjective experiences with technology by asking them to rate their feelings using a visual scale of smiley faces. The tool is based on a 5-point Likert scale (as presented in
Figure 11), with responses ranging from 1 (awful) to 5 (excellent) (brilliant) [
100].
The Smileyometer has been widely adopted and used in research studies to assess and measure satisfaction and fun in children’s experiences with technology [
20,
97,
101,
102] because it is simple to use and does not require any writing on the part of children.
In this research, to assess how children felt during the interaction with the toy, they were asked “Can you show me, using these pictures, how you felt while playing this game?”. Then they were given Smileyometer rating scale cards to select the face that best suited their subjective feeling.
Another instrument from the Fun Toolkit used for the child user evaluation in this study was the Again-Again table. The table is used to assess the user experience by asking children if they want to repeat an activity again [
87]. It has also been used in research studies [
103,
104,
105,
106], and has proven to be a reliable survey technique when applied to children [
86]. In this research, to measure returnance (as one of the endurability dimensions), we derived the “Again-Again Table” (presented in
Table 3) from the original presented in [
100]. The table was filled by the researcher asking the research question: “Would you like to draw this shape again?”.
Finally, this study used video recording as a tool to enhance three important aspects of interaction, namely: engagement, time-related aspects of interaction (time taken by the user to draw a shape, and overall interaction duration), and hand gestures used to interact with the toy, which were valuable for this research. Over the years, video recording has been shown to be a useful tool to collect detailed information on children’s real-time interactions with technology [
107,
108]. Studies have shown that it is critical to recognize signs of enjoyment to determine whether the child had a positive or negative experience during the course of the interaction [
97] because children often have difficulty articulating their experiences and preferences while using technology. In this context, video recording can be a powerful tool for gathering data and making informed decisions about how to improve technology for child users [
109]. Researchers can identify patterns and trends in child behavior and movement by analyzing the recordings, which allows them to identify areas for improvement and optimize the user experience [
108].
4.2. Results
Over the course of three consecutive days, 14 children participated in the pilot study. Among them were seven girls and seven boys. Ten preschool children were 6 years old, three were 4 and 5 years old and went to kindergarten, and one was 7 years old and is a first grader.
4.2.1. Objective Aspects of Interaction
The pre-test was designed to assess the children’s knowledge of a variety of geometric shapes appropriate for their ages in order to study the change after using the proposed smart toy. The children can touch, feel, and manipulate cardboard cutouts, which provide a tangible and physical representation of geometric shapes. This enables the children to grasp and internalize geometric concepts and relationships. Most children do not have a thorough understanding of all geometric shapes at a young age, so it was important to examine if they can appropriately distinguish and name them.
Table 4 shows how the children performed in the pre-test stage.
As can be seen, the children were good at distinguishing circles from squares and pentagons. However, due to the fact that cardboard geometric shapes were of different colors and sizes, on two occasions, a square was mistaken for a pentagon and vice versa.
Following the pre-test, the children were taken to a separate area of the laboratory where the smart toy giraffe was placed, as shown in
Figure 10. The entire interaction process was recorded on video, and the researcher let the child become acquainted with the toy without intervention or specific instructions. The children were then asked if they wanted to “teach the giraffe” the geometric shapes they had been playing with in the pre-test. Each child had 30 min to interact with the smart toy. The researcher instructed them to draw (map) the shape from the LCD screen above the giraffe’s back with their hands as if they were drawing on a canvas or a board. During interaction with the smart toy, the researcher observed the child and recorded motor aspects of the interaction, their level of participation, interest, and overall behavior. The researcher labeled each gesture made by the child as correct or incorrect. This was later verified by analyzing the video recording. For each shape, the researcher asked the child if they wanted to play a bit more. When the child expressed a desire to stop playing, he or she was interviewed and encouraged to take the post-test.
Firstly, four children did not establish the appropriate manner of interaction with the smart toy. Two of them were aged four and five (kindergarten) and eager to touch and cuddle the toy. They showed their emotions by smiling. The other two children were six-year-olds and tried to interact with the toy, however, they did not manage to do so. One of them did not show interest in the toy. This was especially evident in the fact that the child did not touch the giraffe at all. The other tried to perform the gestures but gave up and continued to play with the toy in his own way. This child was interested in the toy and expressed emotions by smiling.
In total, ten children managed to interact with the toy in a suitable way. The primary aspect of the interaction observed was the formation of the gesture. According to the results, five children performed the interaction with a single finger (index finger). Four children interacted with two fingers (thumb and index finger), while one child used the entire fist. Children who used one finger had longer interactions because they performed more gestures, while those who used two fingers or a fist had shorter interactions and performed fewer gestures, as exhibited in
Figure 12. No child interacted with the toy for the planned period of 30 min. The majority of interactions lasted from around five to ten minutes. The first-grader engaged with the toy the longest and managed to make a significant number of gestures.
The time required to form a specific shape was the second aspect of the observed interaction.
Figure 13 shows the distribution of the time required to perform a particular gesture. There is an evident and reasonable increase in complexity correlated with the time required to perform a given gesture, with a circle requiring the least time and a pentagon demanding the most, which was to be expected. In the case of the square shape, there is an outlier caused by one child’s playfulness, even though the gesture was correctly performed.
To identify any potential confounding variables in our limited data sample size, we conducted a search for variables that were correlated with both the independent variable and the dependent variable. Through our investigation, we discovered that age was highly positively correlated with the number of user gestures, the number of correct user gestures per particular shape, and the number of correct user gestures. Specifically, Pearson’s correlation coefficient for age and the number of user gestures was 0.77, while for the number of correct gestures for the circle, square, and pentagon shapes, it was 0.74, 0.7, and 0.83, respectively. Additionally, Pearson’s correlation coefficient for age and the number of overall correct user gestures was 0.77, indicating that age may be a confounding variable that needs to be controlled for analysis. We therefore calculated partial correlation coefficients between the number of correct user gestures for particular shapes and the number of performed gestures, while controlling for the effect of age. We found strong positive correlations between the number of correct user gestures and the number of performed gestures for the circle, square, and pentagon shapes, even after controlling for the effect of age. Specifically, the partial correlation coefficients were 0.942 (p-value = 0.0001), 0.84 (p-value = 0.004), and 0.899 (p-value = 0.001) for the circle, square, and pentagon shapes, respectively. The statistically significant relationship between the number of correct user gestures and performed gestures even after controlling for age suggests that age may not be a significant factor in predicting user performance for these shapes. This result may have implications for the future design of gesture-based interfaces, for instance, for older children.
The final part of the assessment of the motor aspects of interaction was the accuracy of the child’s gesture mapping. This provides a subjective measure of the ease of mapping while interacting with the toy, which is an important aspect of user experience design. A gesture is considered correct if drawn on a virtual canvas above the sensors in the following way:
A circle is drawn in 360 degrees, without overwriting the previous trajectory;
The starting vertex for a square and pentagon is the same as the ending one, without repetition of previous edges.
This was evaluated in real time by the researcher during the experiment and validated by examining the video footage. The results presented in
Figure 14 show a somewhat different and unexpected order of complexity among different shapes. That is, a circle has a higher failure rate than a square. This is most likely the result of outlining multiple circles on existing ones. As assumed, the failure rate for a pentagon is the highest.
4.2.2. Subjective Aspects of Interaction
These results were then compared with the child’s subjective experience related to the ease of mapping. Based on the answers provided from the interview questions
“2. Which shape was the easiest for you to draw?” and
“3. Which shape was the hardest for you to draw?”, the following results were obtained and are presented in
Figure 15.
As can be seen, the children perceived the circle to be the easiest shape to map, as opposed to the pentagon, which they perceived to be the most difficult. This result correlates with the distribution of the time required to perform a specific gesture, with the circle requiring the least time and the pentagon requiring the most. However, these results are in contrast to the objective user mapping accuracy, as the square was the most accurately mapped shape. As was previously mentioned, this is probably due to the fact that a great number of children drew the circle by outlining multiple circles over existing ones.
Furthermore, the relationship between the perceived difficulty of different shapes and the actual time required to draw them was examined. The Mann–Whitney U test was used to compare the time taken to draw the hardest/most time-consuming shape (pentagon) with the time taken to draw the easiest/least time-consuming shape (circle). The null hypothesis, which stated that there would be no significant difference in time taken between the two shapes, was rejected based on the results of the test. The statistic was calculated to be 0.000000 and the p-value was found to be 0.00041, indicating a significant difference in the time taken between the two shapes. This suggests that the perceived difficulty of the shapes corresponds to the actual time required to draw them. These findings have implications for the design of educational materials and activities that involve drawing shapes, as they suggest that the time required to draw a shape can be used as an objective measure of its difficulty.
Regarding the results from the children’s subjective impressions of fun and satisfaction, valuable feedback from the children about their subjective experiences with the smart toy was obtained.
Table 5 provides information on children’s responses to question
“Can you show me, using these pictures, how you felt while playing this game?”.
As can be seen, the majority of the children expressed a feeling of “Really good” or “Fantastic” while interacting with the smart toy. These results indicate that the children enjoyed the activity and experienced positive subjective satisfaction. This may also imply that, in future interactions, children are more likely to fully engage in toy play. These implications are supported by the results obtained from children’s responses to interview questions
“4. Was the game boring?” and
“5. Was the game difficult?”, presented in
Table 6.
As can be seen, the children perceived the play with the giraffe to be engaging and easy. Such positive experiences indicate that the toy met expectations, which can be an important factor in promoting children’s learning, since they are more likely to continue using the toy. The latter might result overall in greater technology adoption and success.
These implications are in correlation with the results obtained by analyses of video recordings of the children’s expressions and behavior during the toy interaction. The majority of the children (12) smiled and were happy while interacting with the toy, one child danced and others bounced excitably. They were also keen on touching, petting, and exploring the toy, while at the same time communicating with the researcher. It was also noticed that some children, four of them, were more concentrated on the task itself rather than on the toy itself. Although they said they felt good interacting with the toy, they did not engage in other types of play with the toy apart from the proposed interaction. They were more interested in the toy’s educational features. When asked, “7. What else would you like to teach the giraffe?” the majority of children just smiled and were unsure what to say other than “I don’t know”. However, some children provided rather interesting answers, such as “I would like to teach her letters”, “I would like the draw hearts”, and one child answered “I would like to teach her about good behavior.”.
Finally, the results of the returnability aspect based on the responses from the Again-Again
Table 3 are presented in
Figure 16.
The results indicate that the majority of the children would like to play with the toy again. Furthermore, findings suggest that the children found the square shape to be the most engaging and interesting to play with, as evidenced by their desire to play with it again and their preference for drawing the square. This preference may be related to the objective user mapping aspect, in which the square was the most accurately mapped shape. It is also worth noting that, despite the children’s subjective assessment that the circle was the easiest shape to draw, they preferred drawing the square. This suggests that a child’s interest in the toy was not solely determined by its ease of use. Overall, these findings suggest that future enhancements to the toy’s design should consider not only the ease of use but also the toy’s engagement factor. The objective user mapping aspect can also be considered to increase engagement. As was to be expected, half of the children would not want to draw the pentagon again. It is possible that the children’s lack of interest in drawing the pentagon again is related to their level of motor skill development, as the pentagon has more sides and angles than the other shapes, potentially making it more difficult to draw. They may also feel less confident or interested in attempting to draw the pentagon again or it may be that they found the pentagon more challenging to understand or remember compared to the other shapes. This implication is supported by the researcher’s observations as well as the video analyses, as none of the children were familiar with the shape or knew its name and usually referred to it as the “house shape”.
An immediate post-test followed the interaction with the toy. The results of the test are presented in
Table 7. Only the results of the children who interacted with the toy were taken into account. As can be noticed, the accuracy of recognizing and classifying the pentagon seems to decline. This was probably an immediate result of the fatigue of one child who incorrectly classified the pentagon as a square several times, since this child interacted with the toy the longest and performed a great number of gestures. Overall, due to the small sample size, a definitive conclusion about the impact of the toy on the children’s performance in the post-test cannot be drawn. Therefore, in the future, it is important to ensure that sample sizes are adequate to make accurate claims about the impact of the toy on children’s educational performance.
4.2.3. Machine Learning Performance
Finally, the performance of the neural network in experimental scenarios is presented. The children performed an overall number of 111 different gestures, and
Table 8 provides insight into the gesture classification accuracy.
As can be observed, the classification accuracy is quite low, especially for the pentagon shape. There are several possible reasons for such a bad performance. To begin with, our experimental results have shown that children’s gestures differ from adult gestures in terms of frequency and execution. As demonstrated, children performed gestures primarily with their index fingers, while the data used to build the model came from adult users who primarily used their entire fists. Furthermore, of those 111 gestures, half (46, to be exact) came from a single user, the first grader, who made gestures with his index finger, while the other 55 gestures were distributed among the other children, indicating an imbalance in the test set. With that in regard, we later conducted a comparison of raw sensor data from a child and an adult subject while performing gestures for the same geometrical shape, as presented in
Figure 17.
It can be observed that children’s gestures greatly differ from adult gestures, both in terms of their frequency and the way they are executed. The adults generally performed gestures with the entire fist, where, as we have seen, the children primarily used their index finger. Therefore, the feature set used to train the machine learning model was unable to accurately capture the variation in children’s gestures, leading to a poor classification accuracy.
As this was a pilot study, it provided valuable information on the performance of the smart toy for geometry learning and identified areas for improvement. This information will be used to guide future design iterations, helping to refine the smart toy and improve the accuracy of the machine learning algorithm. In this regard, it will be necessary to collect a large dataset of children’s gestures and train the machine learning model specifically on this dataset. This can involve collecting data from a range of ages and developmental stages to ensure that the model can capture the variation in children’s gestures. Additionally, it may be necessary to develop new feature sets or modify existing ones to better capture the unique features of children’s gestures. Finally, it may be necessary to test the model on a separate validation dataset to ensure that it generalizes well to new examples of children’s gestures.
5. Discussion
Based on the results of the exploratory pilot study, some of the benefits and strong aspects of this research were the following.
The activity involving drawing shapes was enjoyable and engaging for the majority of the children. The fact that the square was the most correctly mapped shape and that children expressed interest in drawing it again suggests that the activity was effective in promoting learning and skill development related to shape recognition and the mapping of abstract concepts. It should also be noted that, although the children perceived the circle as the easiest shape to draw, they still showed a greater preference for drawing the square. This may indicate that the children found the challenge of drawing the square more rewarding or satisfying than drawing the circle. The toy was also found to be easy to use, which is important to ensure that children can use it independently. The positive results obtained using the Smileyometer rating scale when and during the interview while measuring fun and subjective satisfaction with technology indicate that the children experienced a high level of enjoyment and satisfaction, which can have a significant impact on the success of the smart toy giraffe as an interactive and educational tool. Overall, the results suggest that the activities involving the smart toy were engaging and challenging and can prove to be effective in promoting the early learning of geometry of children in preschool.
One of the main benefits was also the deeper insight into the modalities of interaction that the children had with the toy, as well as the different ways in which the children make the gestures in contrast to the adults.
The results of our study indicate that age is a potential confounding variable that needs to be controlled when analyzing the relationship between user performance and the number of performed gestures for specific shapes. However, even after controlling for age, a statistically significant positive correlation was found between the number of correct user gestures and performed gestures for the circle, square, and pentagon shapes. This suggests that age may not be a significant predictor of user performance for these shapes, which may have implications for the design of gesture-based interfaces, particularly for older children. Moreover, it was found that the perceived difficulty of a shape corresponds to the actual time required to draw it. This finding may be useful for designing educational materials and activities that involve drawing shapes, as it provides an objective measure of shape difficulty. The Mann–Whitney U test was used to compare the time taken to draw the hardest/most time-consuming shape (pentagon) with the time taken to draw the easiest/least time-consuming shape (circle), and a significant difference in the time taken was found between the two shapes. These findings contribute to a better understanding of the factors that influence user performance in gesture-based interfaces and highlight the importance of considering potential confounding variables in data analysis.
However, there were some limitations to this study. Although the results of the machine learning algorithm showed satisfactory results in the adult dataset, the same model performed poorly with child subjects for several reasons. At this stage of the design process, the recruitment of child participants for the data collection phase was challenging due to ethical concerns and limited access to child populations. Additionally, collecting high-quality and representative data was more difficult due to the younger children’s limited attention spans and potential fatigue when performing a larger series of gesture movements. These issues should be addressed in future work to improve the performance of the machine learning model on child data. Furthermore, the setup consisting of four IR distance sensors arranged in an array creates a relatively shallow area (that resembles a plane) where measurement can be executed. When children performed gestures above the sensor area, their movements were often less coordinated and precise than those of adults. This is the result of their phase of development of fine motor skills, making it difficult for them to execute gestures using their entire fist or with the same level of control as adults. As a result, children tend to rely on simpler and more straightforward gestures that are easier to execute, such as pointing with their index finger. Furthermore, children may be more prone to unintentional movements or gestures, which can affect the accuracy of the machine learning algorithm used to detect the outline of the gesture. As our model is trained primarily on adult users, using the same ML model on child users showed a significant reduction in accuracy. By analyzing raw data in
Figure 17, we can draw some basic conclusions: adult users activate more sensors while performing this particular gesture as compared to child users. This could be due to the adult user executing a larger gesture, the height of the adult user, and the difference in hand surface that reflect the IR emitted to a sensor. To bring child user accuracy to a level of an adult user, we must obtain more training data that can help us extract specific features in a signal that are found in child users. For future work, the following is considered.
In future work, alternative sensors with larger sensing areas can be considered, such as the VL53L5CX Time of Flight sensor with an 8 × 8 multizone range and 63
diagonal field of view (
https://www.st.com/en/imaging-and-photonics-solutions/vl53l5cx.html (accessed on 11 April 2023)). Similar results may be achieved by implementing one or more microcontroller-based machine vision cameras such as OpenMV H7 (
https://openmv.io/products/openmv-cam-h7 (accessed on 11 April 2023)) in a multi-vision configuration. As those cameras are basically machine-vison sensors, when properly programmed, they output simple hand location information in predefined coordinate space and the overall complexity of the system can be kept at a reasonable level, requiring minimal setup time or preparation.
Finally, it will be necessary to collect a large dataset of children’s gestures and train the model specifically on these data in order to enhance the machine learning model’s accuracy when classifying children’s gestures. This may involve collecting data from children of various ages and developmental stages to ensure that the model can capture the variation in their gestures. It will also be necessary to test the model on a separate validation dataset to ensure that it can accurately generalize to new examples of children’s gestures.
6. Conclusions
The literature suggests that utilizing smart toys in preschool education has the potential to foster STEM skills in young children. This study aimed to introduce a prototype of a plush smart toy as an educational tool for teaching young children about geometric shapes, given the potential of using smart toys in preschool education and the importance of studying geometry at a young age for the development of spatial reasoning skills. The plush smart toy design incorporates a range of hardware components, including sensors, microcontrollers, an LCD screen, and a machine learning system, which facilitates gesture recognition. By analyzing the outline of the child’s gesture, the machine learning system can determine whether it corresponds to the shape displayed on the LCD screen. Among the three sensing technologies tested, namely capacitive, IR short-range, and IR long-range sensors, the IR long-range technology was found to be the most suitable for the study, based on the machine learning results. Later, a small exploratory pilot study was conducted to analyze the nature of the children’s involvement with the smart toy prototype through user evaluation, test the toy’s practicality, and acquire some preliminary data on the toy’s effectiveness and feasibility. The results of the exploratory study highlighted several benefits and strong aspects of the smart toy prototype. According to the findings of the study, the smart toy prototype is user-friendly and straightforward to use. The result also indicates that the smart toy engages children in the learning process effectively, making it a potentially valuable educational tool for preschool children. Additionally, the study provided valuable insights into the modalities of interaction between children and the toy, the differences in gestures made by children compared to adults, and the influence of age on user performance in gesture-based interfaces. These findings contribute to a better understanding of the factors affecting user performance and emphasize the importance of considering potential confounding variables in data analysis. Furthermore, our research revealed that the perceived difficulty of a shape corresponds to the real time necessary to draw it. This discovery could be useful in constructing instructional materials and activities that include drawing shapes because it provides an objective measure of shape difficulty.
However, limitations were identified in the machine learning algorithm’s ability to recognize children’s gestures and the sensor setup’s capacity to capture the full range and precision of children’s gestures. The lower accuracy rate with children is due to the different ways in which they make gestures compared to the adults who were used in the data collection process, as well as the test set data imbalance. To address these limitations, future work should consider alternative sensors with larger sensing areas, for instance, a time of flight sensor or microcontroller-based machine vision cameras. These technologies can help maintain a reasonable level of system complexity while improving the accuracy and reliability of the gesture recognition toy for children. Finally, future research should focus on collecting a larger dataset of children’s gestures and training the machine learning model specifically on these data to enhance its accuracy and generalizability. This may involve gathering data from children of various ages and developmental stages to ensure that the model captures the variation in their gestures and testing the model on a separate validation dataset to confirm its accurate generalization to new examples of children’s gestures.


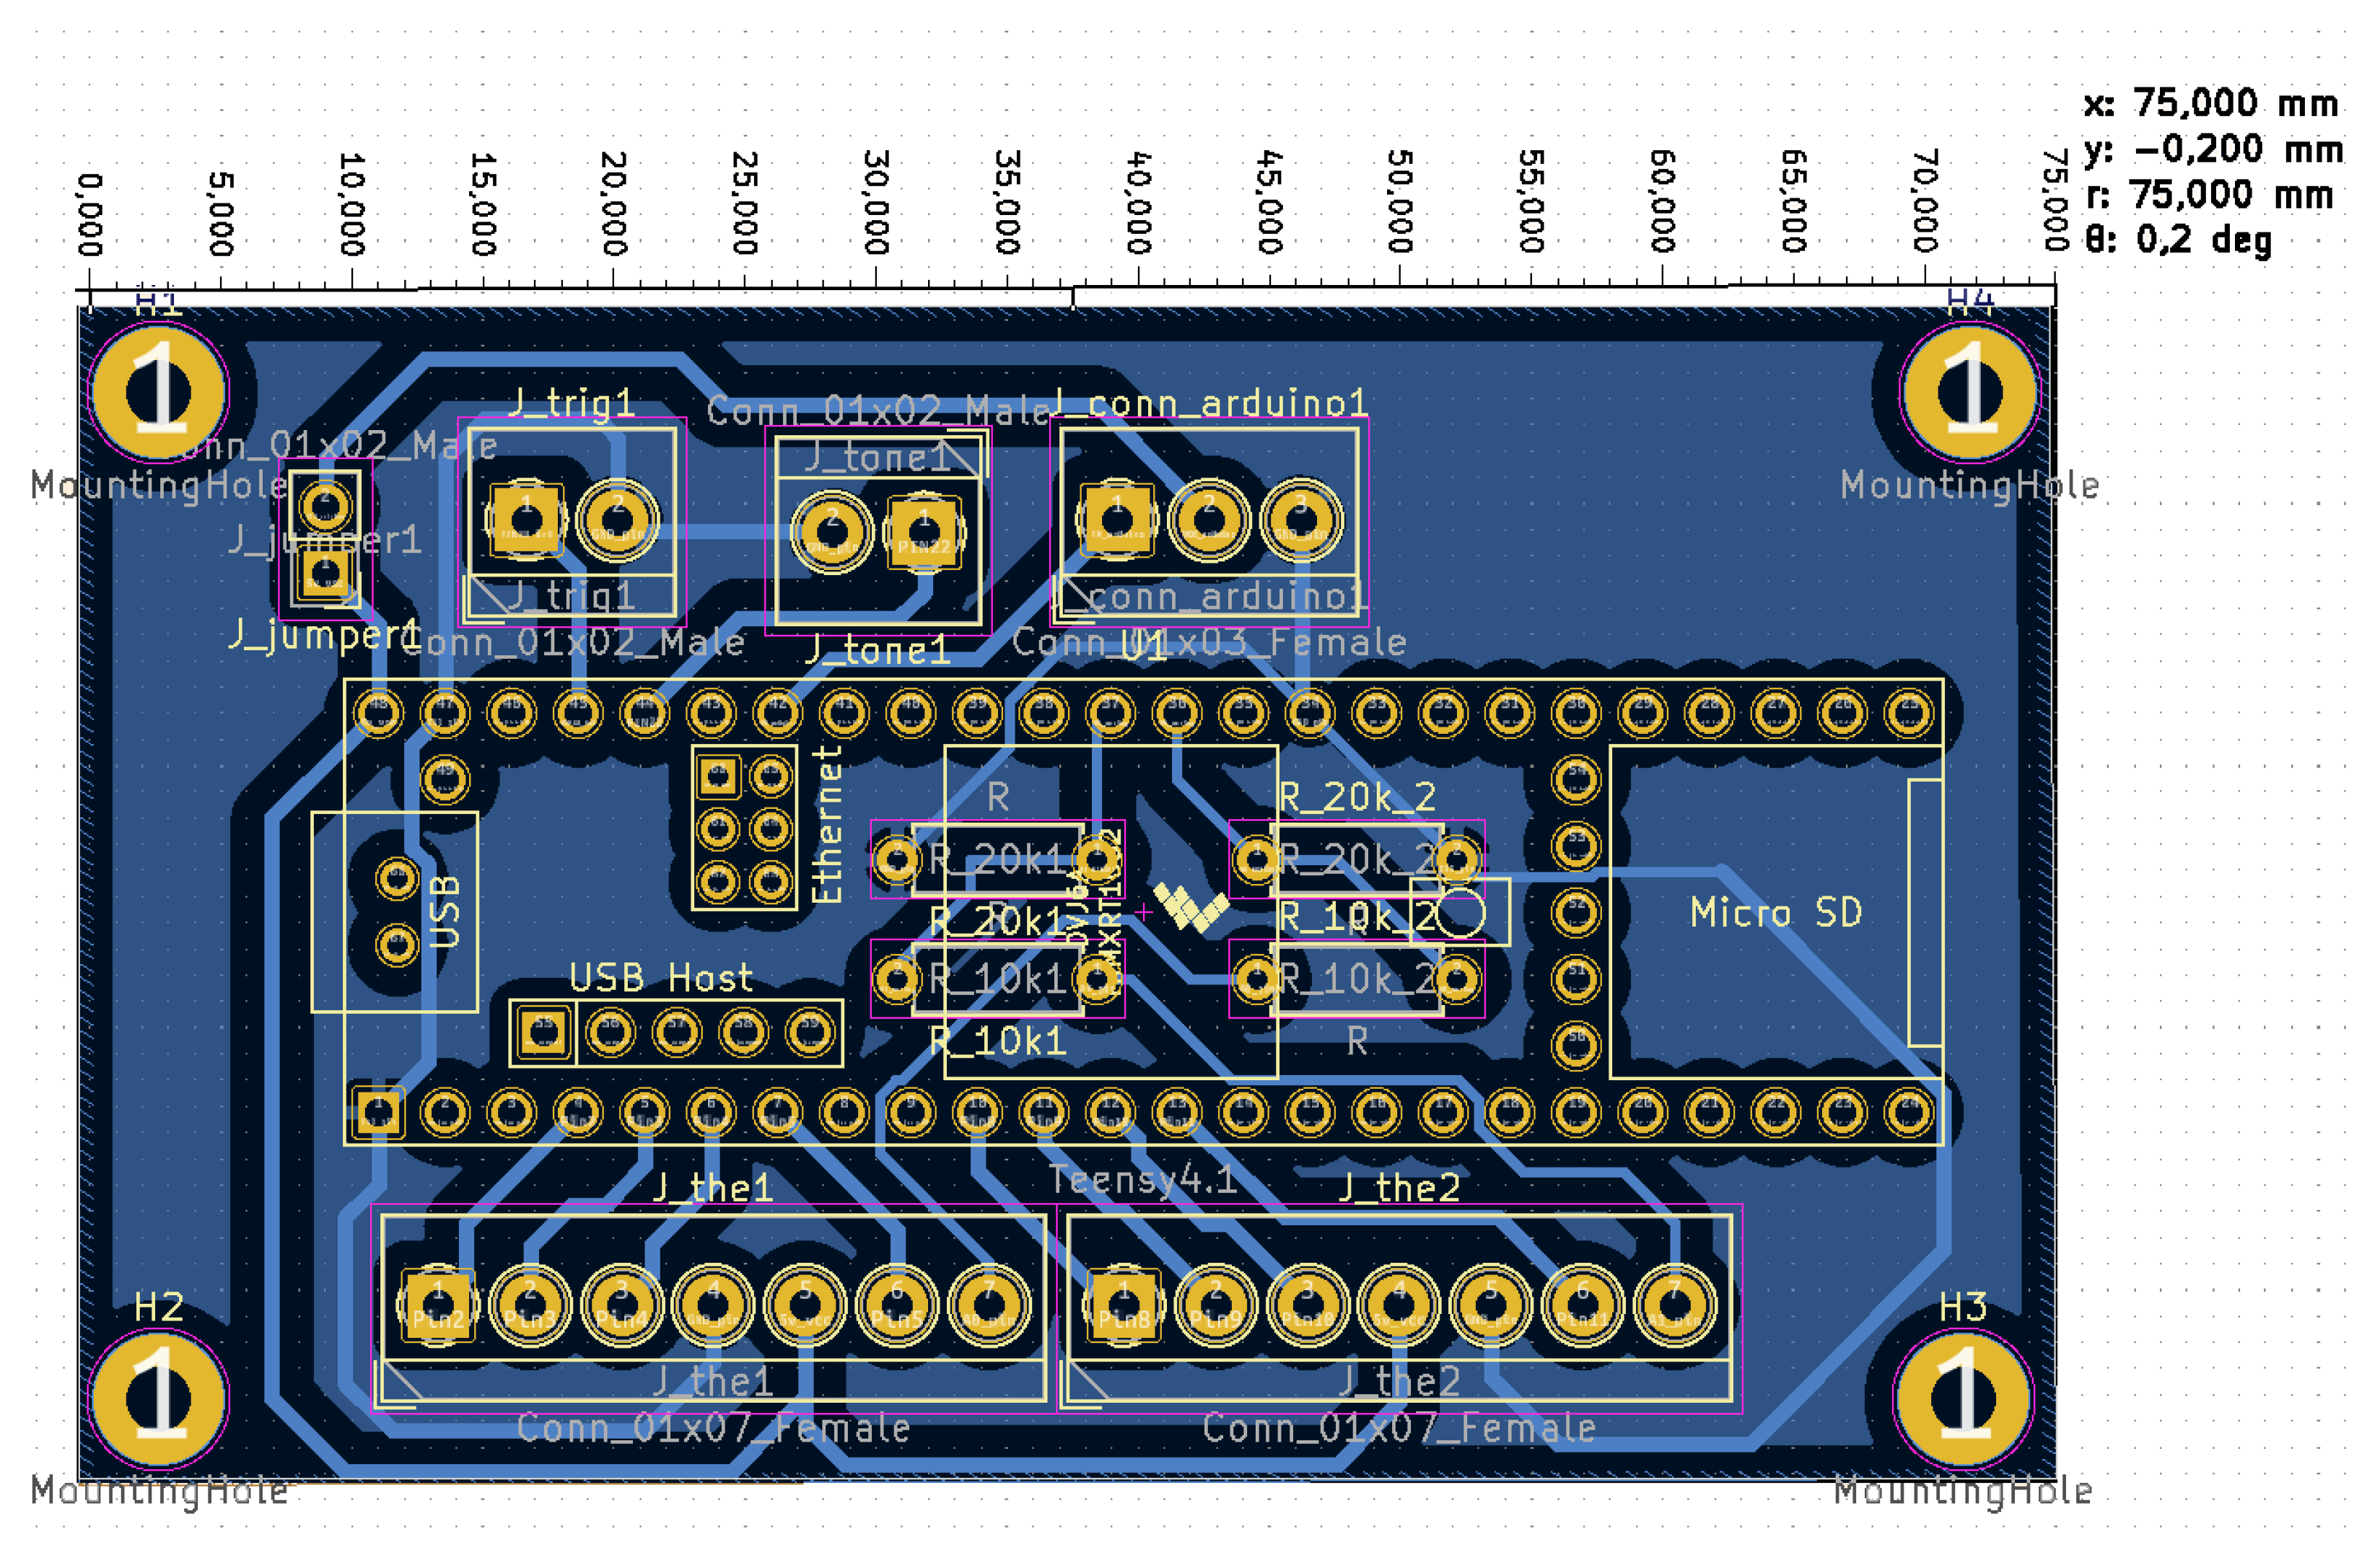
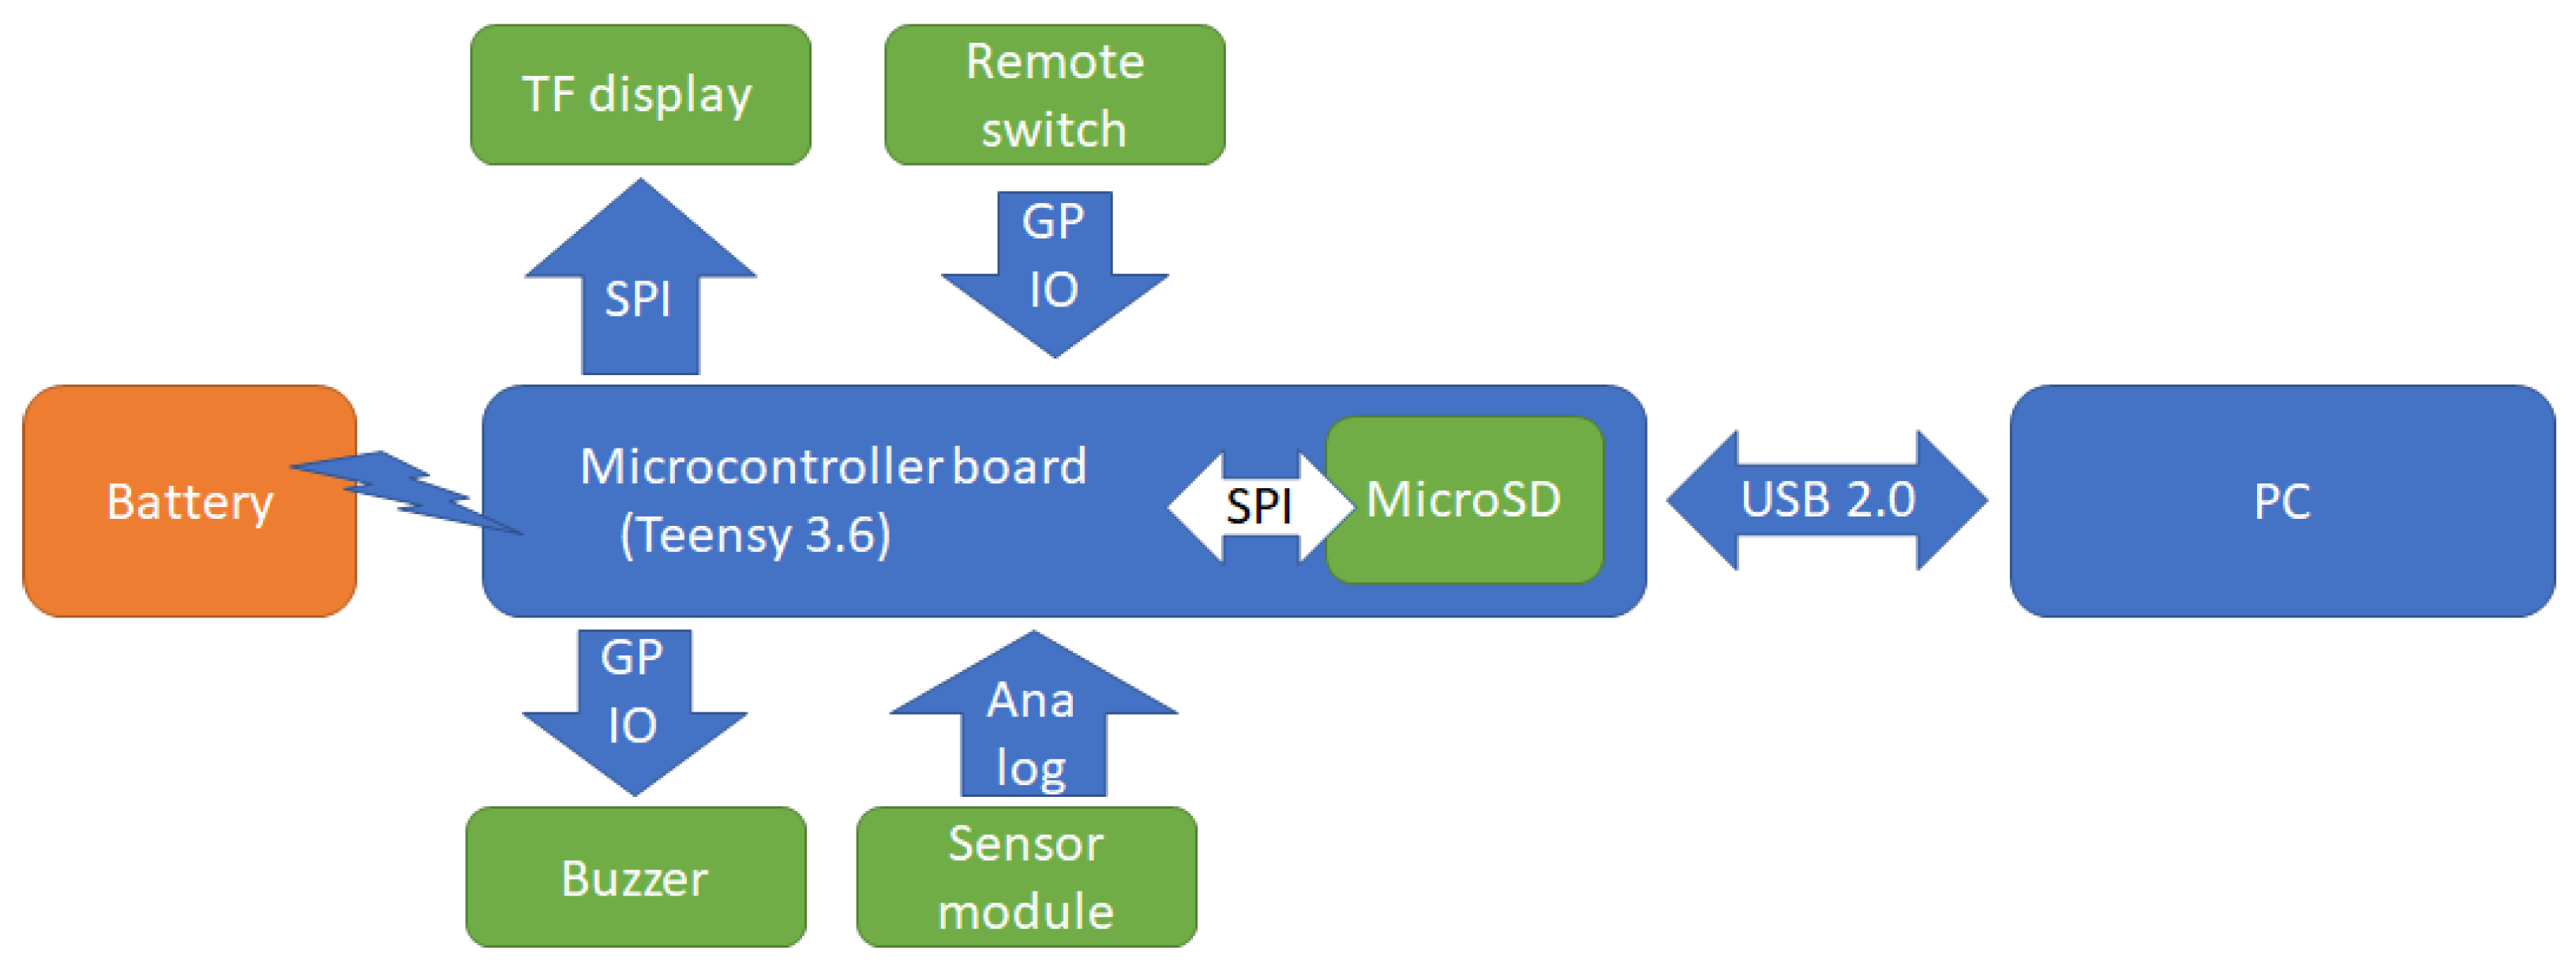
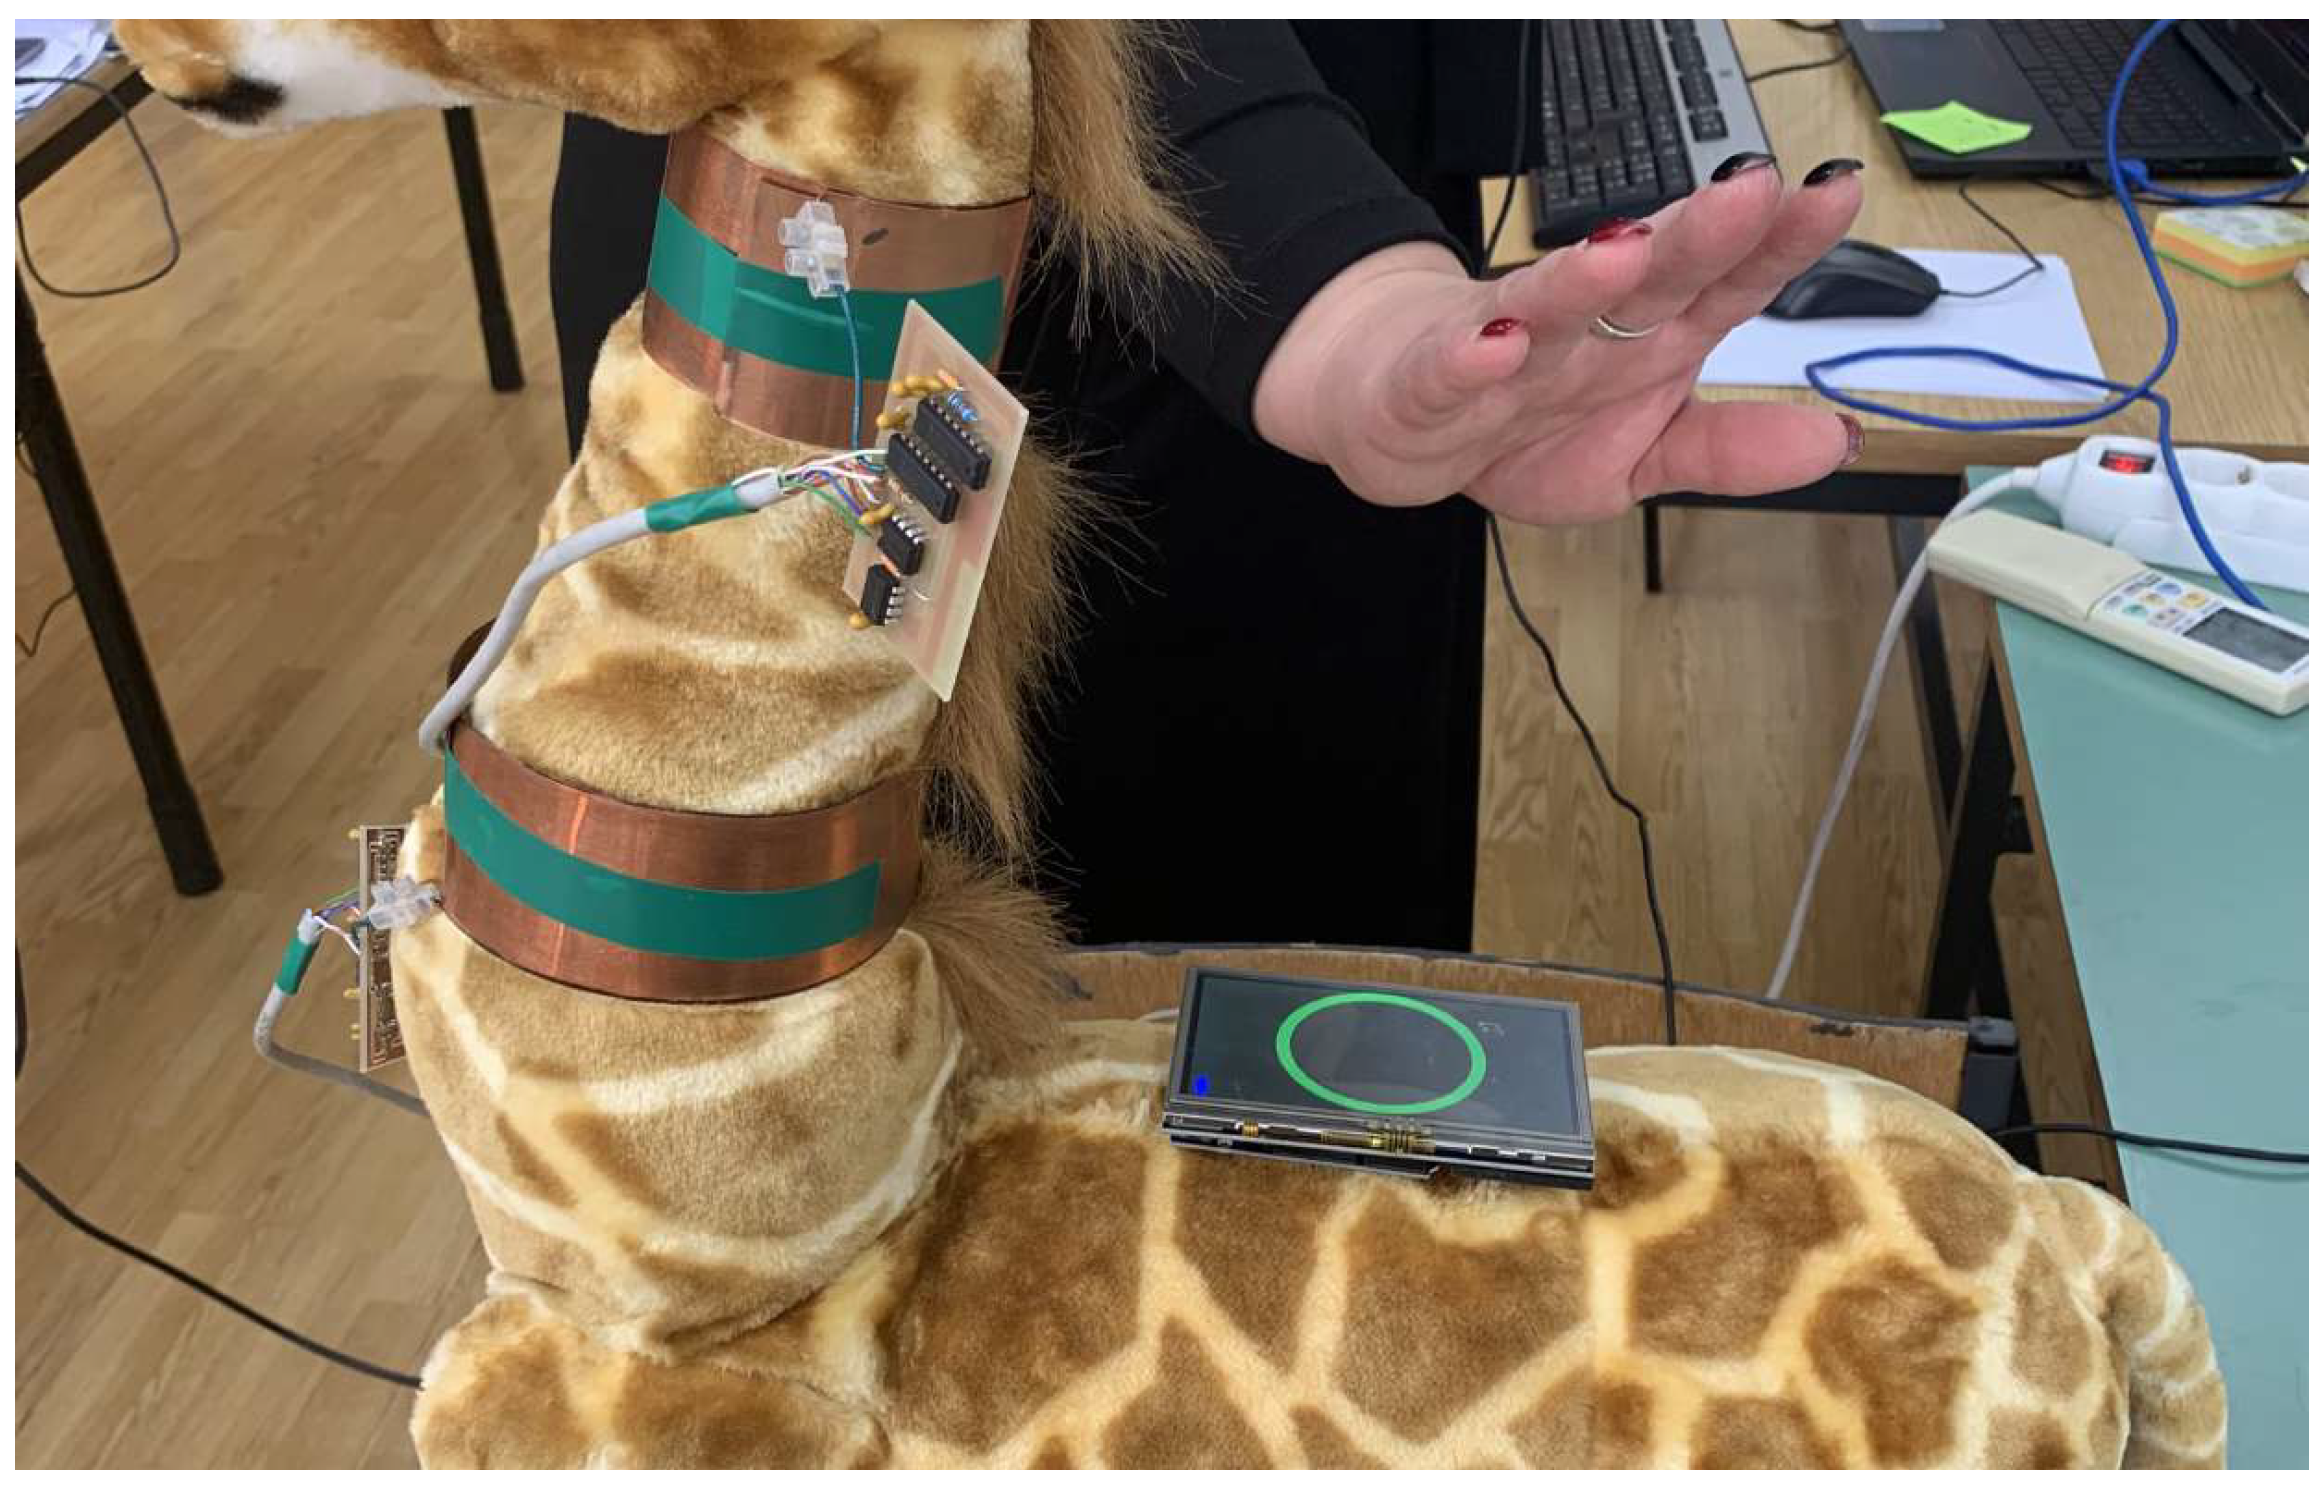
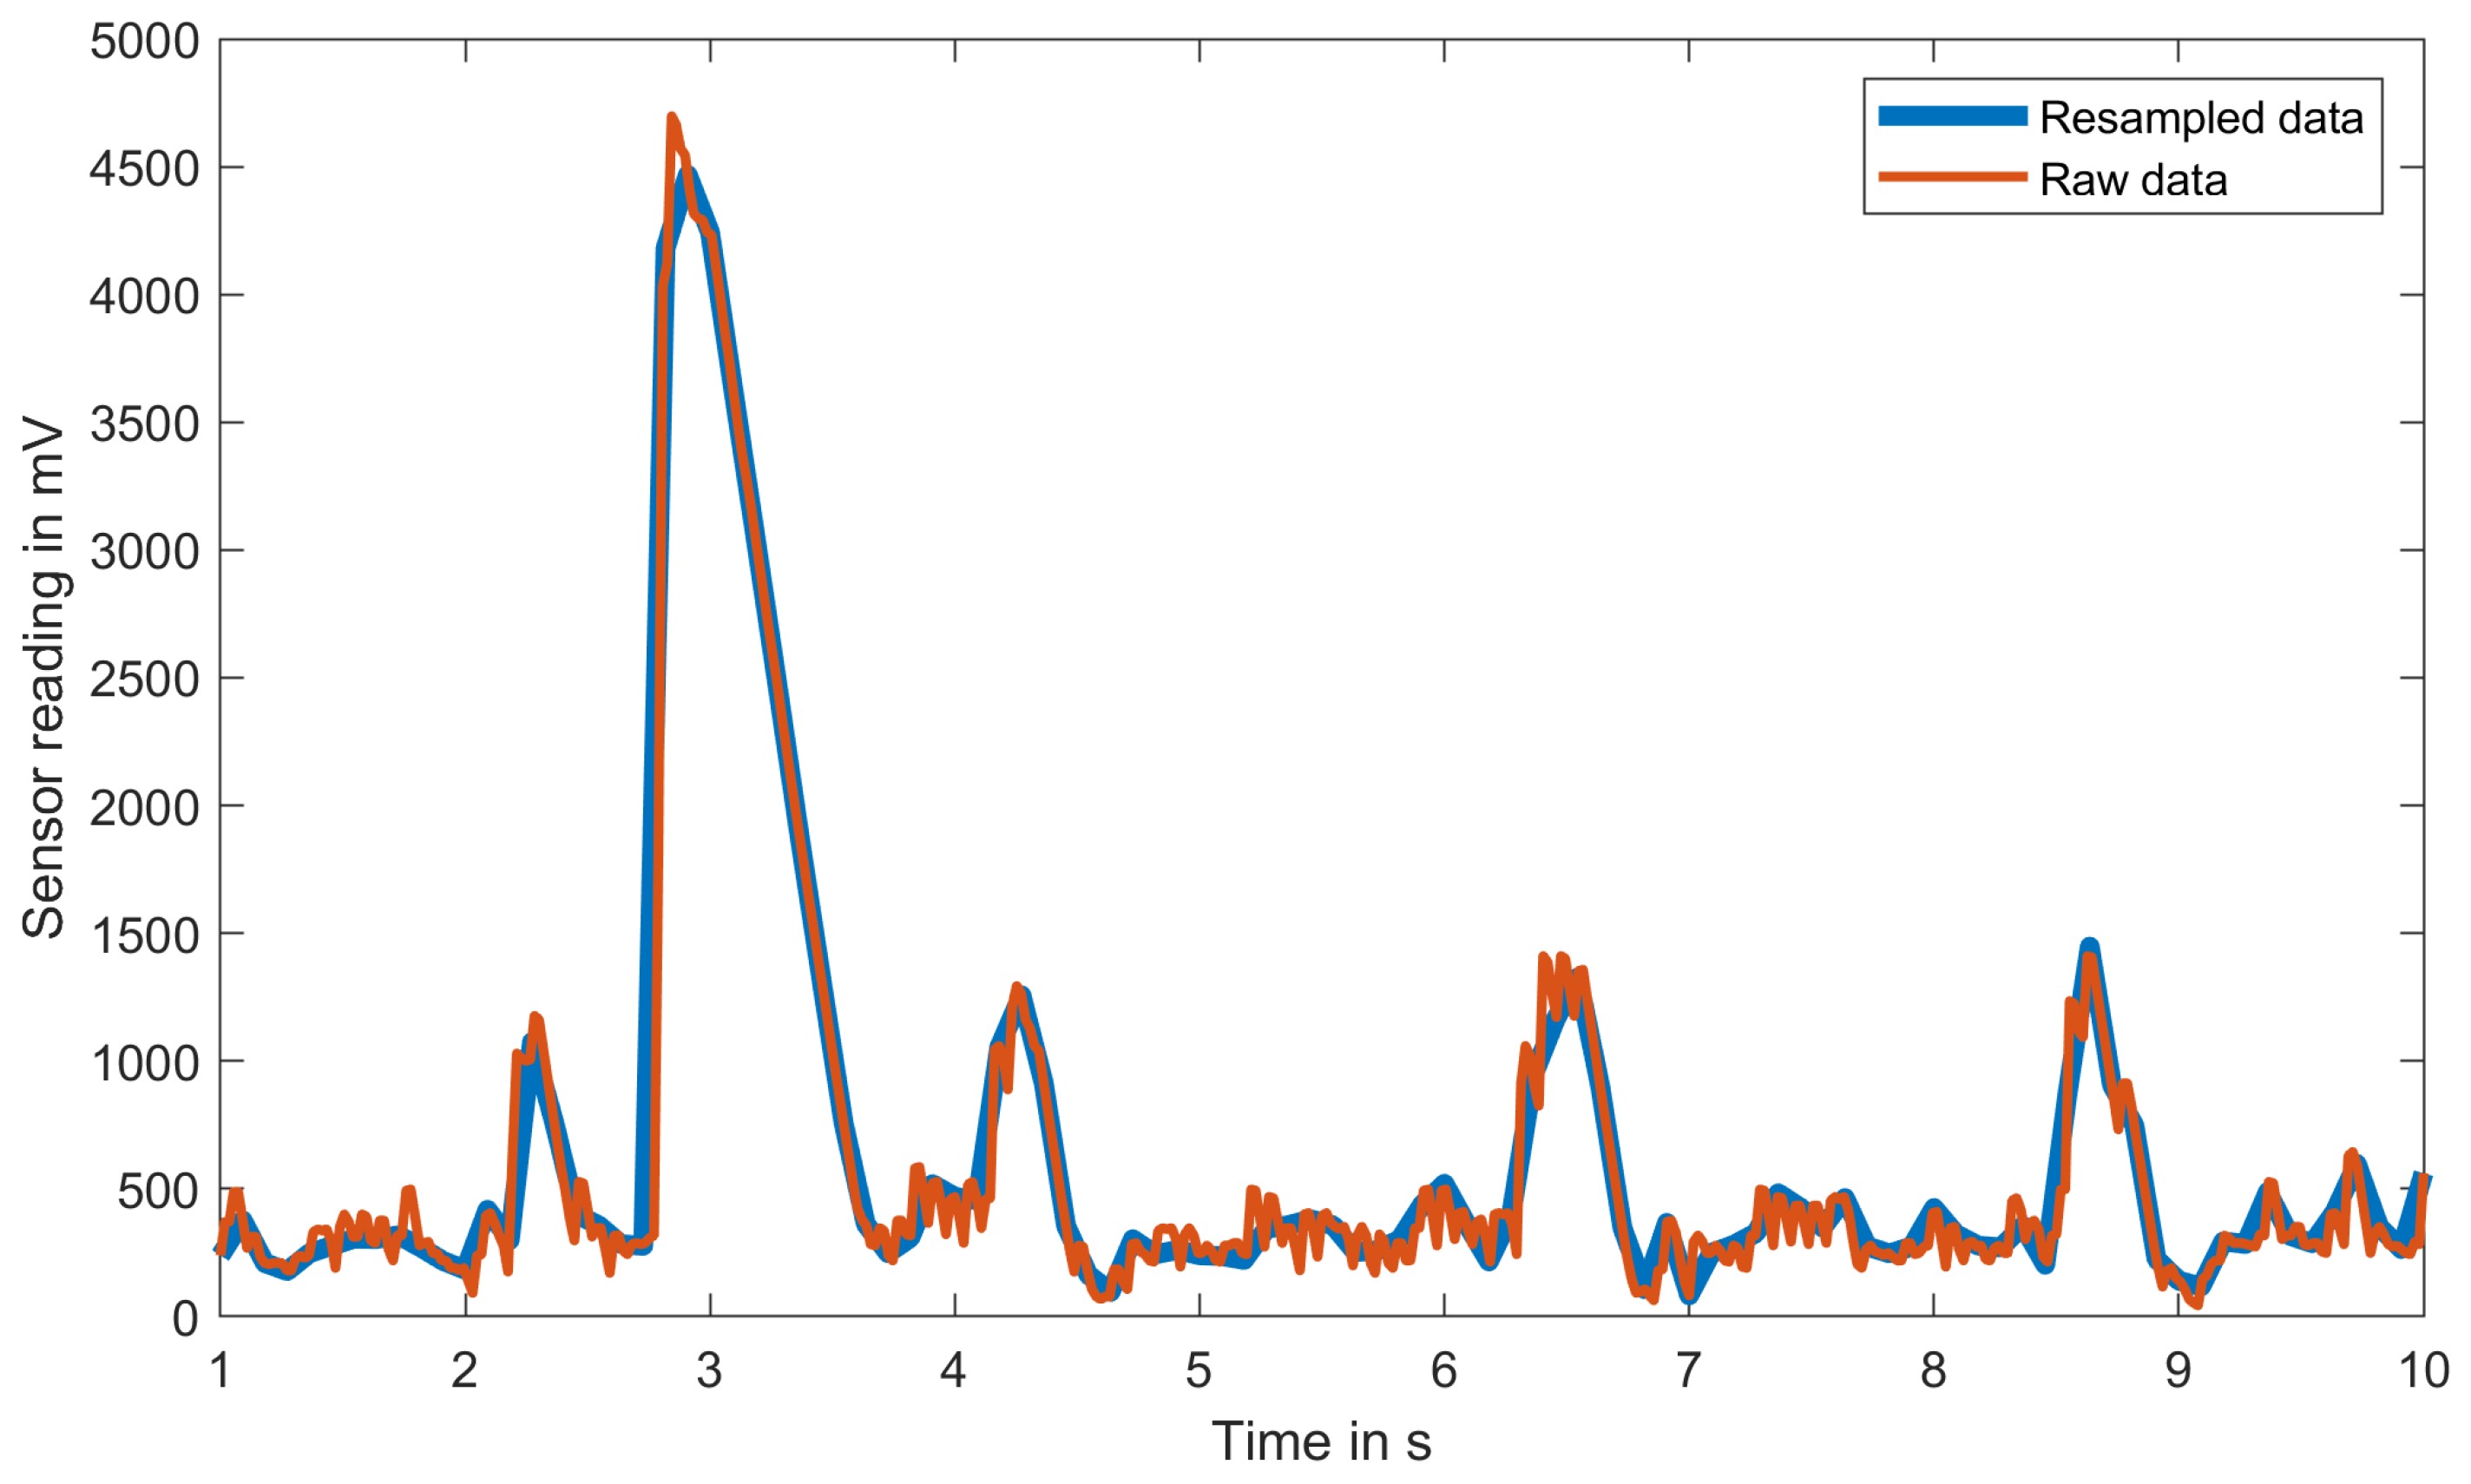
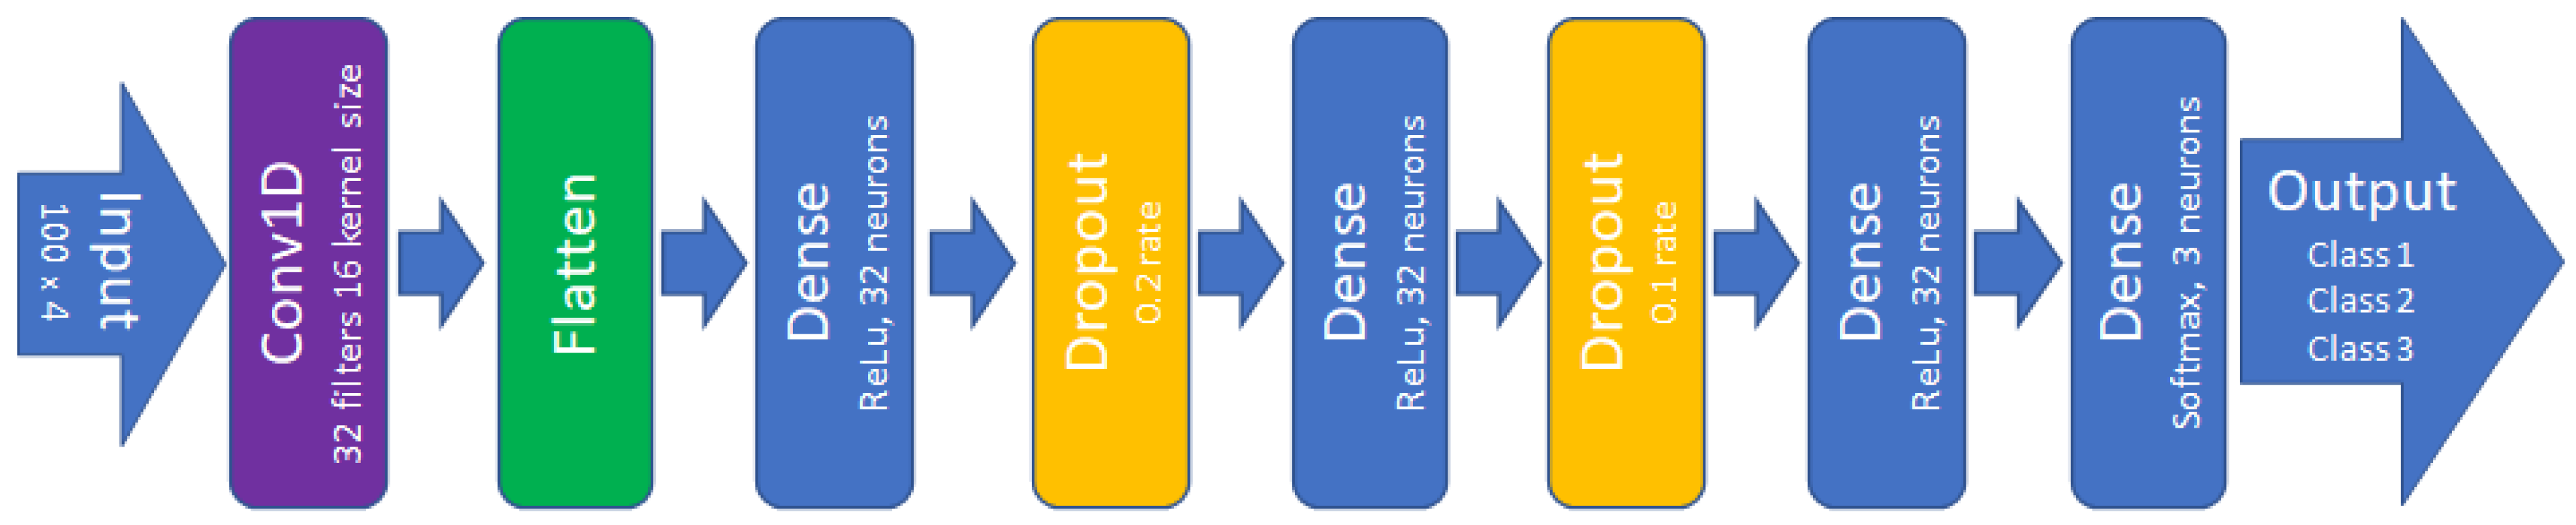
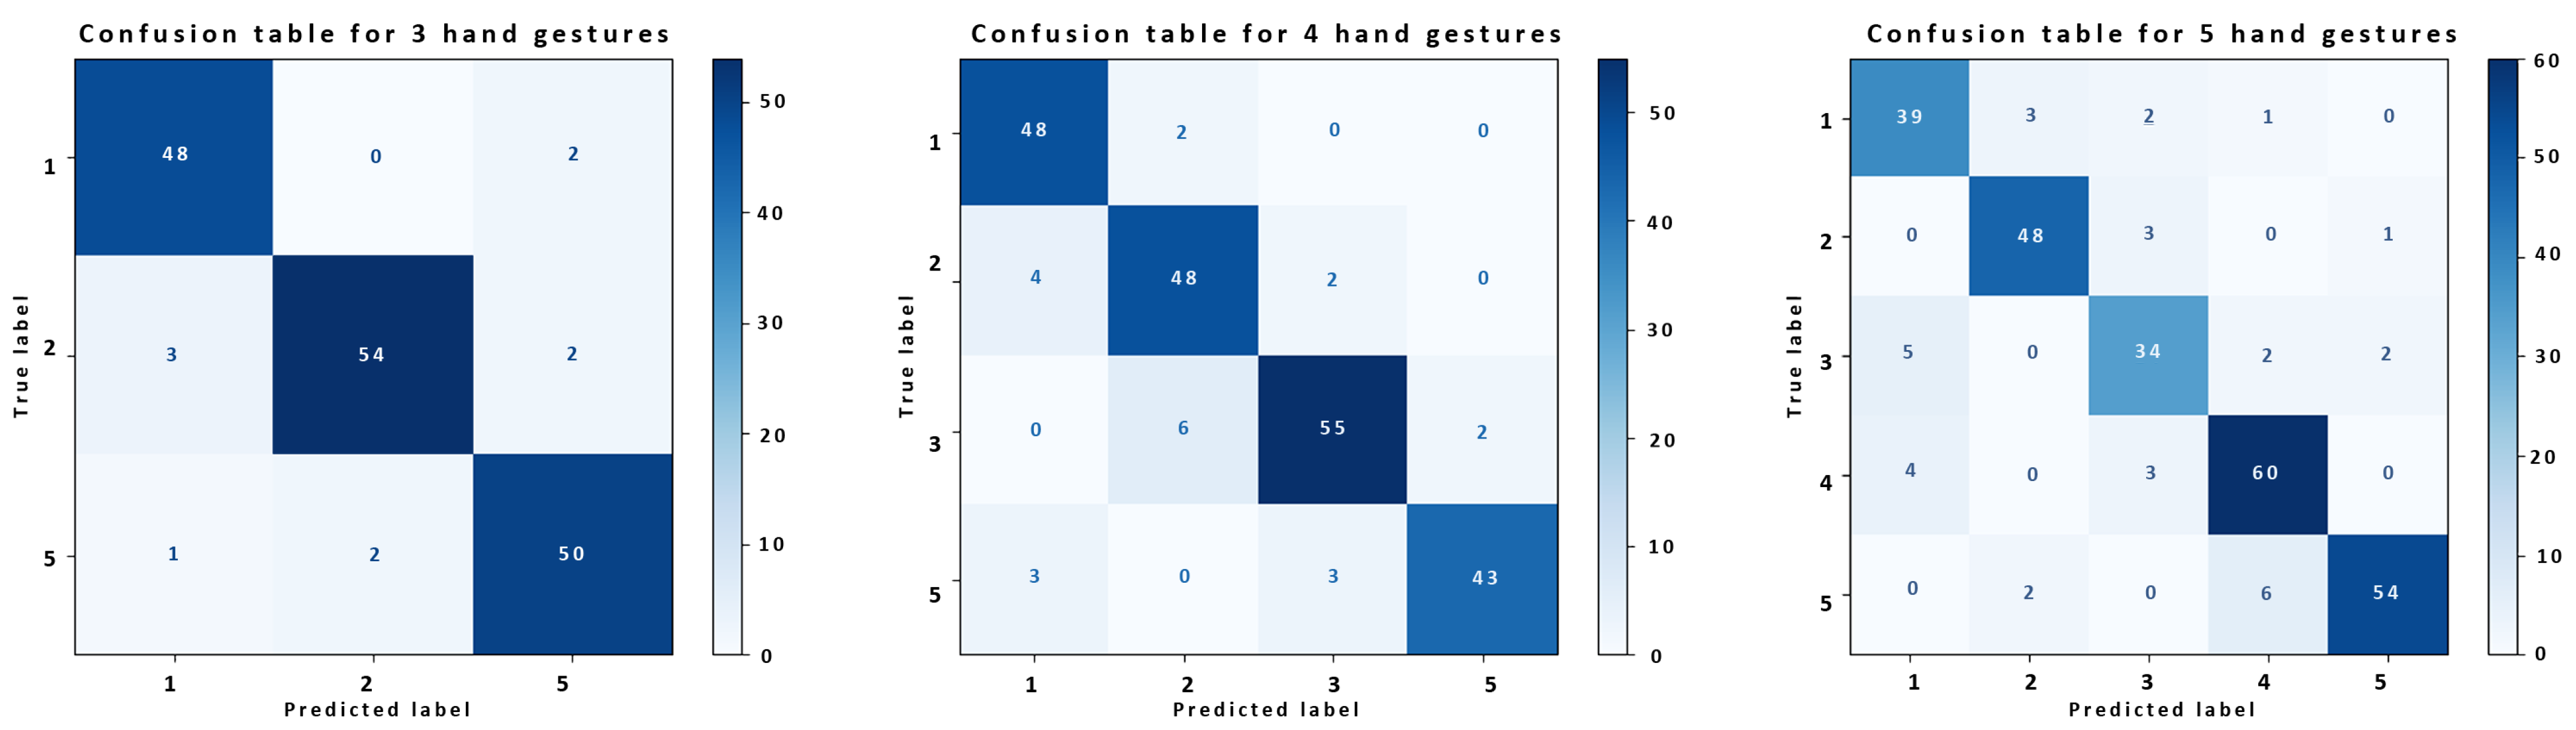
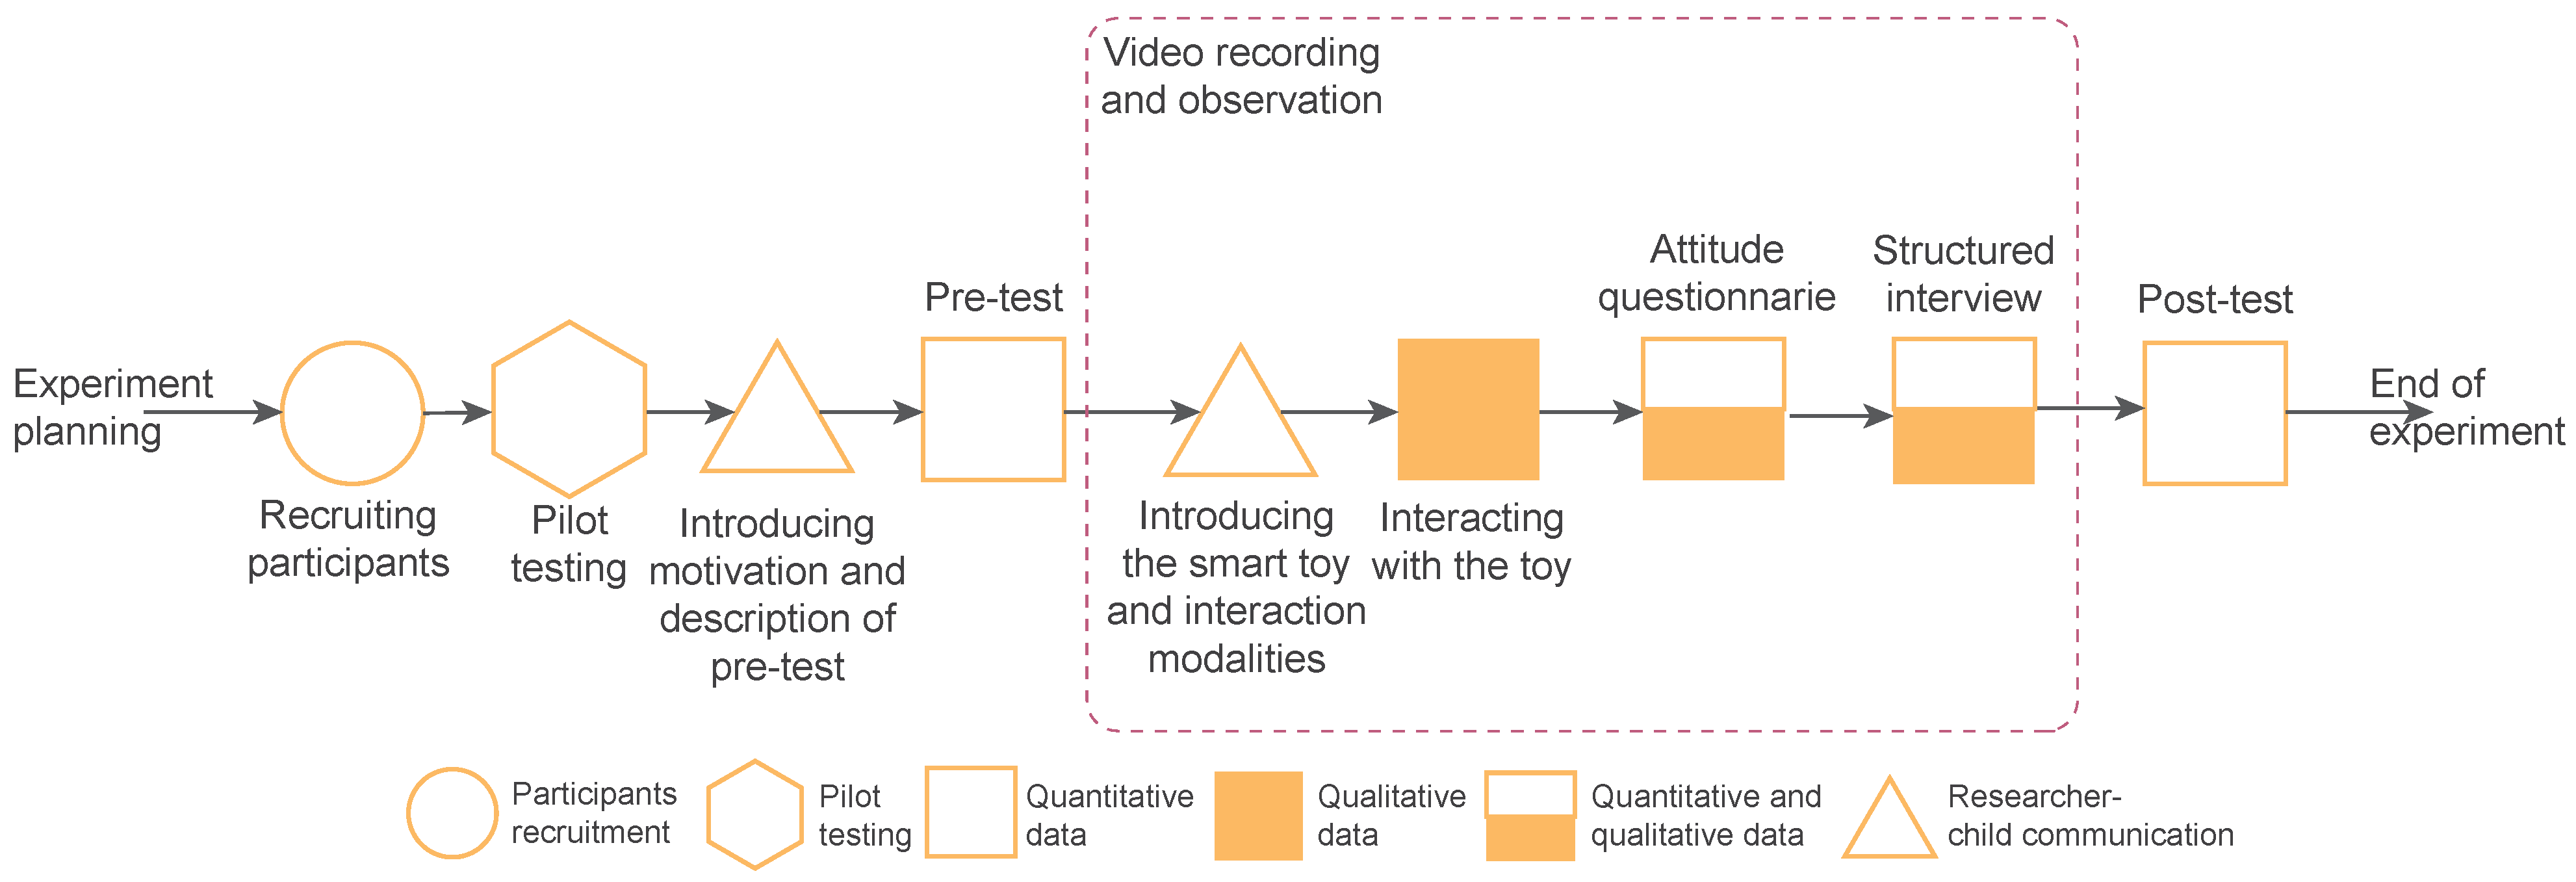
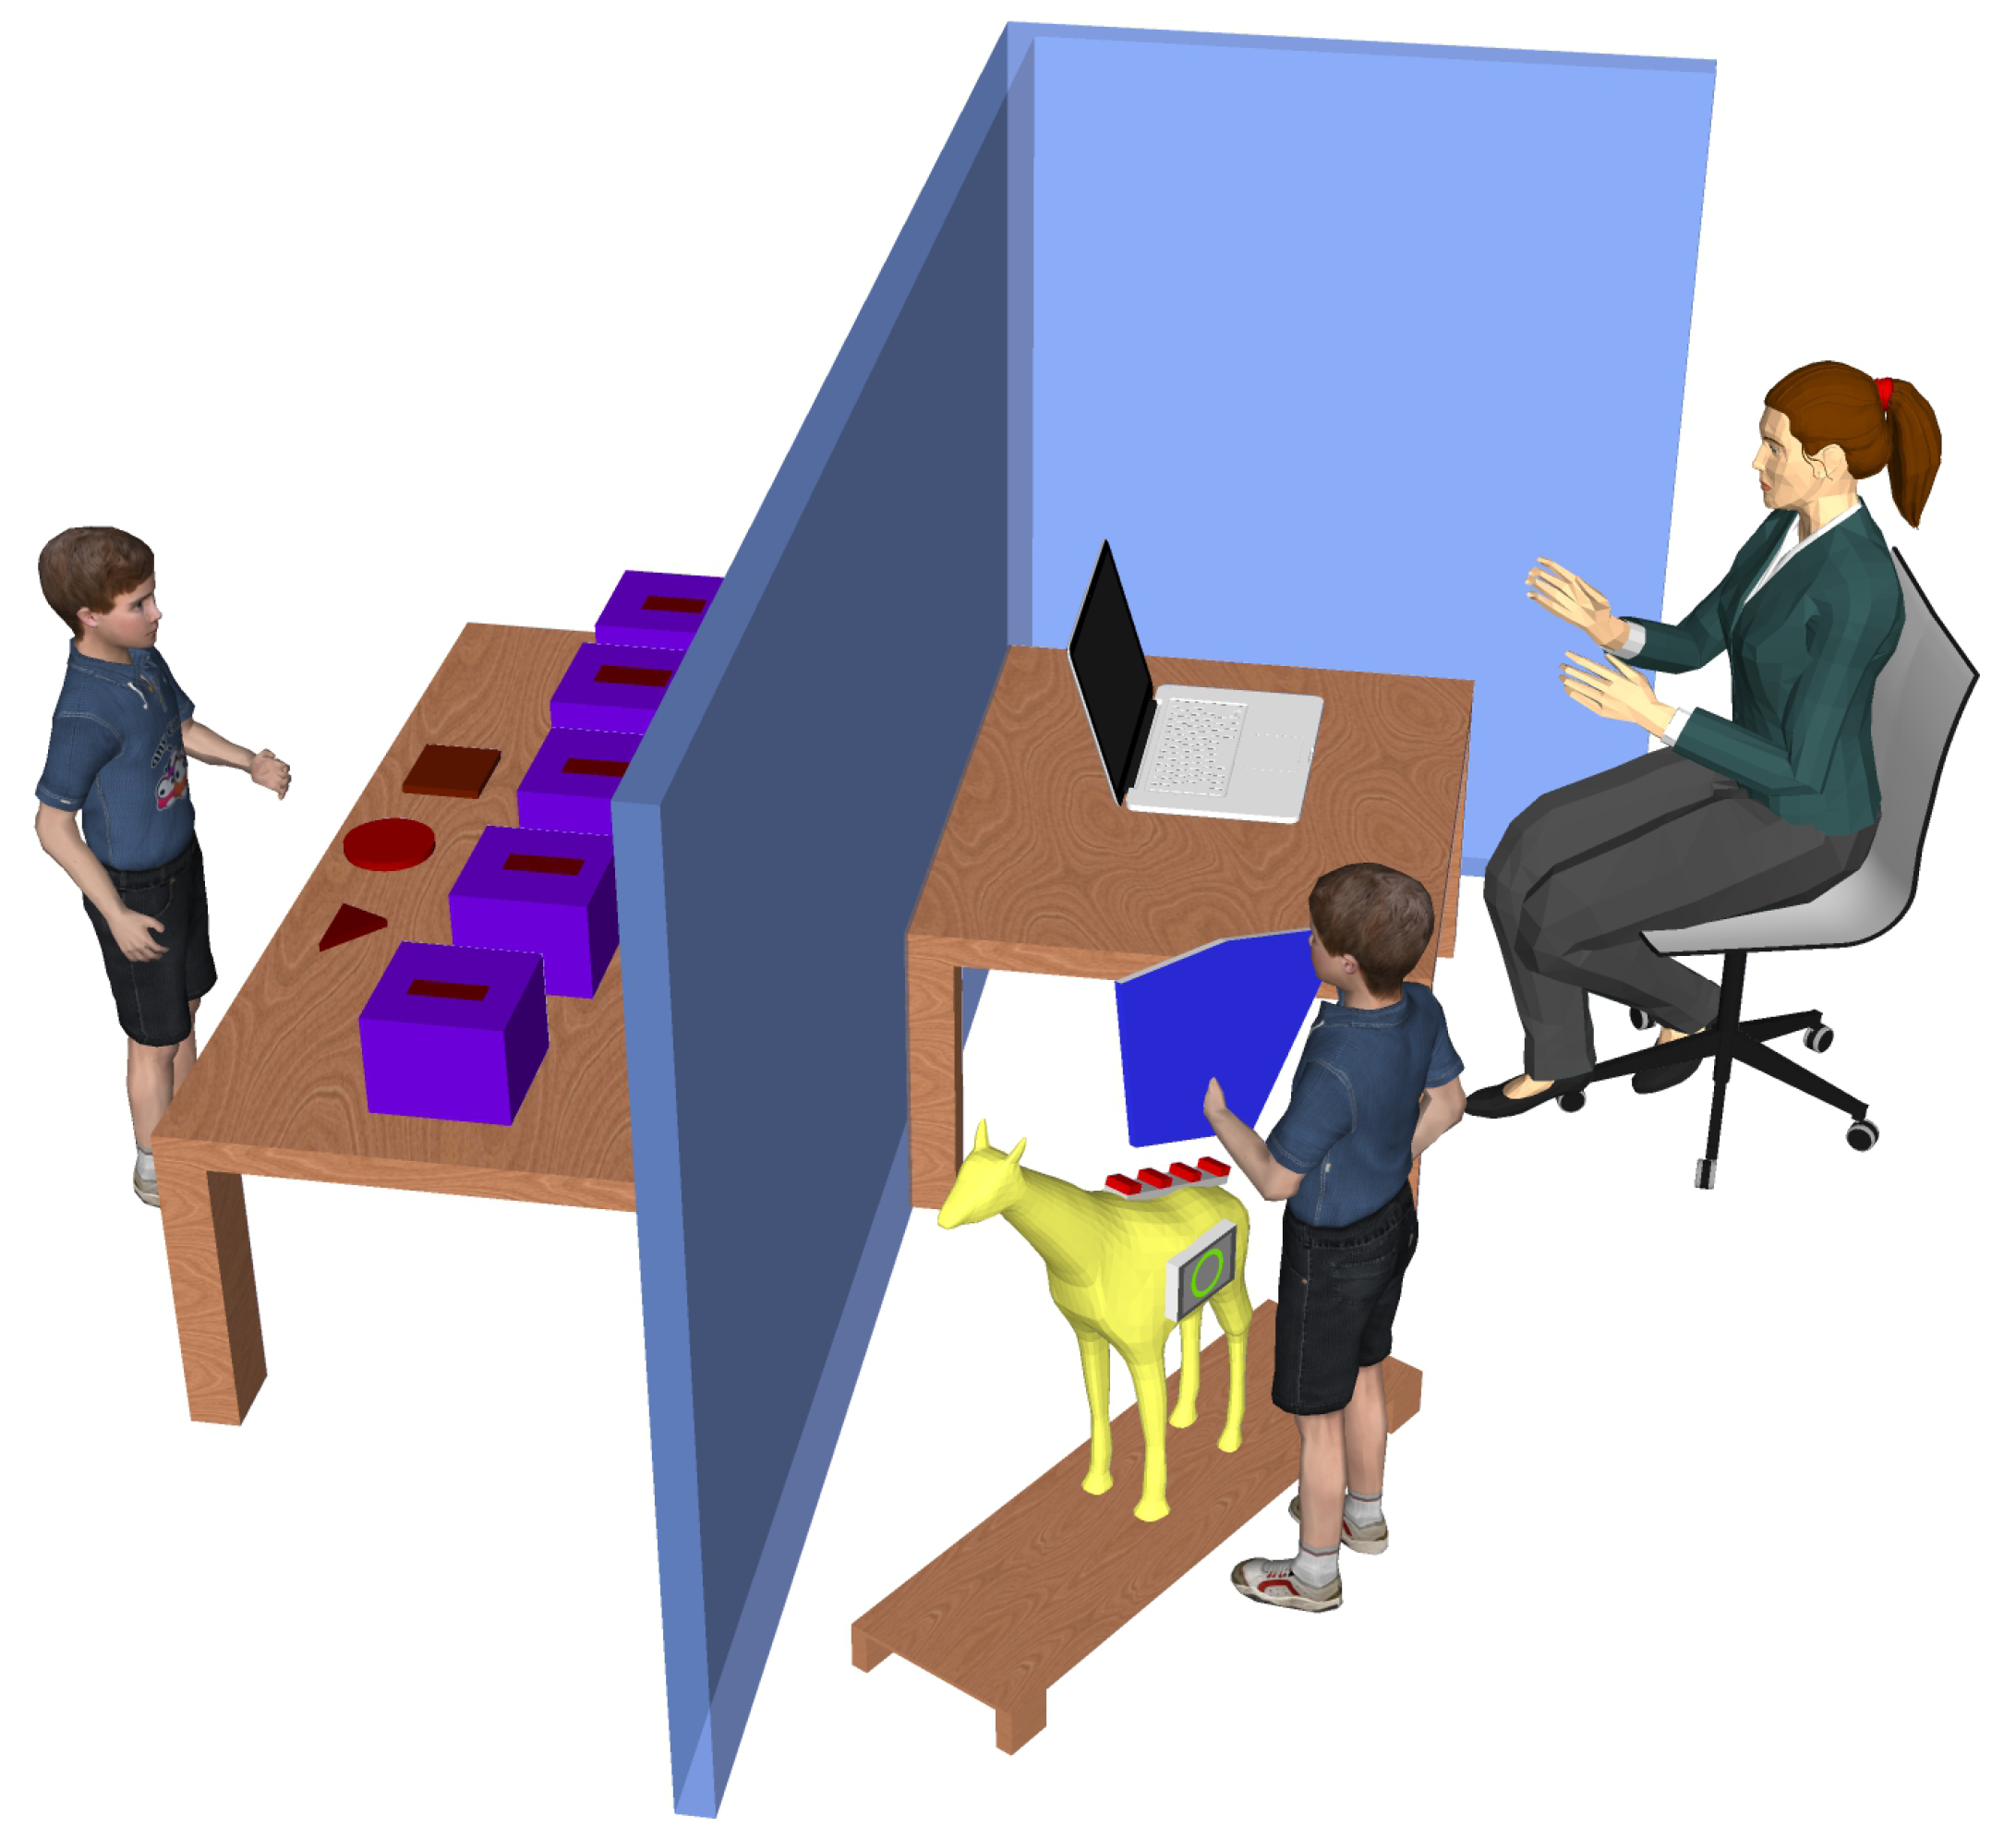
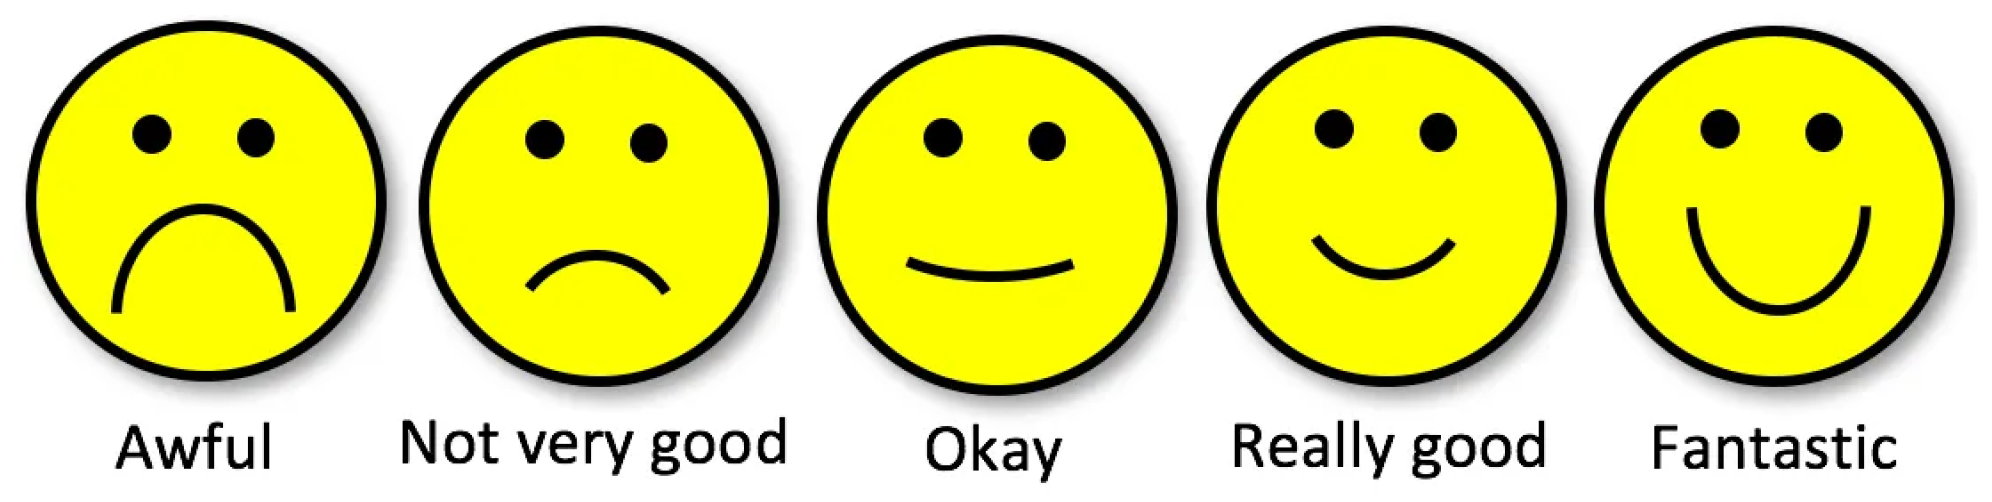
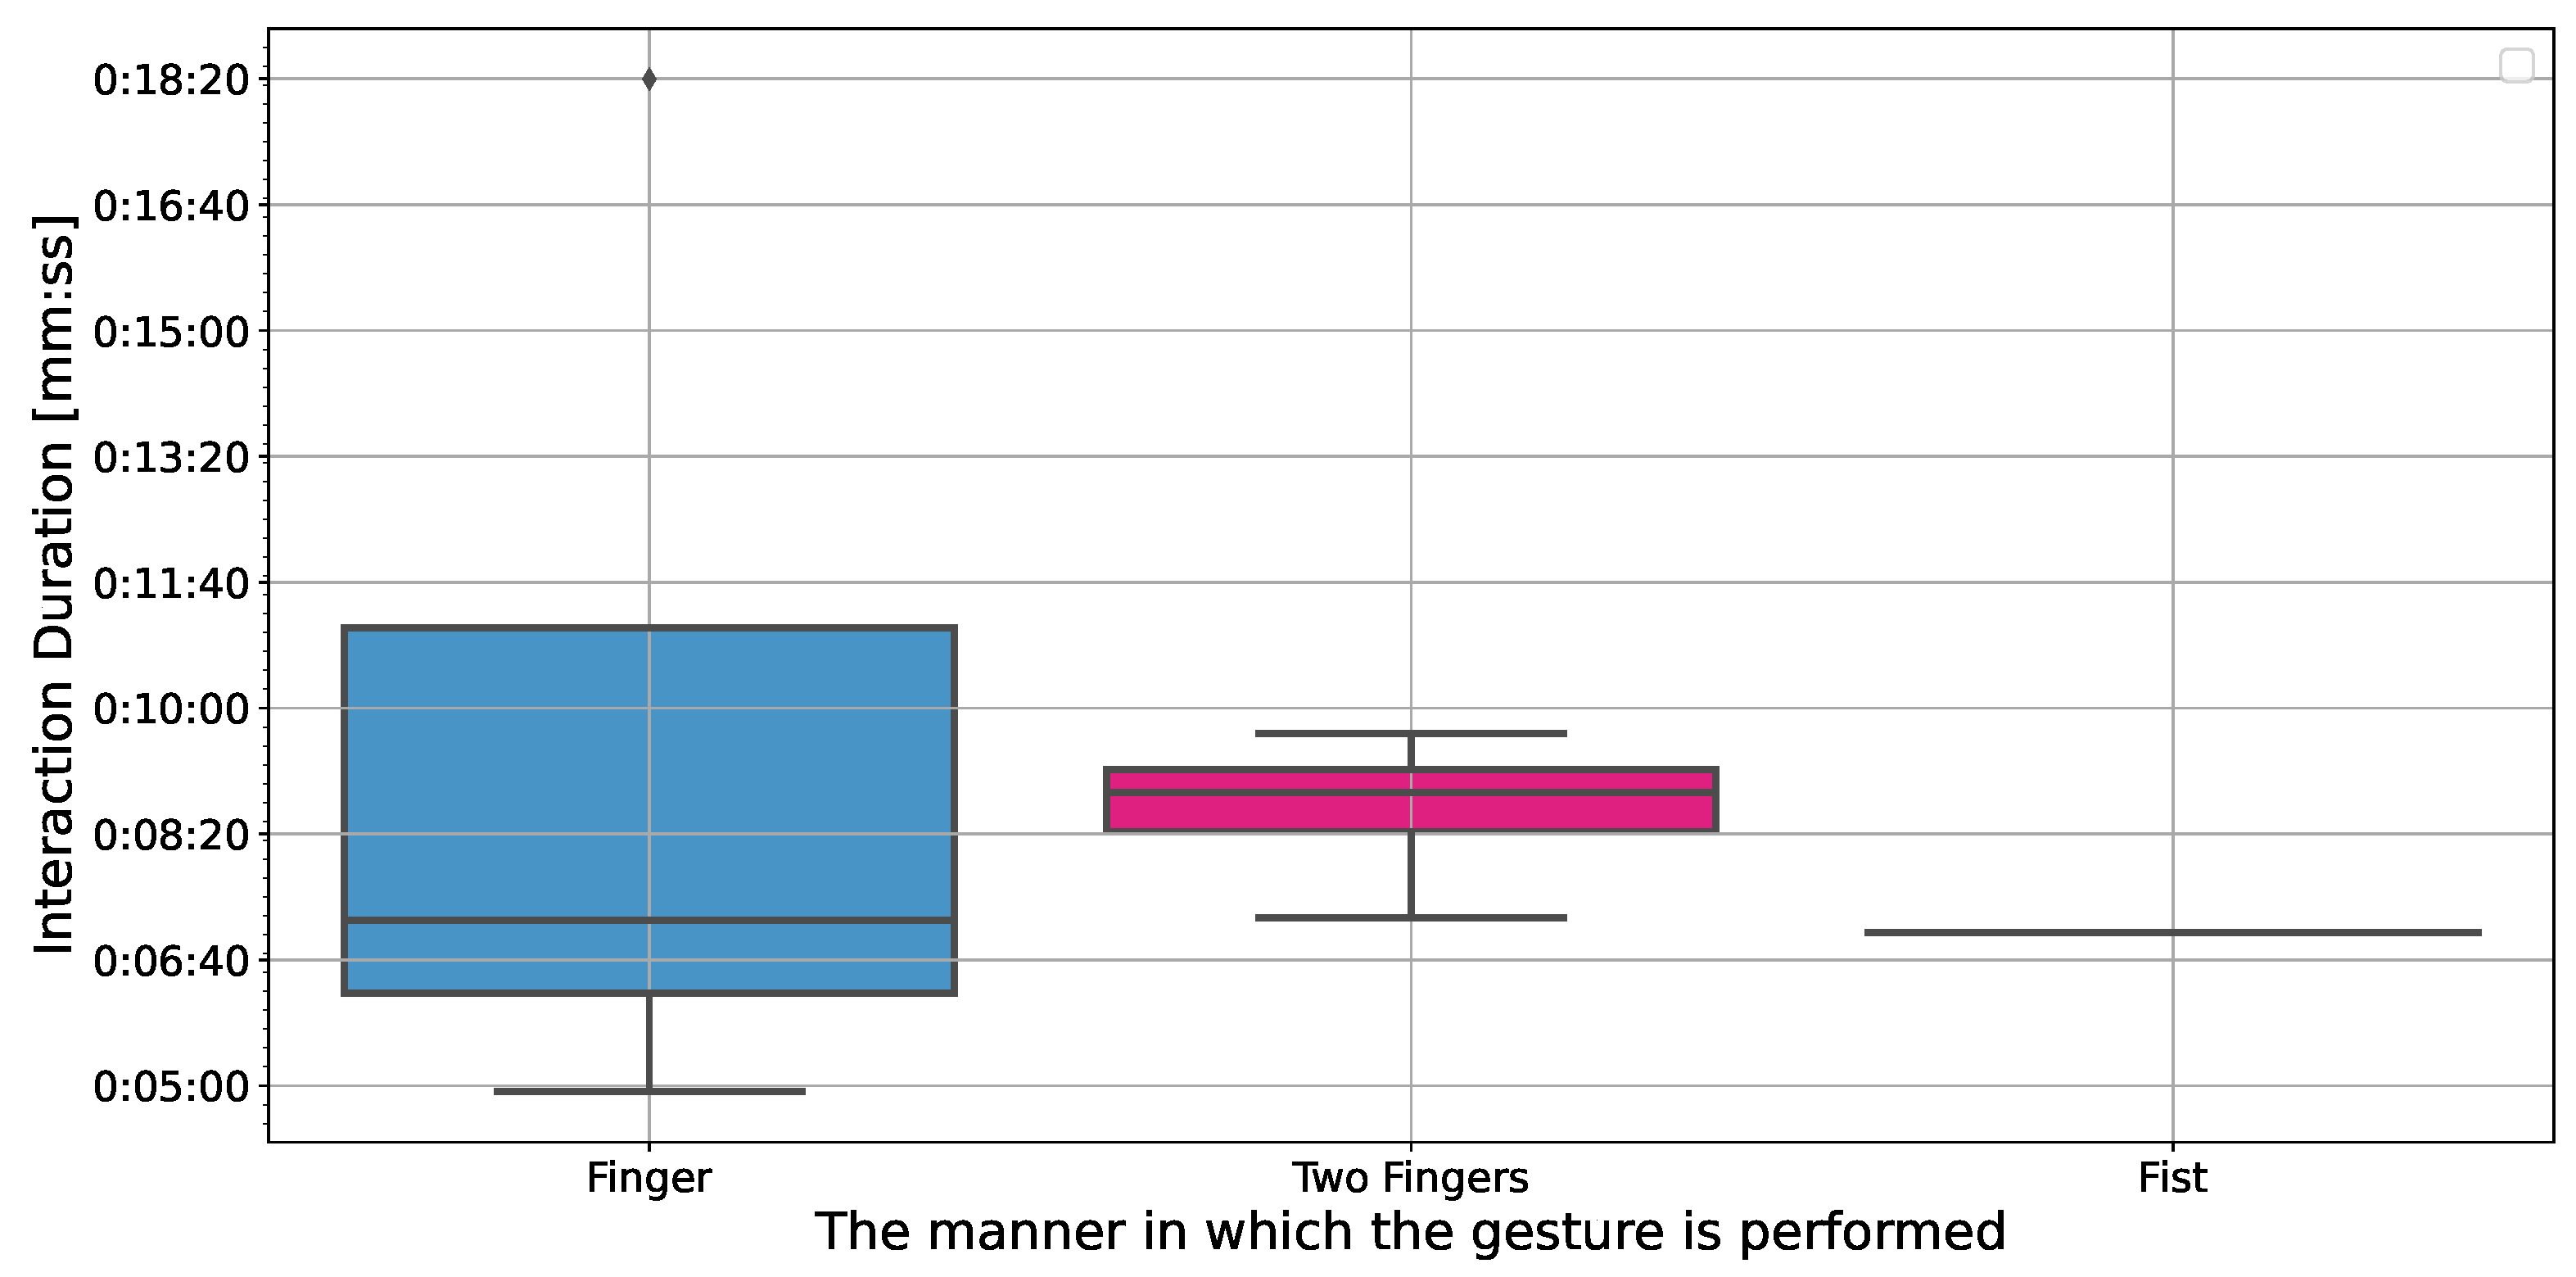
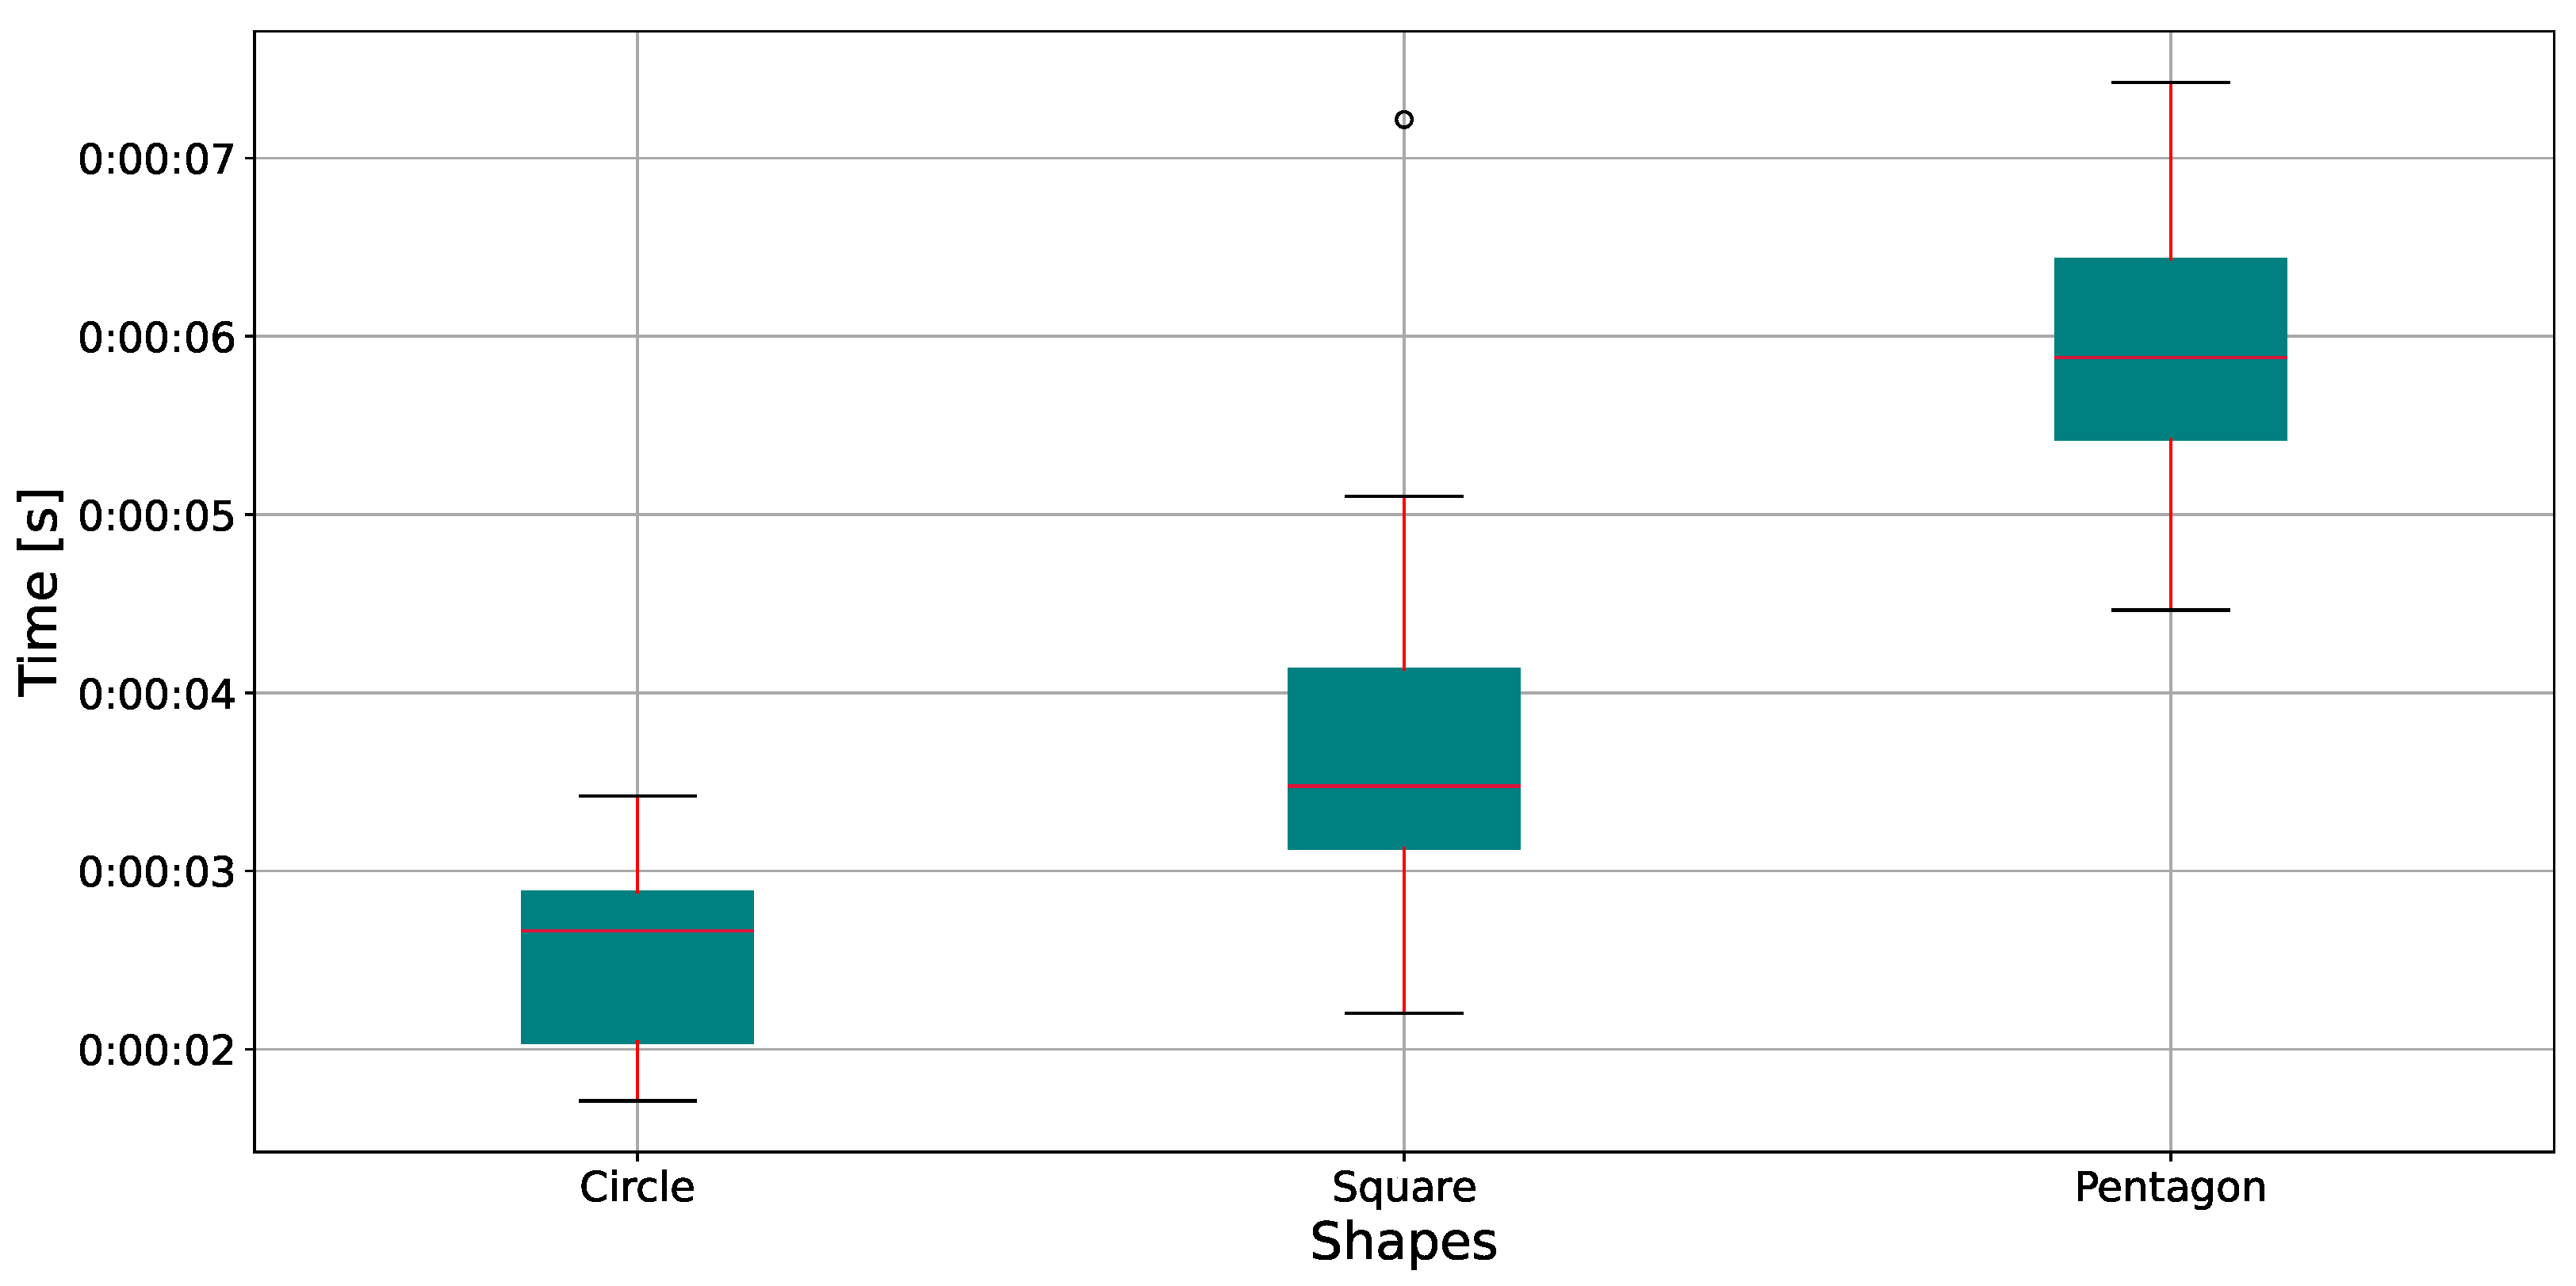
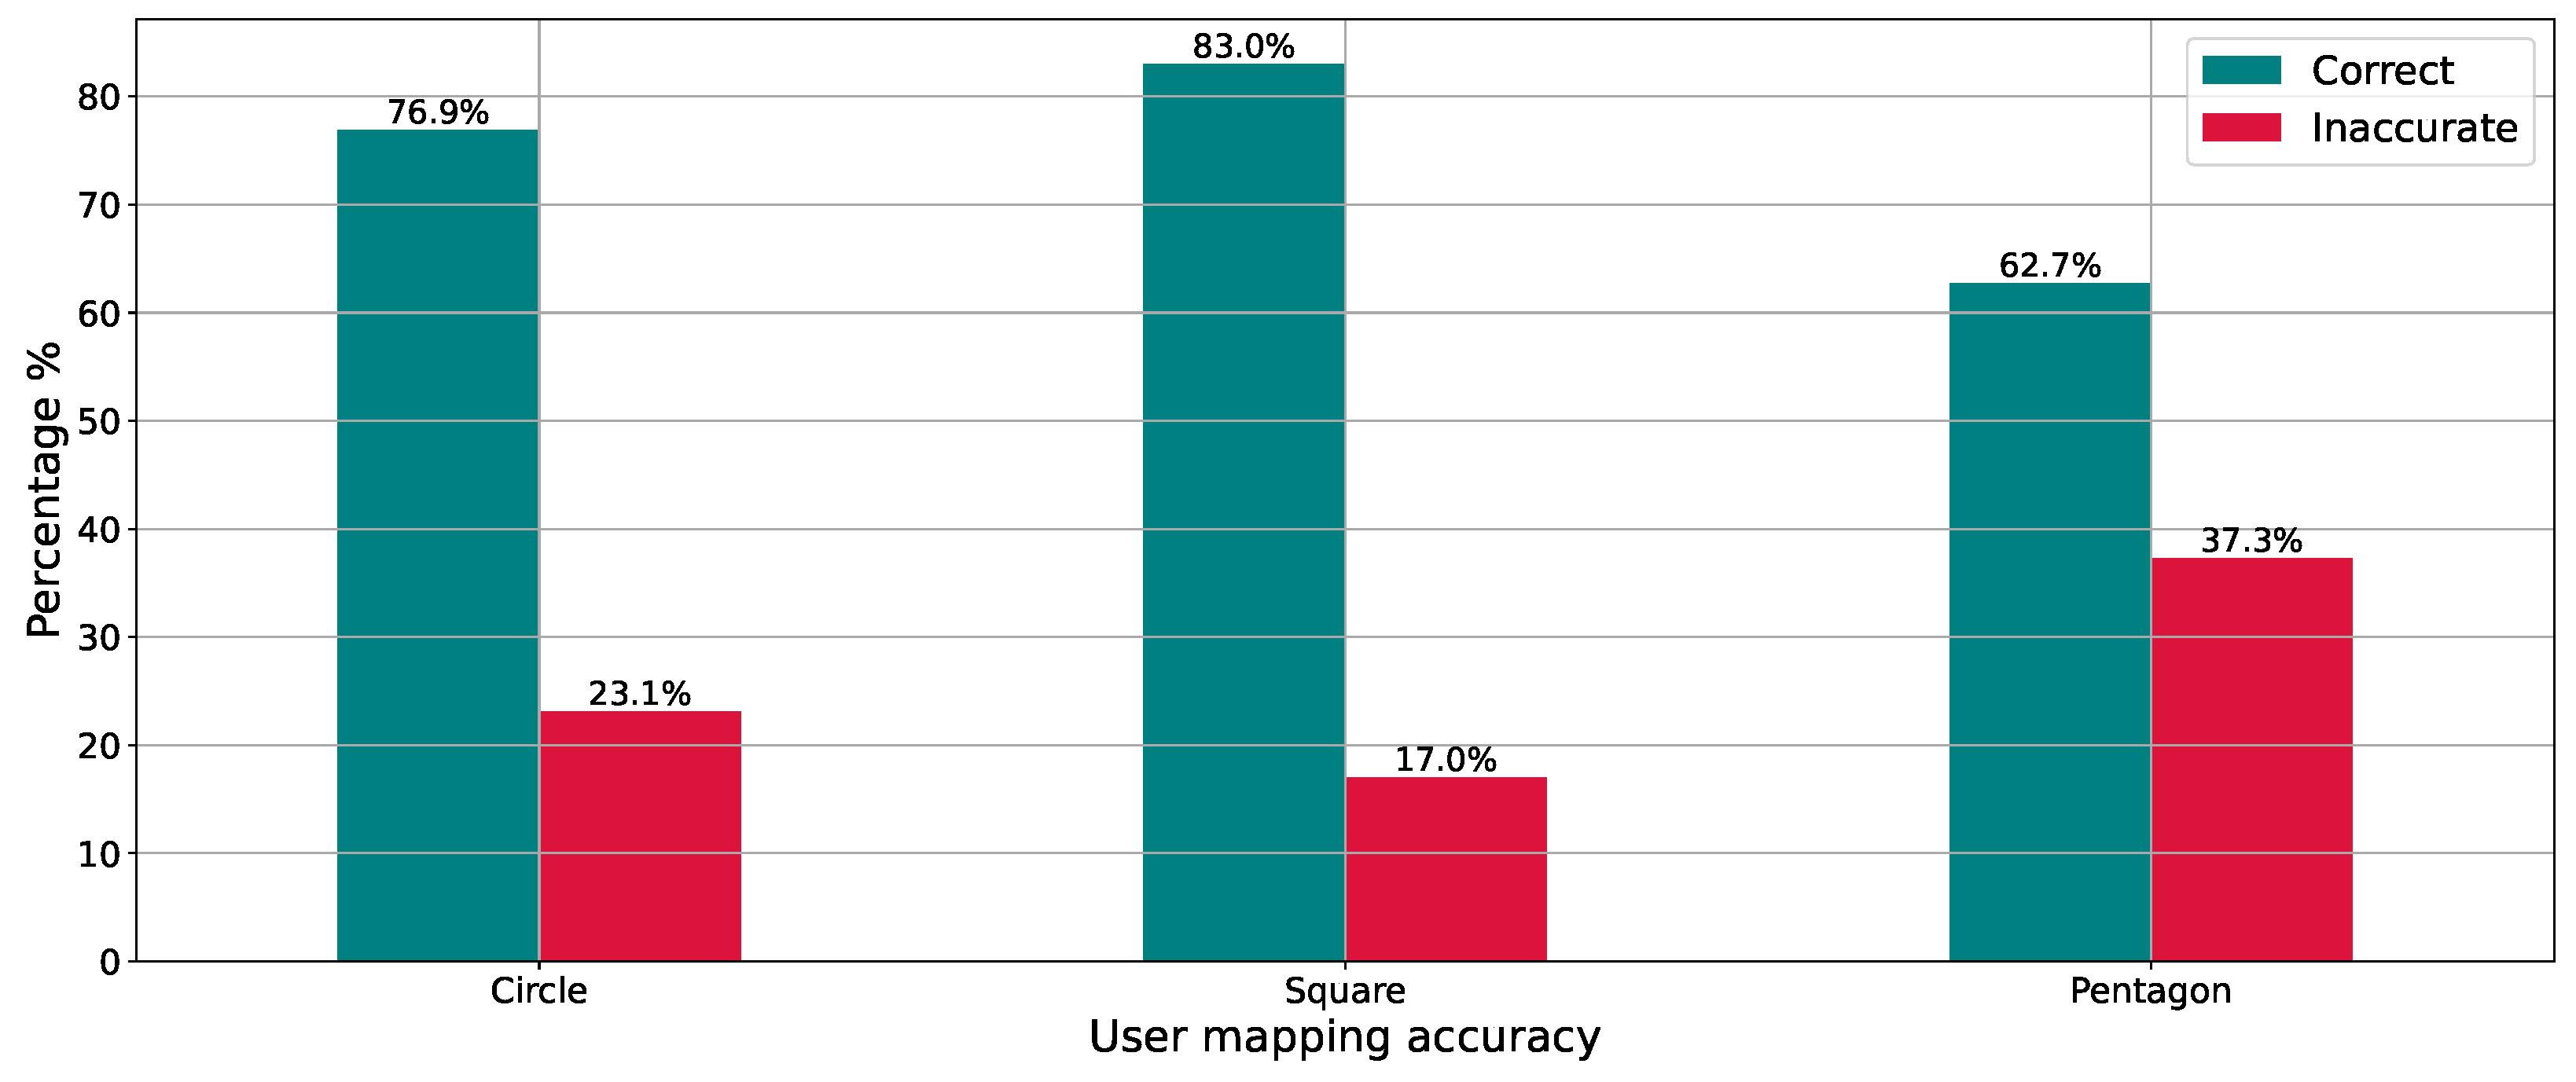
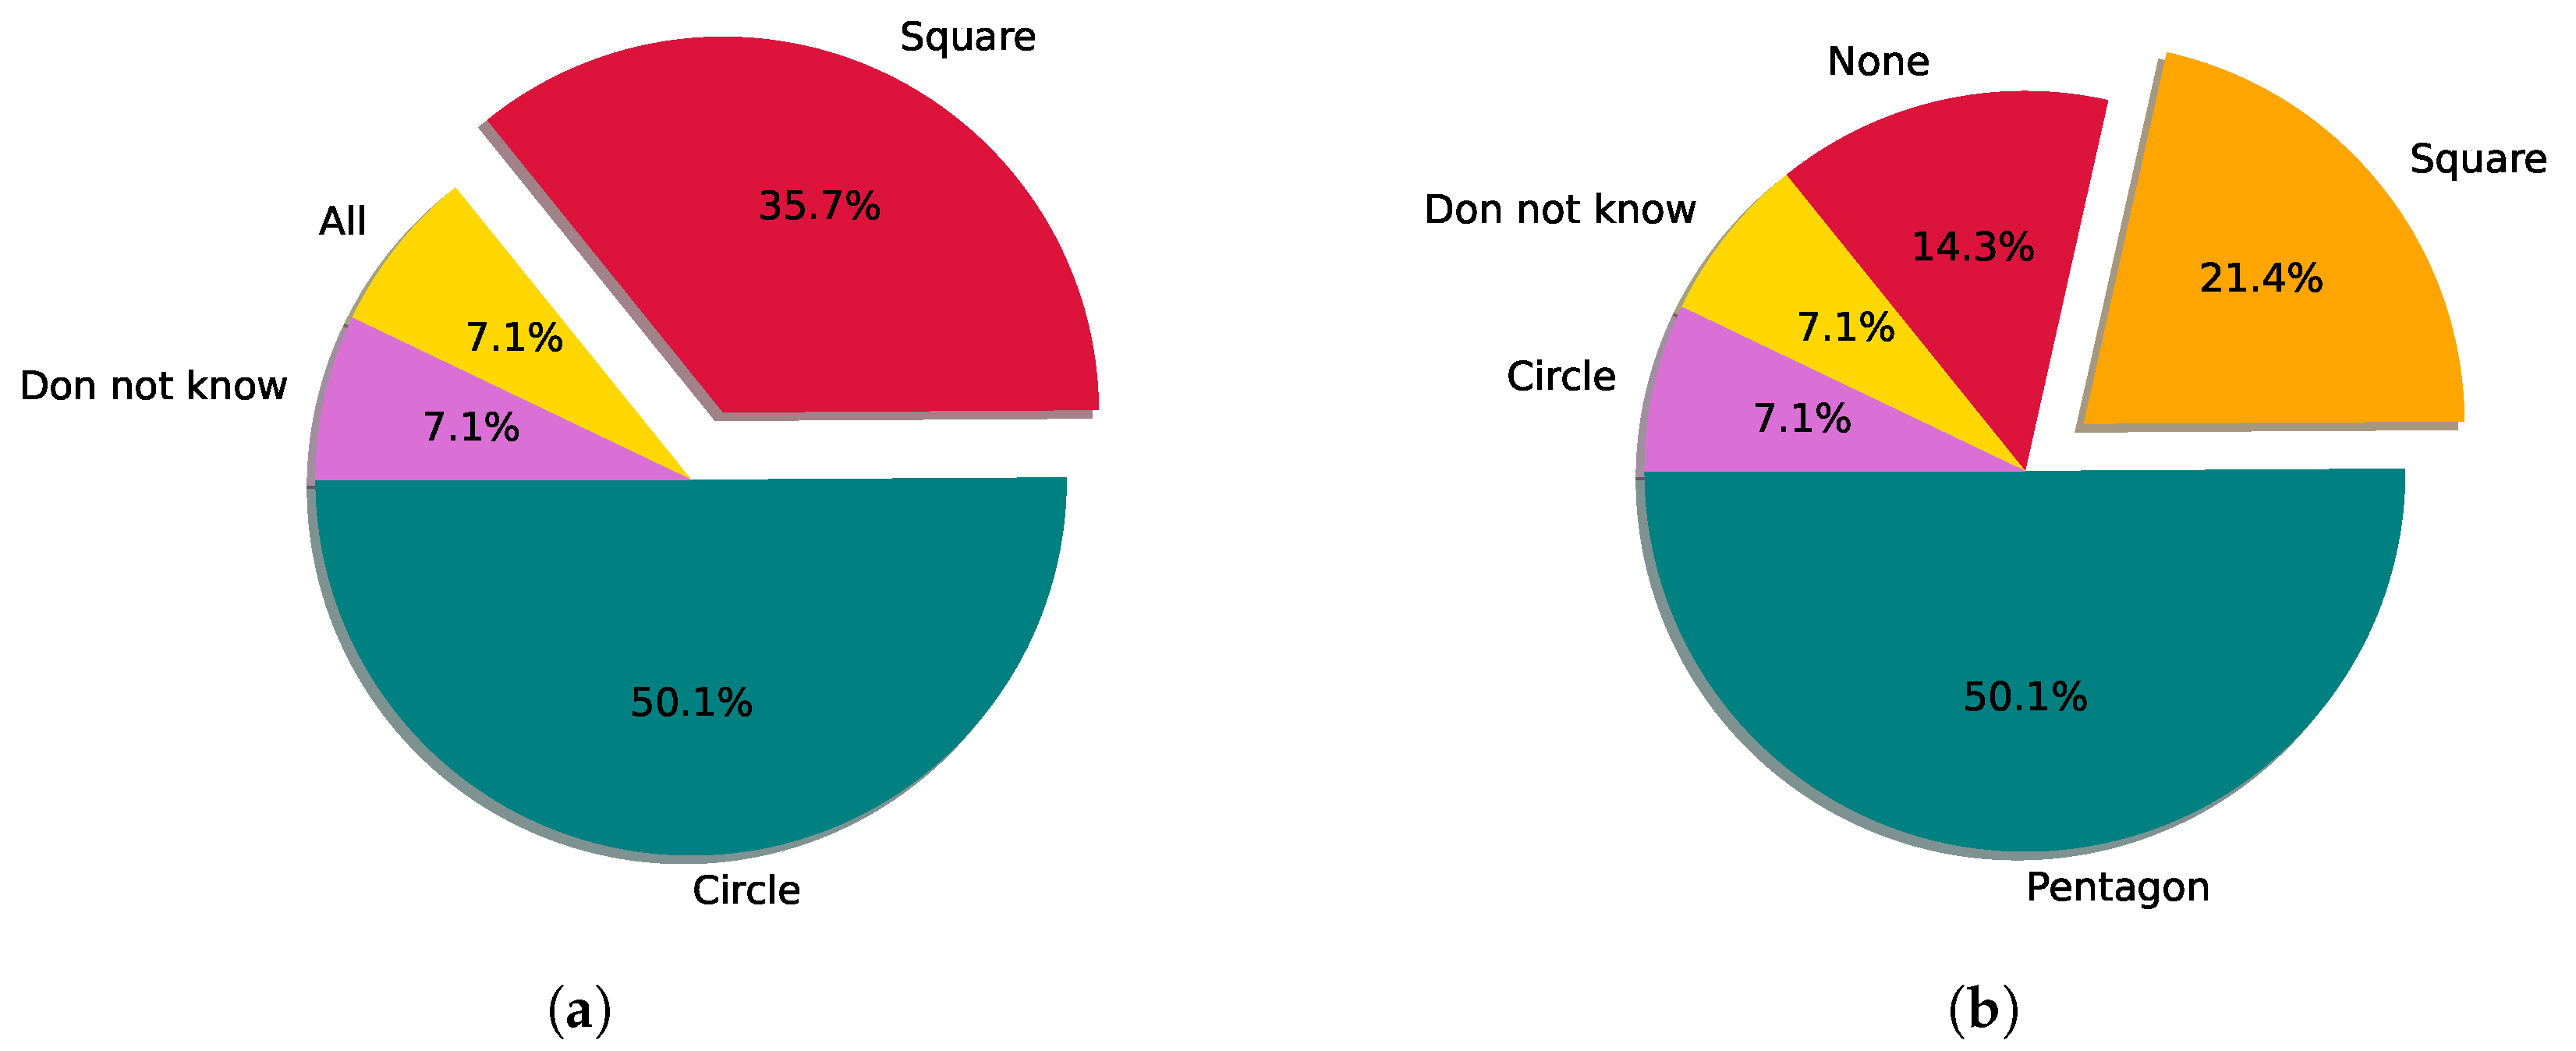
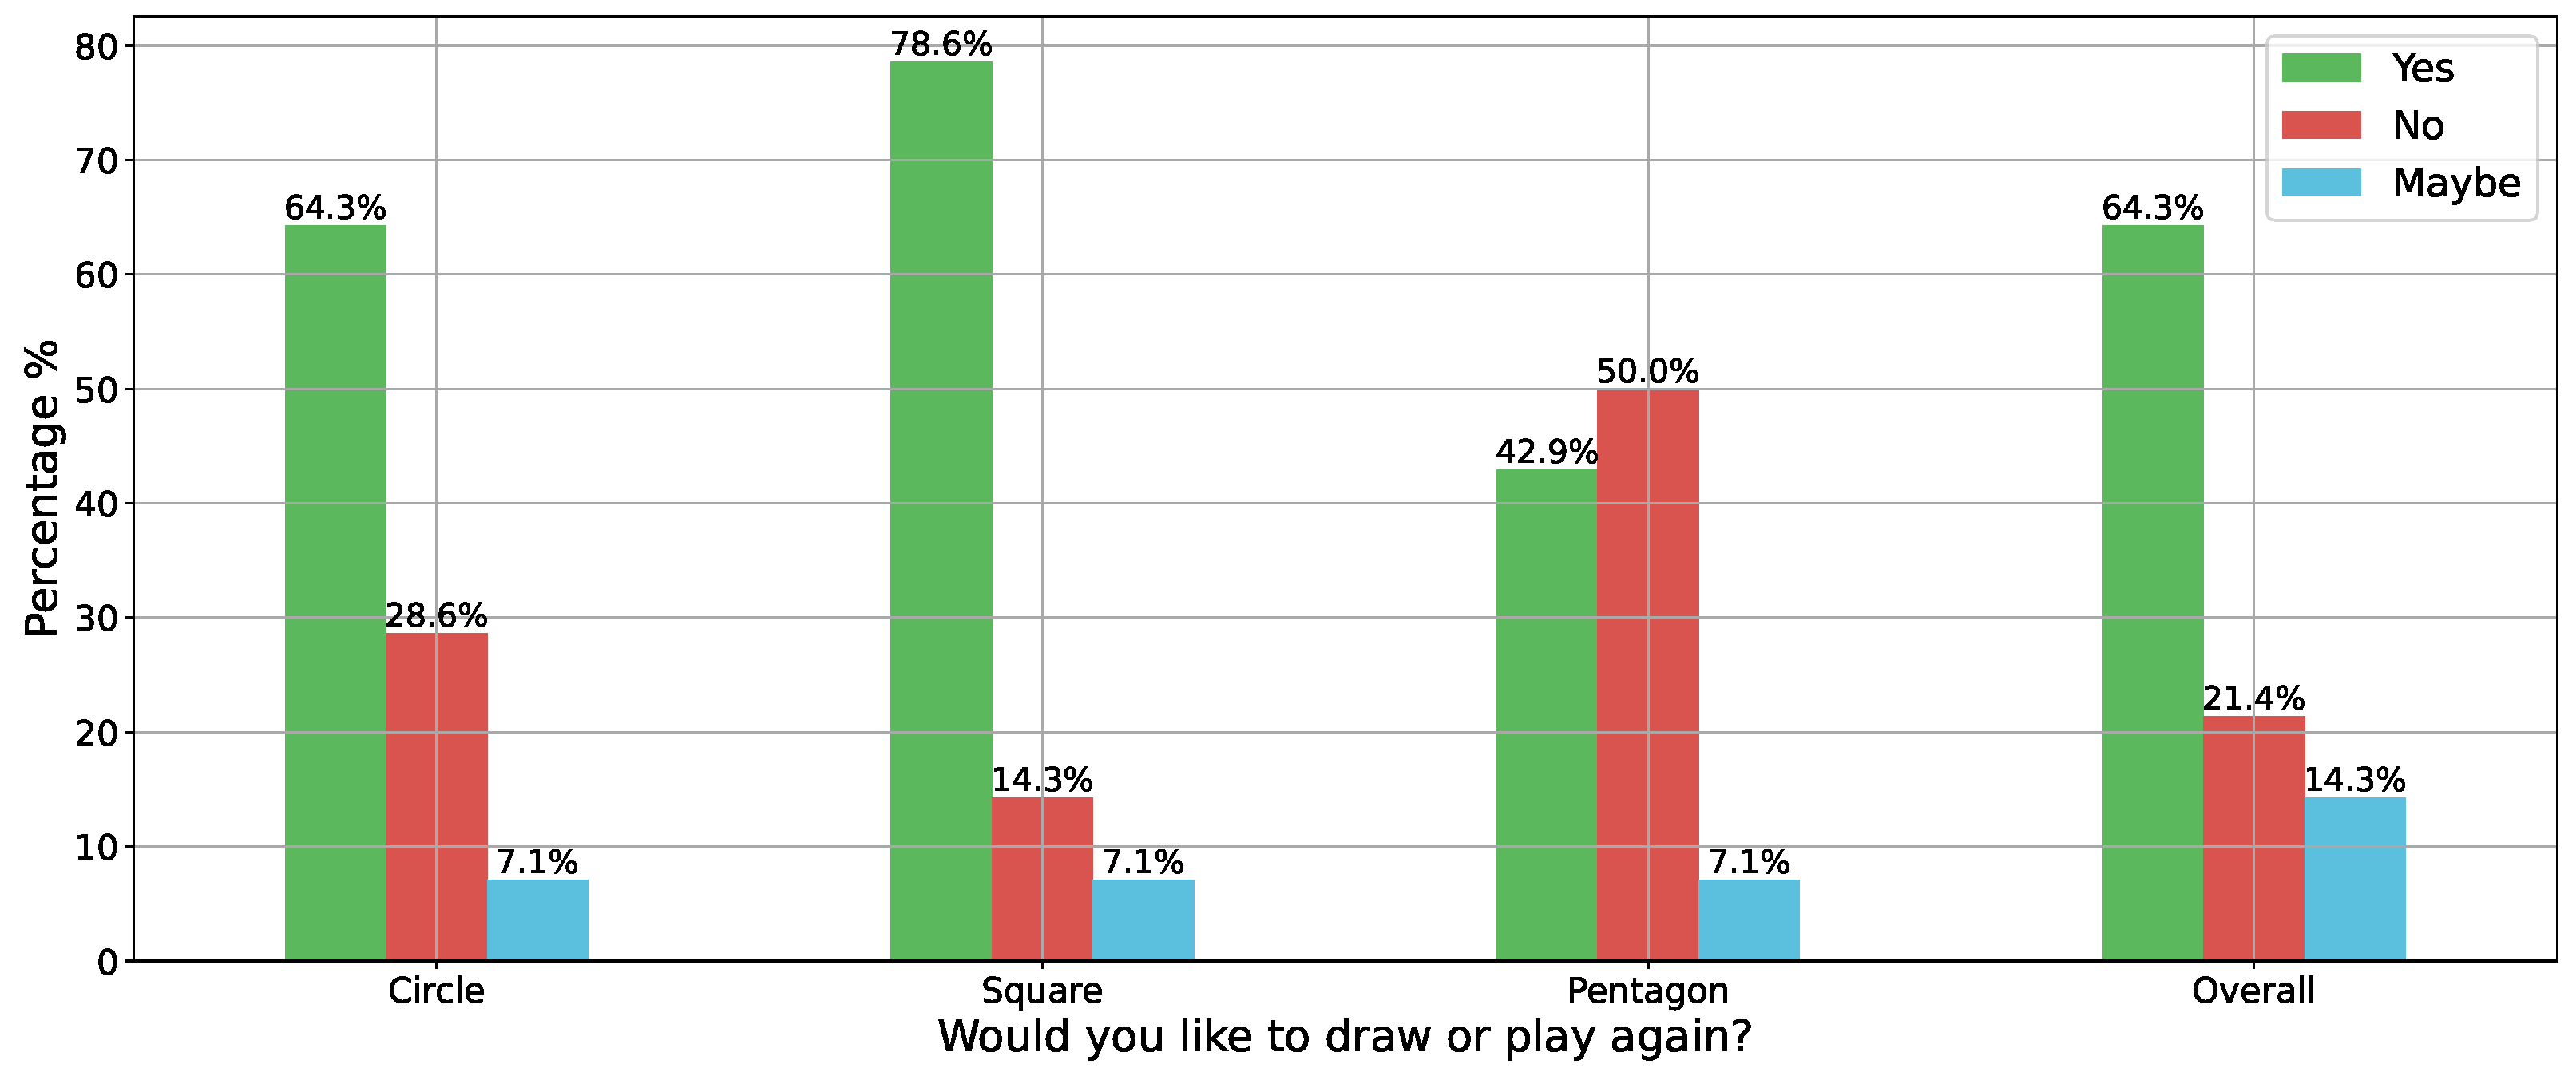
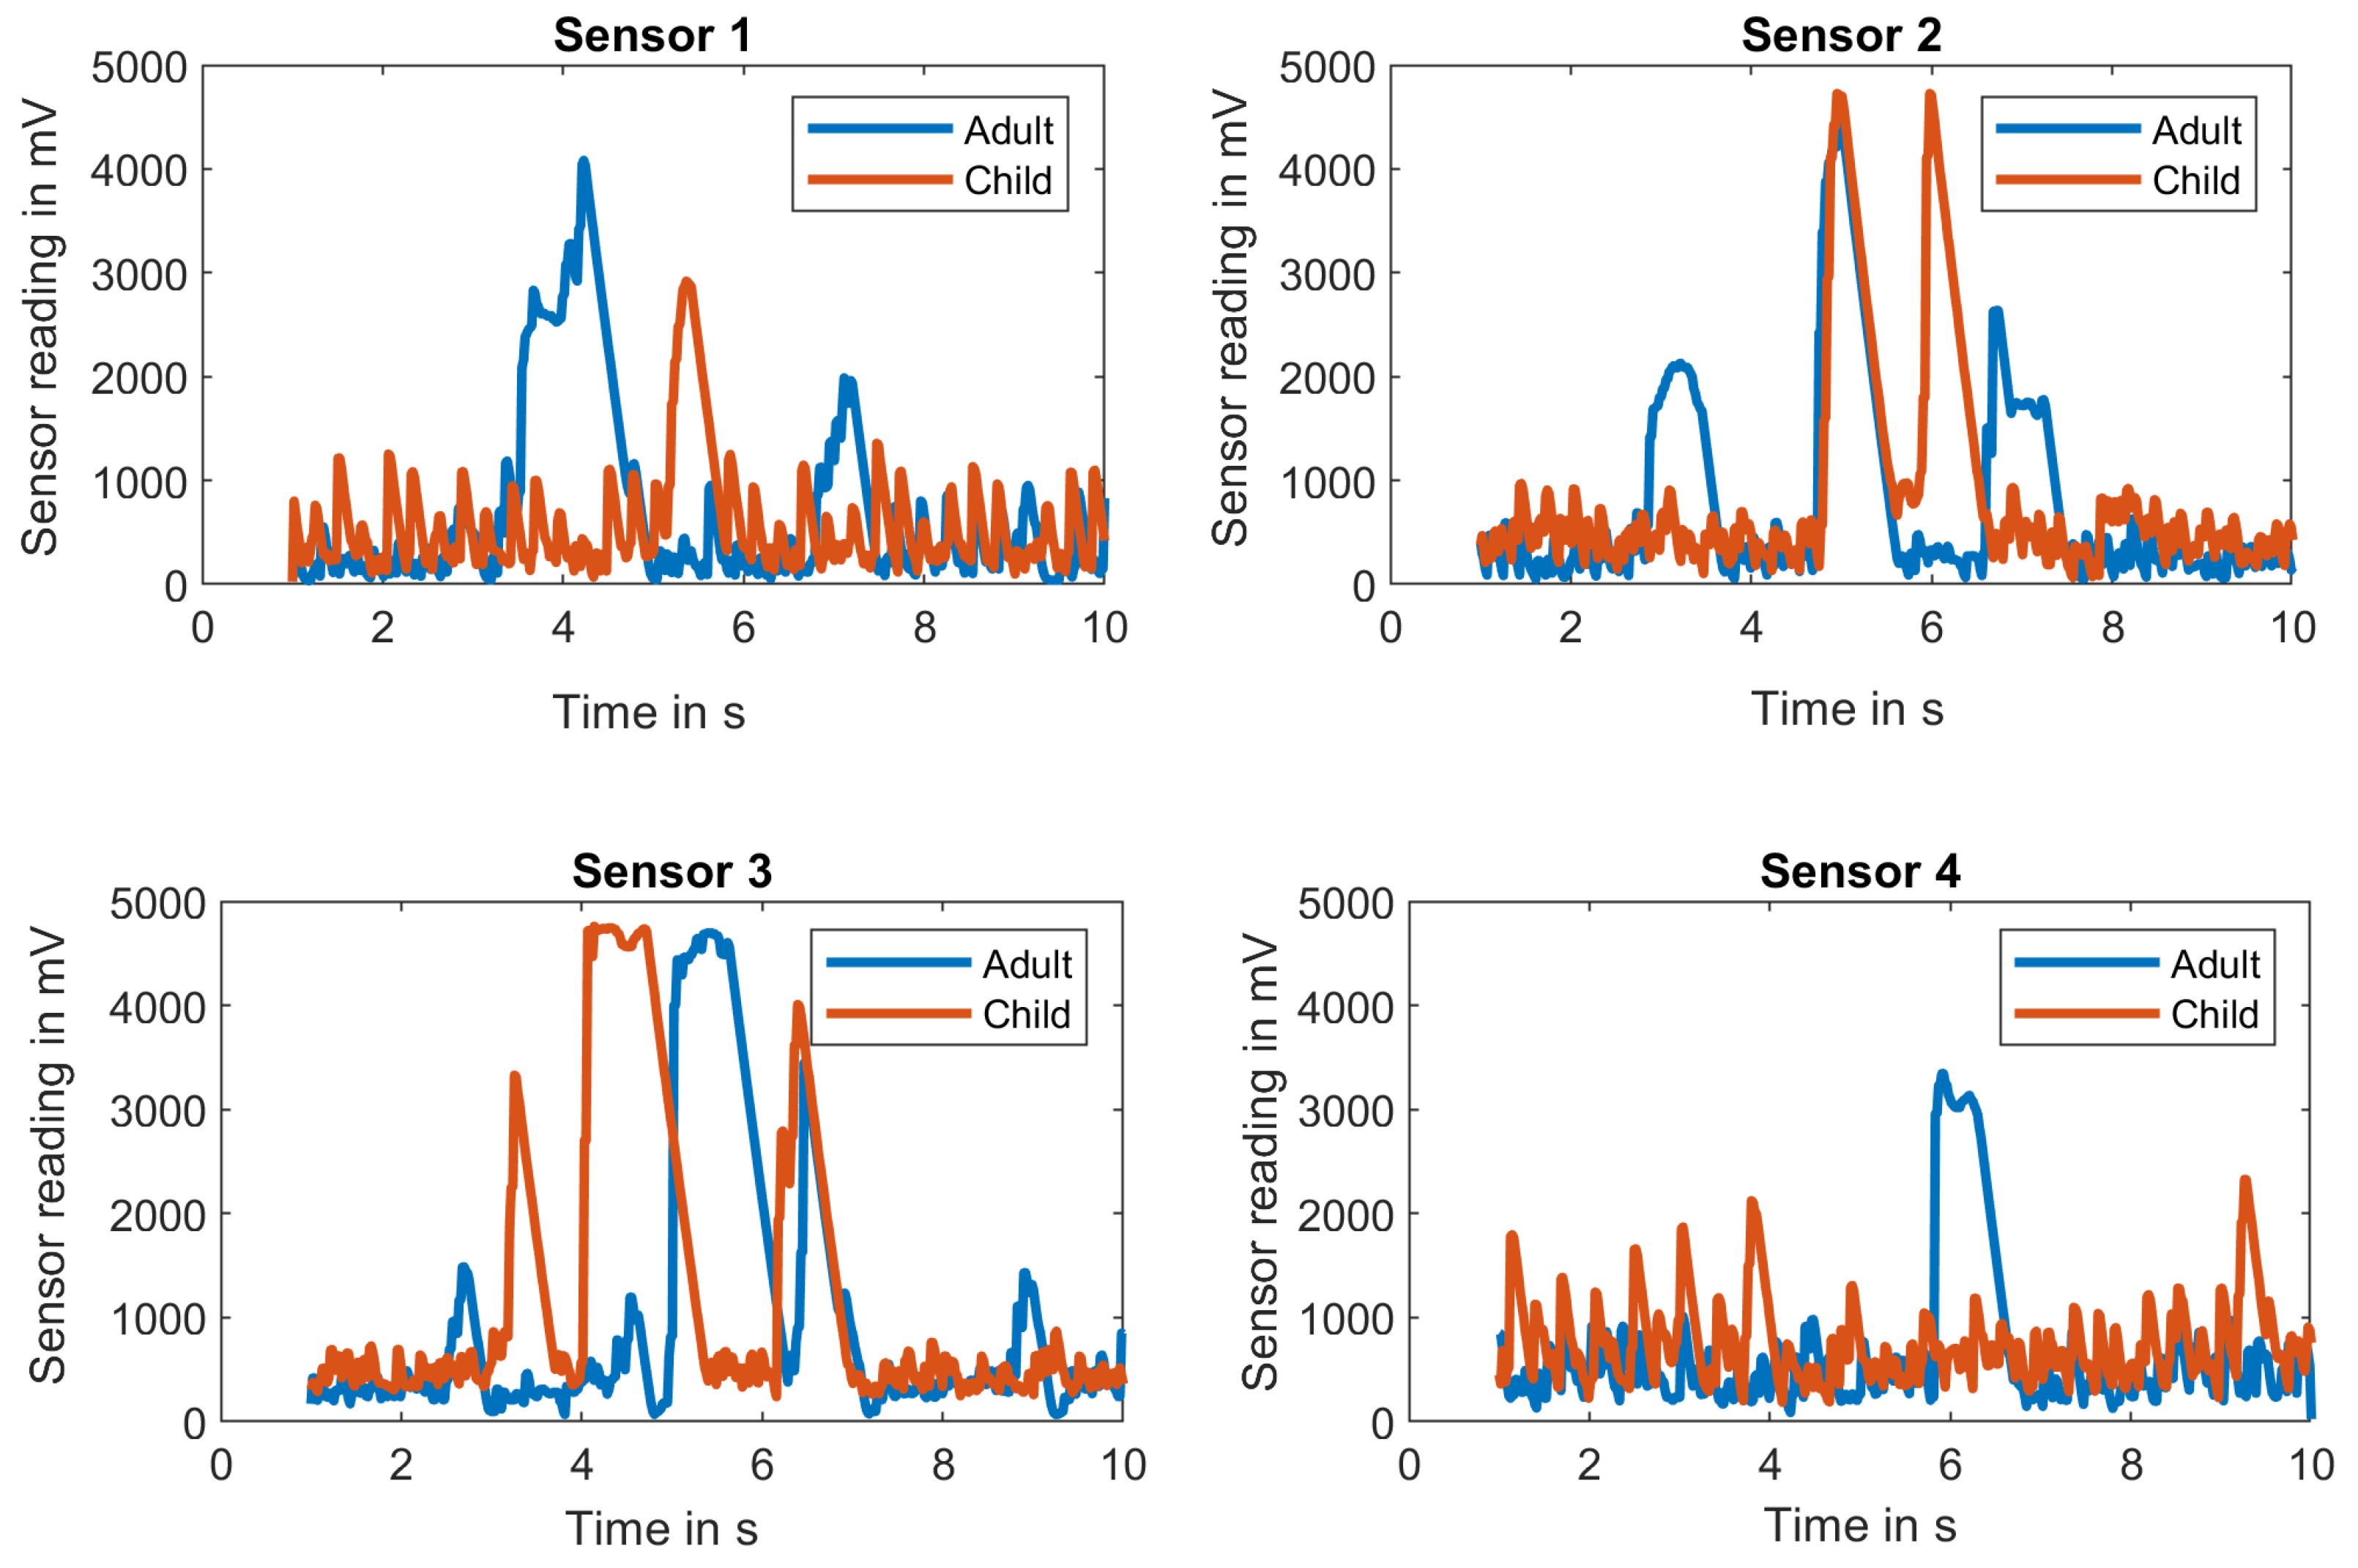