Article

Grapharizer: A Graph-Based Technique for Extractive Multi-Document Summarization

1
Department of Computer Science, International Islamic University, Islamabad 44000, Pakistan
2
Department of Software Engineering, International Islamic University, Islamabad 44000, Pakistan
3
Department of Intelligent Systems, Faculty of Artificial Intelligence, Al-Balqa Applied University, Al-Salt 19117, Jordan
4
School of Computer Science, University of Galway, Galway H91 TK33, Ireland
5
Department of Cyber Security, College of Information Technology, Zarqa University, Zarqa 13110, Jordan
*
Authors to whom correspondence should be addressed.
Electronics 2023, 12(8), 1895; https://doi.org/10.3390/electronics12081895
Submission received: 21 February 2023 / Revised: 7 April 2023 / Accepted: 10 April 2023 / Published: 17 April 2023
(This article belongs to the Special Issue Big Data Analytics and Artificial Intelligence in Electronics)

Abstract

:

Featured Application

A graph-based technique tested on a benchmark dataset and augmented by machine learning techniques to provide a concise, informative, and grammatically correct summary.

Abstract

In the age of big data, there is increasing growth of data on the Internet. It becomes frustrating for users to locate the desired data. Therefore, text summarization emerges as a solution to this problem. It summarizes and presents the users with the gist of the provided documents. However, summarizer systems face challenges, such as poor grammaticality, missing important information, and redundancy, particularly in multi-document summarization. This study involves the development of a graph-based extractive generic MDS technique, named Grapharizer (GRAPH-based summARIZER), focusing on resolving these challenges. Grapharizer addresses the grammaticality problems of the summary using lemmatization during pre-processing. Furthermore, synonym mapping, multi-word expression mapping, and anaphora and cataphora resolution, contribute positively to improving the grammaticality of the generated summary. Challenges, such as redundancy and proper coverage of all topics, are dealt with to achieve informativity and representativeness. Grapharizer is a novel approach which can also be used in combination with different machine learning models. The system was tested on DUC 2004 and Recent News Article datasets against various state-of-the-art techniques. Use of Grapharizer with machine learning increased accuracy by up to 23.05% compared with different baseline techniques on ROUGE scores. Expert evaluation of the proposed system indicated the accuracy to be more than 55%.

Graphical Abstract

1. Introduction

With automation occurring in every domain, people’s reliance on computers has increased tremendously. As a result, there has also been exponential growth in the number of online documents. Bidoki et al. [1] reported that, each day, about 4 million blog posts are published on the Internet, which represents a huge addition to the existing volume of big data. It is becoming increasingly difficult to find important information from such a huge body of online raw data. Automatic text summarization (ATS henceforth) has been in use for the last six decades to handle this issue. Internet users can become frustrated when finding redundant information when they search, instead of receiving news updates on their topic of interest.
Text summarization tools can address such needs and reduce redundancy [2]. Text summarization techniques can produce a variety of summaries. Based on the nature of the technique used to shrink documents, the summary can be abstractive or extractive. The process of creating a brief and succinct summary that encapsulates the key concepts of the source text is known as abstractive text summarization. The generated summaries might include new words and phrases that may not appear in the source text. Extractive text summarization deals with the selection of important sentences from the document(s) and combines the extracts to form the summary [3]. The input for the summarization task can be a single document, making it single-document summarization (SDS), or several documents, making it multi-document summarization (MDS henceforth) [4]. The output of both SDS and MDS is a concise summary of the input text. The supervised learning technique of text summarization needs training data so that the model is trained to learn about important sentences in documents for a summary, whereas in an unsupervised technique, the model does not need training data. Moreover, there are two ways a summary can be generated. Either you want to generate a summary from the document(s) on a particular topic or you want to know the gist of the entire document cluster(s). The former is known as query-based summarization, while the latter is a generic technique of summarization [4]. Figure 1 shows the hierarchical representation of these categories of ATS. The red dotted lines in Figure 1 represent the scope of this study.
Extractive MDS is one of the most popular methods used in automatic summary generation [2,5,6,7]. Extractive MDS aims to mark important sentences in the document cluster and create the summary in such a manner that repetition of the different documents does not result in the duplication of information in the summary. The summary should also not miss important facts found in the multiple documents, while handling the issue of redundancy [1].
There are several challenges that extractive MDS suffers from. One such challenge is the poor grammaticality of the resultant summary [8,9]. A lot of research is currently focusing on improving the sentence quality of the summary. Since input documents may contain similar content in different words and formats, it is important to process words and phrases that have a similar meaning in a similar way. This can be achieved using synonym mapping during pre-processing. Some articles contain phrases, such as phrasal verbs, proper nouns, compound nominals, and idioms for expression, known as multi-word expressions (MWE) [8]. If all the MWE are substituted with appropriate single-word synonyms, the resultant concise summary will have a better grammatical basis.
Grammaticality suffers mostly in anaphora and cataphora. Sentences containing nouns may not be picked up for the summary. However, if sentences with pronouns are included in the summary without their original noun referents, the summary will become ambiguous. Therefore, pronoun replacement must be carefully performed to keep the summary grammatically correct [3,9].
The query-focused summarization process is straightforward, i.e., the model picks all the sentences containing the keywords of the query to prepare the summary [7]. The generic technique, however, can suffer from omitting important topics that are not referred to clearly in documents. In this regard, if topic modeling is used before preparing the summary, the probability of missing any topic will be minimized. Modern research is mainly focused on addressing these challenges in the development of summarization systems.
In this paper, we propose a generic, graph-based extractive multi-document summarization system and call it Grapharizer. We address some of the prominent problems that are faced by summarization systems, which concern maximizing coverage of all the topics and reducing redundancy. The proposed methodology increases the informativity and representativeness of all topics, and improves the grammatical quality of the resultant summary, while mitigating redundancy in the summary. In our system, summaries are generated by plotting the sentences as a word-graph that returns the shortest sentences related to a topic in the form of short paths in the graph. Graphs are prepared for each topic individually; therefore, there is a representation of every topic in the summary, without repetition of the sentences of the same topic in the summary.
The proposed system is evaluated using the DUC 2004 and Recent News Article datasets. These datasets contain a variety of topics; each topic has ten files which discuss different aspects of the same news event. The nature of these datasets fits exactly with the challenges that modern summarization systems face. Evaluations undertaken using Recall Oriented Understudy for Gisting Evaluation (ROUGE) variants showed 23.05% accuracy by Grapharizer with ML on ROUGE-1 recall and a 6.49% F-score, while the results for Grapharizer alone were also promising when compared with different baselines techniques. A manual evaluation was also performed that indicated 55% accuracy of the summary generated by Grapharizer in comparison with reference summaries.
The rest of the paper is arranged as follows: In Section 2, we briefly discuss existing approaches related to text summarization, specifically papers on the graph-based method of extractive summarization. Section 3 contains a detailed discussion of the proposed model that improves the grammaticality of the resultant summary. Section 4 contains details of the experiments conducted. Discussion of the results relating to variations in treatment on the model is provided in Section 5. Finally, we conclude our study in Section 6 with discussion of future directions for researchers.

2. State-of-the-Art Multi-Document Summarization Techniques

There are many techniques to facilitate extractive MDS tasks, including ontology-based [10,11,12], t-based [13,14,15,16,17,18], clustering-based [19,20,21,22,23,24,25], latent semantic analysis [26,27,28,29,30,31,32,33], and graph-based [8,34,35,36,37,38,39,40,41,42] techniques. Since our proposed technique, Grapharizer, produces summaries from the input text using the graph technique, in this section, we discuss the literature related to the use of graph theory in ATS in detail.
The use of graph theory for generating summaries is not new. It has roots that are deep in the field of ATS. Erkan and Radev [34] used graph theory for the first time for summarization in 2004. They devised the LexRank algorithm, which was an adaptation of the PageRank [35] algorithm. The sentence salience in a graph is computed using the eigenvector centrality to compute the importance of the node in the sentence graph. The algorithm was tested over variants of DUC and evaluated via ROUGE.
Once graph theory was shown to work successfully in MDS, much work started in this field. Baralis et al. [37] adapted the a priori technique of association rule mining in MDS to find the correlation between terms in datasets and ranked sentences using PageRank [35]. Christensen et al. [42] used directed graphs for sentence selection and ordering to generate coherent summaries. Similarly, Sukumar and Gayathri [41] worked to achieve sentence ordering using an entailing method employing WordNet alongside graph theory. John and Wilscy [39] incorporated Euler’s graph theory and named their approach the Vertex Cover algorithm for MDS. Sentences were mapped into vertices. Vertices with high relevance scores qualified to appear in the summary.
Sentence compression is also an important aspect of text summarization since it makes the text concise for readers. ShafieBavani [8] compressed sentences using a word-graph technique, while maintaining the grammaticality of the summaries extracted from the unstructured dataset. They also mapped MWE with their single-word equivalents, whereas Canhasi [36] presented a five-layered heterogeneous graph for MDS. Tzouridis et al. [40] extended the idea of compressing individual sentences to summarize documents. They presented the word-graph method and compressed similar sentences by finding the shortest path in the graph. Machine learning was also used to classify candidate sentences in the graph for the summary.
The idea of summarization has also attracted researchers from domains other than text. For instance, it has been adopted heavily in computer vision. Chen et al. [43] used the deep learning techniques of CNN and RNN to summarize multi-modal text. Similarly, Celikkale et al. [44] adopted the idea of automatic summarization to generate structural summaries for a huge collection of images. Shingrakhia et al. [45] extended the benefits of summarization to the cricket ground by devising a technique to generate match summaries. Similarly, Radarapu et al. [46] used video summarization for security purposes. ATS has also been used for opinion mining [5,47,48]. Nathania et al. [5] exploited the ATS technique for hotel reviews, whereas Marzijarani and Sajedi [47] carried out the same task using the clustering-based method. Similarly, Abdi et al. [48] extended this idea to movie reviews.
Optimization of the resultant summary is an equally important task. Bidoki et al. [1] devised a technique for extractive MDS employing statistical, graph, and machine learning techniques to optimize the resultant summary. They focused specifically on improving the extraction of short sentences in text by expanding them with suitable words and tuning the overall sense in them.
Cross-language platforms are also adopted in ATS. For example, if the provided documents’ cluster is not in a language familiar to the user, instead of translating the entire cluster, it is wiser to convey the gist of it in the target language to the user. Pontes et al. [49] handled this issue with promising results. The compressive approach was applied at multiple, as well as single, sentence levels so that a French-to-English summary could be generated. One major objection to this study is that the authors relied on the Google Translate system for translations, which usually fails to translate the MWE across languages.
The EdgeSumm method proposed by El-Kassas et al. [50] is a mixed approach combining graphical, statistical, semantic, and centrality-based methods. The authors proposed a combination of four algorithms to resolve the task of summarization. The approach involves constructing a text-graph, scanning the graph for summary candidate selection, and then adjusting it up to the set limit of length. The EdgeSumm algorithm was claimed to provide results comparable to SOTA algorithms.
The KUSH summarization system by Uçkan et al. [7] used sentence relations to maximum levels. They exploited the idea of independent sets to analyze the graph nodes to select the most representative sentence that, in summary, contained the maximum information. Sentences were ranked and selected using eigenvector centrality. An increase in informativity and a decline in redundancy were reported in the results.
Another attempt to discover cross-sentence relations was undertaken by Wang et al. [51] using the technique named HeterSumGraph. They constructed a sentence-graph and enriched it with semantic nodes at different levels. Sentences were connected with semantic nodes that were constituted using words in sentences. The graph was scalable through the multi-documents by introducing document nodes. The technique can be extended for improved results by extending the features to topics and entities.
Since its beginnings, the bio-inspired firefly metaheuristic algorithm has gained a lot of attention and has been used in a variety of applications. Tomer and Kumar [52] employed it with an improved fitness function to evaluate features, and to generate a summary with highly relevant sentences concerning the given topic. Based on the attraction of less bright fireflies towards the brighter ones, this algorithm was utilized in MDS to move non-optimal solutions toward optimal ones. The algorithm performed better according to ROUGE 1 and 2 scores on DUC dataset variants in comparison to other nature-inspired algorithms.
Medical documents are very significant, and they have special meaning in diagnosis. Davoodijam et al. [53] proposed an unsupervised multi-layered graph-based system to summarize medical documents and named their system MultiGBS. The multiple layers of an undirected graph were found useful to cover multiple features. Employing the features, sentences were ranked using the MultiRank algorithm, a PageRank-like algorithm, to rank the sentences of a multi-layered graph. Evaluation of ROUGE and BERTScore gave better F-measure scores. The MultiGBS needs to be evaluated on benchmarked datasets to better assess the results claimed for medical documents.
A technique of interaction networking for extractive and abstractive summarization was adopted by Jin et al. [54] by treating documents, sentences, and words at different levels in a hierarchical relation graph. The system was tested on the Multi-News dataset and showed promising results.
Similarly, Lierde and Chow [55] presented a query-focused ATS system based on hypergraphs, where sentences were mentioned as graph nodes and hyperedges combined the nodes of similar topics. Li et al. [56] argued that summarization systems either fail to contain the sentiments in the summary, or give wrong sentiments from the original document sets altogether. They used graph theory for summarization as well as to maintain the sentiment vector for sentences to keep the sentiments of the documents in the summary intact.
The main motivation for developing Grapharizer was to overcome the limitations of existing ATS systems. On the other hand, Grapharizer exploits the desired features of existing ATS methods. Grapharizer combines grammar-focused pre-processing with the latent Dirichlet allocation (LDA) algorithm of topic modeling, and uses graph-based methodology with the support vector machine (SVM), multivariate linear regression (MLR), and artificial neural network (ANN) techniques of machine learning in the following way:
  • Proposing a supervised and domain-independent framework that does not require data to be present in annotated form.
  • Developing a dataset named Recent News Articles, to further test the proposed technique for measuring performance.
  • Using the LDA topic modeling technique to create a summary that includes all the topics in the input document.
  • Increasing the informativity and representativeness of all topics, while mitigating redundancy in the resultant summary.
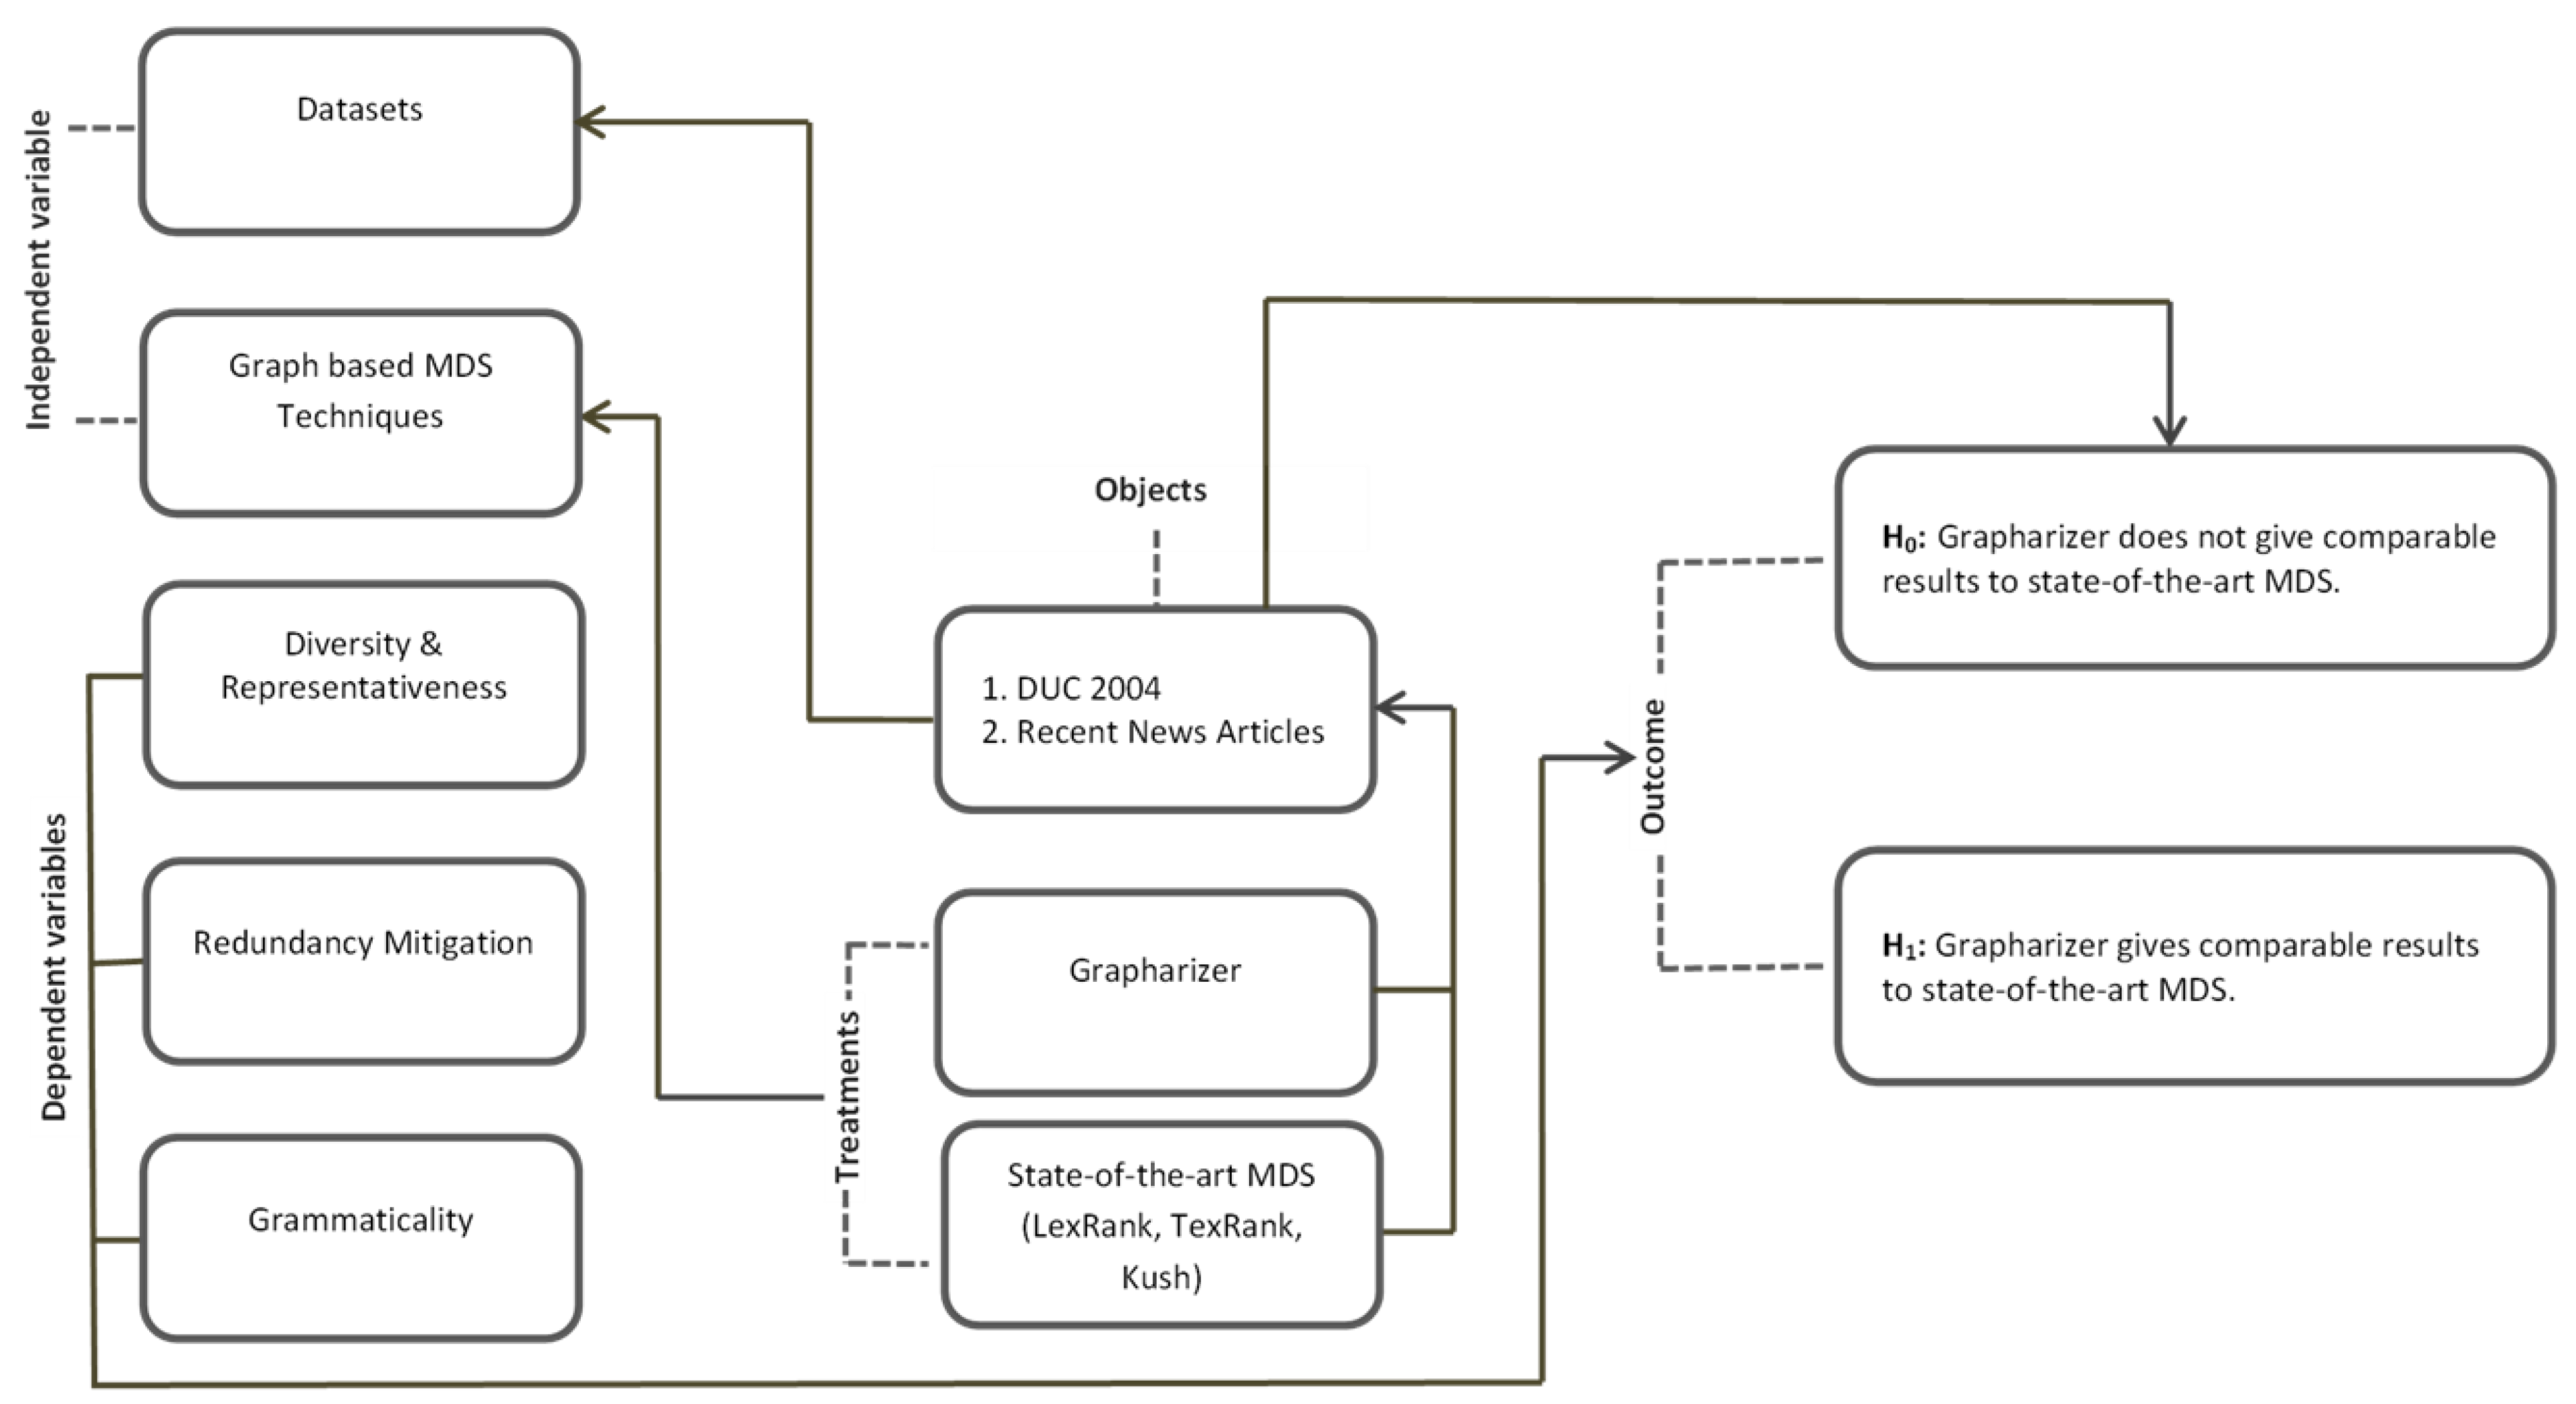
  • Using lemmatization, MWE mapping, synonym mapping with novel cross-function, anaphora and cataphora of the pronoun replacement in pre-processing, and reverse-mwe function in post-processing, aiming to increase the grammatical quality of the resultant summary. Figure 2 represents the experiment design of Grapharizer with the description of dependent and independent variables, object, subject, treatments, and the outcome.
In this experiment, there were two independent variables: Graph-based MDS techniques and datasets. For each independent variable, there were two treatments. The Graph-based techniques consisted of two types: Grapharizer and state-of-the-art MDS (LexRank, TexRank, Kush). The datasets used in the experiment were DUC 2004 and Recent News Articles. The dependent variables measured were diversity and representativeness, redundancy mitigation, and grammaticality, as shown in Figure 2. To ensure consistency, the effect of the dataset was blocked, and the same datasets were used for both treatments of the Graph-based MDS techniques in each trial of the experiment.

3. The Proposed Technique

This section contains an introduction to the graph-based technique that we have proposed for extractive multi-document summarization named Grapharizer. After discussing the motivation behind our proposed technique, we detail the graph creation process of our technique, how it is designed to handle the problem of redundancy, and how it is designed not to miss any important topic in the given set of documents while preparing the summary. The architecture of Grapharizer is represented in Figure 3.

3.1. Motivation

Graph theory is an important framework for solving optimization problems in every important field of science, technology, engineering, and mathematics, or STEM in short. It has been extensively used to solve different problems, such as finding the shortest path, determining the connectivity among different networks, such as computer networks, social networks, academic link networks, and connectivity networks, and detecting malicious activities from inside networks to avoid cyber-crimes.
Graph theory has been extensively utilized in the field of ATS for the last 25 years. However, it has a few limitations. For example, the edges between two busy vertices can be considered similar [57], which might be quite different in reality. It can possibly miss important content from documents, while stressing the same point redundantly in the summary.
The use of graph theory for ATS will make it easy to produce a concise version of the available text that will help every reader who is looking online for the gist of the available body of text.

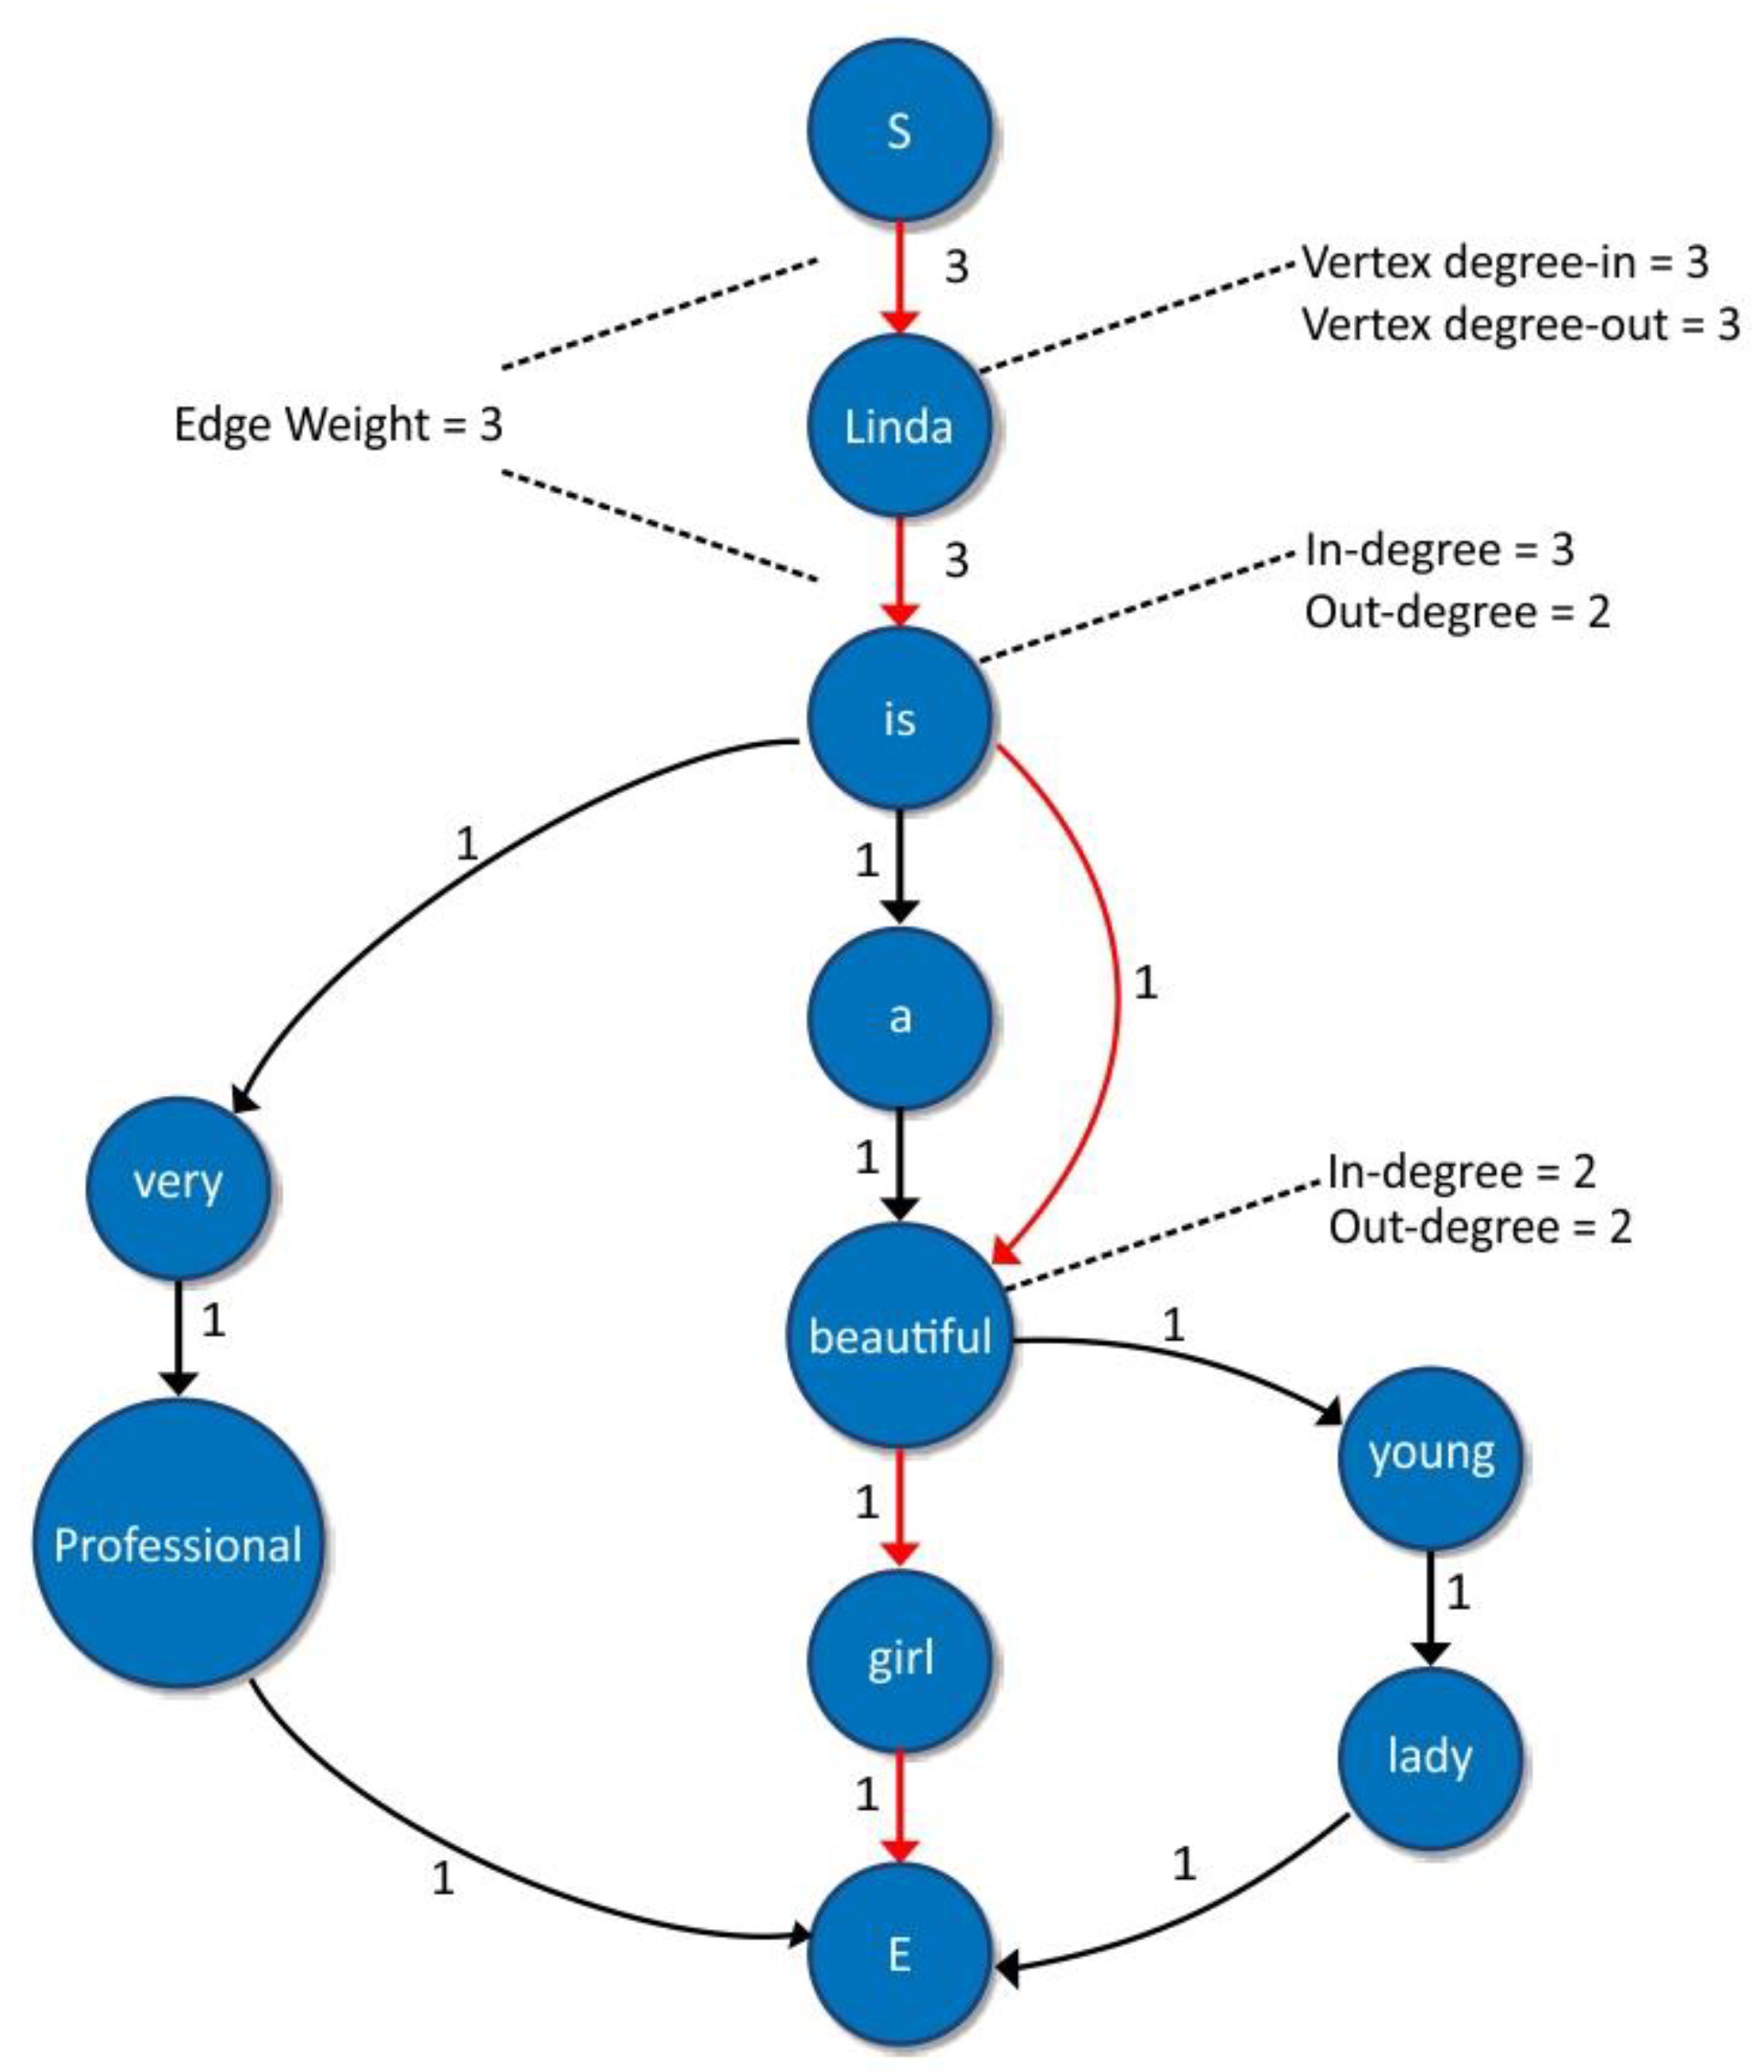
3.2. Grapharizer: The Graph-Based Method

As discussed in Section 3.1, graph theory is important in ATS to produce optimized summaries. The critical problem in extractive multi-document summarization is to identify important sentences from the input text. It is also important to note that multiple documents might contain different topics, with some of the topics being frequently discussed while other topics are discussed less frequently. It is nevertheless important to cover all the aspects present in the documents to prepare a generic summary and to obtain the gist of the documents appropriately. The graph-based methods used in MDS generate the graph based on the input document (we discuss this in Section 3.2.2) and identify the shortest path in the graph to generate the summary. This short path might cover only some of the topics, and not all the important ones, resulting in a less representative summary. We have handled this problem by incorporating topic modeling before generating the graph.
Similarly, in extractive MDS, the grammaticality of the summary can suffer. The main areas of concern are pronouns, or anaphora and cataphora. The sentences containing noun mentions might not be selected in the summary, but pronoun mentions might get a place there. This can cause serious confusion to the reader of the summary. Similarly, since the input data is always unstructured text, it might contain phrases such as idioms to explain a situation poetically. Such MWE can cause concerns about the length of the summary. The summary length determines how much information from the original text is included in the summary. If the summary length is too short, important details and nuances may be left out, resulting in an incomplete or inaccurate summary. On the other hand, if the summary length is too long, the summary may become too verbose and lose its conciseness and clarity, defeating the purpose of summarizing. The ideal summary length will depend on various factors, such as the length and complexity of the original text, the purpose of the summary, and the intended audience. Therefore, it is important to consider the summary length as a critical parameter in generating effective and informative summaries. We have kept the summaries within a 200–250 word limit in this experiment.
Furthermore, in the word graph-based methods (explained in Section 3.2.2), there is the possibility of picking a few vertices from the MWE and dropping the rest, which results in a meaningless summary. Therefore, we have handled this problem by replacing MWE with their single-word synonyms. We have also implemented machine learning techniques for the classification of summary candidates using SVM, MLR, and ANN.

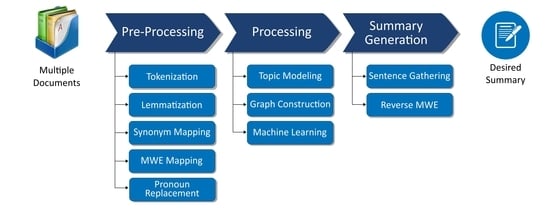
3.2.1. Pre-Processing

Since natural language processing (NLP) projects deal with unstructured data, it is unavoidable to use a pre-processing step. It prepares data for the algorithm to facilitate summary generation. The better the pre-processing is, the more accurate will be the results generated by the algorithm.
We have applied several steps in the pre-processing phase to convert the input data so that they work well with the Grapharizer.
The steps performed in pre-processing to cleanse the input text for our summarizer are stated below:
  • Tokenization: In tokenization, each sentence from the input documents is broken down into the smallest units, called tokens. This is helpful to recognize the words for the later functionalities in the subsequent pre-processing steps and graph generation module. A few tokens from the input text are <Cambodian>, <leader>, <of>, <opposition>, etc.
  • Lemmatization: In this step, the given words/tokens are reduced to their root words, called lemmas. While this appears similar to stemming, which simply chops off the words from the tail, in lemmatization the words are reduced to the root word with proper meaning using a dictionary. The reduced words in lemmatization are grammatically meaningful. Since grammatically correct summaries are one of our aims, lemmatization is relevant to our goals for the summarizer. For instance, we achieved the lemma “share” for “sharing”, instead of the stem word “shar”. Secondly, lemmatization is also better than stemming as it helps to avoid the extra post-processing step of reverse-stemming that entails re-use of the route words that were chopped during stemming.
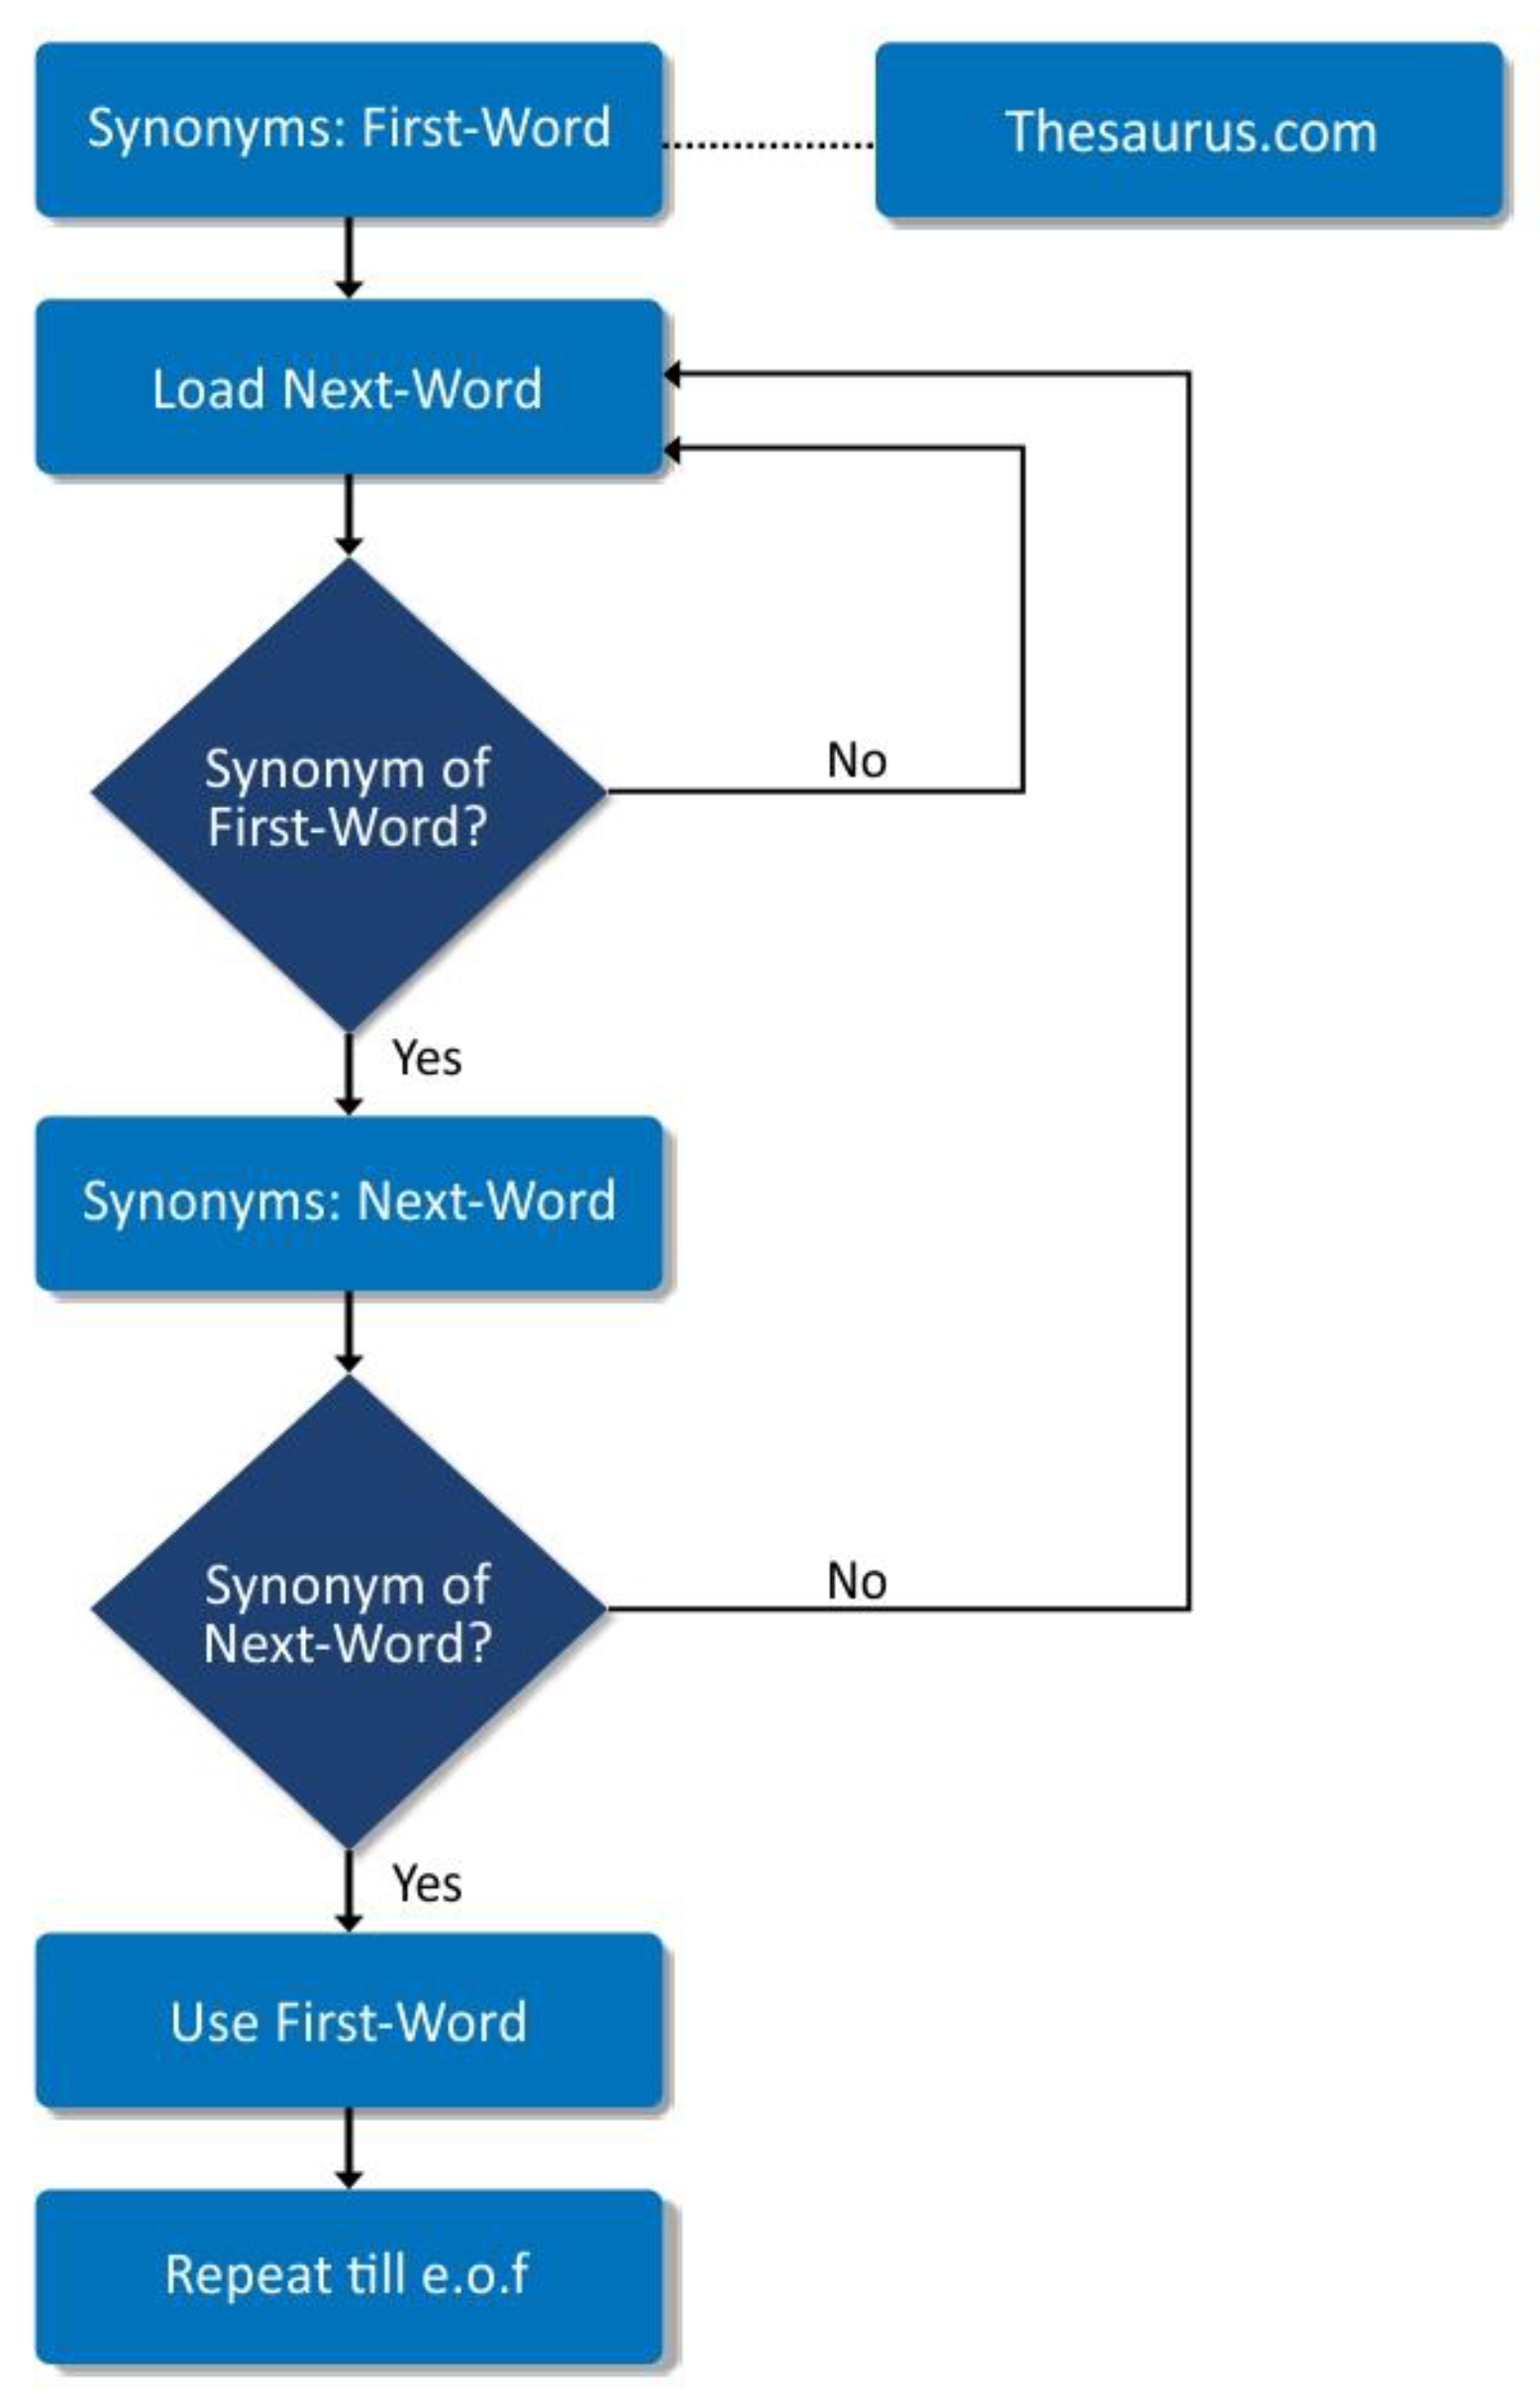
  • Synonym Mapping: Since the Grapharizer is based on the word graph technique, the graph it constructs based on multiple documents is going to be too dense. It is important to replace the synonyms to keep the graph simple. Therefore, synonym mapping is the most important step in pre-processing in our system. It keeps the constructed graph under control in terms of the number of vertices by avoiding the creation of unnecessary vertices. We have used Thesaurus.com for synonym mapping through API calls. Thesaurus.com offers several synonyms for a particular word. We have devised a function named cross() to pick the best matching synonyms. For example, we have the word “government” in the document, and then comes another word “regime”. As shown in Figure 4, we must check whether “regime” or its synonyms already exist in the document or not. We check the synonyms of “government”. If “regime” exists in the synonyms of “government” given by Thesaurus.com, we check conversely too by checking the synonyms of “regime”. Thesaurus.com will give a list of synonyms of “regime” as well. Now, if “government” is also a synonym for “regime”, then the condition of the cross() is satisfied, and “regime” can be replaced with “government”. It is worth mentioning that through the cross(), we have managed to obtain the semantic meanings of the synonyms as well. For example, “sentence” is taken as “penalty” instead of “set of words”. The expert evaluation of synonym quality is presented in Section 4.4.
  • Multi-Word Expressions: As discussed in Section 3.2, the MWE are likely to appear since the input documents are unstructured files; therefore, we have given special care to map the MWE with their single-word substitutes. This will make the graph simpler, clearer, and more manageable. We gathered the MWE from the dataset and placed their single-worded synonyms in a spreadsheet so that the word graph processing becomes easier. These MWE contain phrasal verbs (e.g., look out, look after), proper nouns (e.g., New York, Christiano Ronaldo), compound nominals (e.g., credit card), and idioms (e.g., once in a blue moon) [49]. Once the candidate sentences for the summary are selected, we apply a function reverse-mwe() that we have devised to reverse the single-worded synonyms replaced earlier back to their corresponding MWE. This will generate closer results to the gold standard summaries of the benchmark datasets, such as the DUC 2004 and Recent News Articles datasets in our case.
  • Pronoun Replacement: In this step, the pronouns are replaced with their corresponding nouns. As stated earlier, in a document, some sentences mention nouns about certain events, and later, they can be referred to by pronouns. This situation is also known as anaphoricity. Sometimes, it also happens that the pronouns are mentioned earlier, and the nouns follow them later in the text. This situation is known as cataphoricity. It is possible that the sentences with a noun mention are not extracted, while the sentences with pronouns are selected. This can cause serious confusion in the summary with respect to what these pronouns are referring to. To solve this problem, we have used pronoun replacement. This phase is mainly inspired by Durrett et al. 2016 [9]. It is important to note that assigning the probabilities for pronoun replacements is adapted from Durrett et al. [9]. The logic and implementation of anaphora and cataphora detection and replacement with appropriate nouns are our own contributions. Algorithm 1 explains this work in detail. The ablation study is reported in Section 4.5 to showcase the effectiveness of the proposed pre/post-processing steps in addition to the Grapharizer.
Algorithm 1 Pronoun Replacement
  • Grapharizer_Pronoun_Replacement (string)
  • Begin:
  • While (DUC_2004/Recent_News_Articles=!End of File())
  • {Sentence = Load Sentences()
  • Fetch line by line sentences of Duc_2004/Recent_News_Articles;
  • If (Find-Pronoun (Sentence()) then
  • If (Posterior-Probability > α)
  • max(p1,p2,…,pn) > α where α > 0.5)
  • (pronoun found before the noun = Anaphora) OR (pronoun found after the noun = Cataphora) then
  • Replace-Pronoun (Noun) Else
  • Antecedent-Sentence();
  • Include Antecedent Sentence in Summary(); }
  • End While
  • End

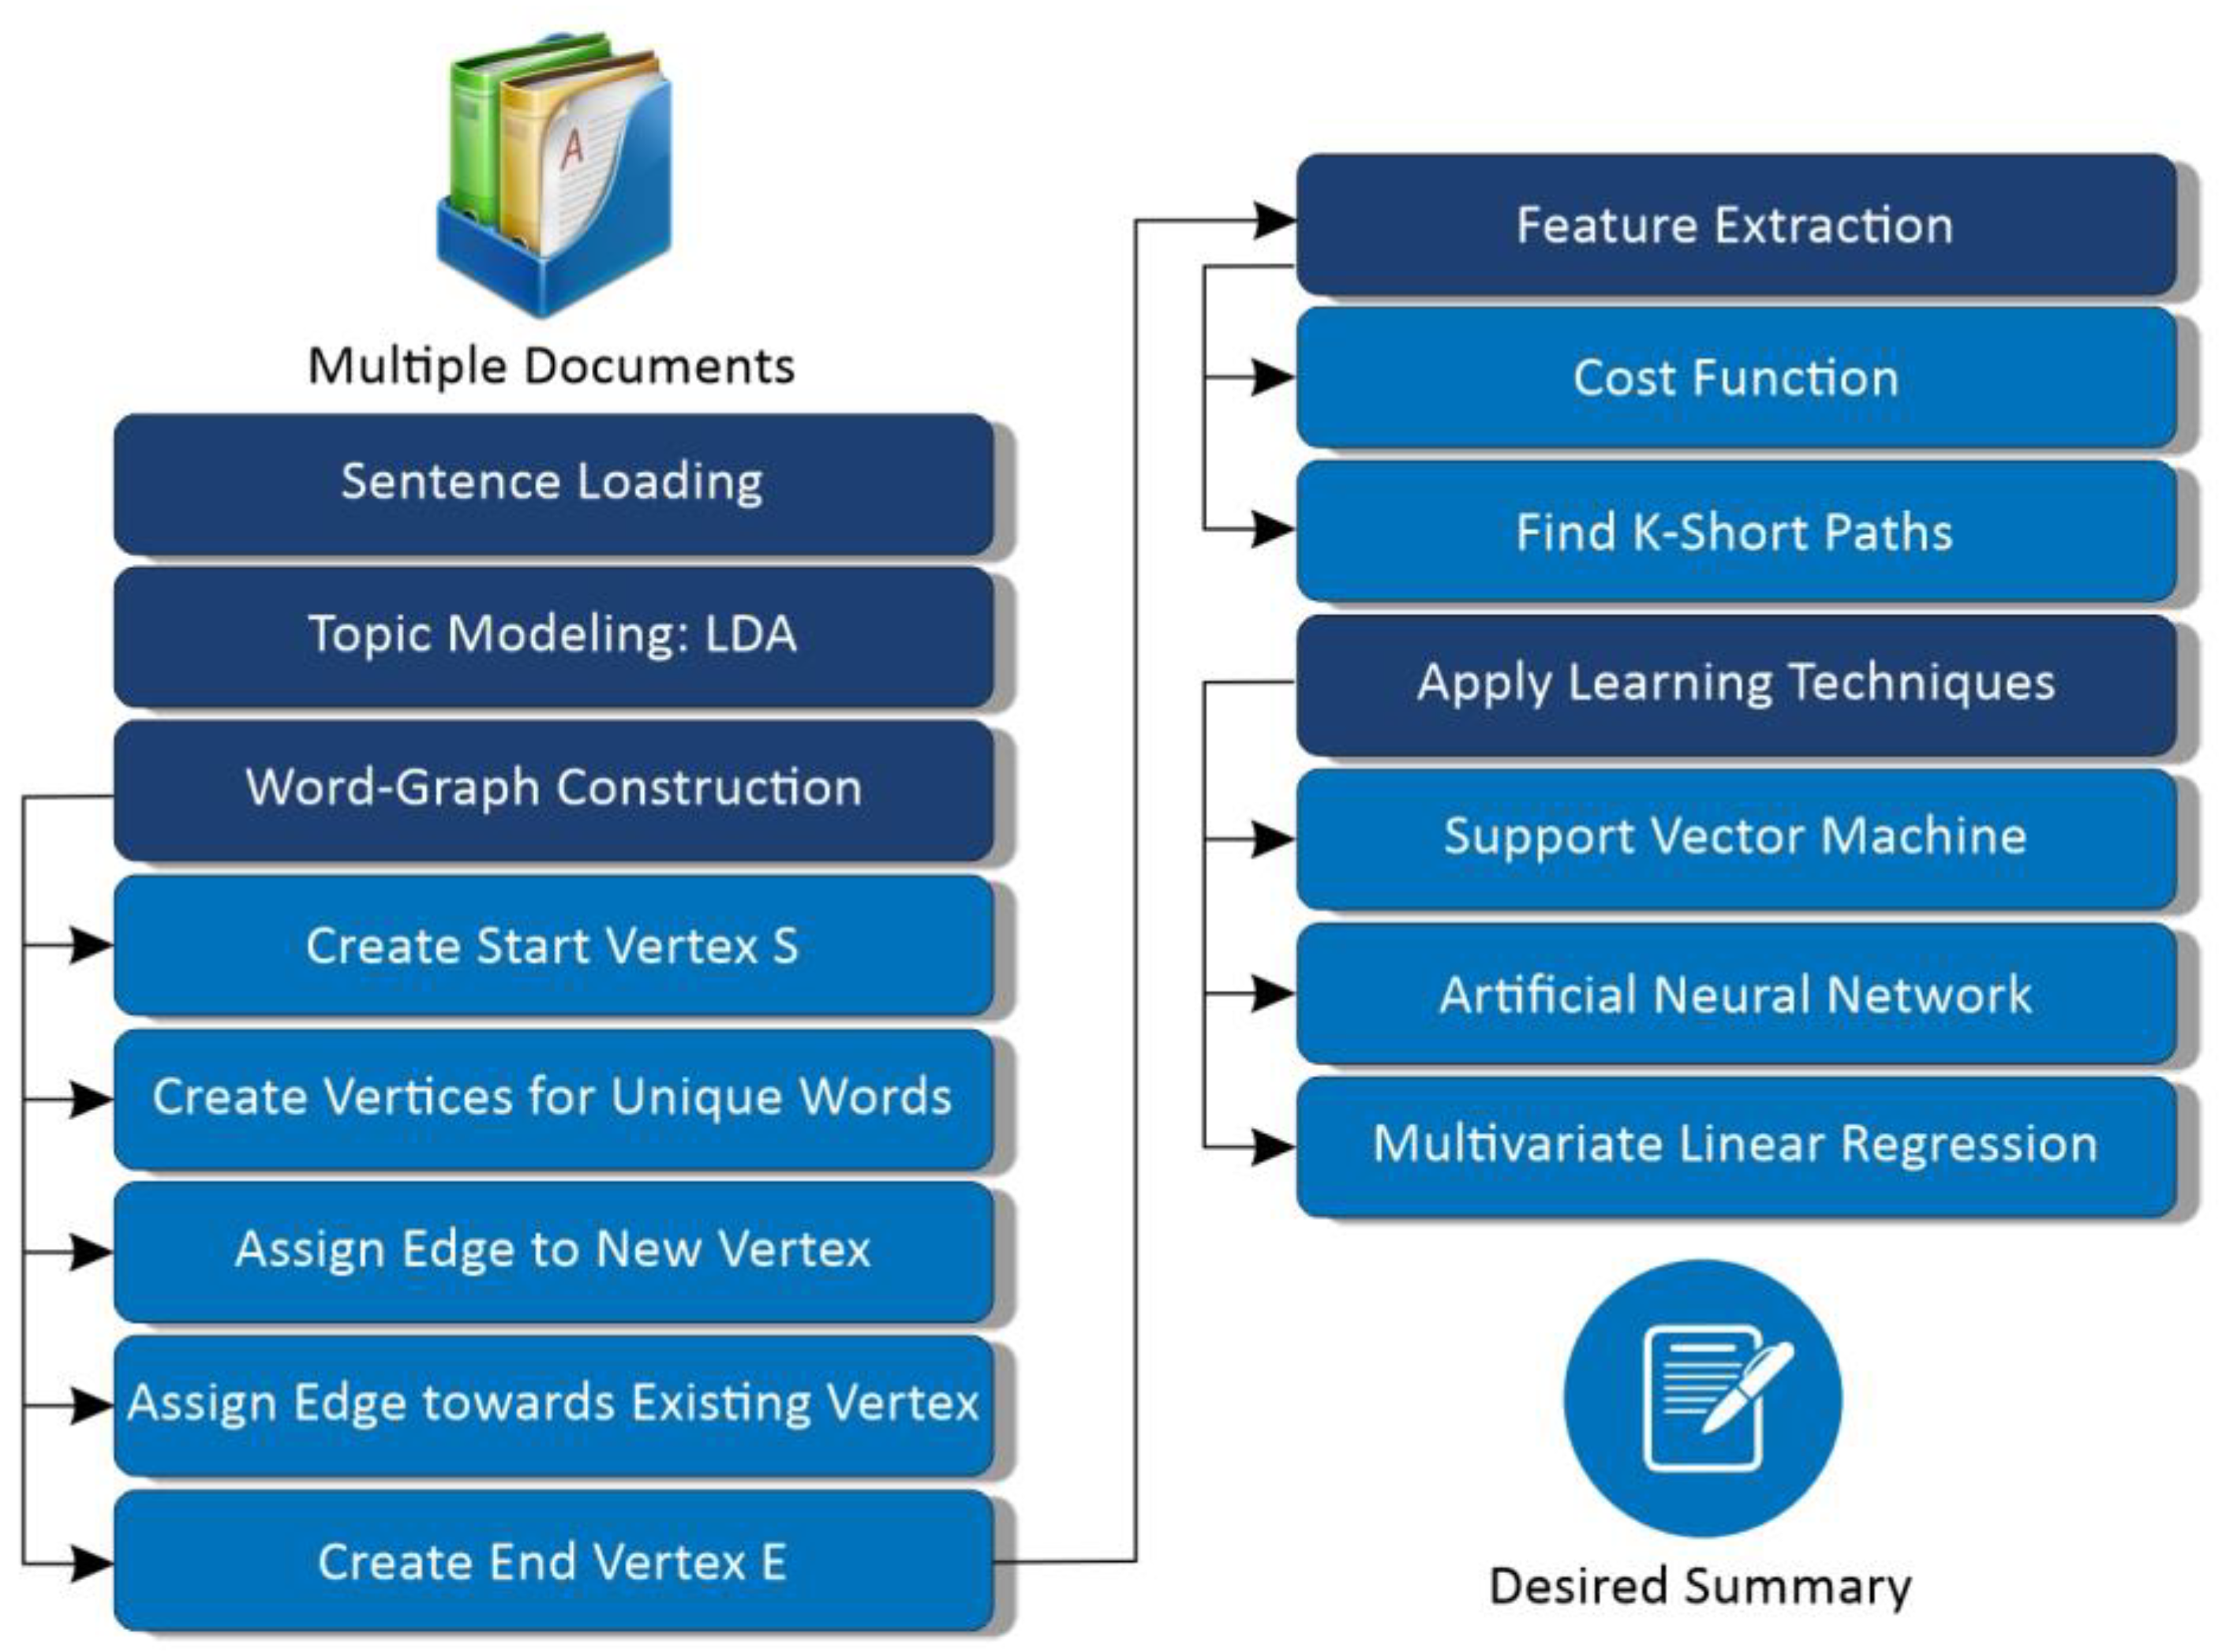
3.2.2. Overview of the Graph Generation Process

We implemented the word graph in Python to generate the short paths in multiple documents [40,58]. The process to construct a graph begins after the pre-processing phase. We added a token S at the beginning of every sentence, and a token E at the end of each sentence in the dataset. During the graph construction, the first token to be placed in the graph will be S since it begins the first sentence of every topic, such as the rest of the sentences in the dataset. It then starts reading the sentences in sequence. Each word makes a vertex in the graph. If a sentence contains a word that is already used in some previous sentences, then that word will already be placed as a vertex in the graph. Therefore, there is no need to duplicate that vertex. An edge will be directed towards that vertex in the graph. In a directed graph, edges point in one direction from one vertex to the next, and the vertices have two degrees: in-degree (number of incoming edges) and out-degree (number of departing edges). In this case, the weight of that particular edge will be incremented. The first vertex of the graph is vertex S or vs, the start vertex of the graph. The second word of the first sentence of the first document will be placed as a graph vertex. There will be a directed edge from the vs to the vertex of the second word of each sentence. Then, for the third word, an edge will be directed from the second word towards the third word, and so on. In this way, all the sentences are plotted in the graph, word-by-word. This process continues until the last word in the last sentence of the last document is plotted as a graph vertex. It is important to note that every sentence in the document ends at the E, so the end vertex of the graph is ve. The in- and out-degree of each vertex are calculated. This work is explained with an exemplary graph in Figure 5.
Once the graph is constructed, now the aim is to find the shortest path in that graph. It is important to mention that we employed the same feature set and cost function as that of Tzouridis et al. [40]. To find the shortest path, we used Dijkstra’s algorithm. It finds the shortest path between vertices S and E. If the path traverses a lesser number of vertices between vs and ve, it will constitute a shorter path.
To find k-short paths in the graph, we employed Yen’s algorithm.
G = (V; E; cost) is a directed weighted graph, where V denotes the set of vertices and E denotes the set of edges between (v and v′) є V. Every edge E is given a positive weight according to the cost function. A path (p) connecting two vertices in G is made up of a series of edges. The set of all possible paths beginning from the start vertex vs and ending in the end vertex ve is denoted. The total weight of a path’s edges determines the cost of the path. The shortest path from vs є V to ve є V is defined as the path in G with the lowest cost. The cost is defined by Equation (1).
c o s t v , v = i λ i ϕ i v , v = λ ϕ v , v
We optimized the summaries by incorporating a few constraints alongside the cost function calculated on the feature set. For example, if there are no vertices between the S and E vertices, such short paths, also known as empty paths, will be discarded to qualify as summaries. Similarly, if a sentence does not contain a noun, predicate, and verb, then it is not a candidate sentence for a summary. We also set a certain arbitrary limit to the size of the summary, i.e., it should not be less than 15% of the input text. Too much compression can also result in a loss of meaning to the summary. Algorithm 2 explains the working of Grapharizer for better understanding.
Algorithm 2 Grapharizer
  • Grapharizer_Summarizer (input: pre-processed_dataset,Return:short_paths)
  • Begin:
  • While (DUC_2004=!End of File ())
  • {Sentence = Load (DUC_2004);
  • Begin pre-processing
  • Tokenize (Sentence)
  • Tokenize words from sentence
  • Repeat until EOF
  • Lemmatize (Tokens)
  • Simplify the tokens to meaningful lemmas
  • Replace Synonyms (lemma) using thesaurus.com
  • Cross-function (lemma)
  • Replace-Pronouns( nouns)
  • Replace MWEs (CSV lookup file for replacement)
  • End pre-processing
  • Extract Topics LDA (with n = 10 for parametric topic modelling with less repetition)
  • Cluster of similar sentences
  • For each topic
  • Construct WordGraph
  • Find ShortPath(calculate path p from vs to ve, return p)
  • Combine all short paths
  • Reverse-mwe()
  • Evaluate summary with ROUGE 2.0 }
  • End While
  • End

3.2.3. Representativeness

It has been observed that the datasets contain plenty of unstructured information about different topics. The frequency of some topics appears to be higher than others. As mentioned earlier, a fully representative summary should have complete coverage of all the topics in documents, as this is the basic idea of generic summarization. It is equally important not to miss any topic from appearing in the summary. Therefore, we handled this issue by employing topic modeling. We applied LDA [59], hierarchical Dirichlet process (HDP) [60], and latent semantic indexing (LSI) [61] to see the effect of the topic modeling on the results of the summarization process. LDA improved the results the most, so we have used it in our model. The generative probabilistic model LDA identified the latent topics that are present in the dataset, with effectiveness, simplicity, and overall strong performance, as reported in [62,63]. LDA provides significantly better topic classification than LSI for a large corpus, including news data, such as DUC 2004, which contains a variety of writing styles, synonyms, polysemic words, and orthogonal topics [64].
The tokens in the dataset are classified into a list of abstract topics by the LDA model. Sentence tokens are classified by the trained LDA model according to their most distinctive topic. Each document in the dataset is organized into topic-level clusters based on the topic-based distribution of sentences. Initially, a probability distribution of topics in documents, θd, is randomly sampled from a Dirichlet with parameter α. Later, for each word wdi, a topic zdi is chosen from this topic distribution. Finally, the word wdi is generated by randomly sampling from a probability distribution of words in topics Φzdi from a Dirichlet with parameter β. Therefore, the generating probability of a word w from documents D is given as
p w | d , θ , Φ = z = 1 T p w z , Φ z p ( z | d , θ d
Topic modeling with graphs works in this way: Different topics in the input document are identified with the help of the LDA algorithm. Then the sentences of the same topic are combined across the multiple files in the dataset. Then, for each topic, the graph is plotted, and the shortest paths are identified based on the mechanism discussed in Section 3.2.2. Once the short paths are identified in all the graphs or topics in other words, then they are combined based on the criteria discussed earlier. The resultant summary does not miss any topic from the selected optimal topic by LDA from the given dataset; hence, a highly representative generic summary is obtained.

3.2.4. Removing the Redundancy

The repeated appearance of the same topic again and again in the summary results in poor quality of the summary. A user receives less information from the summary due to this redundancy problem. This is one of the major concerns of extractive MDS [6]. We have addressed this problem in our Grapharizer. We employ topic modeling to identify different topics and construct their graphs separately. The selected shortest paths from each topic will appear in the summary at the end. Therefore, the resultant summary will not be overloaded by the same set of sentences; rather, it will have a representation from each topic corresponding to its volume in the dataset. In this way, the redundancy problem is handled in Grapharizer.

3.2.5. Grammaticality

Abstractive summaries have an edge over extractive summaries in terms of grammar quality. Abstractive summaries do not suffer grammatically like extractive summaries. They are drafted by reading the input document(s) and then writing the summary. Short new sentences are produced keeping in mind the grammar rules in language generation. Extractive summarization, however, does not function in this manner. Since it picks the extract from the input document cluster, there can be a huge compromise to the grammar quality once the summary is generated. As discussed in Section 3.2.1, in the pronoun replacement subsection, if the sentences containing noun phrases are skipped to be candidates in the summary, and sentences containing pronouns are somehow selected in the summary, it will possibly be a confusing summary for the reader. Instead of helping the user, such summarization systems lead to confusion. Therefore, we have taken special care of the grammar quality of the summary. The grammar of candidate sentences will be corrected before drafting the summary. Synonyms and MWE are mapped, and anaphora and cataphora constraints are resolved before the application of Grapharizer, resulting in grammatically correct summaries. To retain the poetic touch in the summary, all the MWE that were replaced previously will be re-applied before presenting the summary to the user. Similarly, we have preferred lemmatization over stemming to trim the words with proper meaning, not just chopping them off from the end.

3.3. Machine Learning

Sentence extraction is important in extractive MDS. By controlling the sentence features, we can determine the salience scores. However, when we have more input sentences, then it becomes hard to focus on dealing with sentence features individually. This is when we need machine learning in ATS. With a vast feature set, most of the machine learning methods over-train the training data [65]. SVM is a supervised learning approach for dividing data into dimensional hyperplanes based on binary class [66]. The important vs. non-important sentences correspond to the positive and negative examples. The margin is the distance between positive and negative examples. SVM attempts to achieve the maximum margin between classes to discriminate between negative and positive examples [67]. Therefore, it aims to determine the optimal hyperplane [65]. As we know, linearly separating the data is not always easy; therefore, misclassification can occur. Slack variables are used to correct the errors.
m i n λ , ε 0 λ 2 + C i = 0 m ε i s . t . i є P \ p i : f f p i > Δ p i , ε i
where C is the hyper-parameter for the tradeoff between maximizing the margin and minimizing the error. We perform model selection for adjusting the trade-off parameter of the support vector machine on the interval C for [2−10, 212]. We have adapted the work of Tzouridis et al. [40] for the implementation of SVM.
Likewise, ANNs are self-learning systems made up of interconnected neurons and nodes with inputs and outputs. They are utilized to find or detect solutions or features that would be difficult to find using traditional programming [66]. The feed-forward neural network is designed following the mechanism of Sinha et al. [68], where the sentences are fed to the input layer, given to the hidden layer for processing, and output is given to the output layer. For errors in classification, the output is sent back to the input layer for correction.
For documents D with sentences, the scoring of sentences in D is performed with the predicting label wL є {0,1} for inclusion or not in the summary. With the objective to maximize the probability of paths in the graph, the labels {wL1, wL2, …wLn} for n become the last candidate sentence for summary, given the input document and model parameter θ
log p ( w L | D ; θ ) = log p ( w L i | D ; θ )
The top sentences are chosen and included in the summary according to the summary length limits.
This study also compared the effectiveness of ANN with SVM for text summarization. Both SVM and ANN are efficient methods when working with huge datasets and have the capacity to uncover non-linear data [67].
Another popular machine learning algorithm is multivariate linear regression. When there is more than one independent variable, and standard linear regression does not work, multivariate regression is used. Multiple variables or features are present in real-world data; therefore, multivariate regression is required for better analysis. Multivariate regression is a supervised machine learning approach that analyses numerous data variables with one dependent variable and several independent variables. We try to anticipate the outcome based on the number of independent variables. The most useful aspect of multivariate regression is that it aids in the understanding of relationships among variables in a dataset [66]. This makes it easier to comprehend the relationship between dependent and independent variables.
As mentioned in Tzouridis et al. [40], we have also adapted the features of normalized joint frequency, maximal word frequency, lexical relevance, normalized pointwise mutual information, and average phrase location in the input dataset. The features are based on the assignment as v, v′, which are two vertices having an edge associating features with itself. Then w = #(v) frequency of word v; w′= #(v′) frequency of word v′; e= #(v,v′) frequency of edge between v and v’; and n#= number of vertices in graph. The features are:
Joint   frequency :   ϕ 1 w , w = e n
representing the frequency of edge divided by no. of vertices in graph.
Maximal   word   frequency :   ϕ 2 w , w = m a x { w n , w n }
estimating the maximum of the frequencies among the given words with respect to the total number of words
Lexical   relevance :   ϕ 3 w , w = 2 n w . w w + w
Normalized   PMI :   ϕ 4 w , w = ( log e w . w ) / ( log e n )
Average location of the group of words in the input text is calculated as:
ϕ 5 w , w = 1.0 : 0 10 % 0.4 : 10 30 % 0.8 : 30 60 % 0.6 : 60 80 % 1.0 : 80 100 %
The values of ϕi falls between 0 and 1 for the value of i varies between 1–5.

4. Experiment and Evaluation

4.1. Dataset

The National Institute of Standards and Technology (NIST) runs a series of conferences every year to evaluate summarization systems’ performance. These conferences are conducted under the title of Document Understanding Conferences (DUCs). A DUC is the platform that encourages and supports researchers in their scientific investigations and progress. DUCs have occasionally released standardized datasets for document summarization, so that researchers can be provided with similar input document(s) to compare the progress of their summarization system with that of others. These datasets contain reference summaries that are written by human evaluators. Reference summaries are also termed gold-standard summaries by some researchers. Four reference summaries from task 1 are presented in Figure 6. ROUGE evaluation is applied to evaluate the system-generated summary against the reference summary. DUC 2001, DUC 2002, DUC 2004, DUC 2005, and DUC 2007 are the different versions of the datasets released in the years referred to. Some datasets contain reference summaries that are made generically, while some are query focused.
DUC 2004 contains fifty folders; each folder contains ten documents about different aspects of the same related news item. Each file related to the same news article is compiled from the different news sources reporting the same incident; therefore, each file contains a mixture of different topics related to the same news. Each folder of the fifty is equipped with four reference summaries so that, when a summarization system produces a summary, it can be evaluated against it to gauge the accuracy and precision of the system. As we have mentioned in our study, Jalil et al. [6], DUC is used for a majority of the experiments in extractive MDS; therefore, we have chosen it for testing the performance of our technique.
Similarly, we have created another dataset with similar features to DUC 2004 and named it the Recent News Articles dataset. This dataset contains ten files regarding the same news event (flood in Pakistan 2022, divorce news of Johny Depp and Amber Heard, death of Queen Elizabeth II, etc.). Like DUC 2004, we have provided four reference summaries to compare the system summaries for performance evaluation. In this regard, we have used ChatGPT to prepare the reference summaries. The summary length was kept under the word limit of 200 words in order to maintain consistency between the system and reference summaries.
It is worth mentioning that, except for DUC 2005 and DUC 2007, the other variants are generic in nature concerning the provided reference summaries.
We tested our Grapharizer on the DUC 2004 and Recent News Articles datasets, and for evaluation, we used the ROUGE 2.0 scores. The major characteristics of the datasets are shown in Table 1.
Apart from DUC, there are other benchmarked datasets as well. The New York Times annotated dataset, TAC, SemEval, and MiltiLing are a few examples.

4.2. Evaluation Metric

DUC has included ROUGE as its most valued evaluation metric to gauge the quality of the system-generated summary against the reference summaries as well as the machine translations. It counts the number of similar units between the system summary and the reference summary. It employs recall, precision, and the F-measure in the context of ROUGE. Considering N as the length of N-Gram, Countmatch (N-Gram) refers to overlapping words between the system summary and the reference summary, and Count(N-Gram) represents the words in the reference summary. The ROUGE-N can be computed by the following formula:
ROUGE - N = S R e f e r e n c e S u m m a r y N g r a m S C o u n t m a t c h ( N G r a m ) S R e f e r e n c e S u m m a r y N g r a m S C o u n t ( N G r a m )
In our experiments, we have used all the metrics provided in ROUGE 2.0 by Kavita Ganesan, but, to ensure simplicity of the results, we refer only to ROUGE 1, ROUGE 2, ROUGE L, ROUGE W, and ROUGE SU*. The average of the reference summaries is selected to evaluate the summary by Grapharizer and its ML-based variants.
The formula for recall, precision and the F-score of ROUGE L is calculated for the longest common subsequence by the following formulas:
Recall lcs = L C S ( x , y ) m
Precision lcs = L C S ( x , y ) n
F - score lcs = ( 1 + β 2 ) R e c a l l l c s P r e s i s i o n l c s R e c a l l l c s + β 2 P r e c i s i o n l c s
where x is the reference summary of length m, and y is the candidate summary generated by the summarizer system of length n.
Manual evaluation of summary: We have evaluated the summary generated by Grapharizer and hired twenty-five evaluators to assess the summary after reading the relevant news article provided in the dataset. A questionnaire was provided regarding the summary quality. The evaluators marked their answers on the provided Likert scale. The responses were then compiled with an 84% score given by the evaluators for the informativity and representativeness of the summary. Pronoun replacement was approved with a score of 76% by the human evaluators. A score of 88% was given for minimizing redundancy in the summary. However, when the evaluators were asked to compare the summary with some human-generated summaries, they rated the Grapharizer summary at 55% in that case.

4.3. Baselines

We evaluated Grapharizer, ANNGrapharizer, and SVMGrapharizer with SOTA graph-based methods for comparison. The methods chosen were TextRank [69], LexRank [34], and Kush [7]. These are the methods evaluated using the MDS dataset DUC 2004. As mentioned earlier, big data applications use extremely large and complex datasets that require advanced tools and techniques to process and analyze and have the potential to reveal valuable insights and patterns for businesses and organizations [70]. The baseline methods are discussed in the following section.
TextRank: Mihalcea and Tarau [69] created TextRank, an iterative, extractive, and unsupervised tool that scores units based on the relevance of text units by translating the connected structure of a text to graphs. The TextRank method, which is an iterative research method based on Google’s PageRank, has no predefined and manually configured structure, which is a key characteristic.
LexRank: To calculate the importance of textual units in NLP, Erkan and Radev [34] introduced a stochastic and graph-based technique called LexRank. They used the eigenvector centrality (node centrality-based) measure to calculate the importance of sentences on the representative graph. In their experiments, the authors found that LexRank outperformed both degree-based and centroid-based algorithms in many cases.
Kush: According to the assumption by Uçkan and Karcı [7], the summary should exclude the set of sentences matching the nodes in the independent set. The nodes composing the independent set on the graphs were identified and eliminated based on this prediction. As a result, a restriction was placed on the documents to be summarized before quantifying the effect of the nodes on the global graph. This limitation made it impossible to include word groups in the summary that were repeated.

4.4. Synonym Mapping: Expert Evaluation

We compiled a file of some random twenty words, and their synonyms assigned from Thesaurus.com, using our implemented function named cross(). We evaluated the accuracy through expert evaluation. Three experts were requested to validate the accuracy of synonyms assigned by cross(). Thesaurus.com color codes the synonyms in three levels. The most relevant synonyms of words are represented in red color on the website, those slightly farther in meaning are coded in orange color, and remotely synonymous words are shown in yellow color. Keeping this in focus, the words and synonyms were provided to the experts to rate on a Likert scale, from 1 indicating no synonymy to 10 indicating high synonymy between the two words. The score given by expert 1 for the accuracy of synonyms was 92%, and that by expert 2 was 89%. Expert 3 scored the provided words and their synonyms as being 84% accurate. On average, 88% accuracy was obtained for the synonyms by our cross() function. With this score, we applied the function on DUC 2004 and Recent News Articles for our Grapharizer.

4.5. Ablation Study

We performed an ablation study to verify the effect of the different parts of pre-processing on the overall performance. Five stages of ablation were compared with our results. First, we removed the pre-processing completely. The results significantly declined, as indicated in Table 2. Then we added a pronoun replacement module to our Grapharizer, which enhanced the results by a margin of 15%, as shown in Table 2. After that, in the third stage, we included only the synonym mapping module. An improvement of 20% was reported in Rouge 1. In the fourth stage, we applied MWE (without reverse-mwe() of post-processing) and nearly a 15% gain was reported in the results of Rouge 1. Finally, we tested MWE with reverse-mwe() in the post-processing phase. The improvement was 40% in Rouge score. When entire pre-processing was applied and the results were compared for stage 1 of ablation, i.e., no pre-processing, then the results indicated a 70% improvement in Rouge scores. Therefore, it can be safely concluded that the pre-processing and post-processing contributed positively to our technique, the Grapharizer.

4.6. Time and Space Complexity Analysis of Algorithms

The time and space complexity of the TextRank algorithm depends on several factors, including the size of the input document, the size of the graph constructed, and the complexity of the data structures used to represent the graph and other intermediate data. The time and space complexity of the TextRank algorithm is also O(n2), where n is the number of units of text (such as words or sentences) in the input document. This is because the algorithm constructs a complete graph with n nodes, which has n(n − 1)/2 edges. The co-occurrence frequency between each pair of units of text needs to be calculated to construct and store the graph, which takes O(n2) time and space complexity. The TextRank performs an iterative ranking process to assign a score to each unit of text based on its centrality in the graph. The number of iterations performed by the algorithm can affect the time complexity. Additionally, the algorithm requires space to store other intermediate data structures, such as the co-occurrence matrix used to construct the graph and the vector used to represent the ranking scores of each unit of text. The size of these data structures depends on the size of the input document and the complexity of the co-occurrence measure used to construct the graph.
The time and space complexity of the LexRank algorithm also depends on several factors, including the size of the input text document, the number of iterations performed by the algorithm, the complexity of the similarity measure used to construct the graph, the size of the graph constructed, and the complexity of the data structures used to represent the graph and other intermediate data, respectively. Additionally, the algorithm requires space to store other intermediate data structures, such as the similarity matrix used to construct the graph and the vector used to represent the ranking scores of each sentence. The size of these data structures depends on the size of the input document and the complexity of the similarity measure used to construct the graph. In general, the time and space complexity of the algorithm can be approximated as O(n2), where n is the number of sentences in the input document. This is because the algorithm constructs a complete graph with n nodes, which has n(n − 1)/2 edges. The similarity between each pair of sentences needs to be calculated to construct the graph, which takes O(n2) time. Similarly, storing the graph requires O(n2) space complexity, as each edge must be represented in memory. Additionally, the algorithm performs an iterative ranking process to assign a score to each sentence, which also takes O(n2) time in the worst case. Overall, the space complexity of the LexRank algorithm can be a significant factor for very large input documents, as it may require substantial memory to store the graph and other intermediate data structures.
For Grapharizer, the overall time and space complexity of the algorithm depends on the input text and the size of the CSV file for MWE mapping. However, the most time-consuming functions are likely to be MWEReplacement(), calculating Special_Words_Frequency(), and Synonyms_Replacement(), which all have a time complexity of at least O(n2) or O(n) in the best case. Overall, the space complexity of the Grapharizer is considered to be linear with respect to the size of the input text, with some constant overhead due to the use of external libraries and data structures.

5. Results and Discussion

The experimentation on Grapharizer, ANN, MLR, and SVM was implemented using the intel core i7 system, and the implementation was performed using Python. We tested Grapharizer and all its ML-based variants on all fifty folders, with ten text files each in the dataset. Out of the 50 folders, we used even-numbered folders for training the models and odd numbers of folders for testing. The performance remained almost identical for all the folders, which confirmed the scalable performance of our technique. We also repeated the same experiment of DUC 2004 (mentioned in Table 3) with another dataset, Recent News Articles, in order to verify the performance; Table 4 shows the results were quite comparable with the results mentioned in Table 3. Google Colab assisted in the quick and efficient execution of the algorithms that needed more time previously. For instance, the Grapharizer, ANNGrapharizer, SVMGrapharizer, and MLRGrapharizer algorithms were executed in less than 5 min each for a huge multi-document dataset of DUC 2004.
Many functions were created to enable the pre-processing and subsequent processing. The cross-function was devised specifically to return the most optimal synonyms for terms. Similarly, the library for MWE was designed for the DUC 2004 and Recent News Articles datasets to generate a convenient word graph. The use of MWE simplified the graph by up to 20%. Similarly, simplification was also noted using pronoun replacement, which was initially developed to attain clarity of summary sentences. Simplification of 4% was attained with pronoun replacement in graph generation. The combined simplification achieved by MWE and pronoun replacement was around 24%. The statistics are presented in the Appendix A. The MWE replaced in the graph generation process with their single-word equivalents may result in a poor ROUGE score when evaluated against the reference summaries; therefore, we developed another function named reverse-mwe() to replace the single-worded equivalents of MWE with the original MWE. It was also observed in the experiment that the pre-processing stage sometimes replaced words inadequately. For example, in some of the documents in DUC 2004, the article was discussing political instability in Cambodia, where one of the nouns was Sihanouk, the King of Cambodia at that time. The pre-processing module was trained to replace words such as king, monarch, his majesty, prince’s father, etc. with Sihanouk for the simplicity of subsequent graph construction. We observed erroneous replacement within the tokens, such as “making” and “working” by maSihanouk and worSihanouk, after the pre-processing step. We manually corrected such wrong replacement in the summary.
After the pre-processing stage, we applied the LDA algorithm of topic modeling to separate the sentences related to a different topic and combined them under the respective topics. We tested the results of topic modeling with five, ten, and fifteen topics separately, keeping the value of parameter N fixed to five, ten, and fifteen, respectively. The results with ten topics were more optimal, as there was less overlapping among the sentences of different topics. The similarity of words between different topics was tolerated up to 40%; above that threshold, we merged the two topics together as similar. Topic modeling resulted in the generation of graphs that were more focused on a specific topic. We have provided the link to topic-specific graphs in the Appendix A for interested readers.
After pre-processing and topic modeling, we applied the Grapharizer to the individual topics. Related sentences were plotted as a graph using the word graph technique adapted from Filippova [58] and Tzouridis et al. [40]. Once the graphs of each topic were generated, the shortest paths in the graphs were calculated using the Dijkstra algorithm. Care was taken in selecting the shortest paths as these paths were the sentences of the prospective summary. It was decided to keep the paths from every graph as summary sentences that included nouns, predicates, and verbs.
The comparative evaluation results are reported in Table 3, where the different SOTA summarizer values are taken from Uçkan et al. [7]; it is evident that there was an improvement in the ROUGE scores.
The Grapharizer was then implemented with SVM, MLR, and ANN to check for improvements in the ROUGE scores. Since the supervised learning algorithms employed reference summaries for the training, the results, specifically the recall values, indicated improvements. The significant scores are shown in bold font in Table 3.
ROUGE 2.0 is a family of metrics used for evaluating the quality of text summaries produced by automatic summarization systems. Below are brief explanations of some of the most used ROUGE metrics that we have adapted in this study.
ROUGE-1 measures the overlap of unigrams (single-words) between the generated summary and the reference summary. It computes the precision and recall of unigrams in the generated summary compared to those in the reference summary. ROUGE-2 measures the overlap of bigrams (pairs of adjacent words) between the generated summary and the reference summary. It computes the precision and recall of bigrams in the generated summary compared to those in the reference summary. ROUGE-W measures the weighted overlap of n-grams between the generated summary and the reference summary, where n can be any positive integer. The weighting function assigns higher weights to n-grams that are closer together in the summary. ROUGE-L measures the longest common subsequence (LCS) between the generated summary and the reference summary. It computes the precision and recall of the LCS in the generated summary compared to that in the reference summary. ROUGE-SU measures the skip-bigram (pairs of non-consecutive words) overlap between the generated summary and the reference summary. It computes the precision and recall of skip-bigrams in the generated summary compared to those in the reference summary.
All these ROUGE metrics are widely used in the field of natural language processing and machine learning to evaluate the quality of text summarization systems. They are often used in combination with other metrics to provide a more comprehensive evaluation of the summarization performance.
The Grapharizer with MLR, ANN, and SVM performed comparatively better than the rest of the techniques in the different variants of Rouge scores in terms of the recall and F-score, respectively. Table 3 represents a comparison between TextRank [69], LexRank [34], KUSH [7], Grapharizer, ANNGrapharizer, MLRGrapharizer, and SVMGrapharizer. These techniques are compared for recall, precision, and the F-score of ROUGE 1, ROUGE 2, ROUGE L, ROUGE W, and ROUGE SU.
Compared with TextRank [69], Grapharizer gained 1.98% accuracy in ROUGE 1 recall, whereas that of SVMGrapharizer was reported to be 13.97%. The SVMGrapharizer improved the F-score by a margin of 0.02%. ANNGrapharizer improved the performance by a margin of 14.88% for recall, while the F-score improvement was recorded to be 1.13%. MLRGrapharizer showed the best improvement of all, with recall improved by 15.36%, and the F-score improved by 1.45%.
Compared with LexRank [34], Grapharizer improved the recall assessment of ROUGE 1 by 9.67% and SVMGrapharizer did so by 21.66%, while the F-score improvement by SVMGrapharizer was 5.06%. ANNGrapharizer showed better performance, with 22.57% improved recall, and 6.16% improved F-score, than LexRank [34]. The best results were again reported by MLRGrapharizer, with 23.05% improvements in recall and 6.49% improvement in F-score.
Compared with KUSH [7], Grapharizer improved the recall of ROUGE 1 by 3.80%, and SVMGrapharizer by 15.79%, whereas the F-score of SVMGrapharizer was slightly improved by 0.44%. ANNGrapharizer showed further improved results with 16.70% recall value gain and 1.54% improvement in the F-score. The best results for ROUGE 1 were again obtained by MLRGrapharizer, with 17.19% increase in recall value and 1.86% improvement in the F-score when compared with KUSH [7].
SVMGrapharizer showed a margin of improvement over Grapharizer by 11.99% in the recall score, 6.10% in precision, and 8.09% in the F-score. ANNGrapharizer improved the Grapharizer by 12.90% for recall, 7.12% for precision, and 9.19% for the F-score. The best improvement was reported in the results for MLRGrapharizer with 13.38% improvement in the recall, 7.37% in precision, and 9.51% in the F-score. We conclude that the gain in results, specifically by MLRGrapharizer, can be attributed to the supervised learning in MLR that resulted in much improved results.
We discovered that the performance of MLR remained the best for most of the ROUGE scores, and that ANN classification performed well against SVM classification for small feature sets. Different layer counts were used in training and testing the neural networks. However, for ANN, adding more layers does not always result in better performance [67]. Therefore, we added just two hidden layers in our ANN. Finally, we concluded that, while SVM and ANN generated the same degree of accuracy, SVM was quicker than ANN.
Therefore, the use of LDA before graph construction and use of learning techniques at the end contributed positively to the results of Grapharizer.
It is evident from the results that MLRGrapharizer performed well in ROUGE 1 and ROUGE 2 among the rest of the baseline methods, while ANNGrapharizer performed well in ROUGE SU. Similarly, the performance was collectively better by MLRGrapharizer, ANNGrapharizer, and SVMGrapharizer, respectively. Since the graph approach that we have used is based on the word-graph technique, the number of matching unigrams and bigrams met expectations.
We tested Grapharizer and its ML variants on another dataset. We created a similar dataset to DUC 2004 containing news articles in a similar way. We crawled news related to floods in Pakistan in 2022, the divorce news of Johny Depp and Amber Heard, and the death of Queen Elizabeth II with the help of a web crawler. The news articles were managed in the same way as in DUC 2004. In order to provide reference summaries for performance comparison with Grapharizer summaries, we used ChatGPT. The summaries by ChatGPT were restricted to a word limit of less than 200. For each news cluster, a total of four reference summaries were produced using ChatGPT. The resultant summaries of Grapharizer, ANNGrapharizer, MLRGrapharizer, and SVMGrapharizer were then evaluated using the Rouge 2.0 toolkit and are shown in Table 4. The results were quite similar to the performance of the Grapharizer and its ML variants on DUC 2004.
Similarly, when the reference summaries were closely examined against DUC 2004, it was found that the representativeness of the reference summaries provided by DUC 2004 suffered, while meeting the summary length constraints. They did not include all the topics as concisely as expected by the generic summarizer system. Grapharizer makes sure that the inclusion of all topics presents the user with the most representative and informative summary; therefore, when evaluated against the reference summaries, the ROUGE values resulted in declined scores.
We conducted a non-parametric test, ANOVA, to compare Grapharizer with state-of-the-art techniques in terms of ROUGE scores. The result, with a p-value of 0.91 supporting the alternative hypothesis H1, indicated that there were no significant differences between the samples. In other words, we can conclude that Grapharizer gives comparable results to SOTA MDS techniques.

6. Conclusions and Future Directions

In the era of information overload, it is necessary to have access to accurate information in less time. The information should be concise, non-redundant, and cover all important aspects.
This research created the word-graph based extractive generic MDS technique known as Grapharizer, concentrating on fixing problems, such as poor grammar, missing essential information, and the repetition of data. We were able to fix the summary’s grammatical issues using lemmatization during pre-processing. Moreover, resolution of anaphora and cataphora, as well as the mapping of synonyms and MWE, have all improved the grammar of the output summary. Topic modelling addressed issues such as redundancy and the complete coverage of all topics. To further enhance the results, Grapharizer was backed by a variety of machine learning models.
The system was examined using the DUC 2004 dataset in comparison to different SOTA methods. When compared to the other baseline techniques, the results from Grapharizer (without ML) were encouraging. The system was further tested on another dataset created especially for testing the performance of Grapharizer.
Apart from the improvements observed in the results, other unique contributions of the study are as follows:
  • The major contribution of this research work is facilitation of the process of multi-document text summarization. The output of this research work will be useful in developing news aggregator services, such as Google News, that can summarize news from thousands of news publishers for readers.
  • One of the major contributions is the implementation of a framework for pre-processing and post-processing. The novel feature of the double checking of synonyms of the words increased the accuracy and the results were validated through qualitative expert evaluation.
  • In addition to anaphora replacement, our system also uses cataphora replacement for resolving the pronoun problems of text.
  • Design of a dataset similar to DUC 2004 for testing the performance of Grapharizer. The reference summaries are generated using ChatGPT.
  • The efficiency of the system is further enhanced by managing MWE; hence, providing a robust mechanism for adopting modern language expressions.
  • Further, the additional validation of results by domain experts added more confidence in the effectiveness and accuracy of our system.
Future research could expand on this study in the following research directions:
  • One of the directions for future work is to validate the results of our system on multiple datasets from various domains. This will help us increase the usability of our system.
  • Deep learning-based algorithms, such as CNN and RNN, can be implemented to increase efficiency.
  • Similarly, the results of the proposed system can be evaluated with different techniques, such as BERTScores.
  • To increase accuracy, manual verification from broader domain experts is envisioned.
  • A survey will be conducted with a large number of users to evaluate the usability of the proposed system.
  • This study was conducted on the datasets containing news articles in plain text files. A future direction will be to apply the same technique to newspapers and websites to summarize news articles since the layout and structuring of the input are of additional complexity for the summarizer techniques. In these cases, headings / headlines, top sentences, important sentences, and concluding statements will be of additional value in extending Grapharizer.
  • It would be interesting to apply Grapharizer to summarize research articles, since they follow a different structure, with the importance of a sentence being directly related to its position in the research article.
  • Grapharizer can be utilized in multiple areas. Its usability will be further enhanced by testing it in a multilingual environment. For instance, we are interested in evaluating Grapharizer using Urdu language scripted datasets.

Author Contributions

Conceptualization, Z.J., J.N. and M.N.; methodology, Z.J., J.N. and M.N.; software, Z.J. and M.N.; validation, Z.J., M.N. and T.A.; formal analysis, Z.J. and J.N.; investigation, Z.J.; resources, Z.J., J.N.; M.A. and A.A.; writing—original draft preparation, Z.J.; writing—review and editing, Z.J., M.N., T.A., M.A. and A.A.; visualization, M.A. and A.A.; supervision, T.A. and J.N.; project administration, T.A. and J.N. All authors have read and agreed to the published version of the manuscript.

Funding

This research received no external funding.

Institutional Review Board Statement

Not applicable.

Informed Consent Statement

Not applicable.

Data Availability Statement

Restrictions apply to the availability of these data. Data were obtained from NIST and are available https://duc.nist.gov/duc2004/ (accessed on 1 December 2022) with the permission of NIST.

Conflicts of Interest

The authors declare no conflict of interest. However, we suggest not to send this manuscript to reviewers from International Islamic University, Islamabad, Pakistan, as it is the workplace of the three authors of this manuscript.

Appendix A

-
A graph generated on a topic in DUC 2004. Available online: https://drive.google.com/file/d/1CPkB0RvAABgWBAT-hAxbrFuatAIHYn45/view?usp=sharing (accessed on 9 April 2023).
-
-
Topic-specific graphs created after pre-processing and topic modeling. Available online: https://drive.google.com/drive/folders/1WIVfyHIevSrdbfxSVPHeAVCIekY7aIWF?usp=sharing (accessed on 9 April 2023)
-

References

  1. Bidoki, M.; Moosavi, M.R.; Fakhrahmad, M. A semantic approach to extractive multi-document summarization: Applying sentence expansion for tuning of conceptual densities. Inf. Process. Manag. 2020, 57, 102341. [Google Scholar] [CrossRef]
  2. Sanchez-Gomez, J.M.; Vega-Rodríguez, M.A.; Perez, C.J. A decomposition-based multi-objective optimization approach for extractive multi-document text summarization. Appl. Soft Comput. 2020, 91, 106231. [Google Scholar] [CrossRef]
  3. El-Kassas, W.S.; Salama, C.R.; Rafea, A.A.; Mohamed, H.K. Automatic text summarization: A comprehensive survey. Expert Syst. Appl. 2021, 165, 113679. [Google Scholar] [CrossRef]
  4. Mojrian, M.; Mirroshandel, S.A. A novel extractive multi-document text summarization system using quantum-inspired genetic algorithm: MTSQIGA. Expert Syst. Appl. 2021, 171, 114555. [Google Scholar] [CrossRef]
  5. Siautama, R.; IA, A.C.; Suhartono, D. Extractive hotel review summarization based on TF/IDF and adjective-noun pairing by considering annual sentiment trends. Procedia Comput. Sci. 2021, 179, 558–565. [Google Scholar]
  6. Jalil, Z.; Nasir, J.A.; Nasir, M. Extractive Multi-Document Summarization: A Review of Progress in the Last Decade. IEEE Access 2021, 9, 130928–130946. [Google Scholar] [CrossRef]
  7. Uçkan, T.; Karcı, A. Extractive multi-document text summarization based on graph independent sets. Egypt. Inform. J. 2020, 21, 145–157. [Google Scholar] [CrossRef]
  8. ShafieiBavani, E.; Ebrahimi, M.; Wong, R.; Chen, F. On improving informativity and grammaticality for multi-sentence compression. arXiv 2016, arXiv:1605.02150. [Google Scholar]
  9. Durrett, G.; Berg-Kirkpatrick, T.; Klein, D. Learning-based single-document summarization with compression and anaphoricity constraints. arXiv 2016, arXiv:1603.08887. [Google Scholar]
  10. Wu, K.; Li, L.; Li, J.; Li, T. Ontology-enriched multi-document summarization in disaster management using submodular function. Inf. Sci. 2013, 224, 118–129. [Google Scholar] [CrossRef]
  11. Baralis, E.; Cagliero, L.; Jabeen, S.; Fiori, A.; Shah, S. Multi-document summarization based on the Yago ontology. Expert Syst. Appl. 2013, 40, 6976–6984. [Google Scholar] [CrossRef]
  12. Hennig, L.; Umbrath, W.; Wetzker, R. An ontology-based approach to text summarization. In Proceedings of the 2008 IEEE/WIC/ACM International Conference on Web Intelligence and Intelligent Agent Technology, Sydney, Australia, 9–12 December 2008; IEEE: Washington, DC, USA. [Google Scholar]
  13. Oliveira, H.; Ferreira, R.; Lima, R.; Lins, R.D.; Freitas, F.; Riss, M.; Simske, S.J. Assessing shallow sentence scoring techniques and combinations for single and multi-document summarization. Expert Syst. Appl. 2016, 65, 68–86. [Google Scholar] [CrossRef]
  14. Alguliev, R.M.; Aliguliyev, R.M.; Hajirahimova, M.S. GenDocSum+ MCLR: Generic document summarization based on maximum coverage and less redundancy. Expert Syst. Appl. 2012, 39, 12460–12473. [Google Scholar] [CrossRef]
  15. Qiang, J.-P.; Chen, P.; Ding, W.; Xie, F.; Wu, X. Multi-document summarization using closed patterns. Knowl.-Based Syst. 2016, 99, 28–38. [Google Scholar] [CrossRef]
  16. Canhasi, E.; Kononenko, I. Weighted archetypal analysis of the multi-element graph for query-focused multi-document summarization. Expert Syst. Appl. 2014, 41, 535–543. [Google Scholar] [CrossRef]
  17. Bollegala, D.; Okazaki, N.; Ishizuka, M. A preference learning approach to sentence ordering for multi-document summarization. Inf. Sci. 2012, 217, 78–95. [Google Scholar] [CrossRef]
  18. Nasir, J.A.; Karim, A.; Tsatsaronis, G.; Varlamis, I. A knowledge-based semantic kernel for text classification. In International Symposium on String Processing and Information Retrieval; Springer: Berlin/Heidelberg, Germany, 2011. [Google Scholar]
  19. Radev, D.R.; Jing, H.; Styś, M.; Tam, D. Centroid-based summarization of multiple documents. Inf. Process. Manag. 2004, 40, 919–938. [Google Scholar] [CrossRef]
  20. Zhang, Y.; Xia, Y.; Liu, Y.; Wang, W. Clustering sentences with density peaks for multi-document summarization. In Proceedings of the 2015 Conference of the North American Chapter of the Association for Computational Linguistics: Human Language Technologies, Denver, CO, USA, 31 May–5 June 2015. [Google Scholar]
  21. Wang, B.; Zhang, J.; Liu, Y.; Zou, Y. Density peaks clustering based integrate framework for multi-document summarization. CAAI Trans. Intell. Technol. 2017, 2, 26–30. [Google Scholar] [CrossRef]
  22. Nagwani, N.K. Summarizing large text collection using topic modeling and clustering based on MapReduce framework. J. Big Data 2015, 2, 6. [Google Scholar] [CrossRef]
  23. Christensen, J.; Soderland, S.; Bansal, G. Hierarchical summarization: Scaling up multi-document summarization. In Proceedings of the 52nd annual meeting of the association for computational linguistics, Baltimore, MD, USA, 23–25 June 2014; Volume 1. Long papers. [Google Scholar]
  24. Rodriguez, A.; Laio, A. Clustering by fast search and find of density peaks. Science 2014, 344, 1492–1496. [Google Scholar] [CrossRef]
  25. Contractor, D.; Guo, Y.; Korhonen, A. Using argumentative zones for extractive summarization of scientific articles. In Proceedings of the COLING 2012, Mumbai, India, 8–15 December 2012. [Google Scholar]
  26. Gong, Y.; Liu, X. Generic text summarization using relevance measure and latent semantic analysis. In Proceedings of the 24th Annual International ACM SIGIR Conference on Research and Development in Information Retrieval, New Orleans, LA, USA, 9–13 September 2001. [Google Scholar]
  27. Ferreira, R.; Lins, R.D.; Simske, S.J.; Freitas, F.; Riss, M. Assessing sentence similarity through lexical, syntactic and semantic analysis. Comput. Speech Lang. 2016, 39, 1–28. [Google Scholar] [CrossRef]
  28. Marujo, L.; Ling, W.; Ribeiro, R.; Gershman, A.; Carbonell, J.; de Matos, D.M.; Neto, J.P. Exploring events and distributed representations of text in multi-document summarization. Knowl.-Based Syst. 2016, 94, 33–42. [Google Scholar] [CrossRef]
  29. Carbonell, J.; Goldstein, J. The use of MMR, diversity-based reranking for reordering documents and producing summaries. In Proceedings of the 21st Annual International ACM SIGIR Conference on Research and Development in Information Retrieval, Melbourne, Australia, 24–28 August 1998. [Google Scholar]
  30. Lin, J.; Madnani, N.; Dorr, B. Putting the user in the loop: Interactive maximal marginal relevance for query-focused summarization. In Proceedings of the Human Language Technologies: The 2010 Annual Conference of the North American Chapter of the Association for Computational Linguistics, Los Angeles, CA, USA, 2–4 June 2010. [Google Scholar]
  31. Ozsoy, M.; Cicekli, I.; Alpaslan, F. Text summarization of turkish texts using latent semantic analysis. In Proceedings of the 23rd International Conference on Computational Linguistics (Coling 2010), Beijing, China, 23–27 August 2010. [Google Scholar]
  32. Chatterjee, N.; Yadav, N. Fuzzy rough set-based sentence similarity measure and its application to text summarization. IETE Tech. Rev. 2019, 36, 517–525. [Google Scholar] [CrossRef]
  33. Xu, J.; Durrett, G. Neural extractive text summarization with syntactic compression. arXiv 2019, arXiv:1902.00863. [Google Scholar]
  34. Erkan, G.; Radev, D.R. Lexrank: Graph-based lexical centrality as salience in text summarization. J. Artif. Intell. Res. 2004, 22, 457–479. [Google Scholar] [CrossRef]
  35. Brin, S.; Page, L. The anatomy of a large-scale hypertextual web search engine. Comput. Netw. ISDN Syst. 1998, 30, 107–117. [Google Scholar] [CrossRef]
  36. Canhasi, E. Query Focused Multi-document Summarization Based on Five-Layered Graph and Universal Paraphrastic Embeddings. In Proceedings of the Computer Science On-Line Conference; Springer: Berlin/Heidelberg, Germany, 2017. [Google Scholar]
  37. Baralis, E.; Cagliero, L.; Mahoto, N.; Fiori, A. GRAPHSUM: Discovering correlations among multiple terms for graph-based summarization. Inf. Sci. 2013, 249, 96–109. [Google Scholar] [CrossRef]
  38. Chali, Y.; Hasan, S.A.; Joty, S.R. Improving graph-based random walks for complex question answering using syntactic, shallow semantic and extended string subsequence kernels. Inf. Process. Manag. 2011, 47, 843–855. [Google Scholar] [CrossRef]
  39. John, A.; Wilscy, M. Vertex cover algorithm based multi-document summarization using information content of sentences. Procedia Comput. Sci. 2015, 46, 285–291. [Google Scholar] [CrossRef]
  40. Tzouridis, E.; Nasir, J.A.; Brefeld, U. Learning to summarise related sentences. In Proceedings of the COLING 2014, the 25th International Conference on Computational Linguistics: Technical Papers, Dublin, Ireland, 23–29 August 2014. [Google Scholar]
  41. Sukumar, P.; Gayathri, K. Semantic based Sentence Ordering Approach for Multi-Document Summarization. Int. J. Recent Technol. Eng. 2014, 3, 71–76. [Google Scholar]
  42. Christensen, J.; Soderland, S.; Etzioni, O. Towards coherent multi-document summarization. In Proceedings of the 2013 Conference of the North American Chapter of the Association for Computational Linguistics: Human Language Technologies, Seattle, WA, USA, 9–14 June 2013. [Google Scholar]
  43. Chen, J.; Zhuge, H. Extractive summarization of documents with images based on multi-modal RNN. Future Gener. Comput. Syst. 2019, 99, 186–196. [Google Scholar] [CrossRef]
  44. Celikkale, B.; Erdogan, G.; Erdem, A.; Erdem, E. Generating visual story graphs with application to photo album summarization. Signal Process. Image Commun. 2021, 90, 116033. [Google Scholar] [CrossRef]
  45. Shingrakhia, H.; Patel, H. SGRNN-AM and HRF-DBN: A hybrid machine learning model for cricket video summarization. Vis. Comput. 2022, 38, 2285–2301. [Google Scholar] [CrossRef]
  46. Radarapu, R.; Gopal, A.S.S.; Madhusudhan, N. Video summarization and captioning using dynamic mode decomposition for surveillance. Int. J. Inf. Technol. 2021, 13, 1927–1936. [Google Scholar] [CrossRef]
  47. Marzijarani, S.B.; Sajedi, H. Opinion mining with reviews summarization based on clustering. Int. J. Inf. Technol. 2020, 12, 1299–1310. [Google Scholar] [CrossRef]
  48. Abdi, A.; Hasan, S.; Shamsuddin, S.M.; Idris, N.; Piran, J. A hybrid deep learning architecture for opinion-oriented multi-document summarization based on multi-feature fusion. Knowl.-Based Syst. 2021, 213, 106658. [Google Scholar] [CrossRef]
  49. Pontes, E.L.; Huet, S.; Torres-Moreno, J.-M.; Linhares, A.C. Compressive approaches for cross-language multi-document summarization. Data Knowl. Eng. 2020, 125, 101763. [Google Scholar] [CrossRef]
  50. El-Kassas, W.S.; Salama, C.R.; Rafea, A.A.; Mohamed, H.K. EdgeSumm: Graph-based framework for automatic text summarization. Inf. Process. Manag. 2020, 57, 102264. [Google Scholar] [CrossRef]
  51. Wang, D.; Liu, P.; Zheng, Y.; Qiu, X.; Huang, X.-J. Heterogeneous graph neural networks for extractive document summarization. arXiv 2020, arXiv:2004.12393. [Google Scholar]
  52. Tomer, M.; Kumar, M. Multi-document extractive text summarization based on firefly algorithm. J. King Saud Univ.-Comput. Inf. Sci. 2021, 34, 6057–6065. [Google Scholar] [CrossRef]
  53. Davoodijam, E.; Ghadiri, N.; Shahreza, M.L.; Rinaldi, F. MultiGBS: A multi-layer graph approach to biomedical summarization. J. Biomed. Inform. 2021, 116, 103706. [Google Scholar] [CrossRef] [PubMed]
  54. Jin, H.; Wang, T.; Wan, X. Multi-granularity interaction network for extractive and abstractive multi-document summarization. In Proceedings of the 58th Annual Meeting of the Association for Computational Linguistics, Online, 5–10 July 2020. [Google Scholar]
  55. Van Lierde, H.; Chow, T.W. Query-oriented text summarization based on hypergraph transversals. Inf. Process. Manag. 2019, 56, 1317–1338. [Google Scholar] [CrossRef]
  56. Li, X.; Wu, P.; Zou, C.; Xie, H.; Wang, F.L. Sentiment Lossless Summarization. Knowl.-Based Syst. 2021, 227, 107170. [Google Scholar] [CrossRef]
  57. Mallick, C.; Das, A.K.; Dutta, M.; Das, A.K.; Sarkar, A. Graph-based text summarization using modified TextRank. In Soft Computing in Data Analytics; Springer: Berlin/Heidelberg, Germany, 2019; pp. 137–146. [Google Scholar]
  58. Filippova, K. Multi-sentence compression: Finding shortest paths in word graphs. In Proceedings of the 23rd International Conference on Computational Linguistics (Coling 2010), Beijing, China, 23–27 August 2010. [Google Scholar]
  59. Blei, D.M.; Ng, A.Y.; Jordan, M.I. Latent dirichlet allocation. J. Mach. Learn. Res. 2003, 3, 993–1022. [Google Scholar]
  60. Teh, Y.; Jordan, M.; Beal, M.; Blei, D. Hierarchical dirichlet processes. J. Am. Stat. Assoc. 2006, 101, 1566–1581. [Google Scholar] [CrossRef]
  61. Swapna, B.; Anuradha, T. Achieving Higher Ranking to Webpages Through Search Engine Optimization. In Proceedings of the International Conference on Computational Intelligence and Data Engineering, online, 12–13 August 2022; Springer: Berlin/Heidelberg, Germany, 2022. [Google Scholar]
  62. Rani, R.; Lobiyal, D.K. An extractive text summarization approach using tagged-LDA based topic modeling. Multimed. Tools Appl. 2021, 80, 3275–3305. [Google Scholar] [CrossRef]
  63. Issam KA, R.; Patel, S. Topic modeling based extractive text summarization. arXiv 2021, arXiv:2106.15313. [Google Scholar] [CrossRef]
  64. Noor, U. A Data-Driven Approach to Automated Analysis of Cyber Threat Intelligence [Doctoral dissertation, NUST]. Pakistan Research Repository. 2020. Available online: http://prr.hec.gov.pk/jspui/handle/123456789/18922 (accessed on 1 November 2022).
  65. Hirao, T.; Isozaki, H.; Maeda, E.; Matsumoto, Y. Extracting important sentences with support vector machines. In Proceedings of the COLING 2002: The 19th International Conference on Computational Linguistics, Taipei, Taiwan, 26–30 August 2002. [Google Scholar]
  66. Saura, J.R. Using data sciences in digital marketing: Framework, methods, and performance metrics. J. Innov. Knowl. 2021, 6, 92–102. [Google Scholar] [CrossRef]
  67. Kianmehr, K.; Gao, S.; Attari, J.; Rahman, M.M.; Akomeah, K.; Alhajj, R.; Rokne, J.; Barker, K. Text summarization techniques: SVM versus neural networks. In Proceedings of the 21th International Conference on Information Integration and Web-Based Applications & Services, Munich, Germany, 2–4 December 2019; pp. 487–491. [Google Scholar]
  68. Sinha, A.; Yadav, A.; Gahlot, A. Extractive text summarization using neural networks. arXiv 2018, arXiv:1802.10137. [Google Scholar]
  69. Mihalcea, R.; Tarau, P. Textrank: Bringing order into text. In Proceedings of the 2004 Conference on Empirical Methods in Natural Language Processing, Barcelona, Spain, 25–26 July 2004. [Google Scholar]
  70. Ferrigno, G.; Del Sarto, N.; Piccaluga, A.; Baroncelli, A. Industry 4.0 Base Technologies and Business Models: A Bibliometric Analysis. In Academy of Management Proceedings; Academy of Management: Briarcliff Manor, NY, USA, 2020; p. 10510. [Google Scholar]
Figure 1. Hierarchical representation of categories of ATS.
Electronics 12 01895 g001
Figure 2. The Experimental Design of Grapharizer.
Electronics 12 01895 g002
Figure 3. Architecture diagram of Grapharizer with ML.
Electronics 12 01895 g003
Figure 4. The cross() function for synonym mapping.
Electronics 12 01895 g004
Figure 5. Word graph construction from the sentences “Linda is a beautiful girl”, “Linda is a beautiful young lady”, and “Linda is very professional”. The shortest path is the summary of these sentences in the red highlighted path saying, “Linda is beautiful girl”.
Electronics 12 01895 g005
Figure 6. Four reference summaries from DUC 2004 and summaries generated by Grapharizer and ML variant.
Electronics 12 01895 g006
Table 1. Characteristics of datasets at a glance.
CharacteristicsDUC 2004Recent News Articles
Total topics5025
Number of documents (per topic)1010
Total number of documents500250
News/data sourceTRD, TREC collection newswireNews articles
Table 2. Ablation study representing the effects of different pre-processing phases on Grapharizer.
Without Pre-Processing
ROUGE-TypeRecallPrecisionF-ScoreImprovement
Rouge-10.125670.165090.14271-
Rouge-20.003680.0050.00424-
Rouge-L0.132740.161110.14555-
Rouge-SU40.037450.042510.03982-
With pronoun replacement
Rouge-10.181880.198410.189790.04708
Rouge-20.008310.008060.008180.00394
Rouge-L0.159560.178570.168530.02298
Rouge-SU40.052960.048360.050560.01074
With synonym mapping
Rouge-10.158720.18220.169650.02694
Rouge-20.020820.021550.021180.01694
Rouge-L0.156270.157410.156840.01129
Rouge-SU40.046160.044740.045440.00562
With MWE mapping
Rouge-10.172160.199150.184670.04196
Rouge-20.017030.017240.017140.0129
Rouge-L0.16120.168270.164660.01911
Rouge-SU40.050450.049120.049780.00996
With reverse-mwe()
Rouge-10.329490.247220.282490.13978
Rouge-20.091680.06180.073830.06959
Rouge-L0.233380.179580.202970.05742
Rouge-SU40.114580.071590.088120.0483
With all pre-processing
Rouge-10.538640.273920.363160.22045
Rouge-20.140680.067310.091050.08681
Rouge-L0.256210.212120.232090.08654
Rouge-SU40.09780.072670.083380.04356
Table 3. Comparison of Grapharizer with State-Of-The-Art Graph-Based Methods.
Methods
ROUGE Evaluation
METRICES
TextRank [69]LexRank
[34]
KUSH
[7]
GrapharizerANN
Grapharizer
MLR
Grapharizer
SVM
Grapharizer
Rouge 1Recall0.398930.322060.380720.418750.547750.552570.53864
Precision0.334620.304580.340190.212920.284150.286590.27392
F-Score0.362920.312550.358790.282300.374180.377420.36316
Rouge 2Recall0.079770.054390.082770.098160.142760.148120.14068
Precision0.068310.051700.073730.047100.069850.072300.06731
F-Score0.073380.052920.077860.063660.093810.097170.09105
Rouge LRecall0.306850.257850.290370.242360.232390.245630.25621
Precision0.258680.244440.259450.199240.207000.205030.21212
F-Score0.279910.250530.273640.201950.201640.202000.23209
Rouge WRecall0.104360.089570.099080.106150.098900.108530.10059
Precision0.161130.155170.161970.055810.092200.101180.09197
F-Score0.126220.113340.122780.075020.095430.104730.09609
Rouge SURecall0.139980.095320.130620.176190.200000.200000.19524
Precision0.096830.084210.103720.083710.111970.103450.09904
F-Score0.113280.088840.114930.113500.136360.136300.13141
Table 4. Performance of Grapharizer and its ML variants on Recent News Articles dataset.
ROUGE Evaluation MetricesRecent News Articles
GrapharizerANNGrapharizerMLRGrapharizerSVMGrapharizer
Rouge 1Recall0.420180.494390.494290.50159
Precision0.138630.229260.216940.22280
F-Score0.208480.313250.301540.30855
Rouge 2Recall0.048460.123510.110740.12604
Precision0.014840.053730.046030.05252
F-Score0.022730.074880.065030.07415
Rouge LRecall0.145740.189480.189480.20292
Precision0.066270.101790.098280.10517
F-Score0.091110.132430.129430.13854
Rouge WRecall0.102990.086470.079910.07991
Precision0.084220.075430.067540.06385
F-Score0.092380.080580.073210.07098
Rouge SURecall0.196080.156860.161770.15686
Precision0.063090.070490.069330.06751
F-Score0.095470.097270.097060.09439
Disclaimer/Publisher’s Note: The statements, opinions and data contained in all publications are solely those of the individual author(s) and contributor(s) and not of MDPI and/or the editor(s). MDPI and/or the editor(s) disclaim responsibility for any injury to people or property resulting from any ideas, methods, instructions or products referred to in the content.

