1. Introduction
The US National Security Agency (NSA) started working on Transient Elect Magnetic Pulse Emanation Surveillance Technology (TEMPEST) in the late 1960s and early 1970s [
1,
2,
3]. TEMPEST refers to the operation of state, communication, and information processing devices leaking energy outwards as EM signals. The attacker uses interception and storage devices coupled to cables near the leak source to obtain the EM leakage signal, which is analyzed and decoded to restore the original emission information from the leak source device.
The TEMPEST field includes studies on many electronic information devices [
4,
5,
6,
7,
8], such as computer mainframes, monitors, and keyboards. Monitors, as common output devices, are also common targets for EM information leakage studies. A famous example is the Van Eck W experiment [
9]. In 1985, Van Eck W, a Dutch scholar, converted a television set into a signal receiver and successfully intercepted the EM leakage signal from a computer monitor at a certain distance. In 1998, Markus G. Kuhn et al. from the University of Cambridge, UK, carried out experiments on the interception and reproduction of EM information leakage from CRT [
10,
11,
12] and LCD [
13,
14,
15] monitors. They proposed a method of information concealment (Soft TEMPEST) [
16] based on the principle of EM information leakage from monitors and achieved a series of results. These efforts have led to a growing awareness of the potential risks of EM information leakage, while experiments on EM leakage in other electronic information devices are gradually being conducted.
As one of the most dominant input devices, keyboards are the focus of EM information leakage research. In 1990, Smulders P [
17] introduced the communication protocol used in PS/2 keyboards and analyzed the EM information leakage caused by this principle when transmitting keystroke information. In this way, he investigated the EM leakage generated by the serial cable and carried out a series of processing and analysis operations to recover the keystroke information. In the 21st century, researchers have used artificial intelligence methods applied to the detection of EM leakage signals from keyboards. Asonov and Agrawal found that keyboard keys produce a particular sound when they are pressed and released [
18]. Using this feature, they used the waveform of the tapping sound as a basis with a machine learning classification model to restore the information with an accuracy of 80%. Also noting changes in the external characteristics of keyboard tapping, Davide Balzarotti [
19] and others have restored keystroke content through image recognition techniques using intelligent computer analysis to learn human keystrokes through video.
However, this type of method can only be used in specific environments, is not noisy- immune, and has insufficient generalization capability. Another type of method is based on the analysis of the signal through an oscilloscope to interpret the time domain waveform of the intercepted EM information and restore the information [
20]. Hyo-Joon Choi et al. [
21] measured the EM radiation of a USB keyboard using an antenna with a receiver and successfully restored the keystroke information with a signal processing algorithm. In 2018, Alexandru Boitan [
22] et al. reverse-decoded the collected leakage signal and restored the keystroke information by analyzing the transmission protocol of the USB keyboard, the encoding method. Finally, they carried out a risk assessment of information vulnerability. This type of method is based on the premise that the characteristics of the EM leakage information are known, and the analysis of the EM signal is carried out manually, which relies on experience and is also susceptible to interference from ambient noise. When the SNR of the leakage signal is low, the results of the analysis are affected and lack stability.
It can be seen from the above analysis that all these methods in the literature have a common problem. That is, when faced with the interference of environmental noise, they will not be able to carry out effective information restoration of the keyboard EM leakage signal. This is the original intention of the denoising method in this paper. We hope that through the denoising of the keyboard EM leakage signal, the information contained in it can be better restored.
Since the last century, experts have constructed a series of denoising methods based on the differences in the nature of noise and effective signals and achieved good results in practical applications. The classical methods are wavelet transform [
23,
24], bandpass filter [
25], median filter [
26,
27], empirical modal decomposition [
28,
29,
30], and so on. In the subsequent experiments, several of them were selected for comparison with the denoising method we designed. Based on a large number of samples collected experimentally, we designed model training experiments. And by analyzing the experimental data, we demonstrated the effectiveness of the method.
In this paper, an EM signal-denoising method was designed for USB keyboards. It not only improves the SNR of the signal but also preserves as much valid information as possible.
2. Analysis of Leakage Mechanism
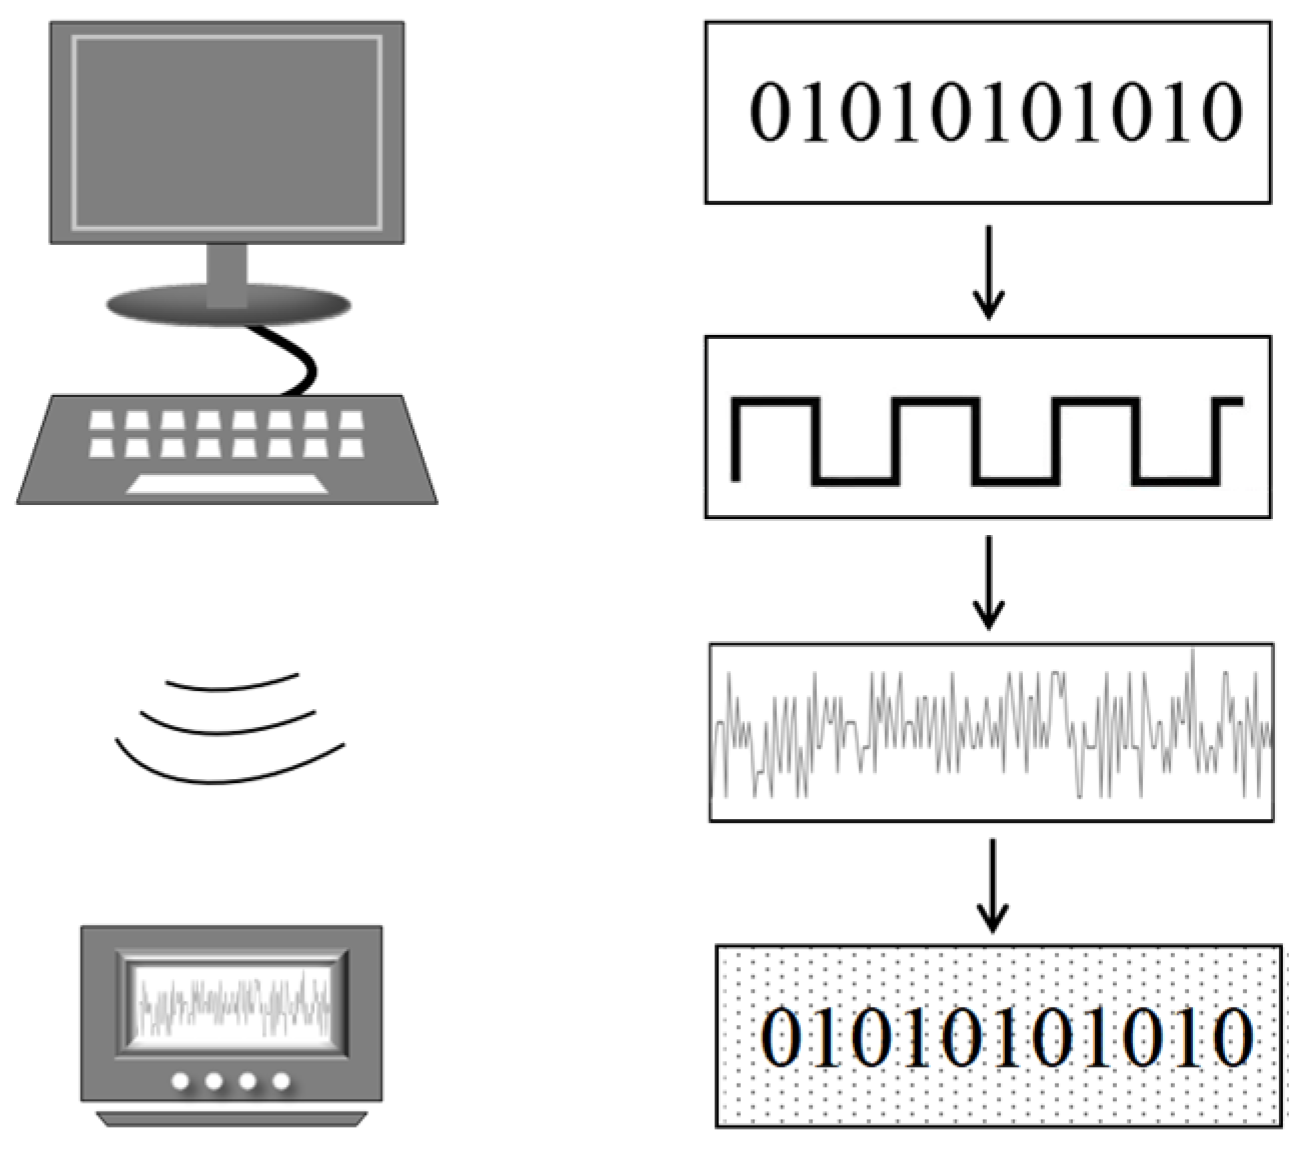
The knowledge of EM field theory shows that EM waves are generated for any electronic device or circuit where time-varying currents are present. As a digital circuit device, when a USB keyboard transmits a digital signal jumping edge, there are rising and falling edges. The faster the jumping time, the stronger the energy of the radiated EM signal. The radiation pulses formed by these digital signals are emitted into external space or leaked out in a coupled, modulated manner through the connected conductors.
Figure 1 illustrates the process of information leakage.
Therefore, theoretically speaking, during the operation of a keyboard, there is an outward leakage of information caused by the emission of EM waves. This chapter will provide theoretical support for the subsequent algorithmic research by introducing the leakage ways of keyboard EM signals, the types of leakage signals, and the contents of the USB protocol.
2.1. The Leakage Methods of Keyboard EM Leakage Signal
Keyboards demonstrate two main EM leakage methods: conduction and radiation. The interception of the red signal is obtained by taking the coupling with the receiver through these two methods [
31,
32]. Therefore, analyzing these two EM leakage methods of the keyboard can provide guidance for the design of our subsequent experiments.
The presence of incidental line connections between keyboards and other sensitive equipment in the vicinity creates near-field coupling. This coupling can form a complete circuit connection, resulting in the leakage of useful information through the receiver’s metal conductor or collector elements (such as capacitors and transformers), thus intercepting the keyboard EM leakage information. Conducted coupling arises as a result.
EM radiation, unlike conductive coupling methods, does not require a direct connection path. It also does not require the signal source circuitry to be in the same near-field area as the sensitive circuitry. Therefore, when the distance between the signal source and the interception device is significant, and there is no direct connection, we can only use EM radiation as the interception method. Therefore, the radiation leakage signal may be affected by a great deal of EM interference during propagation.
Since the conduction coupling is generated through the cable coupling of electronic devices, the extensive use of electronic devices and data circuits results in leakage through conductive coupling being common. Therefore, conduction coupling is characterized by high hazard and high radiation. Based on a comprehensive analysis of the above, in this paper, we chose conduction coupling as the main leakage method of the leakage signal.
2.2. Types of Signals and USB Protocol
Restoration of the key leakage signal targets the red signal, which is the part of the signal that carries useful information. Depending on the type of red signal intercepted, there are generally four different types of leakage signal: baseband red signal, modulated carrier, pulsed radiation, and other types. The baseband red signal is the original signal emitted by the leak source without any modulation. In general, the baseband red signal is low frequency and does not radiate very strongly. The signal generated by the leakage signal being modulated by other carriers, such as amplitude modulation or angle modulation, is called a modulated carrier. Pulsed radiation leakage, also called shock signal leakage, is generated by a rapid jump in the signal. This jump is actually a change in current. In impulse radiation leakage, the rising and falling edges of the fast jumps generate strong impulse energy that carries the information conduction and radiation out, resulting in EM information leakage. In modern data circuits, this is a very common type of leakage signal. Therefore, we focus on the pulsed radiation leakage signal from USB keyboards in this paper. In the experiments, the leakage signal is collected by using an RF Current Probe to couple the transmission line during the keyboard operation. The receiver connected to the RF Current Probe is then able to receive the leakage signal generated by the coupling of the two.
Universal Serial Bus (USB) [
33], which supports plug-and-play and hot-swappable functionality for devices, is very commonly used in modern devices. Due to its advantages in terms of speed, expandability, and ease of use, keyboards with USB interfaces are also widely available. According to the USB 2.0 interface specification, USB keyboards are low-speed connection devices with signal transmission rates of up to 1.5 Mb/s. The connection cable is a twisted pair cable containing D+ and D− differential transmission data lines, as well as a ground and power cable.
The above analysis refers to the fact that when the USB keyboard transmits information, the keypress byte in the report contains key information, which consists of an 8-bit unsigned value, i.e., scan code, and each key has a unique scan code. USB keyboards use the NRZI data encoding scheme when transmitting data packets. The NRZI encoding specifies that a logic of 1 means no level change, and a logic of 0 means a level change. This converts the binary code in the USB data packet into an EM wave composed of high and low levels.
The above analysis shows that each key has its unique scan code based on the corresponding transmission protocol. When the USB keyboard is in operation, each keystroke creates a unique EM signal waveform. The work of information restoration for the EM leakage signal is carried out by using the waveform characteristics of each key as the identity code. The core idea of the algorithm designed in this paper is to obtain the EM waveform that can restore the information of the keys through denoising. The composition of the data frames is the same even for different brands of keyboards, as long as they use the same transmission protocol. The different physical structures of different devices may cause some differences in the intensity of EM radiation, which we can regard as environmental noise. Artificial intelligence methods are based on learnable models that extract signal features through continuous learning. Keyboards using the same working protocol, even if they are of different brands, have the same leakage characteristics. Under the action of the feature extraction method, features other than the common features are ignored. Therefore, in this paper, experiments using USB keyboards of the same brand are sufficient to support robustness analysis.
3. Denoising Algorithm
3.1. Fundamentals
Generative Adversarial Networks (GANs) [
34,
35,
36,
37,
38,
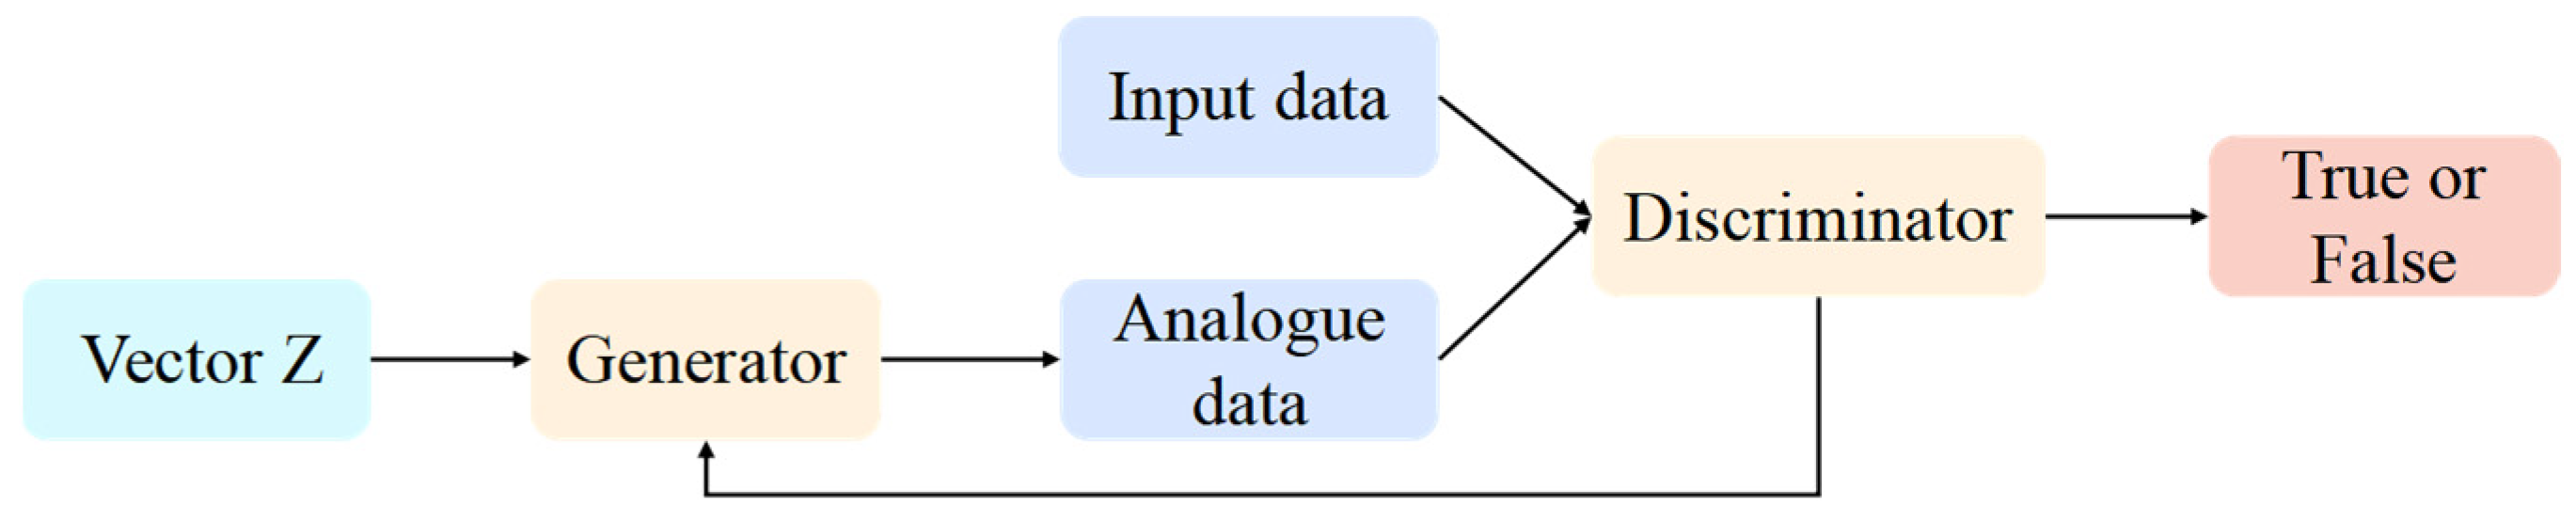
39] are deep learning, artificial neural networks proposed by Lan Goodfellow et al. in 2014. A GAN consists of two core modules, the Generator and the Discriminator, which compete and collaborate with each other to learn and produce the desired output. The main function of the Generator is to generate analog data based on the characteristics and distribution of the input data, while the main function of the Discriminator is to determine which data are real based on the input data and the analog data. During their competitive and collaborative learning process, GANs can continuously improve the performance of the Generator and Discriminator and generate a large amount of analog data with a very similar probability distribution to the input data. In recent years, GANs have been widely and deeply applied in the fields of image style conversion, image super-resolution reconstruction, and data expansion.
Figure 2 shows the basic principle of GANs. First, the input data samples are fed into the Discriminator for learning to extract the feature vectors; then, the random vectors are fed into the Generator, which generates analog data samples, in other words, a random number that is “faked” to produce something that looks like the input data samples.
We were inspired by the idea of adversarial games and considered the denoising of keyboard EM signals as the process of “faking” the denoised signal using noisy keyboard EM signals.
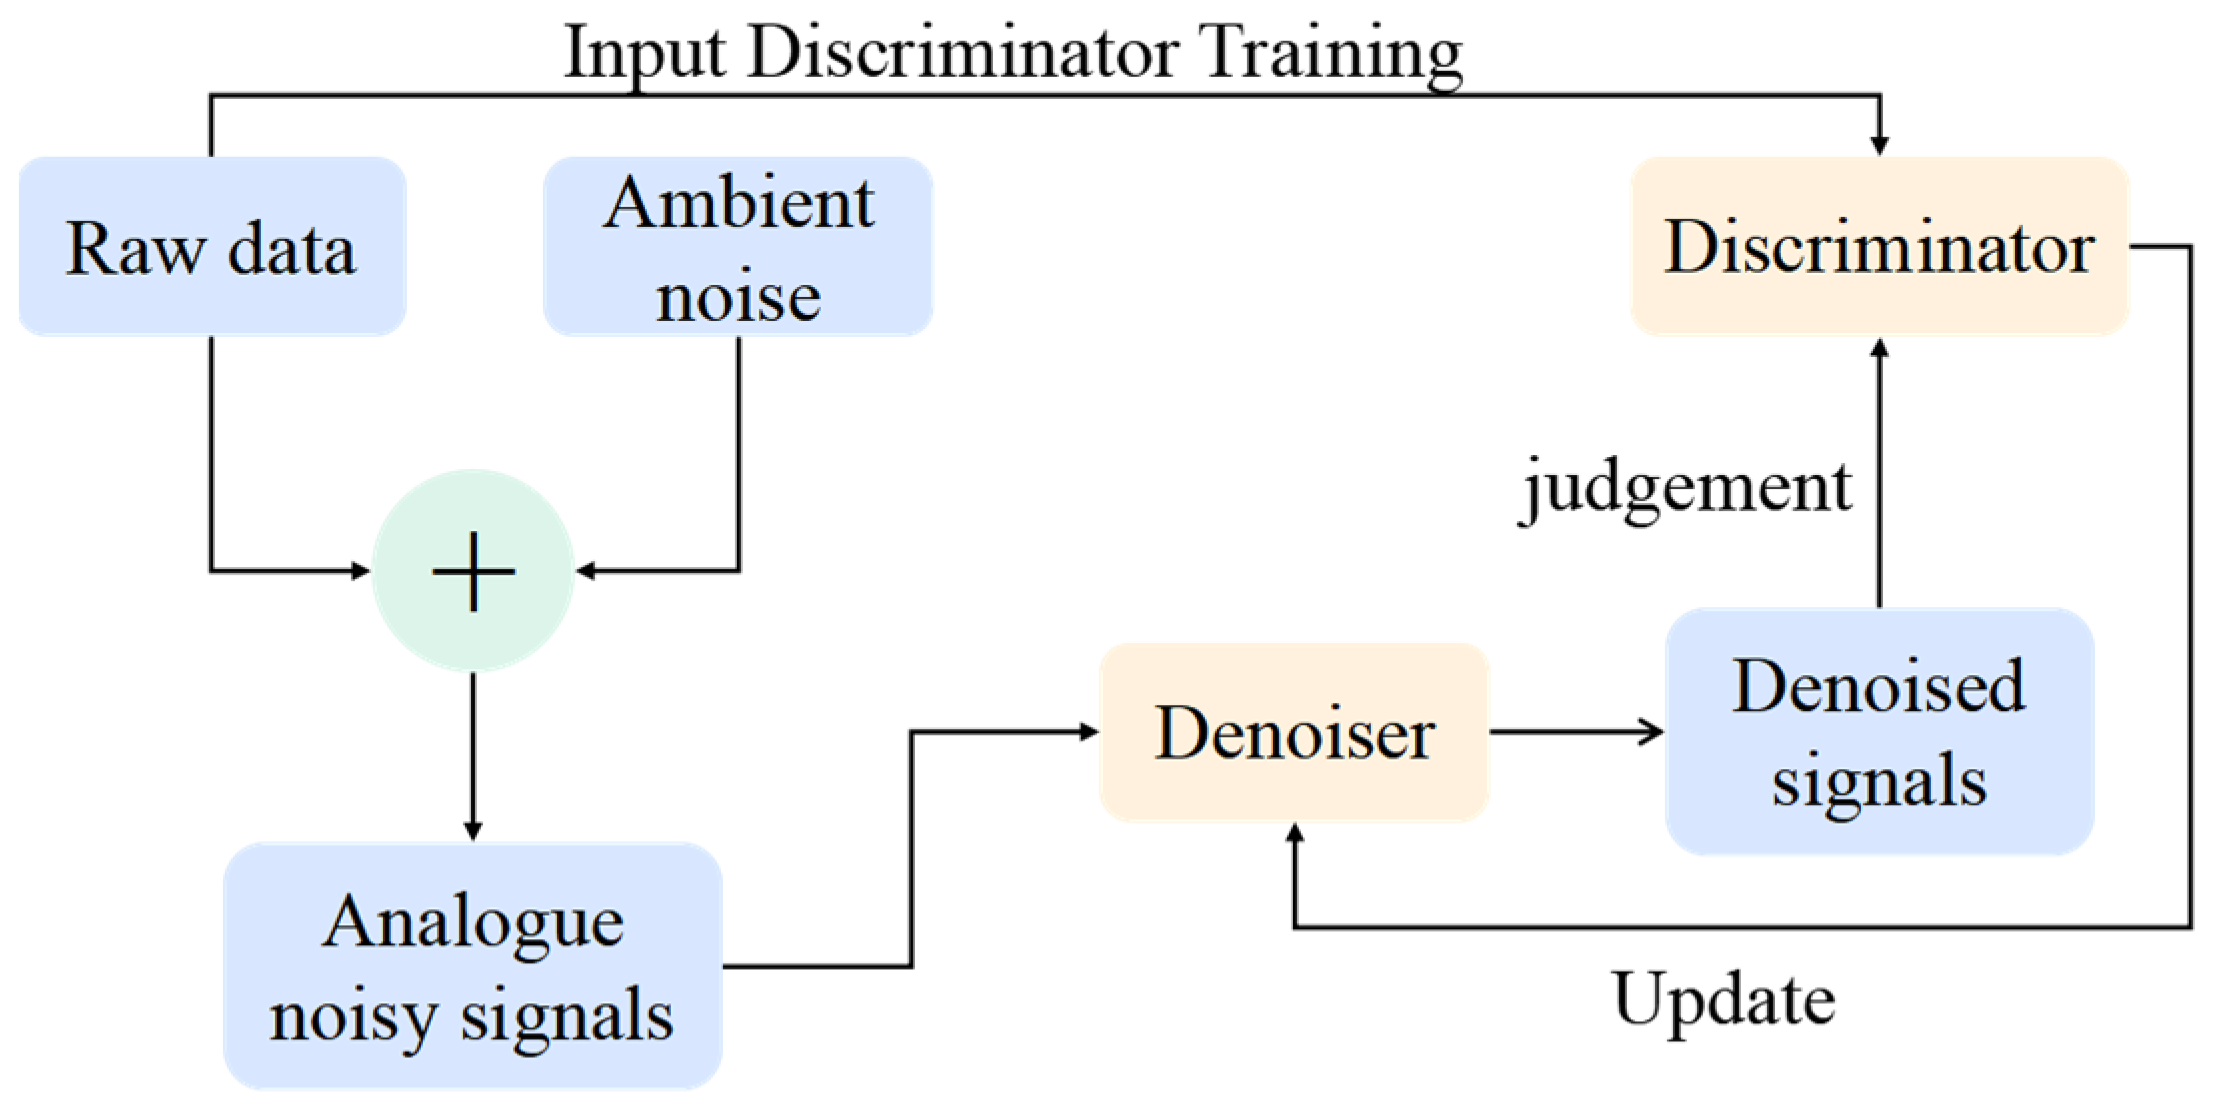
Figure 3 shows the basic principle and workflow of denoising using GAN. The original keyboard EM signal data are fed into the Discriminator, which learns its probability distribution; then, the analog noisy EM signal (the superposition of the original signal and the keyboard operating ambient noise) is fed into the Denoiser, and the denoised keyboard EM signal is obtained. Finally, the denoised keyboard EM signal is fed into the Discriminator to determine the authenticity. During the adversarial game between the Denoiser and the Discriminator, the ability of the Denoiser to “falsify” the denoised keyboard EM signal increases, and the ability of the Discriminator to determine the similarity between the denoised keyboard EM signal and the original signal data also increases. When the probability distribution of the denoised keyboard EM signal is very close to that of the original signal, the Discriminator decides that it is true, which indicates that the Denoiser is performing well. Conversely, if the probability distribution of the denoised keyboard EM signal differs significantly from that of the original signal, the Discriminator decides that it is false, and the Denoiser parameters need to be further optimized. The original EM signal, the analog noisy signal, and the denoised signal in
Figure 3 can be compared to the input data, the random vector, and the analog data in
Figure 2. In this process, the Discriminator’s task is still to determine the authenticity of the “ falsified “ signal. The Generator is replaced by a Denoiser, whose task is to denoise the data instead of amplifying it.
3.2. Network Structure
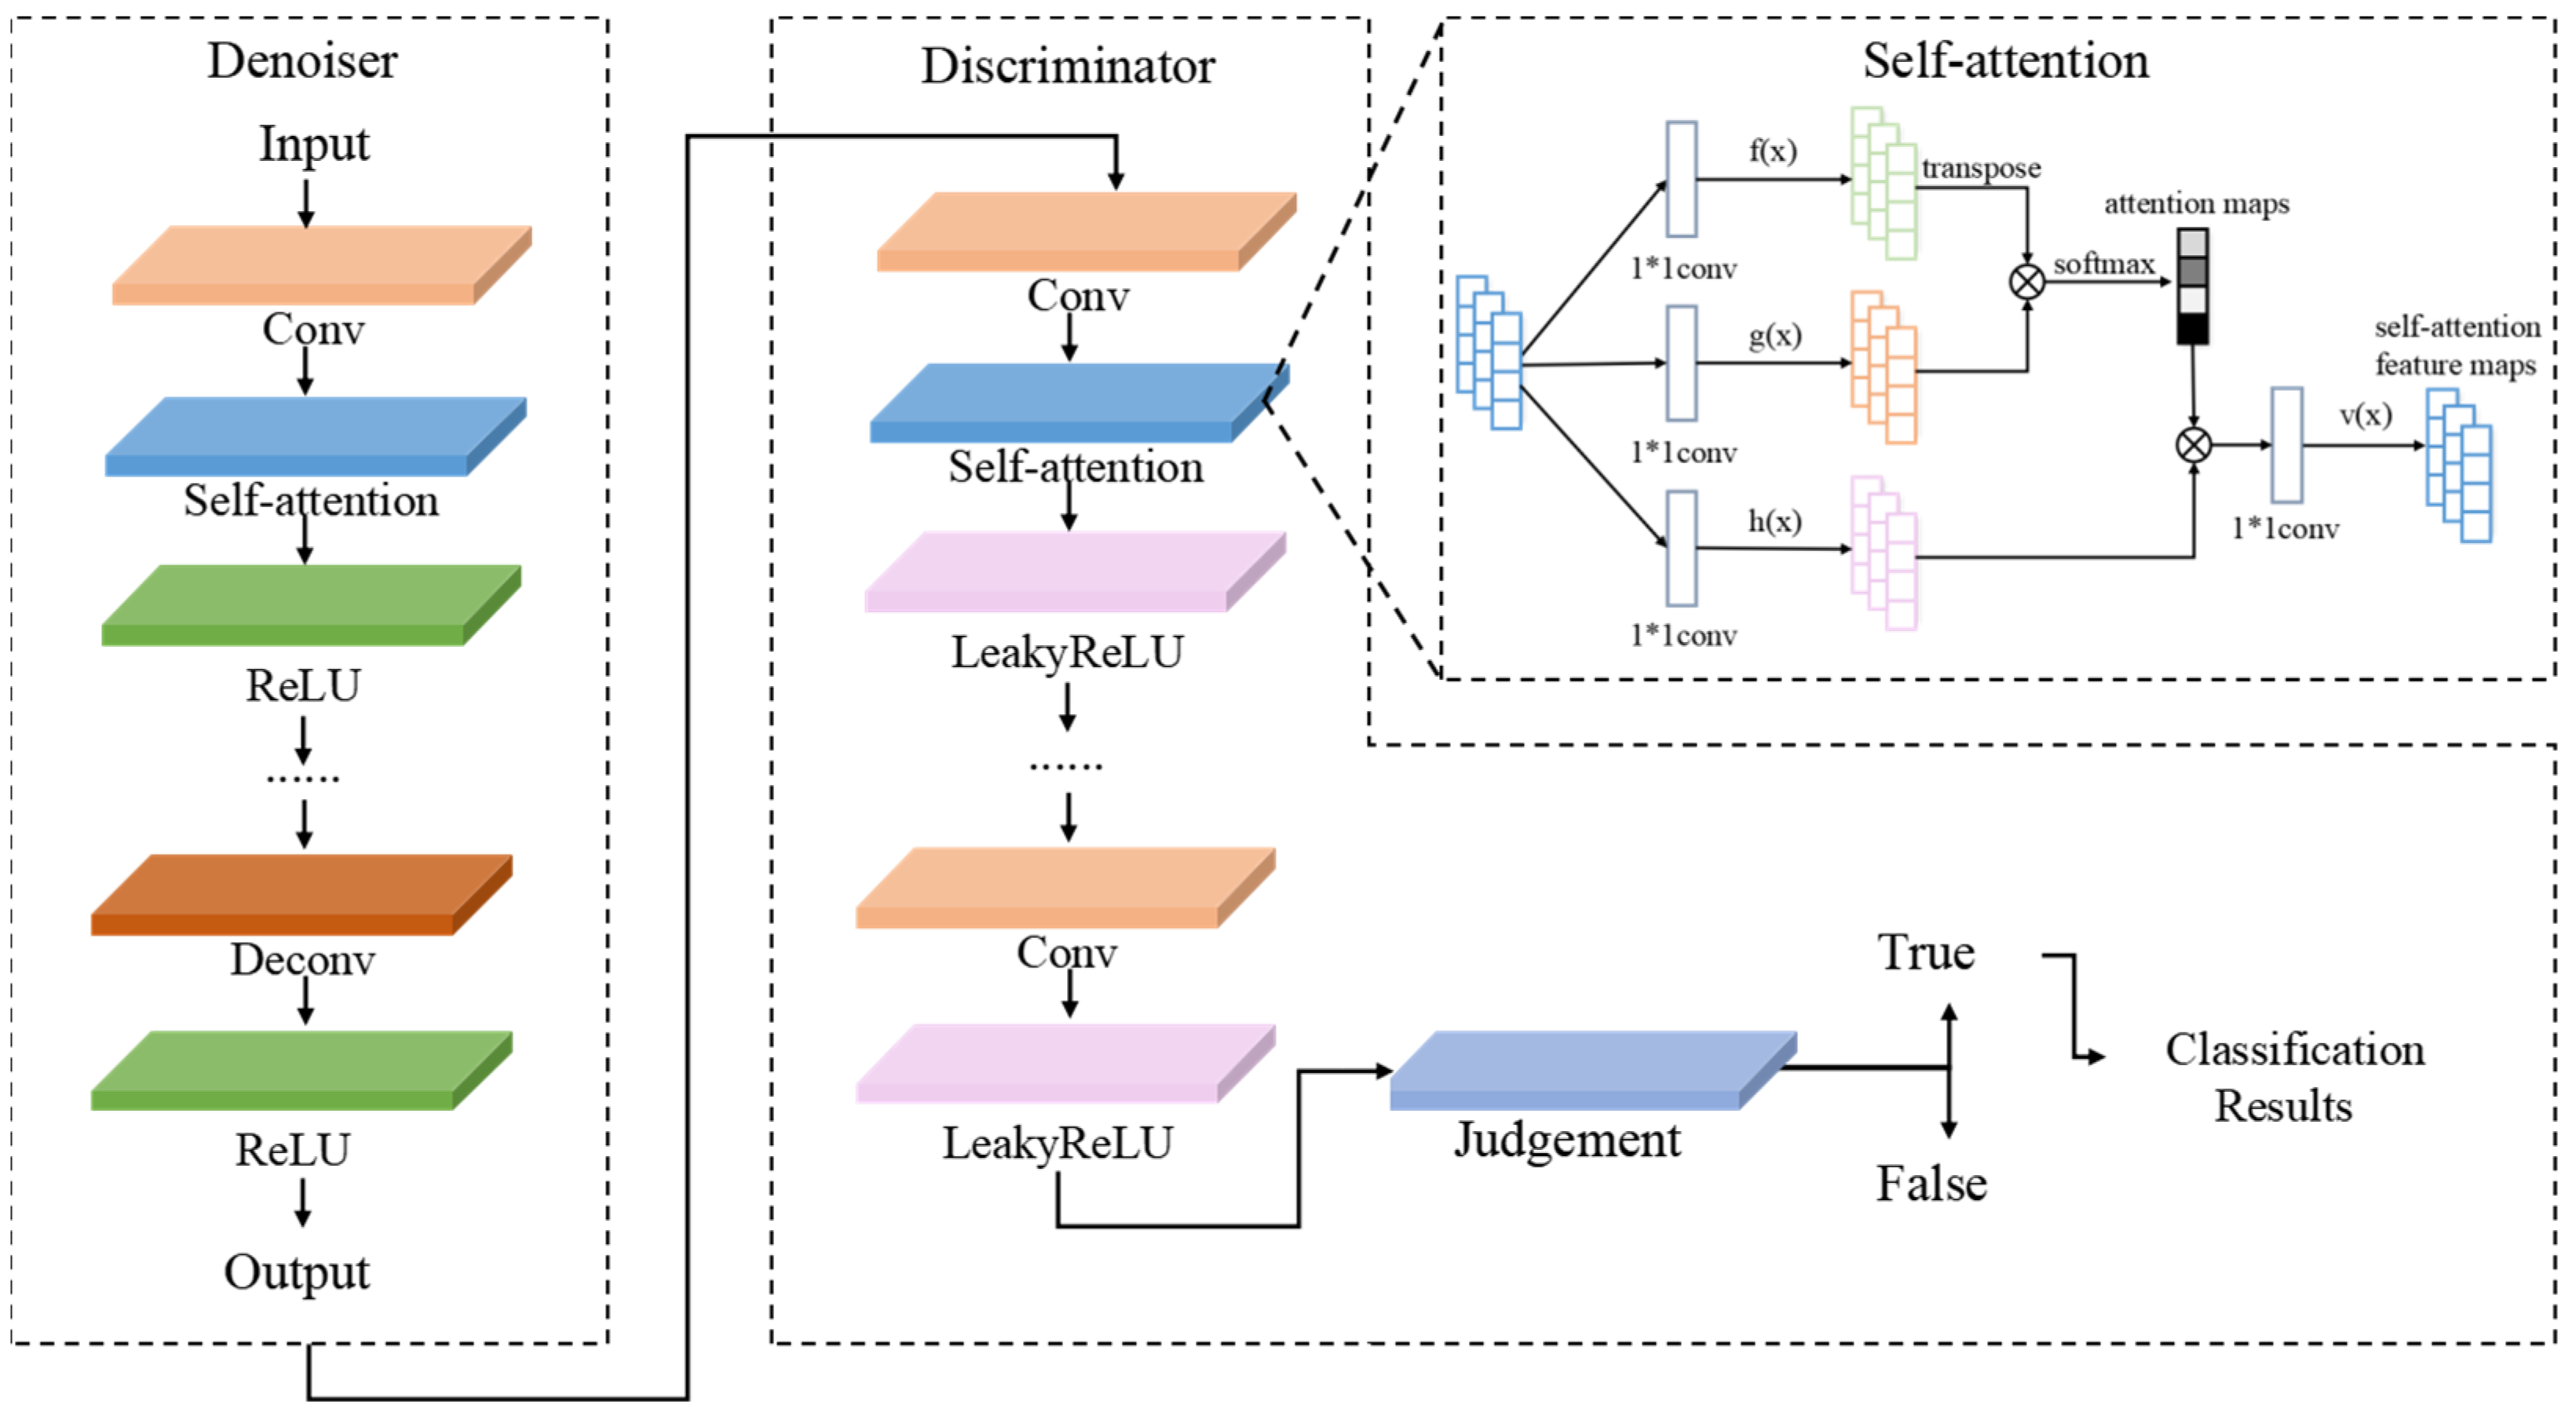
The network structure of SADAN is shown in
Figure 4. Its Denoiser and Discriminator both consist of a convolutional neural network and a self-attention mechanism. The Denoiser compensates for the loss of some keyboards’ EM information due to the deconvolution layer, which helps to better restore the already very weak effective signal in the leaked signal.
The network parameters of SADAN were set as follows: the convolution kernel size was 4, the filter size was 64, the number of convolution and deconvolution layers were added together as the network depth of the Denoiser, the network depth of the Denoiser was 10, and the network depth of the Discriminator was the number of convolution layers, which was 8. The parameters for training were set as follows: the range of learning rate was [10−3, 10−5], the epoch was set to 20, and the Batch size was 128.
The introduction of the self-attention mechanism into the convolutional GAN allows the Denoiser to better learn the dependencies of the keyboard EM leakage signal sequence during denoising, model the long-range relationships between sequence sample points, and analyze the sequence from a global perspective. At the same time, it is no longer constrained by the size of the convolutional kernel and the dependencies obtained by multi-layer convolution but obtains the long-range dependencies directly at one layer, thus facilitating the optimization work of the algorithm parameters.
3.3. SADAN’s Denoising Principle
In this paper, the keyboard ambient noise was obtained by coupling the RF Current Probe with the keyboard connection cable without keys, then superimposed with the original EM signal to represent the noisy leakage signal of the keyboard, as shown in Formula (1).
Here,
y represents the noisy leakage signal,
n represents ambient noise, and
x represents the original EM signal of the keyboard. From the principal analysis, it can be seen that the Denoiser is the mapping from the noisy leakage signal of the keyboard to the denoised signal, which can be represented by Formula (2).
θ denotes the Denoiser network parameters,
g is the denoised signal, and
G is the mapping created by the Denoiser. The Denoiser uses Mean Square Error (MSE) as its loss function, as shown in Formula (3). From Formula (3), it can be seen that the final optimization direction of the Denoiser is to make
g closer and closer to the original EM signal
x.
LG denotes the Denoiser loss function.
m is the logarithm of the combination of ambient noise slices and the original EM signal slices in the training set. The exact construction of the training set will be described in detail in the subsequent experimental section.
xi denotes the original EM signal of the keyboard, corresponding to the desired output at
yi input.
The discriminator uses a hinge loss function, as shown in Formula (4). LG denotes the Discriminator loss function. Pt denotes the original EM signal distribution of the keyboard. D is the mapping established by the Discriminator. When the output result of the Discriminator is greater than or equal to 1 or less than or equal to −1 when input x or g, it means that the discriminator’s discriminatory result of x or g is definitely true or false, and the loss is 0 at this time. If the output result is greater than −1 and less than 1, it means that the discriminatory result is uncertain, the loss is not 0 at this time, and it has to be accumulated.
From Formulas (3) and (4), it can be seen that when the probability distribution of the denoised signal and the original EM signal is infinitely close, the Denoiser’s loss tends to 0; when the probability distribution of the Discriminator input is infinitely close, and the input is infinitely distant, the Discriminator’s loss tends to 0.
From this, the loss function of SADAN is constructed as shown in Formula (5):
From Formula (5), it can be seen that in order to obtain the best denoising effect, the parameters of the Denoiser are optimized in the direction of minimizing LG, while the parameters of the Discriminator are optimized in the direction of minimizing LD.
4. Denoising Experiments and Analysis
In order to demonstrate the effectiveness of SADAN on the denoising of noisy leaked signals from keyboards, we first used the simulated EM signals as samples for denoising experiments to verify the feasibility of the scheme and then used the actual EM leakage signals collected as samples for denoising experiments. This is the basic idea of the research carried out in this paper. Then, we added traditional GAN and traditional signal-denoising methods for comparison experiments. The comparison of evaluation indicators of various algorithms can more clearly demonstrate the effectiveness and advantages of the SADAN algorithm.
4.1. Environment Setup and Sample Set Construction
In this section, the experimental environment was set up as a normal indoor environment. The keyboard EM signal collection device consisted of an RF Current Probe, a Passive Probe, and a signal receiver. The RF Current Probe was an A.H. Systems BCP-620, and the Passive Probe was a UT-P03. The signal receiver was a modular NI PXIe-5162 digitizer with a sampling accuracy of 10 Bit and a sampling rate of 5 Ms/s. According to the Nyquist Sampling Theorem, when the sampling frequency fs is greater than two times the highest frequency fmax in the signal (fs > 2fmax), the digital signal after sampling can completely retain the information in the original signal. After several experimental tests, we found that a sampling rate of 5 Ms/s was able to completely record the information in the signal and conformed to the sampling theorem, so we chose it as the sampling rate for the subsequent experiments. The USB keyboard was a DELL SK-8115.
The model training environment was deployed in a cloud server deep learning environment. The cloud server environment was configured on a single NVIDIA Tesla V100 32 GB graphics card, and a PyTorch deep learning platform was built based on the Linux operating system. The CUDA version was 11.0, the cuDNN version was 8.0, the Python version was 3.7, and the PyTorch version was 1.7.
The sample set required for the training of SADAN consisted of the raw EM signal and the analog noisy EM signal. The raw EM signal was obtained by connecting a Passive Probe to the keyboard’s D+ data line as a training sample for the Discriminator. A signal acquired in this way is rarely disturbed by environmental noise. Therefore, it is the signal originally conveyed by the keyboard device, i.e., the original signal. The leakage signal in the absence of any keystrokes was captured as the ambient noise component by using an RF Current Probe coupled to the transmission cable in the keyboard’s operating state. Then, we superimposed it with the raw EM signal as the analog noise EM signal, which, together with the raw EM signal, was used as input and label data for the training of the denoiser in SADAN.
The sample set was composed as shown in
Table 1, which includes 26 English letters, 10 Arabic numbers, the Space bar, comma, and full stop. Each keystroke had 500 samples, and the length was set to 1024.
4.2. Analogue Signal Testing
In order to visualize the denoising effect of SADAN, the traditional GAN was added to compare its denoising ability with that of the adversarial generative network. We also added two traditional methods of signal denoising, Empirical Mode Decomposition (EMD) [
40] and band-pass filter, for comparison. Both the Discriminator and Denoiser of the traditional GAN use convolutional neural networks as the network framework. Dr. E Huang of NASA invented EMD, which is commonly used to analyze non-stationary signals. EMD is a type of adaptive time-frequency processing method [
41] that transforms non-stationary signals into stationary signals. It does not require any basis functions to be set up, but rather, the decomposition is based on the properties of the signal itself. The principle is to decompose the fluctuations and trends of different sizes in the signal layer by layer to obtain a series of data sequences of different characteristic sizes. These data sequences are called eigenmodes, each of which is a locally smooth sine wave whose instantaneous frequency and amplitude can be obtained using the Hilbert transform. In our experiments, the noisy signal is decomposed into four eigenmodes, and the sum of 2 and 3 is output as the denoising result. The band-pass filter is a filter that allows only specific frequencies to pass through while being able to effectively suppress signals at other frequencies. This selectivity for specific frequency signals has made it widely used in the field of signal denoising. The essence of wavelet threshold denoising is suppressing the useless part of the signal and enhancing the useful part. The one-dimensional signal denoising process is as follows: the one-dimensional signal is decomposed by wavelet decomposition, selecting threshold function and threshold to quantify the high-frequency coefficients of wavelet decomposition and reconstruct the one-dimensional wavelet. We used symlets wavelet as the wavelet basis. The number of decomposition layers was 5, and we chose sqtwolog as the threshold function.
The experiment uses Root Mean Square Error (RMSE) as the first evaluation metric for the denoising method, which is mostly used to measure the deviation between the observed and true values. It is calculated by taking the denoised signal as the observed value and the original EM signal of the keyboard as the true value, as shown in the formula (6).
The SNR, calculated by the denoised signal and the original signal, is used as the second evaluation metric, as shown in the formula (7).
x(n) in both formulas represents the original EM signal of the keyboard, g(n) represents the denoised signal, and N is the length of the signal slice, which represents the number of sampling points. RMSE reflects the difference between the denoised signal and the original signal, indicating the ability of the algorithm to protect the effective information in the leaked signal. The smaller the RMSE, the smaller the loss of effective information in the denoising process; SNR is used to reflect the denoising effect of the algorithm. The smaller the RMSE, the smaller the loss of effective information in the denoising process; the larger the SNR, the more obvious the denoising effect.
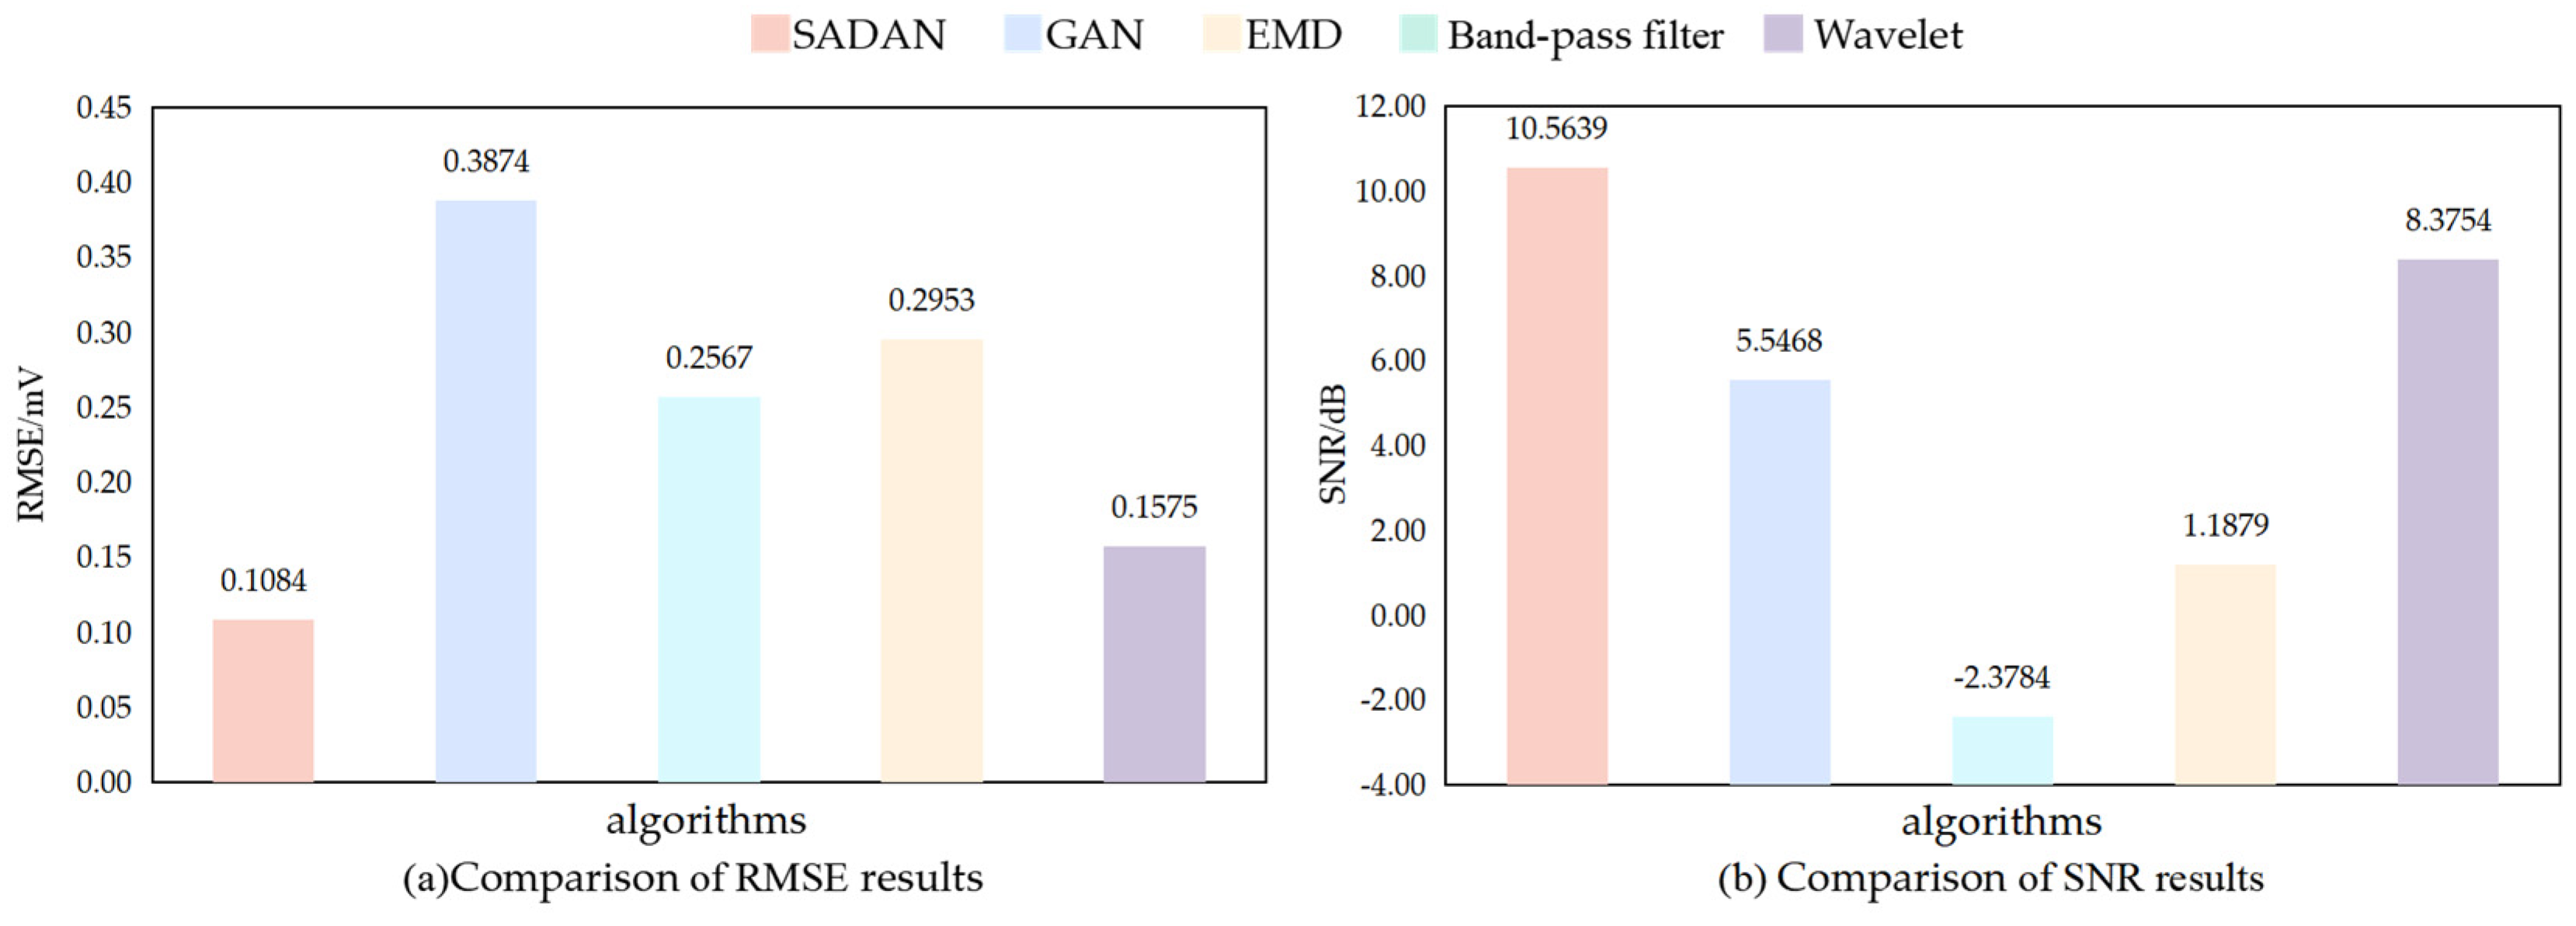
The initial SNR was calculated using the analog noise EM signal and the original EM signal to be −2.673 dB. The RMSE and SNR of the denoising results for the four algorithms were calculated as shown in
Figure 5. The results show that SADAN has the lowest RMSE and highest SNR compared to GAN, EMD, band-pass filters, and wavelets threshold denoising. This indicates that SADAN has a better performance in both the protection of valid information and the noise suppression effect. Due to the lack of a self-attention layer, GAN’s Denoiser is unable to accurately obtain the long-range relationship between sample points in the keyboard EM leakage signal sequence, resulting in a poor denoising effect. The EMD, band-pass filter, and wavelet threshold denoising do not have a neural network to extract features from the signal and cannot accurately grasp the original keyboard leakage signal characteristics, thus failing to protect the valid information.
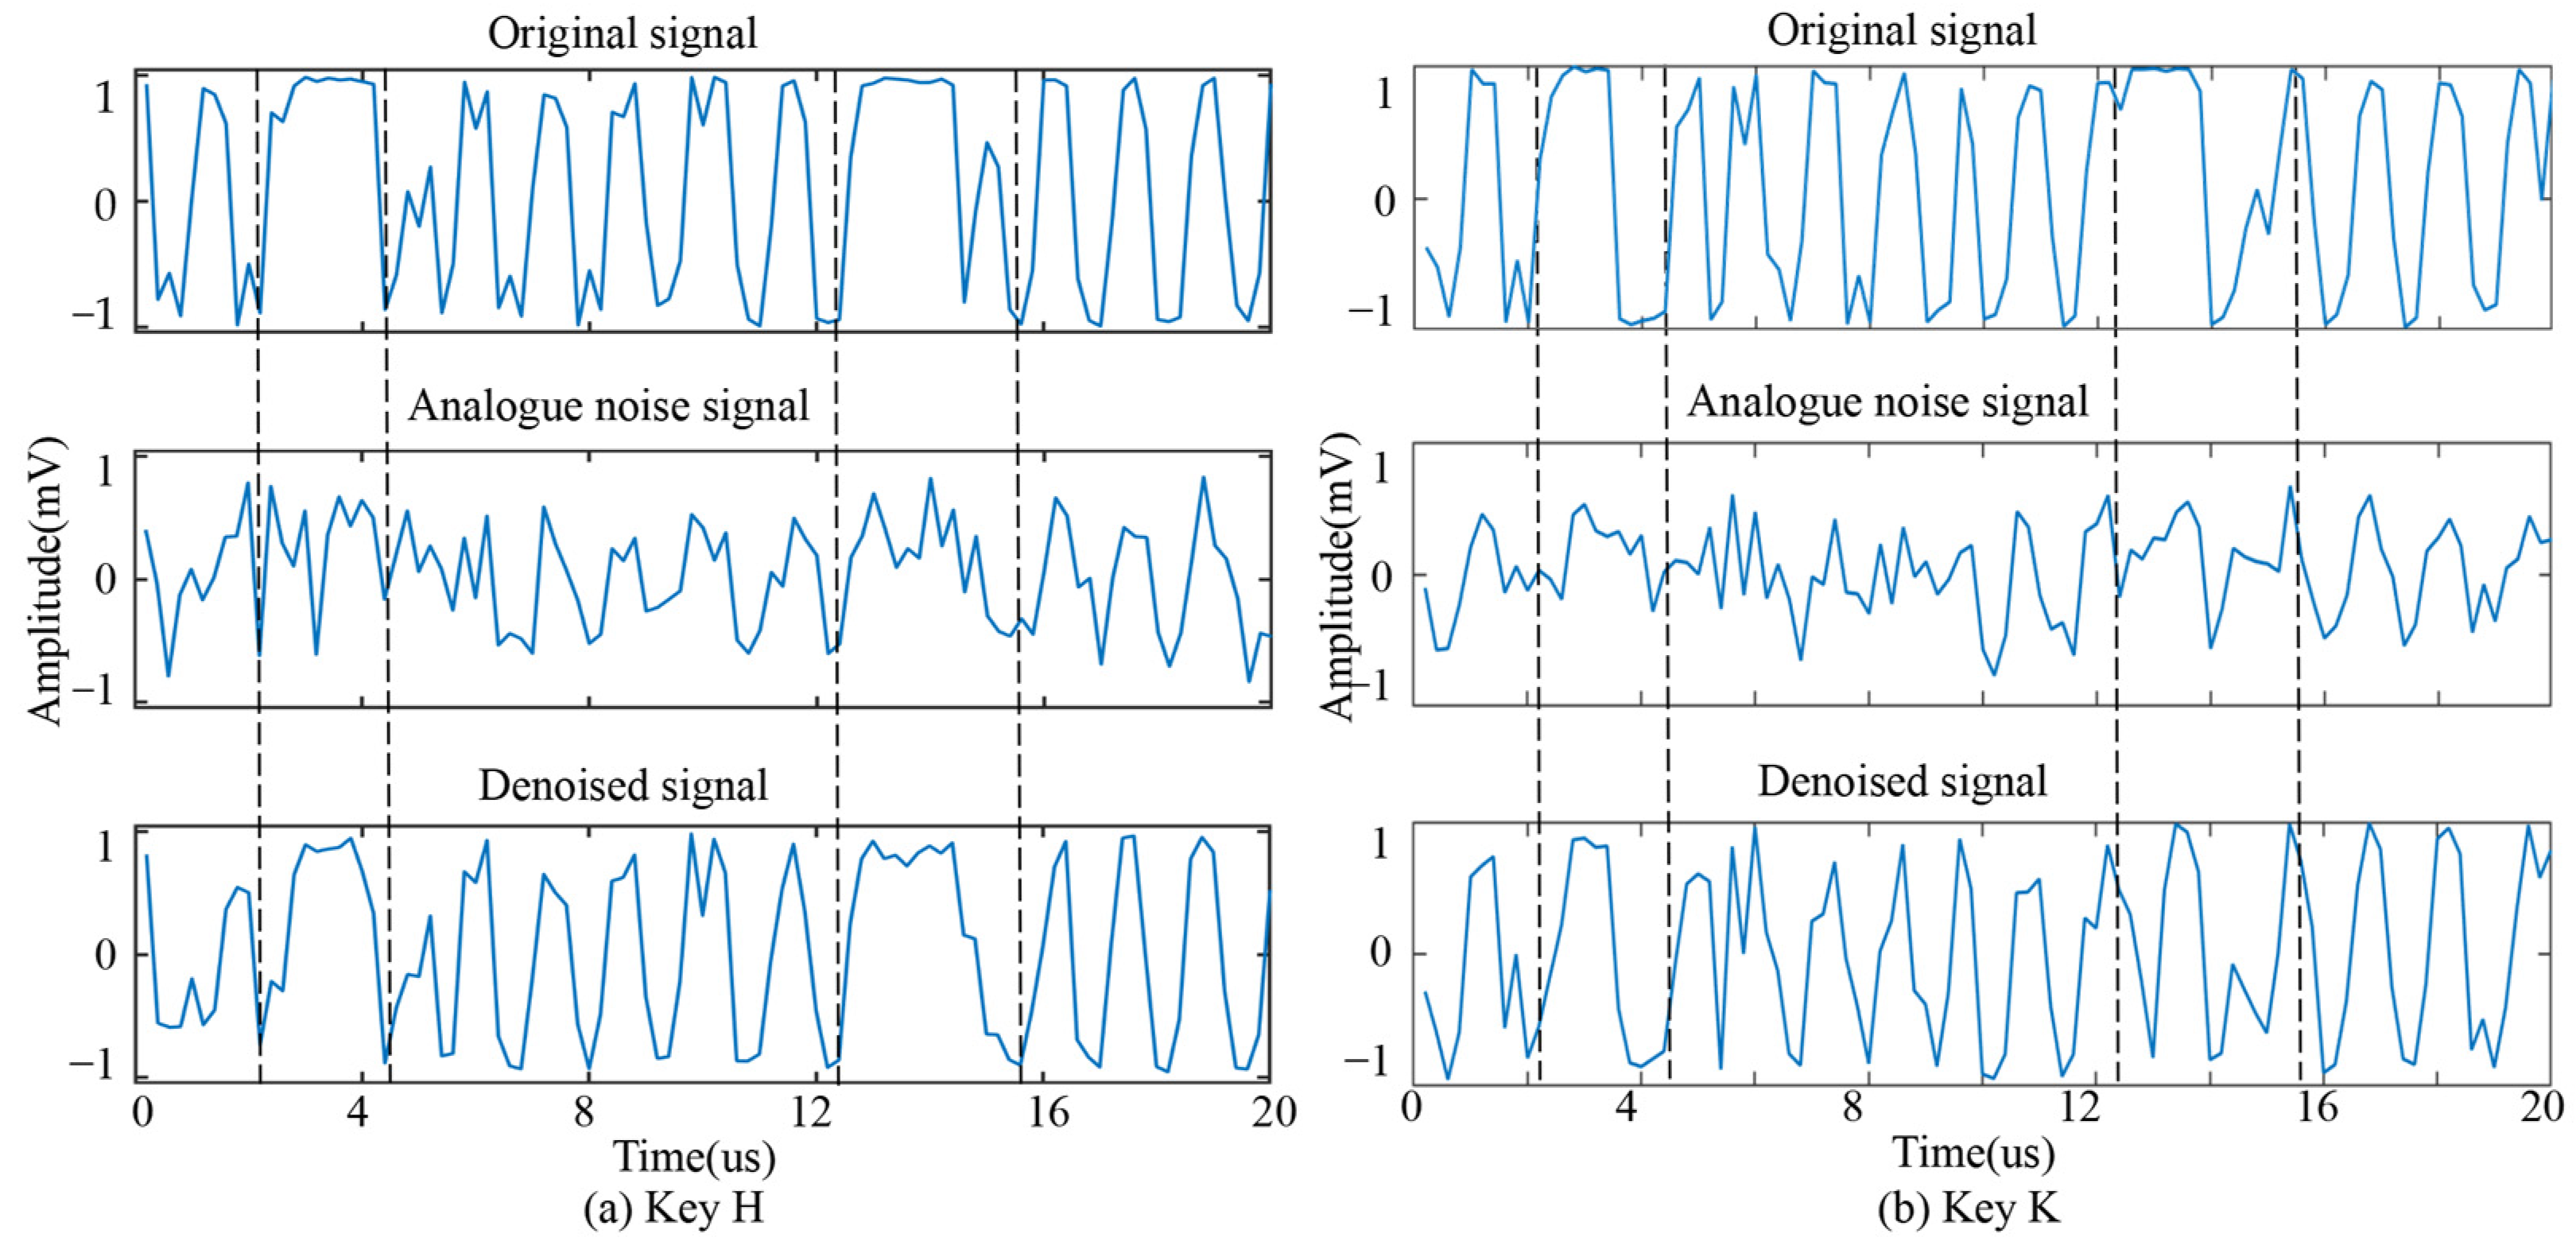
Figure 6 shows a comparison of the denoised signal with the original EM signal and the analog noise EM signal. We randomly chose two keys as examples to demonstrate the denoising effect. It can be seen that after denoising, the important peaks of the original signal waveform containing key information are highlighted and enhanced. SADAN enhanced the useful information in the noisy signal, and the Discriminator achieved 82.15% accuracy in the restoration of the denoised signal, which proves the effectiveness of the denoising algorithm to a certain extent.
4.3. Leakage Signal Testing
In order to verify the practical application value of SADAN, we carried out an experiment on the denoising of USB keyboard leakage signals. The experimental environment was set up in the same way as the simulation, differing only in the Denoiser training samples. The Denoiser used the keyboard leakage signal as the input data and the raw signal as the corresponding label data.
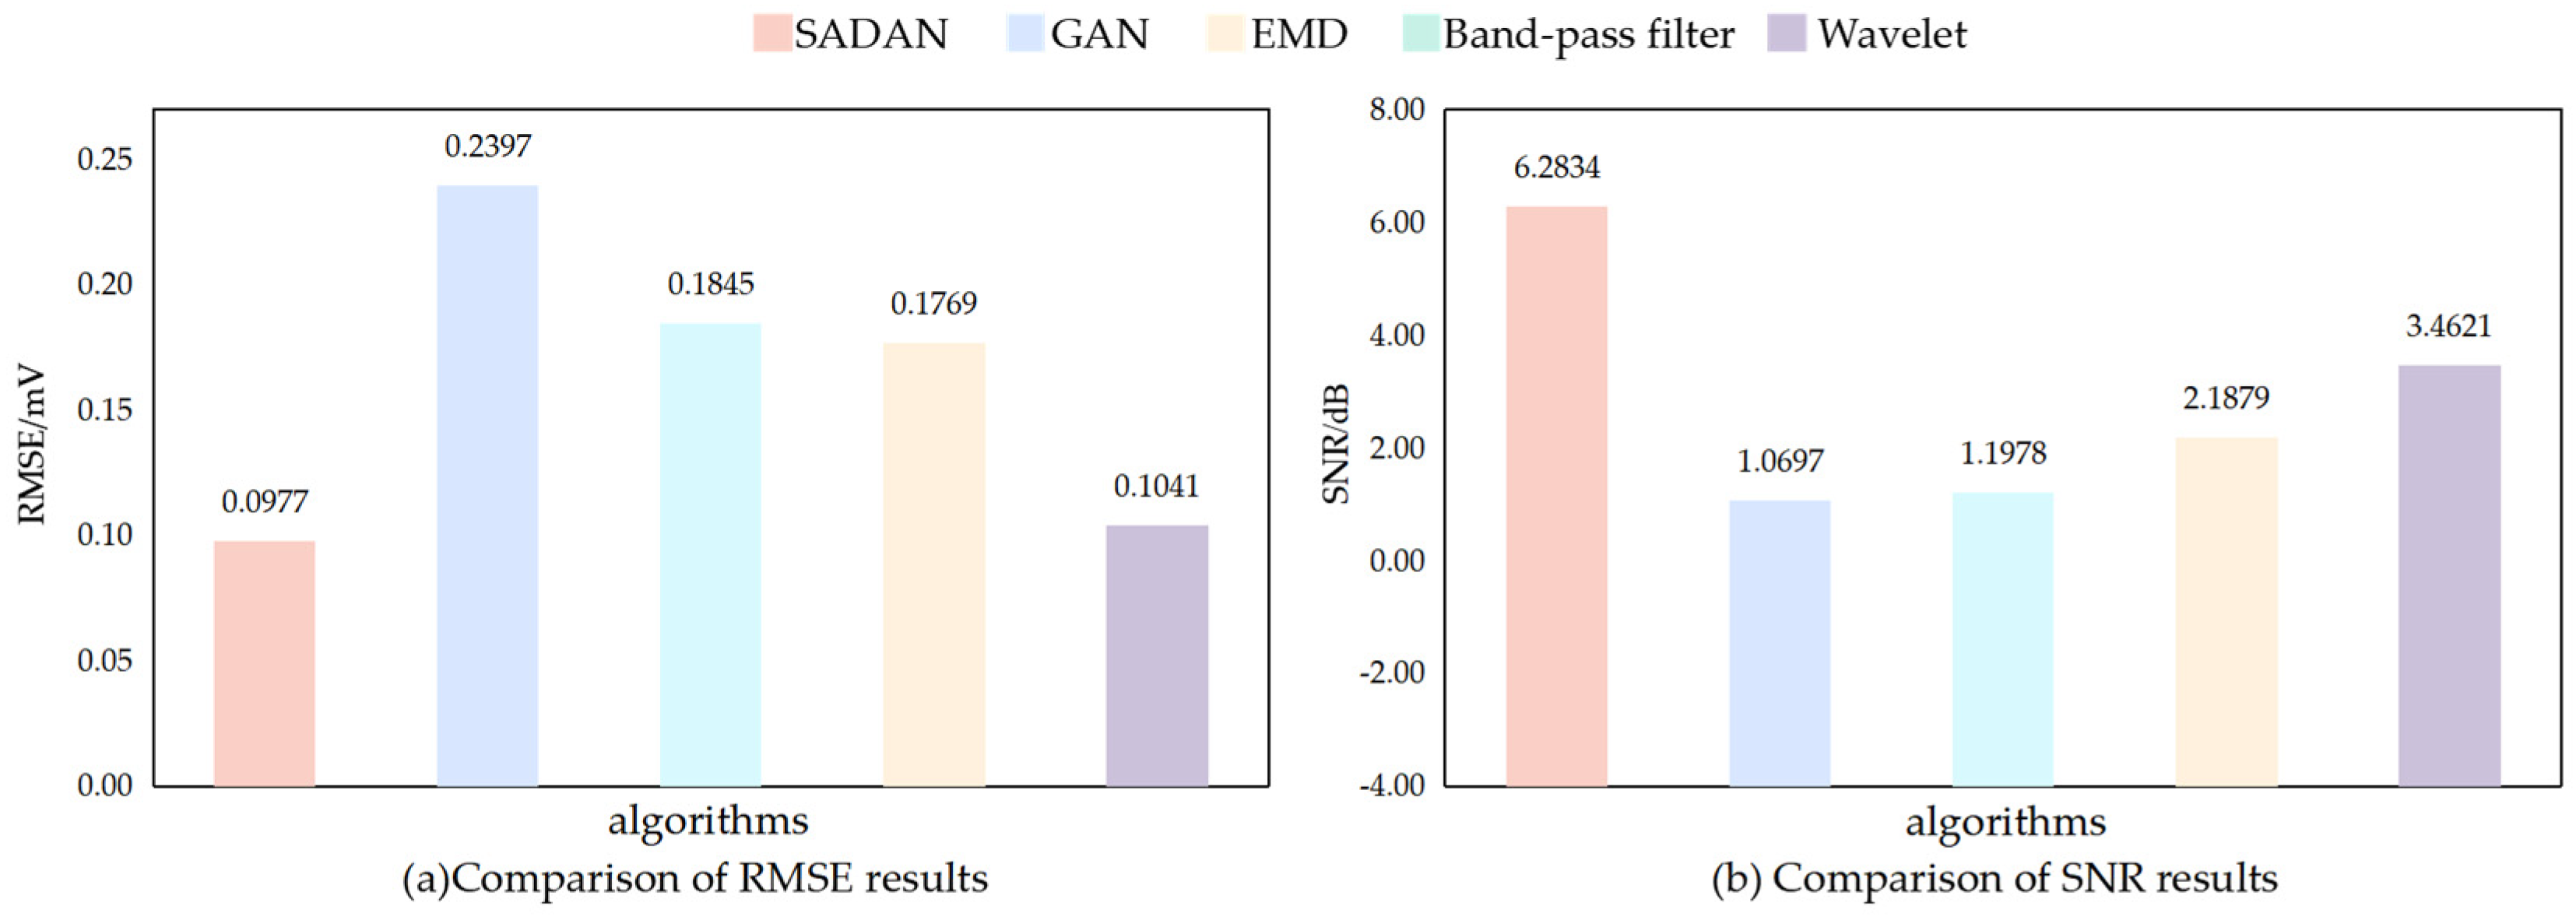
The comparison experiment was consistent with the simulated experiment, compared the GAN, EMD, band-pass filter, and wavelet threshold denoising. The evaluation metrics also used RMSE and SNR. The results in
Figure 7 show that SADAN has the best retention of effective information and the largest SNR improvement in the denoising process.
Figure 8 shows the comparison of the denoised signal output by the SADAN algorithm Denoiser with the original signal and the leakage signal. We chose the same two keys as in the analog experiment to demonstrate the denoising effect. It can be seen that after denoising, the important waveform part containing keystroke information was enhanced in the denoised signal, indicating that the effective information in the leakage signal was strengthened, and the ambient noise was suppressed. Finally, the Discriminator achieved a restoration accuracy of 71.43%.
In order to compare the denoising effect more intuitively, we display the results obtained from the two experiments in
Table 2. From
Table 2, it can be seen that the RMSE and SNR obtained by SADAN represent a better denoising effect in both analog and leakage signal tests. In general, the experimental results show that SADAN can denoise not only the keyboard analog EM signals but also has some practical denoising capability when facing leakage signals in complex EM environments.
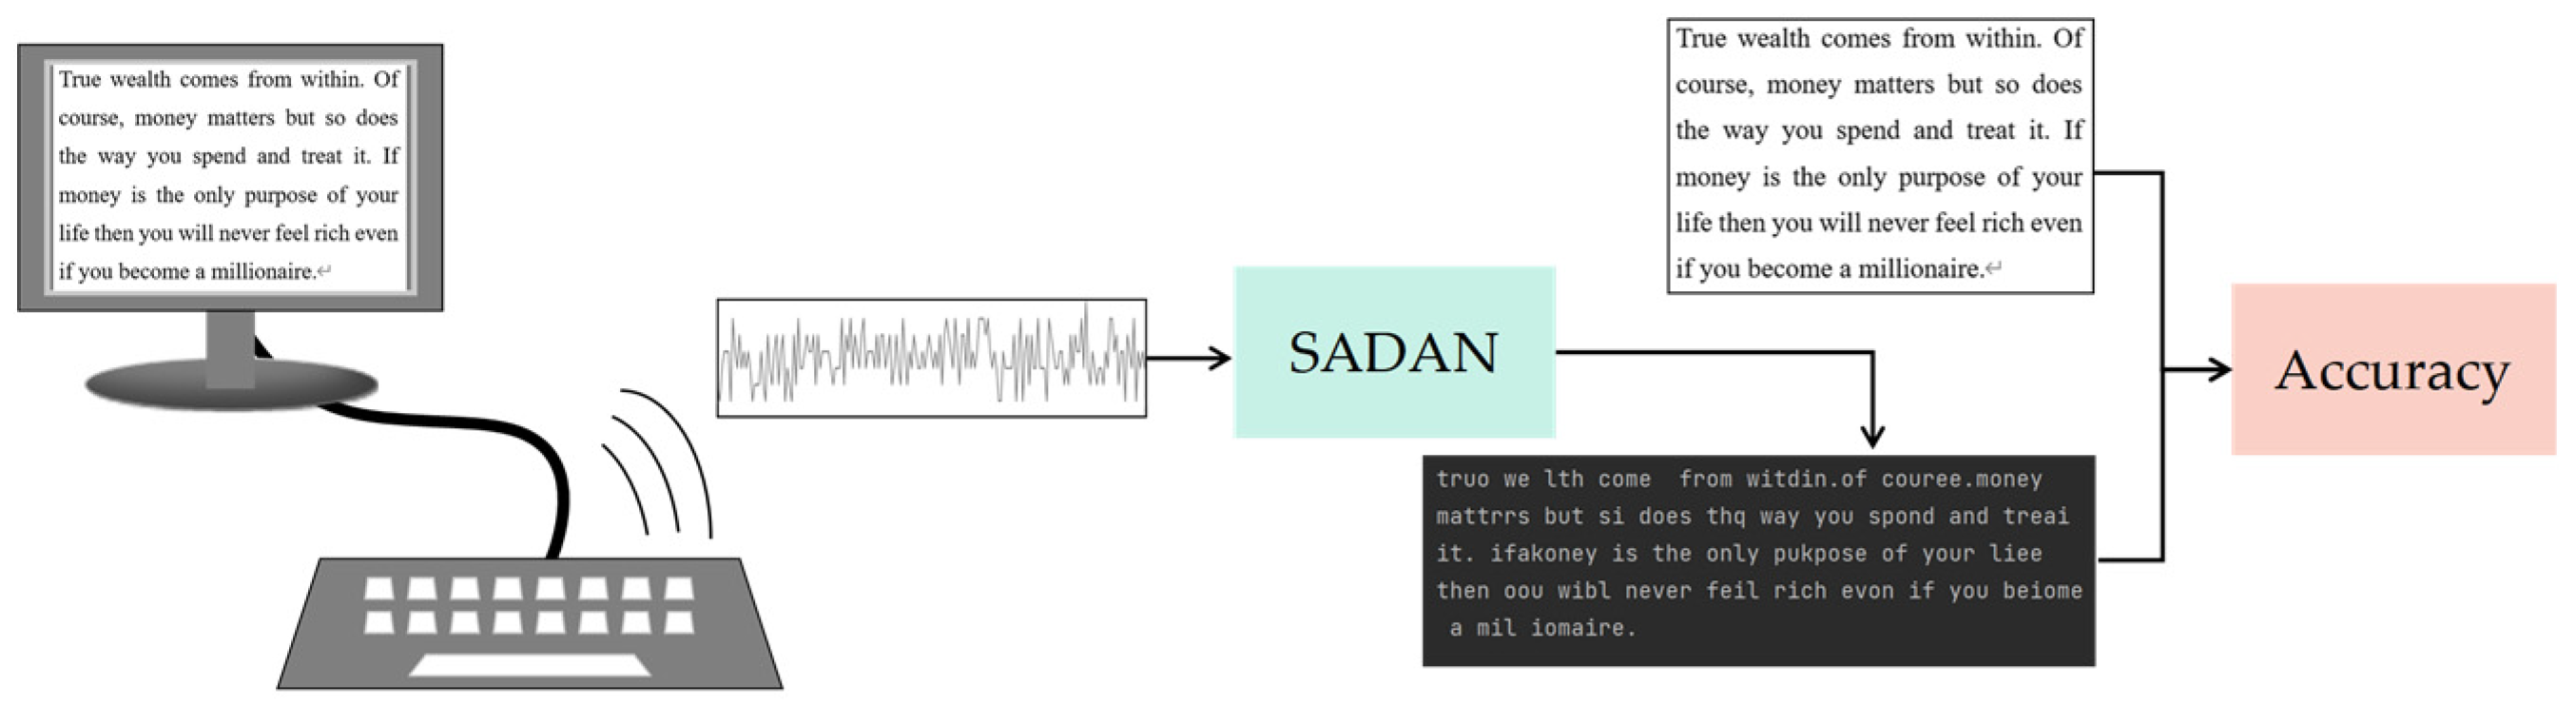
In order to restore the use of a keyboard in a real working scenario, we designed an experiment for the restoration of long text EM messages from the keyboard. We used the test keyboard to enter a piece of text content at normal typing frequency, which included a total of 205 keystrokes.
We intercepted the EM leakage signal emitted by the keyboard in the working process through the RF Current Probe, and after denoising using SADAN, the discriminator restored the information. The experimental flow is shown in
Figure 9. The results are shown in
Table 3. We compared the restoration results with the original input information to obtain the accuracy of the restoration.
The experimental results show that SADAN is also capable of denoising the EM leakage signal in the face of continuous text input from the USB keyboard, which further demonstrates the practical application value of the SADAN.
5. Conclusions
This paper proposes a denoising method based on SADAN for USB keyboard leakage signals in complex EM environments, which uses the adversarial game idea of GAN to treat the denoising process of EM signals as the use of noisy keyboard EM signals to “fake” the denoised signals. We introduced a self-attention mechanism to enable the network to model the long-range relationship between the sample points from a global perspective and to improve the feature learning capability.
We adopted the technical route of simulation followed by real-world verification. Our algorithm suppresses the noise in the noise-containing signal and achieves good noise restoration results compared to other conventional denoising algorithms. The effect graph shows that the signal denoised by SADAN has more obvious characteristics than the original signal. In terms of evaluation metrics, SADAN has the smallest RMSE and the largest SNR improvement. This indicates that while improving the SNR of the signal, SADAN also retains as much valid information in the signal as possible. Finally, we designed an experiment for the restoration of long text EM messages from the keyboard. The result of SADAN achieved an accuracy of nearly 70%. This demonstrates the practical effectiveness of the algorithm for denoising keyboard leakage signals.
We conducted a study on EM leakage signal denoising with the aim of better restoring leakage information. In order to denoise the signal efficiently in the case of low SNR, we design the SADAN algorithm, which is able to better learn the dependencies of the keyboard EM leak signal sequences, model the long-range relationships between the sequence sample points, and reduce the impact of the number of network layers on the relationship acquisition. This not only belongs to the study of signal-denoising methods but also the study of reduction techniques in the field of TEMPEST, which provides theoretical and experimental support for the protection and countermeasures of subsequent device information security vulnerabilities.


