Article

Out-of-Distribution (OOD) Detection and Generalization Improved by Augmenting Adversarial Mixup Samples

1
TWiM Co., Ltd., Hwasung-si 18449, Gyeonggi-do, Republic of Korea
2
School of Artificial Intelligence, Daegu University, Gyeongsan-si 38453, Gyeongsangbuk-do, Republic of Korea
*
Author to whom correspondence should be addressed.
Electronics 2023, 12(6), 1421; https://doi.org/10.3390/electronics12061421
Submission received: 20 February 2023 / Revised: 11 March 2023 / Accepted: 14 March 2023 / Published: 16 March 2023

Abstract

:
Deep neural network (DNN) models are usually built based on the i.i.d. (independent and identically distributed), also known as in-distribution (ID), assumption on the training samples and test data. However, when models are deployed in a real-world scenario with some distributional shifts, test data can be out-of-distribution (OOD) and both OOD detection and OOD generalization should be simultaneously addressed to ensure the reliability and safety of applied AI systems. Most existing OOD detectors pursue these two goals separately, and therefore, are sensitive to covariate shift rather than semantic shift. To alleviate this problem, this paper proposes a novel adversarial mixup (AM) training method which simply executes OOD data augmentation to synthesize differently distributed data and designs a new AM loss function to learn how to handle OOD data. The proposed AM generates OOD samples being significantly diverged from the support of training data distribution but not completely disjoint to increase the generalization capability of the OOD detector. In addition, the AM is combined with a distributional-distance-aware OOD detector at inference to detect semantic OOD samples more efficiently while being robust to covariate shift due to data tampering. Experimental evaluation validates that the designed AM is effective on both OOD detection and OOD generalization tasks compared to previous OOD detectors and data mixup methods.

1. Introduction

Deep neural networks (DNNs) have proven their excellence in a variety of practical applications such as commercializing chatbots to provide convenient Q&A services to customers and unmanned autonomous vehicles [1]. Although DNNs have made great progress in recent years, the many failed examples reveal the vulnerability of the model when dealing with differently distributed data [2]. Most existing DNN models are trained based on the i.i.d. (independent and identically distributed) assumption where the test data is assumed to be drawn independently from the same distribution as the training data, known as in-distribution (ID) [3]. However, when models are deployed in a real-world scenario, test samples may be out-of-distribution (OOD), and therefore, there are growing issues related to the reliability and safety of DNNs utilized in real-world applications.
Especially in safety-critical systems, high reliability should be guaranteed for predictions because any wrong prediction may lead to a large number of casualties. A trustworthy DNN-based visual recognition system used in autonomous driving, medical diagnosis, or re-identification applications [4,5,6], should not only produce accurate predictions on known context but also detect unknown samples, and the DNN model should not make any prediction on unknown data [3]. For example, in medical diagnosis, the model should hand them over to human experts for safe and reliable handling instead of blindly predicting them.
Both OOD detection and OOD generalization are critical to ensuring the reliability and safety of DNNs. OOD samples with distributional shifts away from the training data can be caused by either semantic shift (e.g., OOD samples drawn from different classes) or covariate shift (e.g., OOD samples drawn from a different domain or corrupted samples due to data tampering) [3]. The OOD detection task focuses on detecting a semantic shift due to the occurrence of unknown classes and classifies ID and OOD data from input through a model. In addition, a real-world safe and reliable DNN should be robust to the covariate shift while being aware of the semantic shift [3]. However, most existing works pursue these two goals separately [2,3,7,8]. Figure 1 describes the OOD detection problem [9] and OOD generalization problem [10], respectively.
First, the OOD detection problem is caused by the notorious overconfidence phenomenon. The last layer of the DNN model uses the softmax function, in general, to predict a classification output by mapping a probability value into each class between 0 and 1, known as the confidence score. The model can predict correctly by allocating the highest confidence score when the data with similar attributes to the training data are input. However, even when the data are entirely unrelated to the training data such as OOD, it may make incorrect predictions due to overconfidence which deduces a wrong output with almost probability 1. Figure 1a shows the misclassified OOD samples when some noise images are input to the model trained with MNIST and ImageNet, respectively.
Second, in the case of the OOD generalization problem, test data can be slightly corrupted because of different environmental factors due to weather, illumination, or defocusing. The human vision system is quite robust to the above-mentioned data tampering. Humans easily recognize the original object even after such negligible data tampering because the attributes of the corrupted image do not change. However, a DNN-based machine vision system is quite sensitive to a little data corruption as depicted in Figure 1b. In this work, OOD generalization is assumed to be a problem concerned with whether or not a model learned from the training data can perform well on unseen test data with covariate shift.
Several training or inference methods have recently been studied to solve the above problems of OOD detection and OOD generalization [11,12,13,14,15,16,17,18,19,20,21,22,23,24,25,26,27,28]. However, most of the previous works only focus on one side of distributional shifts, either semantic OOD detection or covariate OOD generalization. This paper proposes a distance-aware adversarial mixup (AM) OOD detector to classify semantic OOD samples while being robust to negligible covariate shift. Full spectrum OOD detection highlights the effects of covariate-shifted in-distribution and shows that most existing OOD detectors are susceptible to covariate shift rather than semantic shift [3,29]. This paper proposes a simple and novel OOD sample augmentation technique to increase the generalization capability of OOD detectors and analyzes how OOD detection and OOD generalization can better enable each other, in terms of both algorithmic design and comprehensive performance evaluation [3].
We argue that the reason why the existing model failed when dealing with differently distributed data is due to overconfidence because the model was never taught how to handle OOD samples [8]. To mitigate the problem, this paper proposes a novel AM training method that simply executes OOD data augmentation to synthesize differently distributed data and designs a new AM loss function to learn how to handle OOD data. The main idea is to make input significantly diverge from the support of training data distribution but not completely disjoint. The proposed AM simply combines an idea of existing data mixup with adversarial training to generate new adversarial OOD samples so that the model may provide higher reliability for OOD data. Furthermore, the AM is combined with a distributional-distance-aware OOD detector at inference to detect semantic OOD samples more efficiently while being robust to covariate shift due to data tampering. The experimental results validate that the designed AM is quite effective on both OOD detection and OOD generalization tasks compared to previous OOD detectors and data mixup methods, by using a variety of benchmarking datasets for both tasks.
The major contributions of this paper are the following: (1) We provide a novel unified insight trying to solve both problems of OOD detection and OOD generalization simultaneously for more reliable and safe DNNs robust to covariate shift. (2) To this end, this paper proposes a simple training strategy called adversarial mixup (AM) that can effectively solve both OOD detection and OOD generalization tasks. (3) Furthermore, the data augmentation capability of the proposed AM method makes its OOD generalization performance increase as well.
This paper is organized as follows. Section 2 describes the previous related works in the fields of OOD detection and OOD generalization. Section 3 presents the proposed AM training method in detail and explains how the proposed method differs from conventional data mixup and adversarial training methods. Section 4 provides a methodology, the datasets, and evaluation metrics used in experimental environment. Section 5 analyzes the evaluation results and validates a superior performance of the proposed method including diverse ablation studies. Finally, Section 6 concludes and discusses a future research direction.

2. Related Works

Lots of previous studies have been conducted in various directions to solve the problems related to OOD detection and OOD generalization [11,12,13,14,15,16,17,18,19,20,21,22,23,24,25,26,27,28]. For OOD detection, a decision boundary that distinguishes OOD data by training the model is automatically discovered to induce a low confidence score of OOD data, thus producing reliable inference results. Using a pre-trained model helps find hyper-parameters that induce the confidence score of OOD data to be low by applying some heuristics. OOD data are detected by comparing the output of the model with a series of reference threshold values. For OOD generalization, most of the studies are conducted on augmentation techniques in which various types of data can be arbitrarily generated for training in a fixed training dataset environment.

2.1. OOD Detection and Generalization Methods

OOD detection methods involve model training. One of the studies used a generative adversarial network (GAN) to arbitrarily generate OOD data having a similar distribution as that of the data used for training and proposed a loss function that induces a low confidence score for the generated data [11]. Another study proposed a method of outlier exposure (OE) where model parameters are finely adjusted by intentionally adding the data consisting only of OOD data during the training of the model [12]. Among all the methods, supervised learning exhibits the best OOD detection performance but entails significant overhead during the data labeling process for training.
Using an autoencoder is a common unsupervised learning method where reconstruction error between original data and reconstructed data is calculated to distinguish in-distribution (ID) and OOD data by comparing the error with a specific threshold value [13]. Self-supervised outlier detection (SSD) combines supervised learning with OOD detection in which contrastive learning was applied where the vectors with similar features become closer [14]. SSD also measured outlier scores and utilized additional OOD datasets to show the possibility of improving OOD detection performance [15]. Methods based on unsupervised or semi-supervised learning do not have any overheads during data labeling. However, the performance is lower than that of supervised-learning-based methods. Therefore, the methods appropriate for specific circumstances need to be selected for designing OOD detection models.
Various methods have been proposed to solve OOD detection problems by using pre-trained models. The maximum softmax probability (MSP) method designates the largest confidence score as the threshold value and OOD data are detected by comparing the confidence score and the data input during the inference process [16]. The ODIN method using an OOD detector for neural networks induces a low-confidence score for OOD data by applying a pre-processing step to remove small perturbation that causes misclassification of DNN in the input data [17]. Using a pre-trained model may not be highly universal as the hyper-parameters used during the inference process vary depending on the type of OOD data.
Clustering in DNNs occurs among the data points having similar features as training is repeated. Based on this property, distance-aware OOD detection methods to measure the distance between data clusters were proposed [18,19]. When the distance measuring method is used, the data having the same type as the data used for training are measured to be relatively closer, or farther otherwise. Based on this principle, a previous study compared the OOD detection performance using the Euclidean method, which measures the distance between data distributions, and the Mahalanobis Distance (MD) method, in which statistical modeling of data distribution is applied [18]. Another study proposed a method where a confidence score is calculated using the MD method instead of the softmax function in the last layer of a DNN to solve the overconfidence problem that occurs due to the monotonic increasing of an exponential function when the conventional softmax function is used [19]. An appropriate layer should be selected as the performance of the distance measuring method varies depending on the location of the layer from which feature maps of DNN are extracted.
Additional OOD detection studies [20,21,22] have recently been proposed to focus only on detecting semantic shifts, such as most previous OOD detectors sensitive to covariate shift. This paper proposes a distance-aware AM method detecting semantic OOD samples while being robust to negligible covariate shift.

2.2. Data Augmentation Methods

All the data existing in the real world may be transformed naturally or artificially. Ideally, the inherent characteristics of data do not change even when the data is transformed. Thus, the DNN must be able to classify as the original class. However, a model trained with fixed data lacks diversity, which may result in misclassification as another class. Several studies have been conducted on the augmentation of learning data to solve this problem.
The CutOut [23] method involves cutting out a portion of an image of a specific class, while the CutMix [24] method involves attaching an image cut from a specific class to an image of a different class for ensuring weights are given to other parts of an object without training using biased data. Both methods involve cutting a specific part of an image, which may result in losing an essential part of data or affect the performance depending on the size of the window for cutting an image.
The mixup [25] method, in which two data types are mixed at a certain ratio instead of cutting or attaching. The AugMix [26] method, in which multiple types of data applied with various augmentation techniques are mixed, and the MTLAT [27] method, in which the robustness to tampering is strengthened by arbitrarily adding noise to the data applied with augmentation, have been proposed. These three methods overcome the drawbacks of CutOut and CutMix methods and improve the generalization performance. However, it is inefficient to apply different methods to different cases every time as it is uncertain which augmentation scheme is optimal for the data of the same class with various characteristics. The Auto-Augment [28] method, thus, involves automatically finding the optimal augmentation scheme for various transformation functions such as rotation by using a search algorithm.
The proposed adversarial mixup (AM) method is presented in Section 3 to simultaneously solve both OOD detection and OOD generalization problems explained thus far. The AM method can not only resolve the problems occurring due to the softmax function and hyper-parameters used for inference but also improve the OOD generalization performance through effective data augmentation.

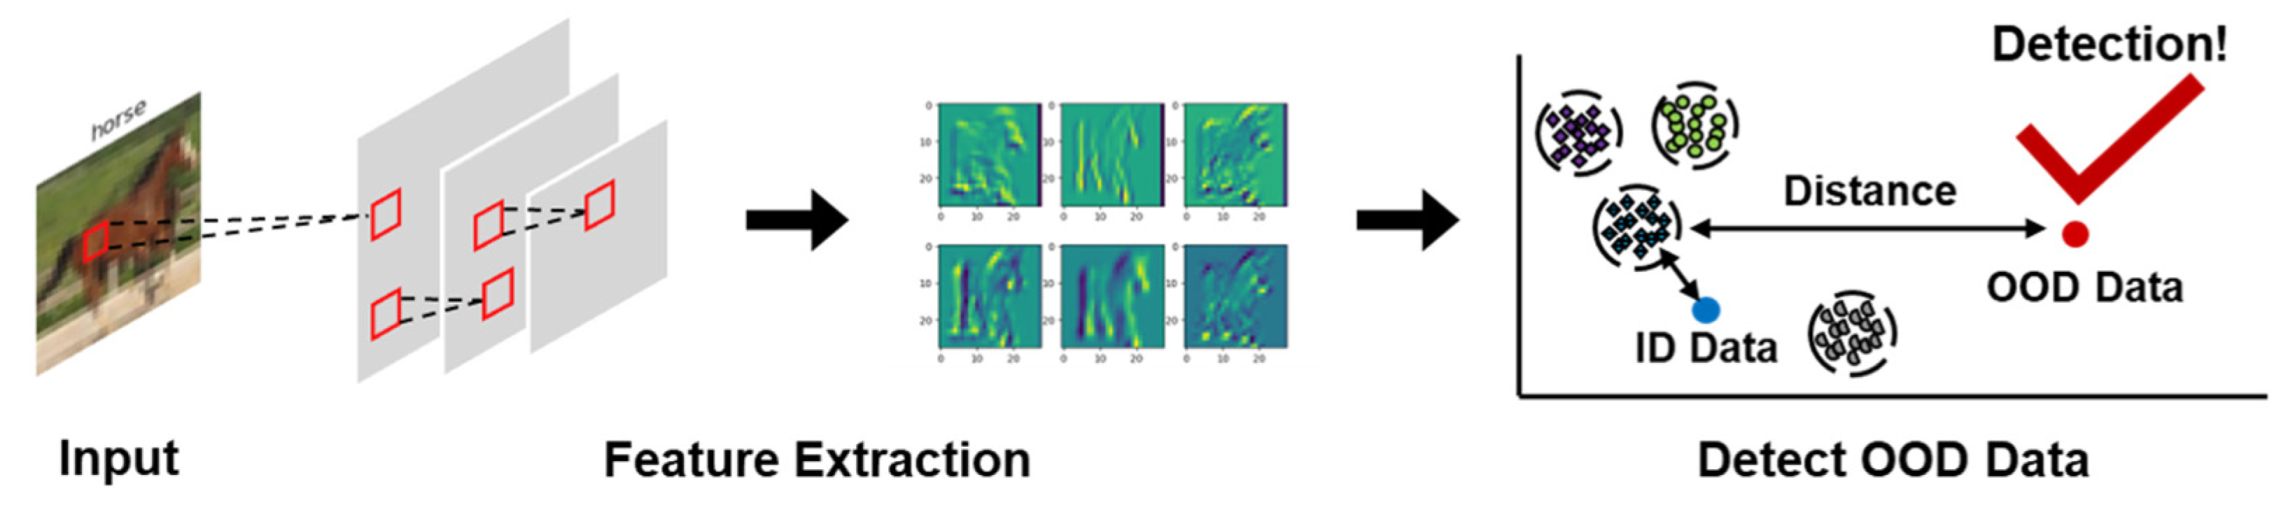
3. Distance-Aware OOD Detection with Adversarial Mixup Training
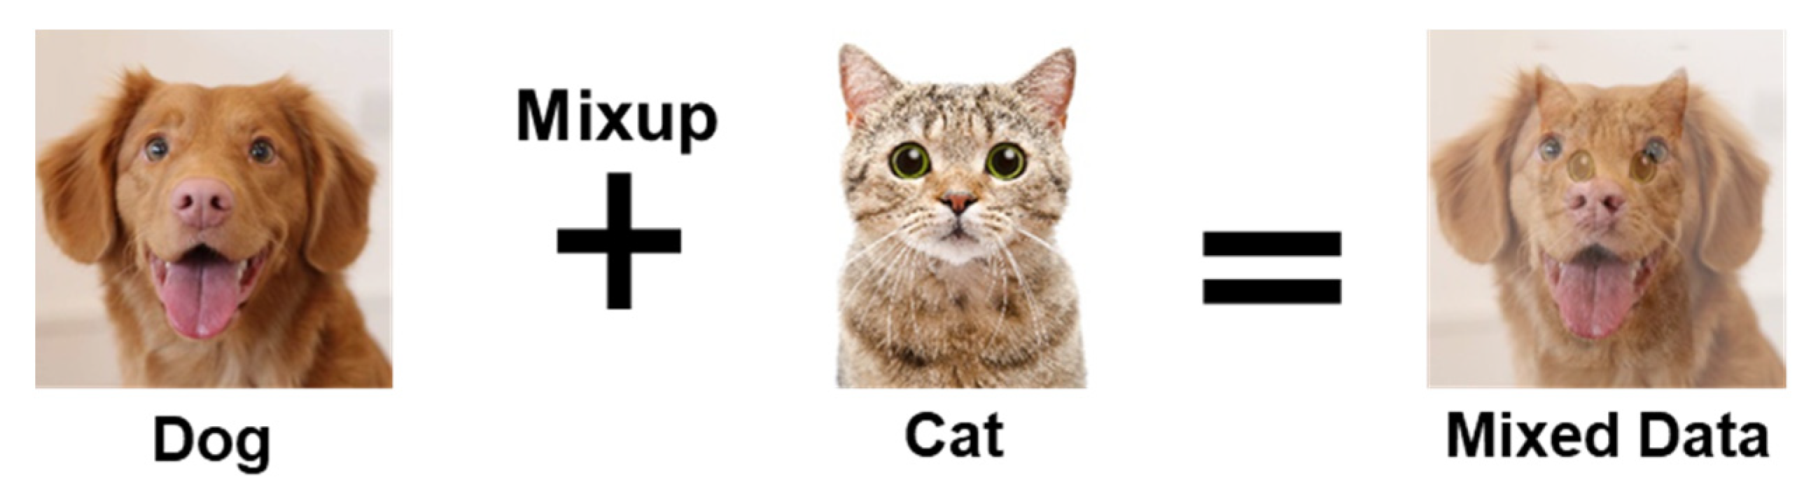
The data mixup and adversarial training techniques used in the proposed AM method are presented in detail in this section. In addition, a distance-aware method for combining the AM-based OOD detector with Mahalanobis Distance is presented for solving the overconfidence problem, which can be exploited when the softmax function for calculating the confidence score during inference is used.

3.1. Data Mixup

DNNs aim to find a parameter θ that minimizes the loss by identifying the relationship between data X and the label Y. An ideal situation is when data X includes the information of all objects, which is realistically impossible. Thus, the data collected from a limited environment is used. Minimizing the loss using the data given from a specific environment is called empirical risk minimization (ERM).
In the ERM, a model memorizes the data itself because it is trained with data of limited distribution. Therefore, this method is vulnerable to untrained data distribution where OOD or transformed data are input due to the overfitting phenomenon from bias toward the fixed distribution. For solving this issue, vicinal risk minimization (VRM) was proposed, wherein the features in the vicinity of the training data distribution are also trained outside a limited space [30].
Data augmentation is a common method for obtaining information around a specific space and generates data similar to a given sample. A virtual sample that is arbitrarily created is used along with the existing training data for obtaining data diversity and has been proven to improve generalization performance by preventing overfitting [25]. In addition, VRM achieved higher performance in OOD detection than ERM-based models in the experiment described in Section 5.2. Mixup is a popular data augmentation method in which two pairs of training data are randomly selected and mixed at a certain ratio to create a new sample, as shown in Figure 2.
Equation (1) shows how mixed-up data are generated in the mixup method.
x ~ = λ x i + 1 λ x j , y ~ = λ y i + 1 λ y j
where x i , y i , ( x j , y j ) represent two randomly selected data and corresponding answers, and λ is a weight coefficient determining the data mixup ratio. The amount of information being mixed can be flexibly adjusted.

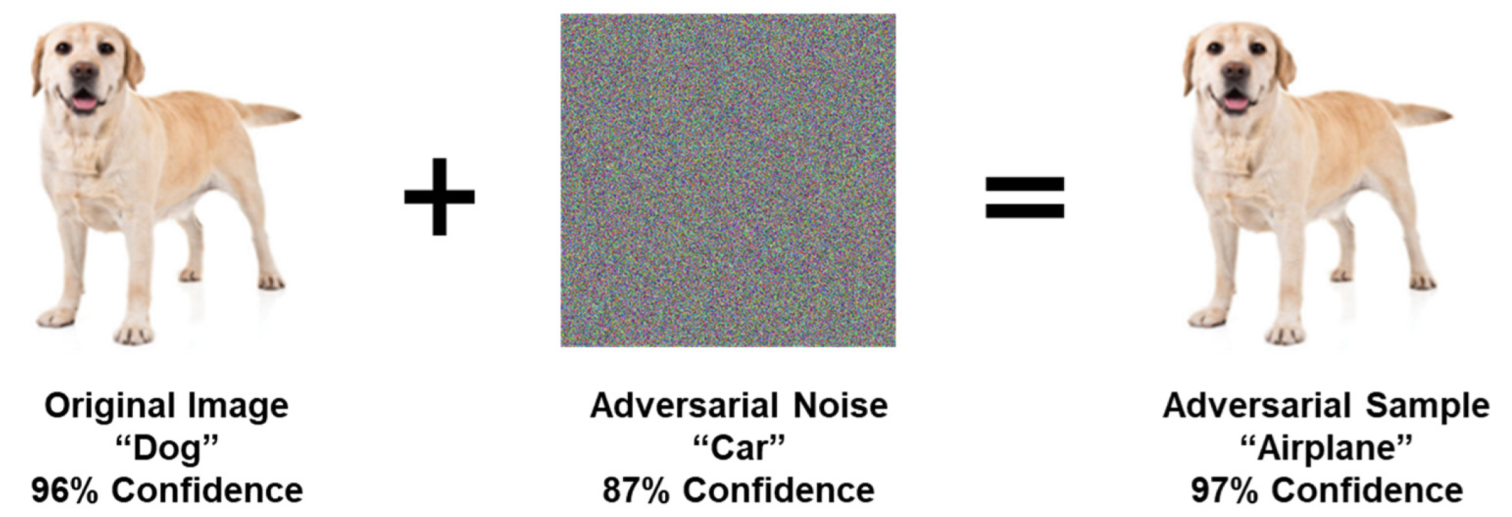
3.2. Adversarial Training

DNN technology has advanced far enough to exceed the visual cognition ability of humans, but several problems arising from the vulnerability of models have been discovered in many studies [31]. Figure 3 shows an example of the problem where DNN completely misclassifies the data of the adversarial sample mixed with the original image and adversarial noise, as shown in the far-right image, based on overconfidence.
Inducing misclassification of DNN using adversarial perturbation is called adversarial attack. The fast gradient sign method (FGSM) is a common adversarial attack method in which a small perturbation obtained by calculating the gradient in the direction of increasing the loss during a backward pass is added to the original data x . Therefore, misclassification is induced by entering the decision boundary of a different class instead of the original class.
When x is the original data, ϵ is the intensity of generating an adversarial sample, and J θ , x , y is the loss function of DNN, Equation (2) below shows a method for generating the adversarial sample x a d v .
x a d v = x + ϵ s i g n x J θ , x , y
As shown in Figure 3, the accuracy of a trained model is substantially reduced by adding a small perturbation in the input data. When the FGSM attack is applied to the models trained with MNIST and CIFAR10, the accuracy considerably decreases from 98% to 40% and from 93% to 40%, respectively, regardless of the data type or model size. Other kinds of adversarial attacks include basic iteration [32] for which FGSM is repeated n times and using an adversarial patch. Several studies have been conducted on defense mechanisms for preventing the accuracy of a DNN from being degraded by adversarial attacks. If the adversarial perturbation generated by the FGSM induces misclassification, the adversarial training involves training adversarial attacks along with the original data to defend against attacks [33]. This method increases robustness to adversarial attacks while simply improving the generalization performance by training the additional data instead of using supplementary methods such as proposing a new training algorithm.

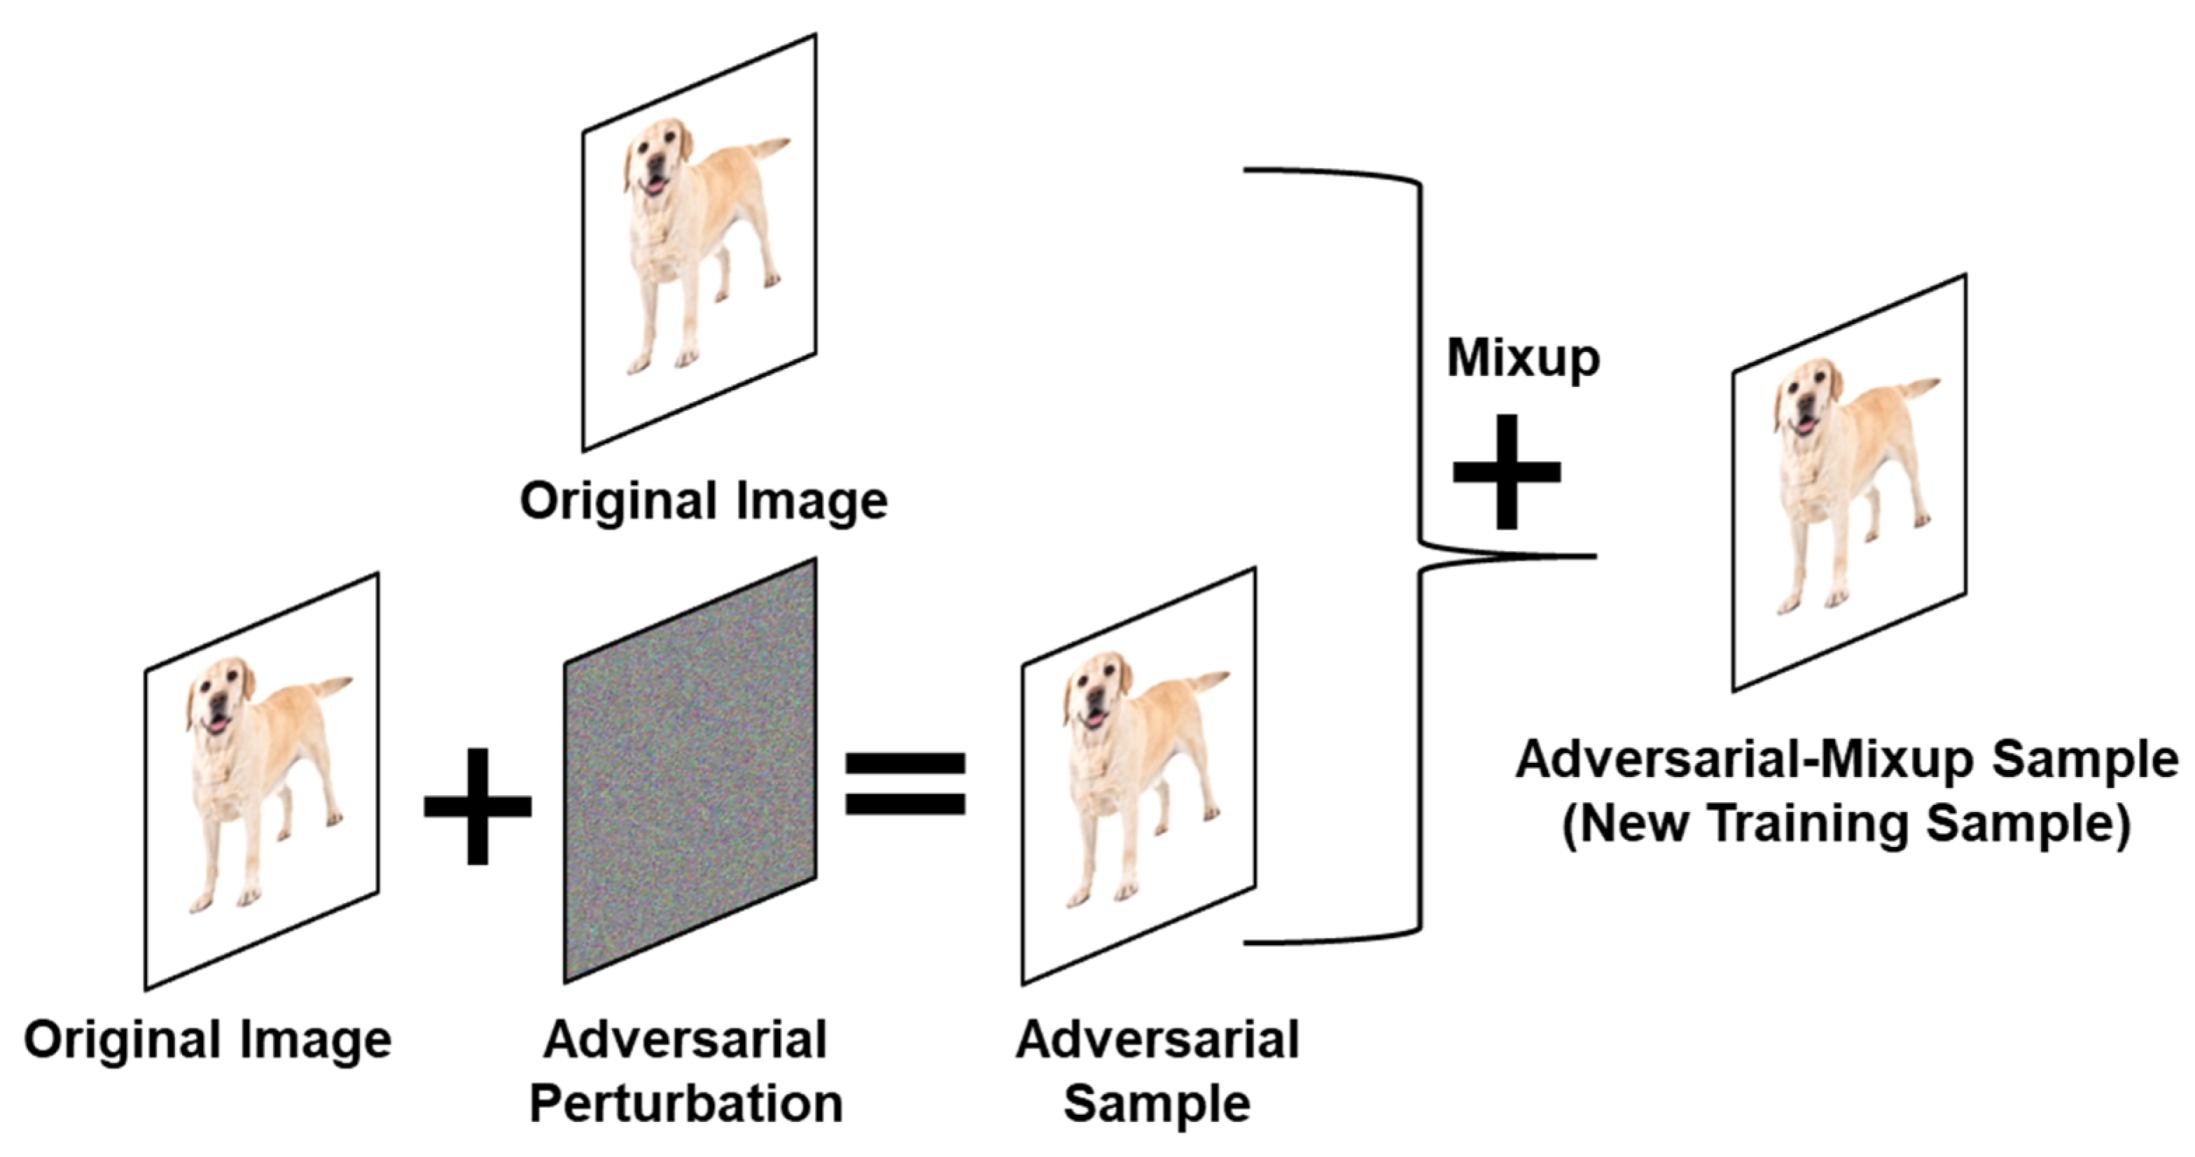
3.3. Generating Adversarial Mixup OOD Samples

Using a pre-trained model to design DNN for OOD detection can save time and cost for training a model and result in high OOD detection performance if appropriate hyper-parameters are chosen. However, this method assumes ERM where certain techniques such as data augmentation are not applied. As mentioned in Section 3.1, ERM-based models are only trained with limited data distributions, and thus they are vulnerable to OOD or tampered data. Even if training is perfectly performed and the hyper-parameters used for detecting OOD or tampered data are optimized, the characteristics of various environments are not taken into consideration because the models are only applicable to data distribution within a certain range.
This paper, therefore, proposes an adversarial mixup (AM) training algorithm based on VRM for overcoming the limitations of ERM-based OOD detection models. In this method, data mixup is effective to improve generalization performance with data augmentation, which, combined with adversarial training, is helpful in strengthening the robustness of DNN. The advantage of combining both techniques is that data mixup provides efficient data augmentation regardless of data type and improves generalization performance, while adversarial training clearly distinguishes the decision boundary between ID and OOD. Unlike the conventional data mixup methods generating mixed-up data only for the given data, the proposed AM has a distinction of arbitrarily generating adversarial samples to be mixed with the original data in a certain mixup ratio. Therefore, it can train more expanded marginal distribution than previous mixup methods by providing a strategy to additionally train the data having various characteristics in realistic conditions where data can only be trained in a limited environment.
Figure 4 shows the schematic diagram of the AM method proposed in this paper where a new training sample is created by mixing the adversarial sample generated from the FGSM attack and the original data at a certain ratio. Original data is combined with the adversarial sample x a d v generated based on Equation (2) to ultimately create an AM sample x a m as shown in Equation (3).
x a m = λ x x + 1 λ x x a d v ,
where λ x represents a random number extracted from Beta distribution B α , β 0,1 and the data mixup ratio is determined by two seed numbers α , β . Two seed numbers being identical is referred to as symmetric Beta distribution where random numbers of a symmetrical structure are generated so that the data can be mixed up at a certain ratio.
For the loss function used in AM training, the cross-entropy loss widely used for classification is mixed up with the original data and AM sample as shown in Equation (4).
l t o t a l = λ l l i n θ ; x , y + 1 λ l l a d v θ ; x a m , y
where l i n indicates the loss of the original data, l a d v indicates the loss of the adversarial sample data. In the AM method, a random number λ l extracted from symmetrical Beta distribution is used in the linear weighted sum of loss values to prevent the loss value of one data type from being biased.

3.4. Mahalanobis-Distance-Based OOD Detector

To infer the output y for the input data x during the inference process of DNN, the output values of the model are mapped with the probability values of each class using the softmax function in the last layer for the classification task. An exponential function used for the softmax function has the advantage of clarifying probability values of each class as well as easily computing derivatives during backpropagation. However, the monotonic increasing nature of an exponential function also has a disadvantage of the overconfidence problem by deducing a high confidence score for OOD data. To solve this problem, an OOD detection method through density function estimation for identifying essential characteristics of data has been proposed instead of directly inferring the output for the input as the softmax function in the last layer of DNN [19].
Estimating the distance between data clusters using a distance measuring method is a typical density function estimation method. Euclidean and Mahalanobis distance (MD)-based methods are commonly used for distance measuring, but the Euclidean distance method cannot efficiently detect OOD data because it simply measures the distance between two data clusters in a multidimensional space [18]. The MD method, in contrast, considers distributional characteristics by calculating how dispersed the input data is from the population by computing the covariance which represents the correlation between two random variables. Equation (5) defines the MD, where x is the input data, m is the mean of data population, C o v 1 is the inverse matrix of covariance for the population, and the operator · represents a matrix product.
D = x m · C o v 1 · x m T
Using the MD for OOD detection involves distinguishing ID and OOD by comparing them with a specific threshold value based on the distance calculated by Equation (5). The AM method is used in the training process and combined with the Mahalanobis-distance-based OOD detector in the inference process. The proposed distance-aware AM method automatically finds efficient training parameters for OOD detection so that it may not only gain further performance improvement but also detect OOD abnormal situations effectively, different from the previous studies. Figure 5 describes a functional architecture of the MD-based OOD detector, which distinguishes ID Data from OOD Data by measuring the Mahalanobis distance based on the feature extracted from the input data.

4. Experimental Methodology

4.1. Datasets Configuration

A different type of dataset is used for evaluating the proposed AM training algorithm according to OOD detection and OOD generalization tasks. Both tasks have different data characteristics as shown in Table 1.
From a realistic perspective, the range of OOD cannot be assumed as OOD is constituted at a much higher rate than ID, and the characteristics of the data input in the inference process are unknown. Therefore, different data types were configured for training and inference in the experiment on OOD detection. For example, if CIFAR10 is used for training, all the remaining datasets excluding CIFAR10 on the left column in Table 1 are input during the inference process. CIFAR10 is a dataset containing nature images such as animals and objects and consists of 10 classes, while SVHN consists only of three-channel digit data from 0 to 9. ImageNet is the largest open dataset with a total of 1000 classes and more than one million pieces of data. The large-scale scene understanding (LSUN) dataset contains the data of specific places such as a tower or kitchen, which have been collected to help understand scenes. The iSUN dataset contains a portion of the LSUN dataset. Both ImageNet and LSUN use cropped and resized versions of the original data.
In the experiment on OOD generalization, the same data type as the one used for training is selected, but a dataset containing images with tampering such as blurring or noise is used. CIFAR10-C was mostly used with 15 types of corruptions applied to the original data, including noise, blurring, weather, and digital type. Other datasets include ObjectNet, which contains the data of observing one object from various arbitrary perspectives, and ImageNet-C, -P, and -V2, which applied corruption or perturbation to the original ImageNet or contains the data that could not be classified by the existing model, respectively. The CIFAR10-C dataset is only used in this paper for evaluating the performance of OOD generalization.

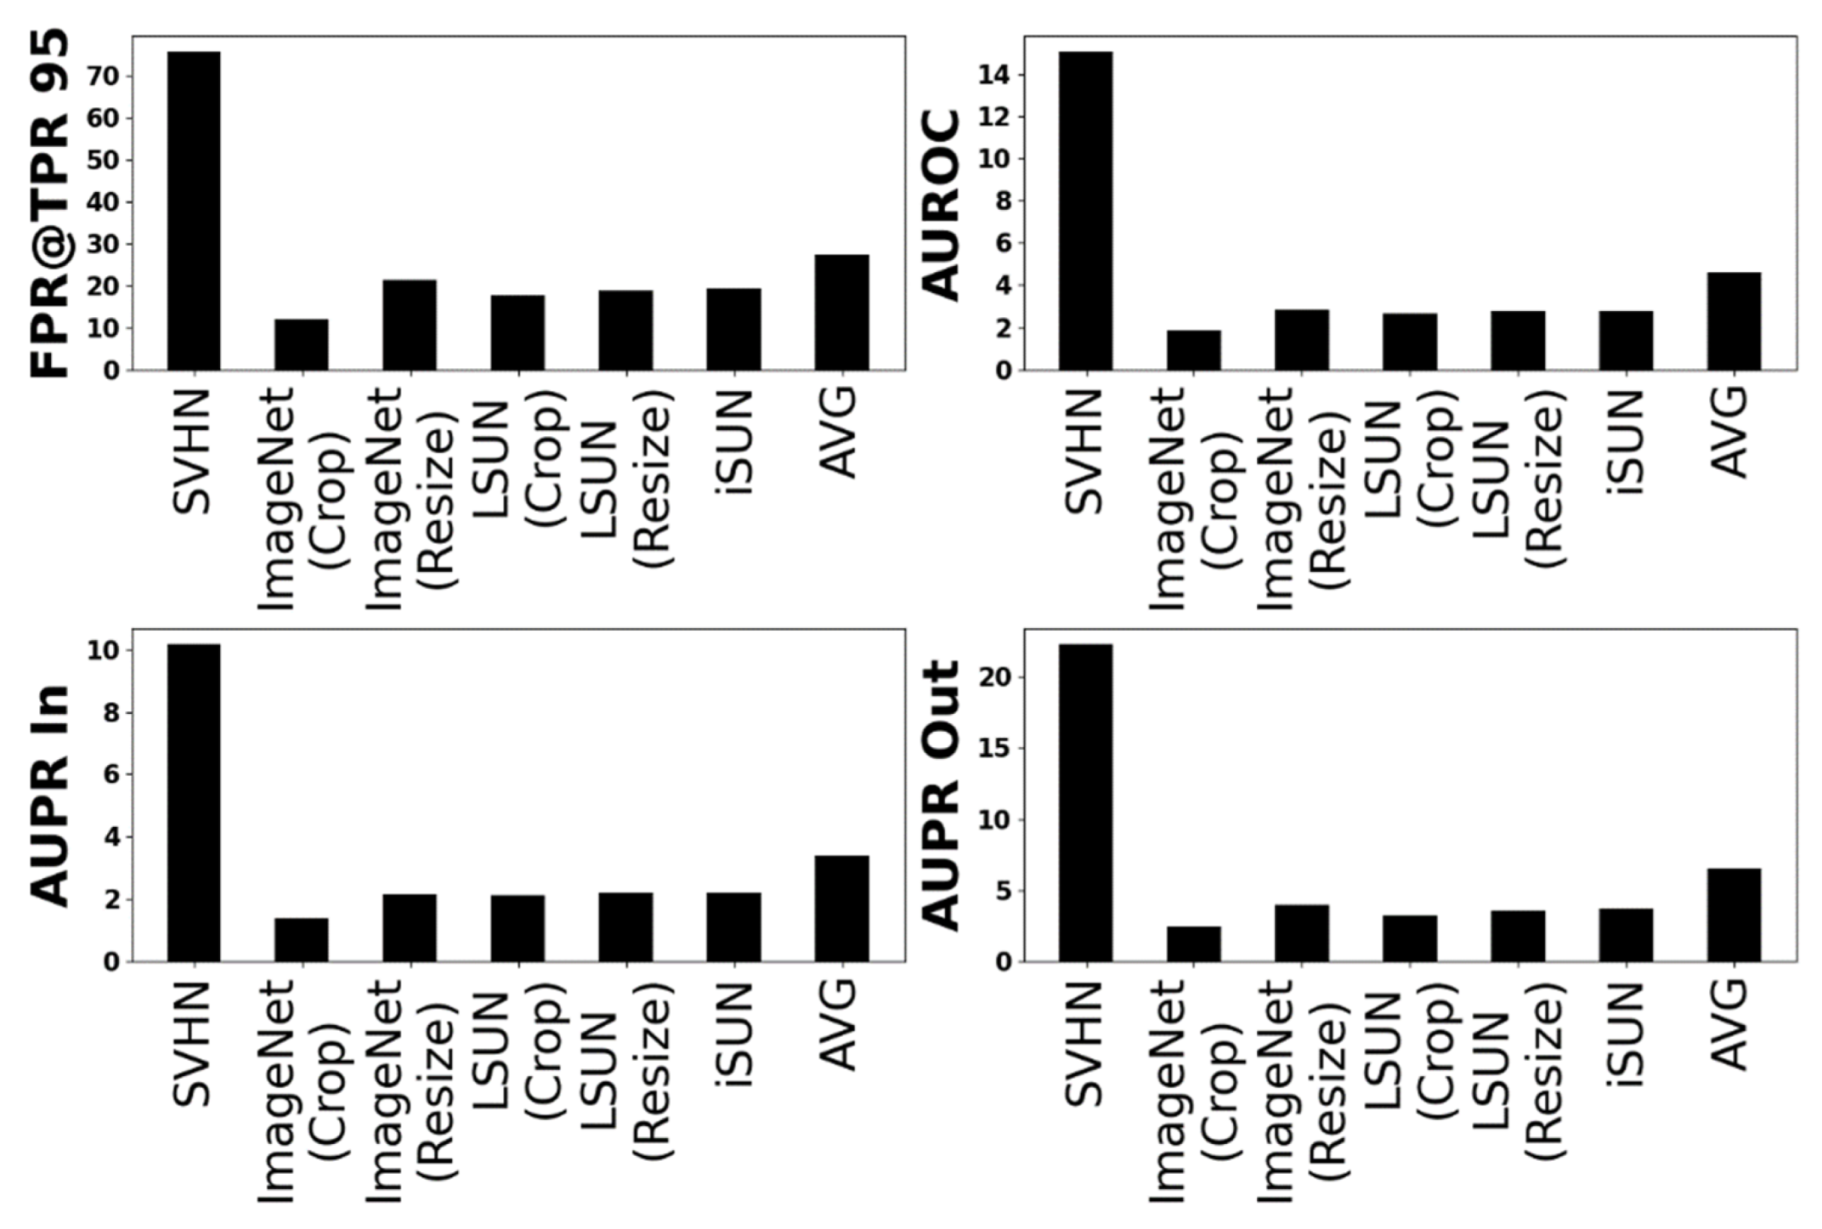
4.2. Evaluation Metrics

In OOD detection, a general binary classification framework is used where the input data distinguishes ID and OOD. Four scenarios may occur in binary classification, as shown in Table 2, depending on the actual answer and the prediction result of the model. ID and OOD in the table represent in-distribution and out-of-distribution, respectively.
For OOD detection, the performance of the algorithm is evaluated in terms of FPR@TPR 95, area under the receiver operation characteristic (AUROC), and area under the precision recall (AUPR), respectively. FPR@TPR 95 represents the false positive rate (FPR) when the true positive rate (TPR) is 95%. The better OOD detector must have a higher TPR and lower FPR. The AUROC evaluates the performance of a binary classifier and depends on various threshold values based on the receiver operation characteristic (ROC) curve. The AUROC visualizes the detection performance by comparing an area under the ROC curve. The AUPR is an index where precision (that is, the rate of actual OOD data among the OOD data predicted by the model) and recall (that is, the rate indicating how well the model detects OOD among the actual OOD data) are visualized in one graph. This index also involves finding an area under the precision recall (AUPR) curve for the evaluation. The AUROC and AUPR closer to 1 indicate higher performance for both methods. In OOD generalization, a correct prediction must be made for the original class even when the data is corrupted, and the minimum loss must be recorded using the original accuracy. In recent studies, both corruption error (CE), an error rate of each tampering subtracted from 100, and its mean, the mean corruption error (mCE), have been used.

5. Experimental Evaluation

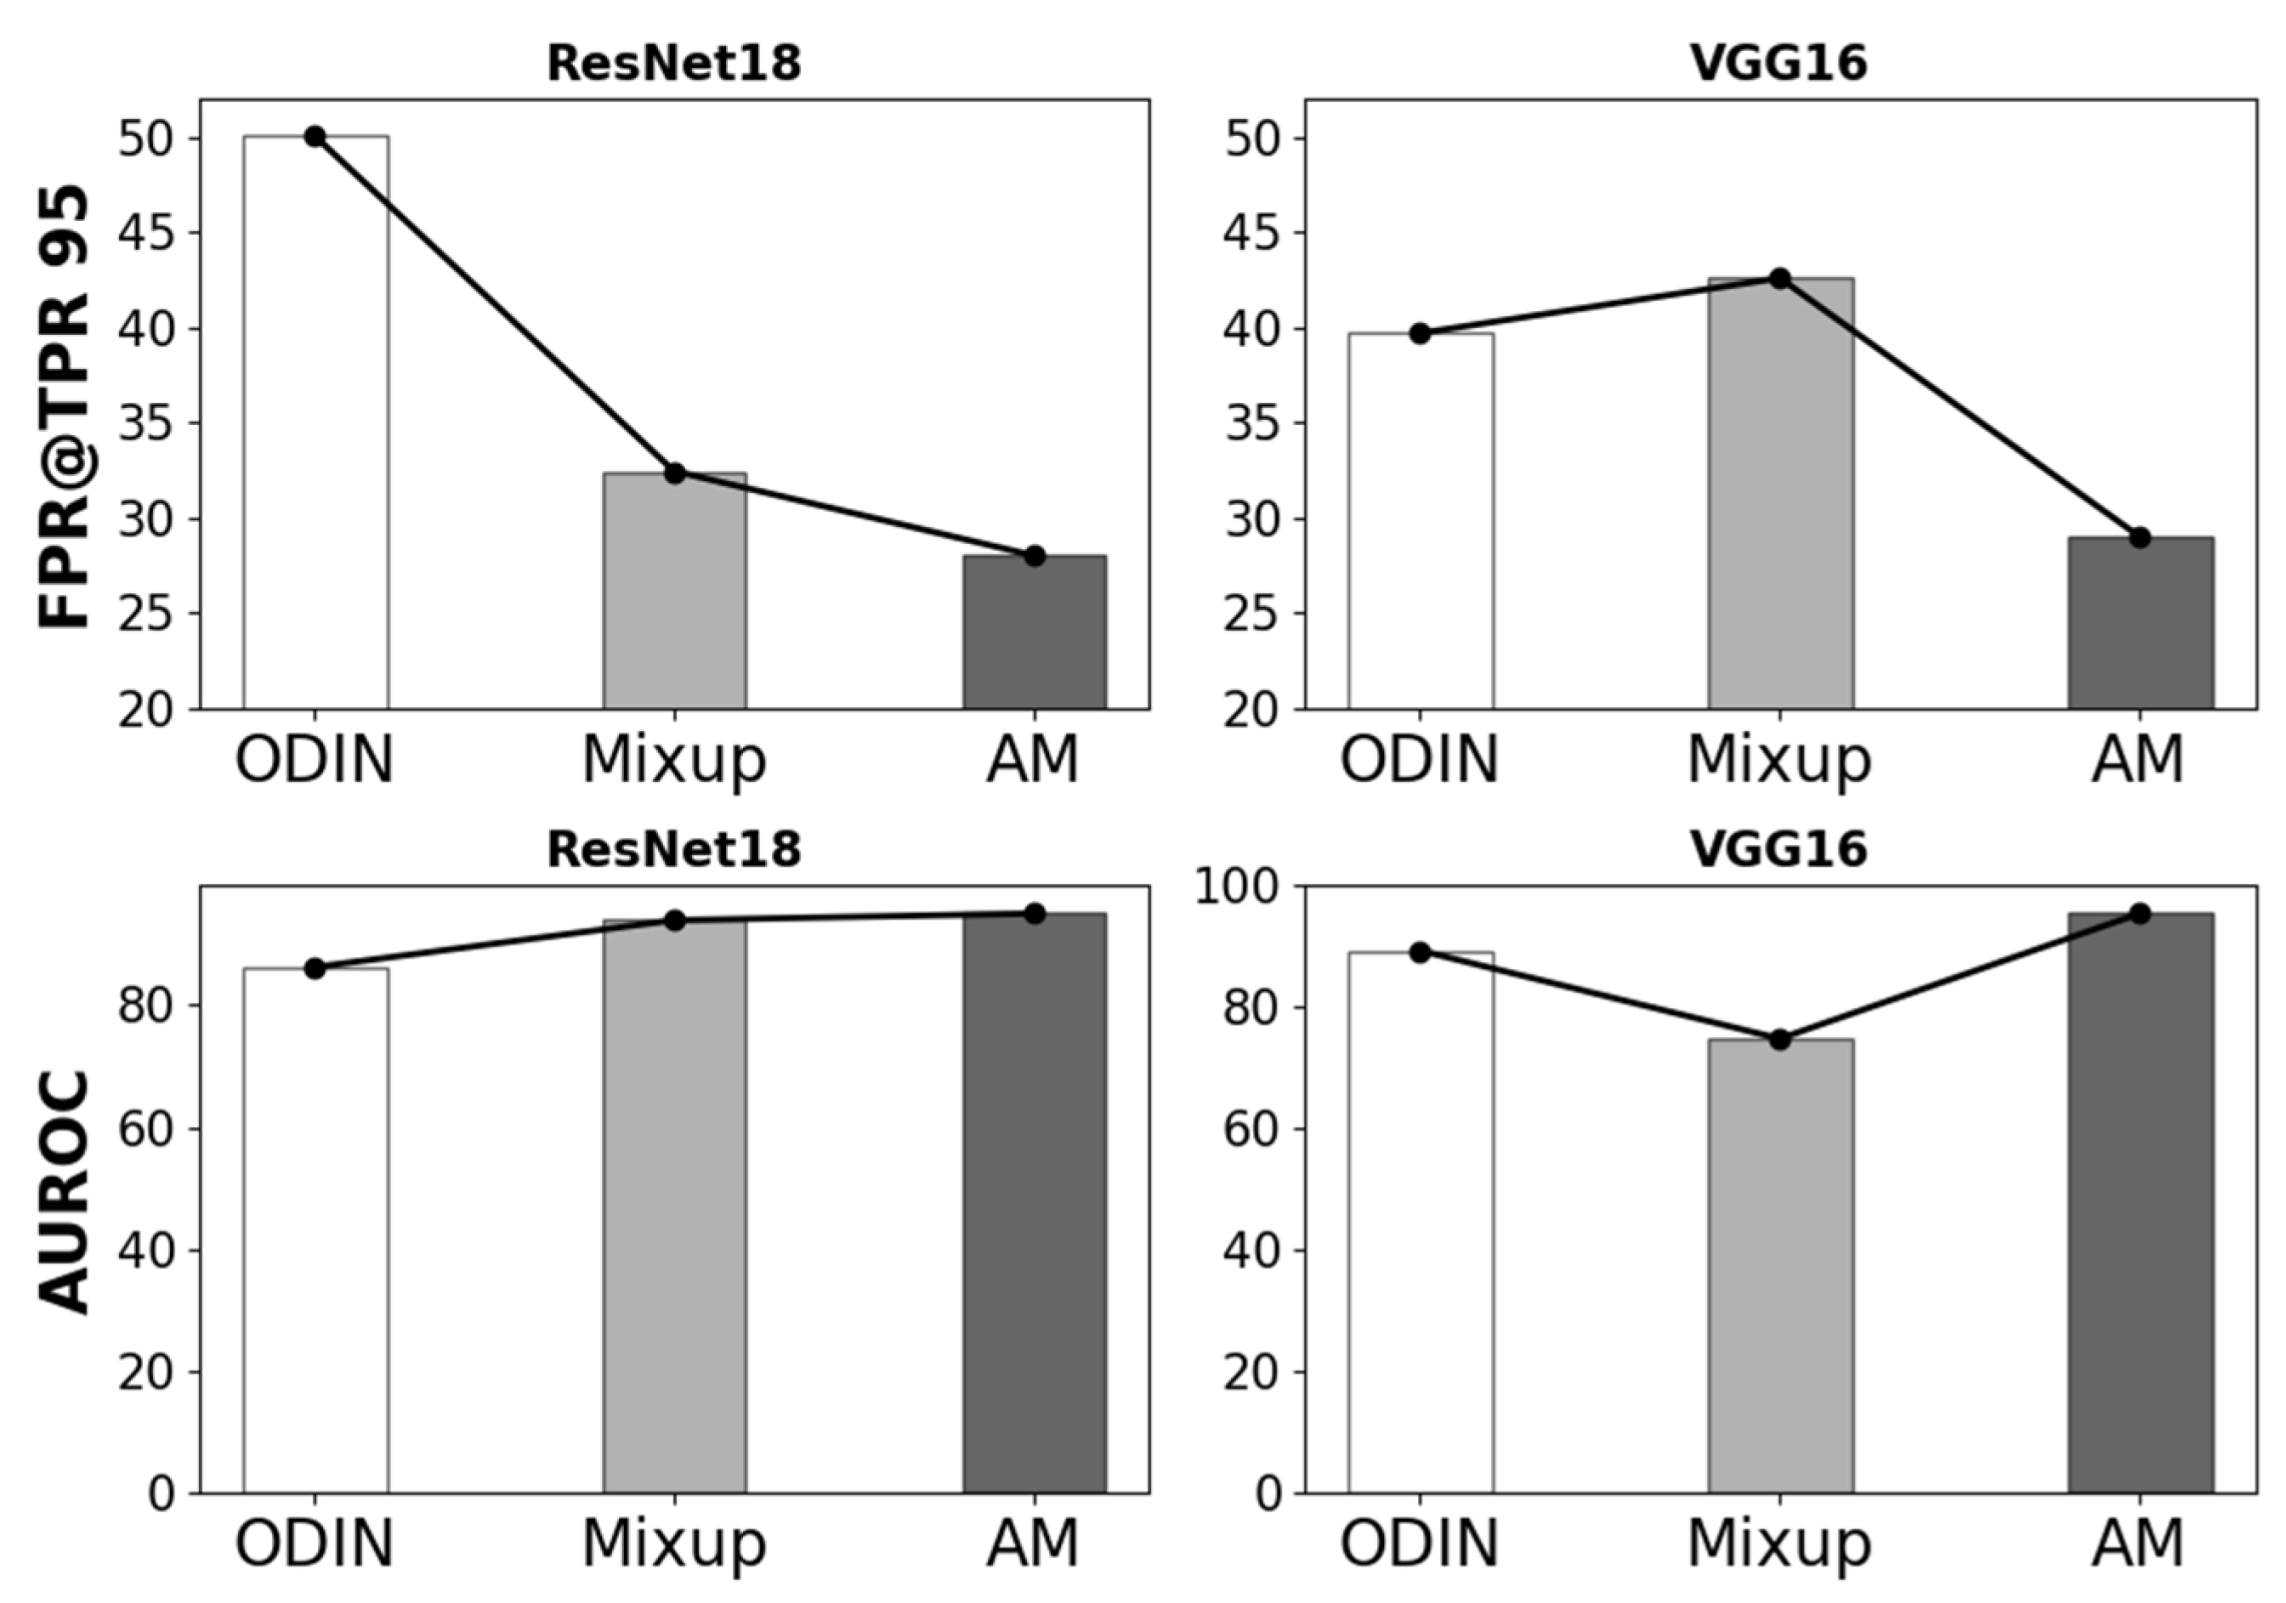
5.1. AM OOD Detection Performance

A threshold-value-based detector was used for evaluating OOD detection performance based on the confidence score of test data, in which it is classified as OOD if the confidence test score is higher than the threshold value and as ID otherwise. ResNet18 and VGG16 are used for training the model. Table 3 and Table 4 present the OOD detection performance evaluation metrics of the model trained with CIFAR10 in ResNet18 and VGG16. Among the four metrics, a lower value of FPR@TPR 95 and higher values of the other three metrics signify higher performance. A comparison with previous MSP [12] and MD [15] methods is made to evaluate the performance of the AM method. ID and OOD in the table represent the dataset used for training and testing, respectively, whereas (C) and (R) in the OOD column represent that they are cropped and resized, respectively. The best performance values are marked in bold font.
Table 3 presents the OOD detection performance of the model trained with the CIFAR10 dataset in ResNet18. The AM method records 11.8% for ImageNet (C) in the FPR@TPR 95 index, which is 5% improvement over the MD method which has 16.8%. It also achieves the highest performance with an average of 97.3% in the AUPR Out index, which indicates how well OOD is classified as OOD, excluding SVHN and LSUN (C) datasets. Similarly, 1.3% higher performance is achieved than the MD method in the AUROC metrics. Accordingly, it is confirmed that the AM method can classify the data of ImageNet, LSUN, or iSUN that contain the same natural images as CIFAR10 used for training but have a different type of data to OOD. The MD method achieves higher performance for SVHN and LSUN (C) datasets. In particular, the mixup method of adversarial data actually has a reduced performance for the data containing only digits as in SVHN.
Table 4 presents the OOD detection performance of the model trained with the CIFAR10 dataset in VGG16. Compared to the MD method, the AM method improves the performance for both ImageNet (C) and ImageNet (R) data by approximately 7% and for both LSUN (C) and LSUN (R) data by 13% on average in the FPR@TPR 95 metric. The AM method records 97.5% on average, which is a 2.8% performance improvement compared with the MD method in the AUROC metric, excluding SVHN and LSUN (C) datasets. Likewise, the AM method records 97% on average in the AUPR Out metric, which is 2.6% improvement over the MD method.
Taken together, it is experimentally proven that the proposed AM method can efficiently perform OOD detection regardless of the size and type of DNNs. The performance of ResNet and VGGNet models is increased by up to 15% and 11%, respectively, showing an overall superiority of the naïve AM method. However, both ResNet and VGGNet models show higher performance in the existing MD method than the naïve AM method in the case of SVHN and LSUN (C) datasets. Section 5.2 will address this inferiority problem by combining the naïve AM method with distance awareness. The modified AM method with an MD-based OOD detector proposed in the following section will resolve this issue.

5.2. Improved OOD Detection by Combining AM with Distance Awareness

The proposed AM method is combined with the Mahalanobis distance (MD)-based OOD detector to solve the above exceptional inferiority problem in the specific datasets. After executing the AM method during the training process, the modified method exploits the MD awareness instead of the softmax function generally used in conventional methods.
Figure 6 shows the performance improvement rate when the MD-based OOD detector is combined with the AM method, in which the x -axis represents OOD data and the y -axis represents four evaluation metrics in each graph. If the bar graph points upward with respect to the x -axis ( y = 0 ), it indicates that the performance is increased by using the MD-based OOD detector. The experimental results show that the combination of two proposed methods can increase the performance by 10% on average compared with one in the case where only the AM method is applied. In particular, the performance of two exceptional datasets is improved by up to 75% for the SVHN dataset and by 17% for the LSUN (C) dataset in FPR@TPR 95. Furthermore, the performance for the SVHN and LSUN (C) is considerably improved in the AUPR Out metric, and the average improvement rate is 4.6% in the AUROC metric. Therefore, the modified MD-combined AM training method for a more reliable OOD detector can additionally resolve the inferiority issue of the naïve AM method compared with the MD method in the case of SVHN and LSUN (C) datasets.

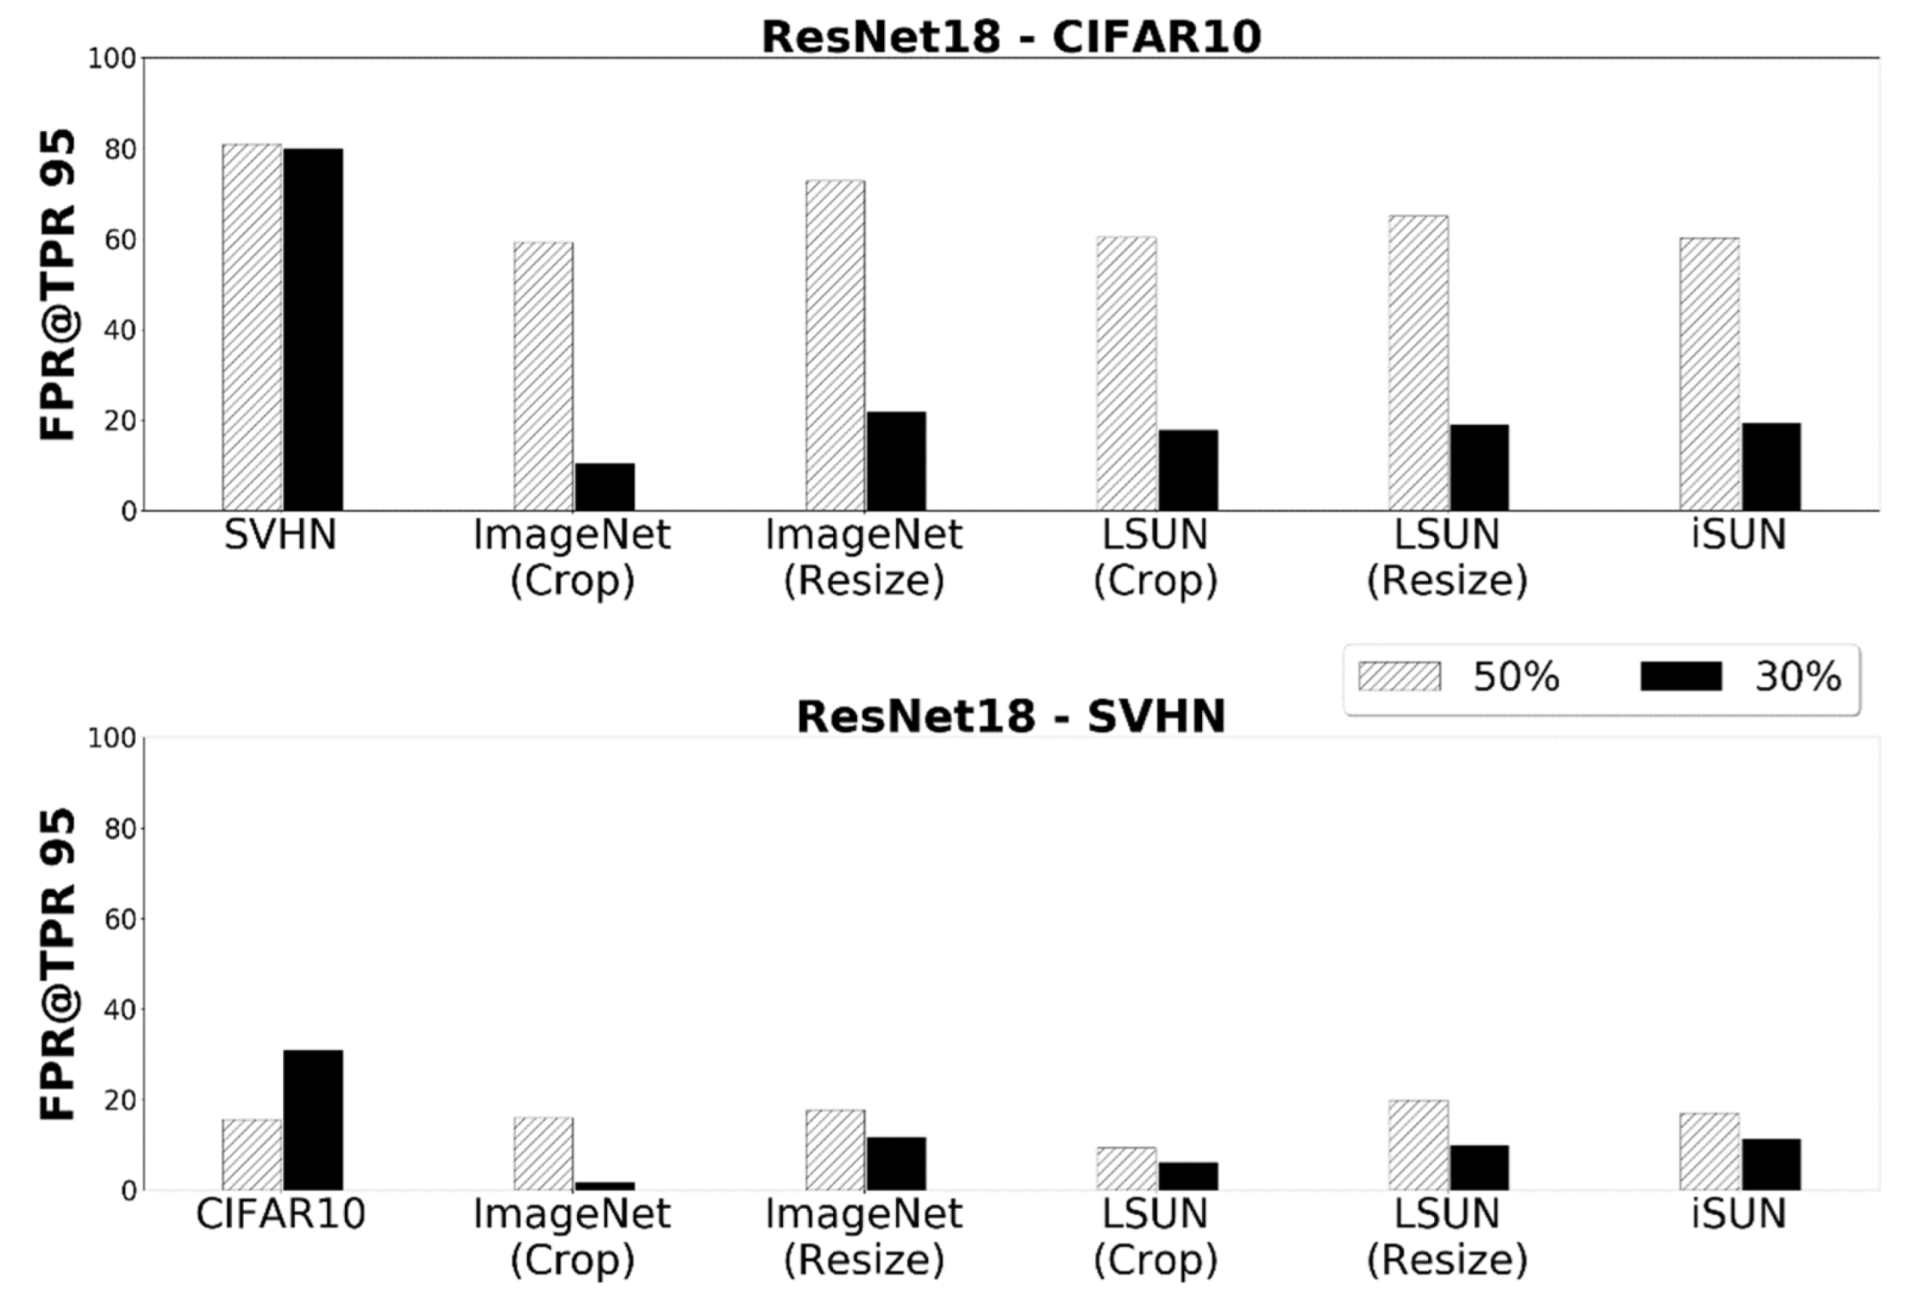
5.3. Ablation Study: Effect of Adversarial Mixup Ratio

The AM ratio refers to the degree of adversarial data mixed with the original data during the training process. In this section, the performance of OOD detection depending on the AM ratio is investigated.
For measuring the OOD detection performance, 30% or 50% of the data is randomly selected from a mini-batch to generate adversarial data. FPR@TPR 95 is used to evaluate the performance where a lower index value indicates higher performance. Figure 7 shows the comparison result in which the x -axis shows the input OOD data and the y -axis shows the value of the FPR@TPR 95 index. The performance is better at 30% for all datasets in the model trained with the CIFAR10 dataset in ResNet18, except for the SVHN dataset, which has a similar level of performance at both 30% and 50%. Moreover, the performance is 30% higher for all datasets when the model is trained with SVHN, except CIFAR10. Based on this result, it can be concluded that the higher adversarial mixup ratio may degrade the OOD detection performance by showing that the 30% AM ratio is more appropriate than 50%. Therefore, the AM ratio is set as 30% in this paper. The optimal AM ratio would be a good candidate for future research directions.

5.4. Ablation Study: Comparison of ERM-Based and VRM-Based Models

The ERM-based models can be vulnerable to OOD data, as mentioned in Section 3.1, which implies the necessity of VRM-based models. Figure 8 compares the performance between the ODIN method corresponding to ERM, Mixup method and the proposed AM method corresponding to VRM, using FPR@TPR 95 and AUROC. The first and second rows show the performance of FPR@TPR 95 and AUROC, respectively, whereas ODIN, Mixup, and AM on the x -axis indicates three compared methods.
In terms of FPR@TPR 95, the VRM-based AM method shows 22% and 10% improvement over the ERM-based ODIN in ResNet18 and VGG16 models, respectively. With respect to AUROC, the VRM-based AM method records 95% in both DNN models, improving performance by 9% and 6%, respectively, compared to the ERM-based ODIN method. Therefore, it can be concluded that the VRM method in which the surrounding distributions are simultaneously trained shows more efficient OOD detection improving performance compared with the ERM-based method, thus demonstrating the effectiveness of the proposed VRM-based AM method.

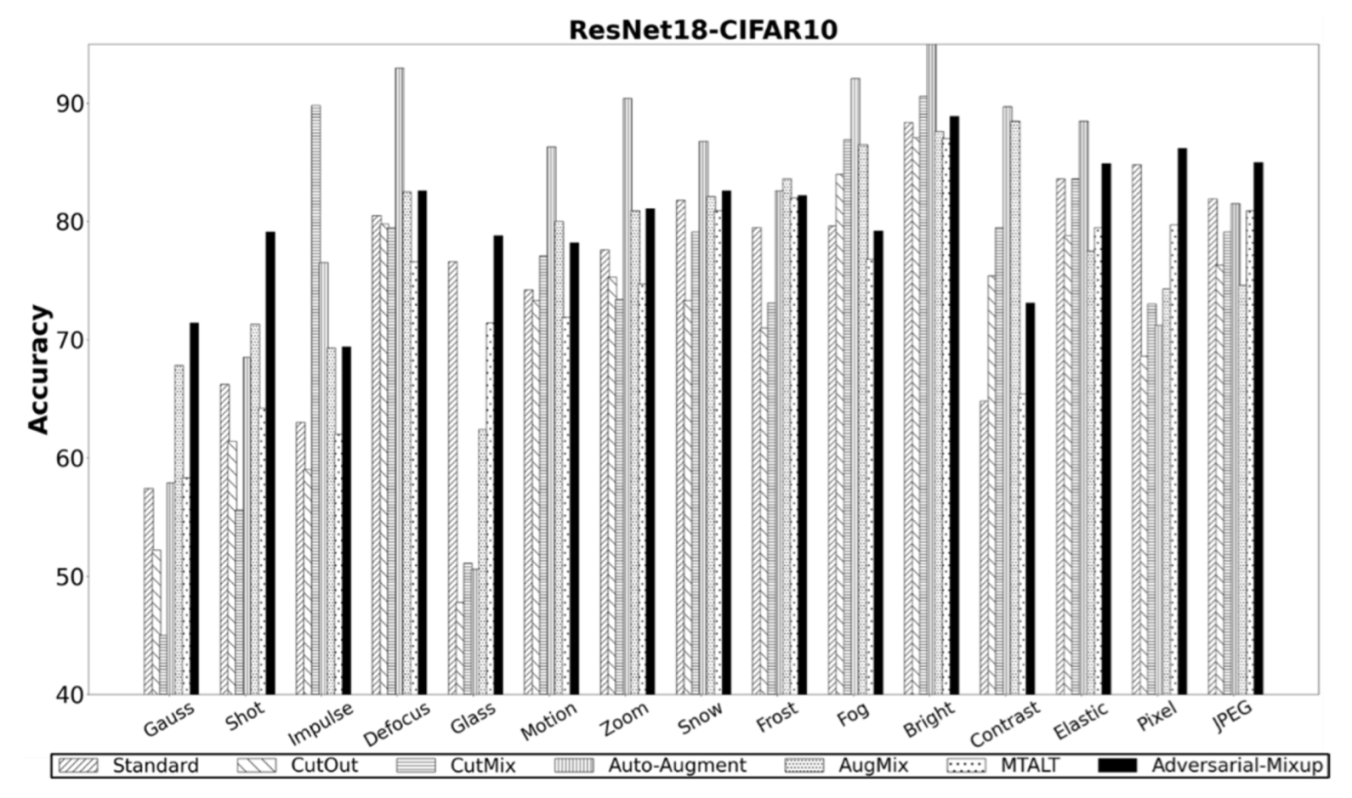
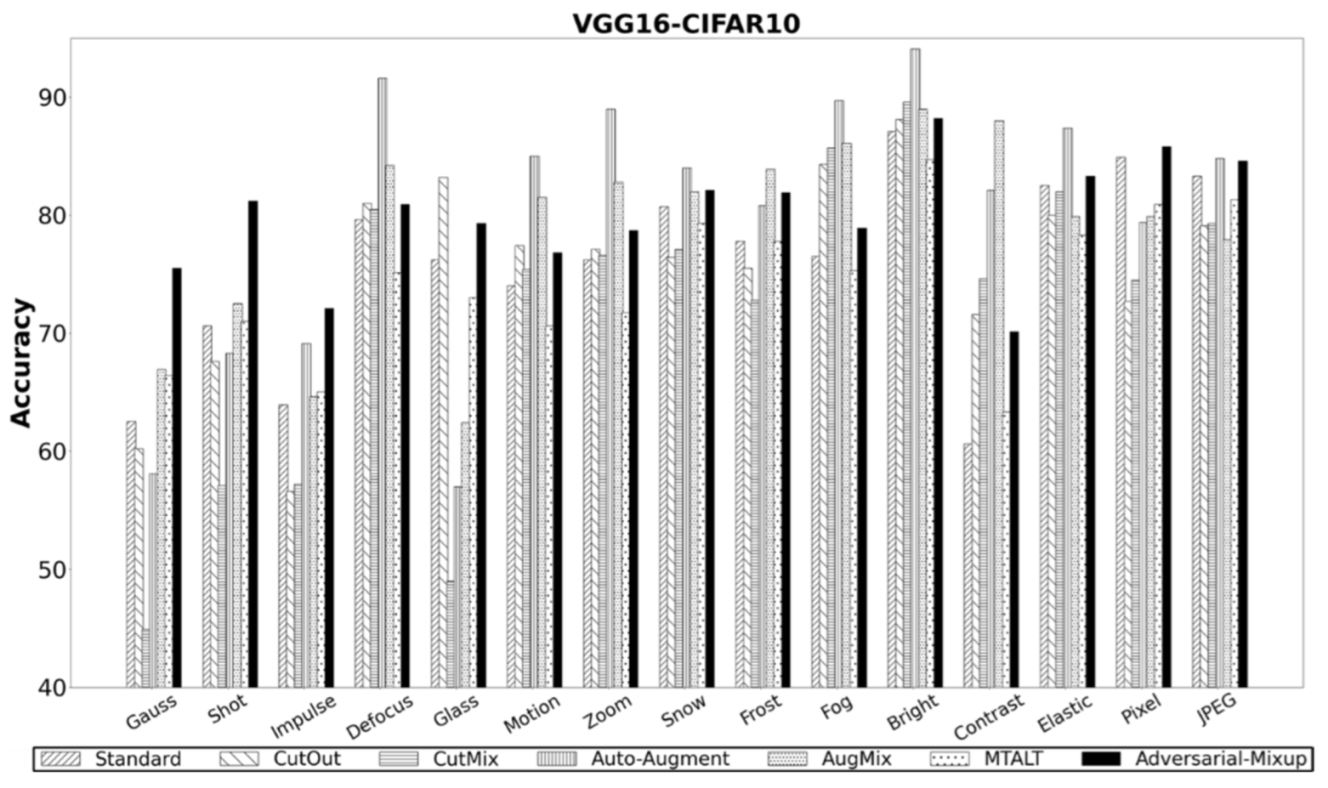
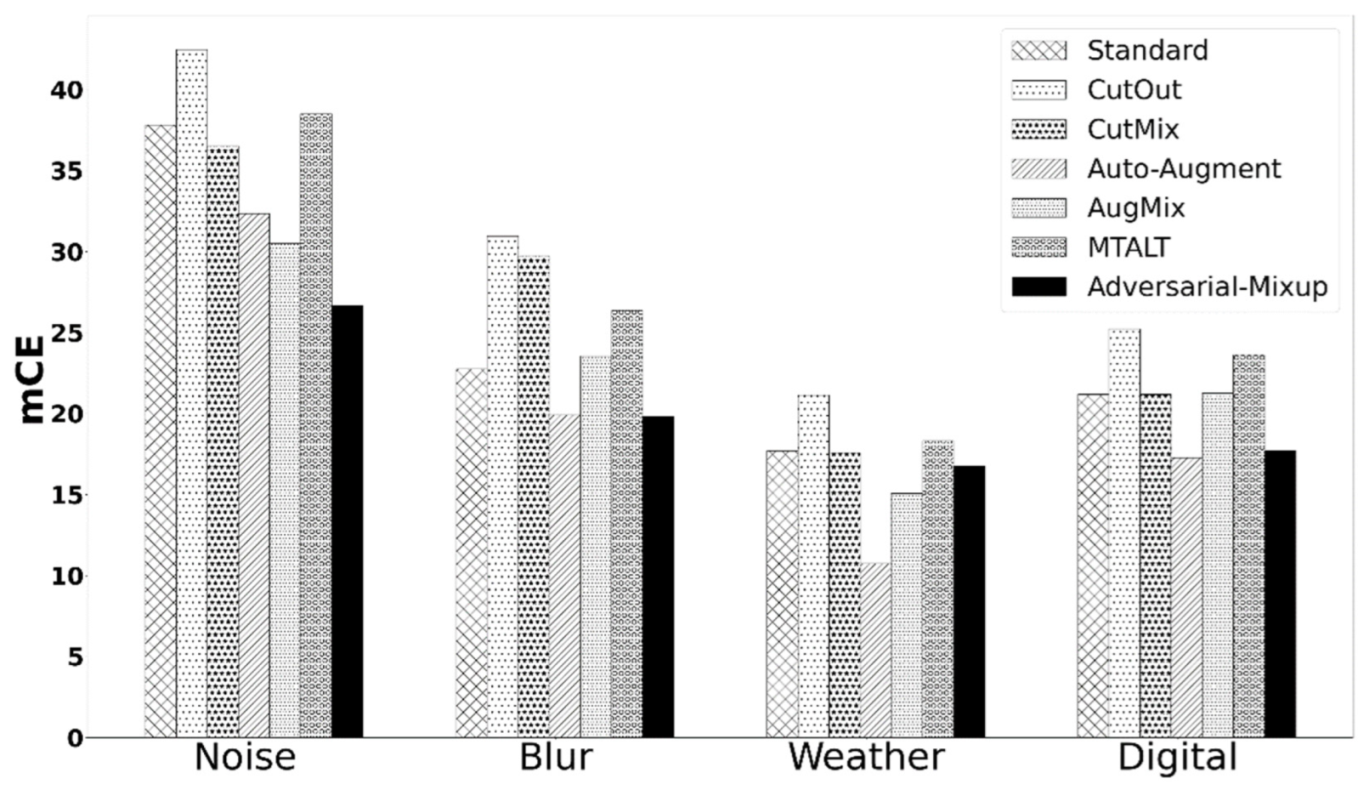
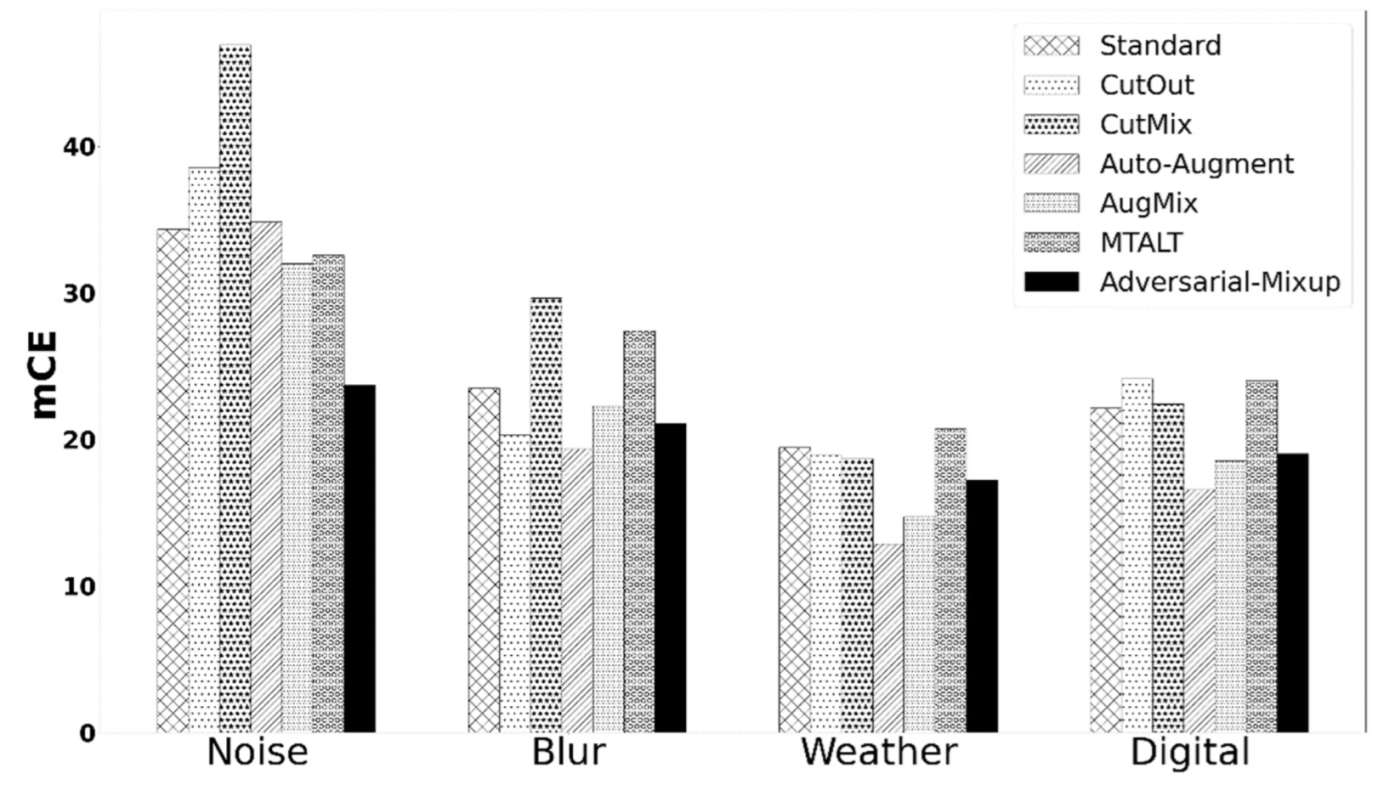
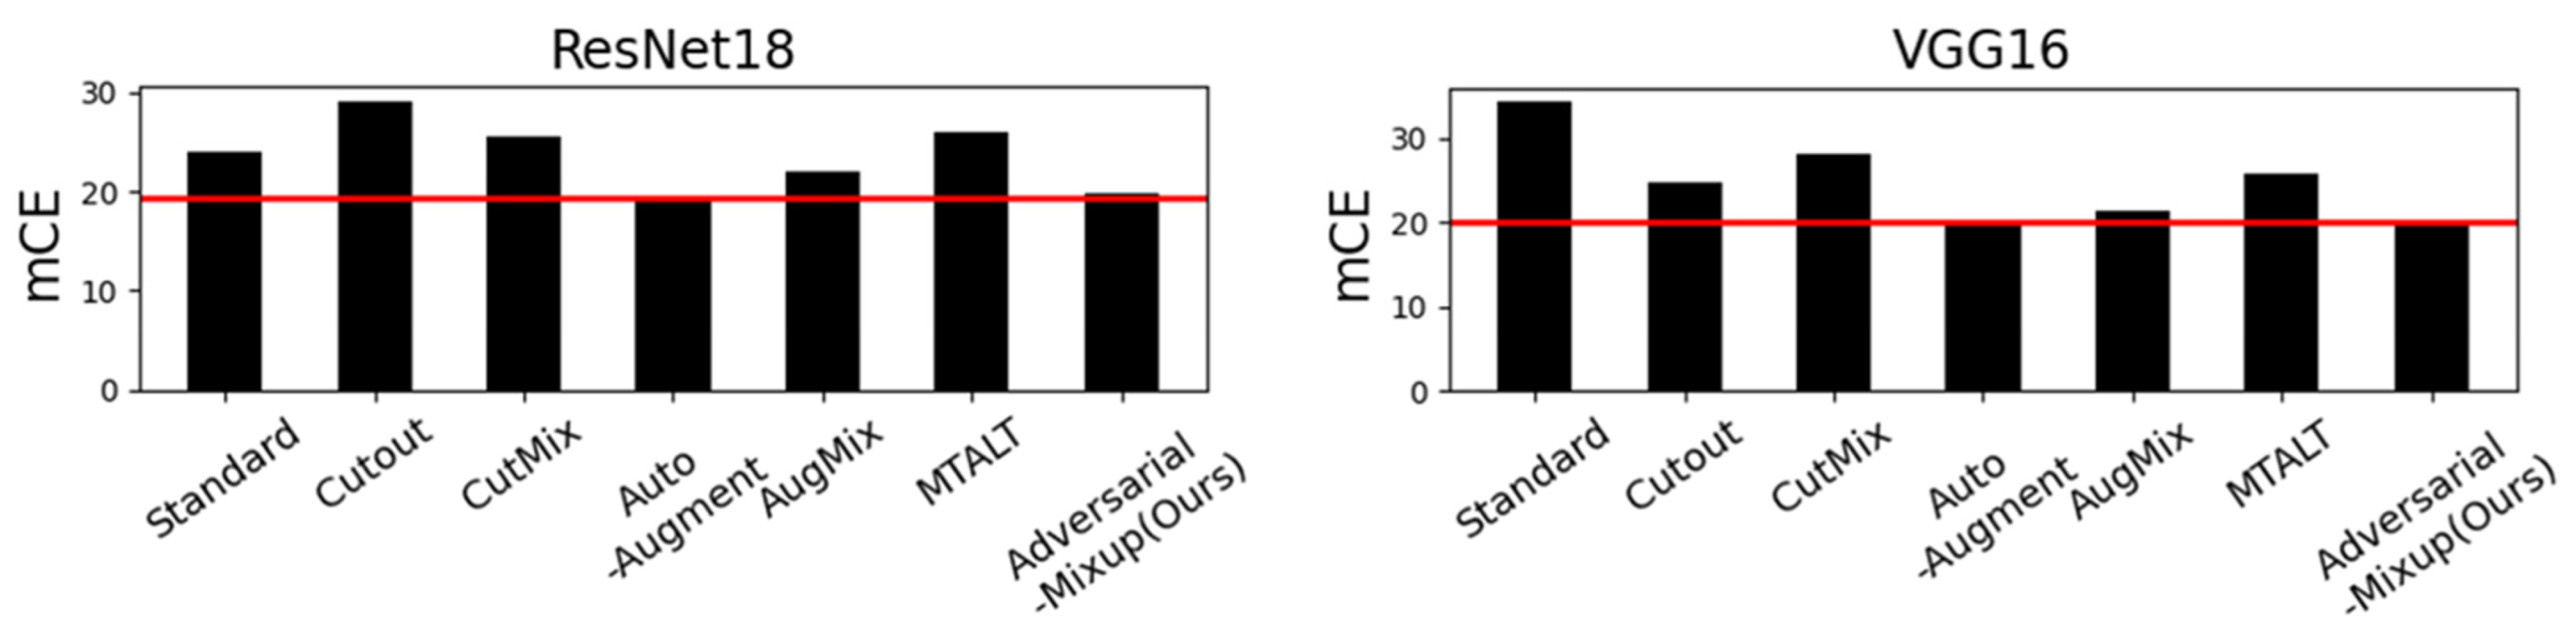
5.5. AM OOD Generalization Performance

The CIFAR10-C dataset in which a total of 15 tampering cases with four categories have been applied to the original CIFAR-10 is used for evaluating the OOD generalization performance of the proposed AM method. The 15 data tampering cases include noise (Gauss, Shot, Impulse), blurring (Defocus, Glass, Motion, Zoom), weather (Snow, Frost, Fog, Bright), and digital (Contrast, Elastic, Pixel, JPEG) tampering. In this section, the average performance for the four types of tampering is compared by using the mCE metric described in Section 4.2. The overall OOD generalization performance of 15 tampering cases is evaluated by comparing the proposed AM method with the previous studies in the case of ResNet18 and VGG16 models with the CIFAR-10 dataset in Figure 9 and Figure 10.
Figure 11 describes the mCE for the four types of tampering in the ResNet18 model. While the previous methods record approximately 36% mCE on average, the proposed AM method records 20% which is a 5% improvement. It can be interpreted that the proposed AM method is the most robust one for noise-tampered data because it is trained with arbitrary adversarial data. Previous studies also record an average error rate of 25% for blurred tampering, but the AM method records 19%, which is a 6% improvement. In weather tampering, the Auto-Augment [28] achieves the best performance at 11%, followed by the AM method at 16%. Lastly, compared with the previous study of an average error rate of 22% for digital tampering, the AM method shows 18%, which is a 4% improvement.
Figure 12 illustrates the mCE for each type of tampering for the models trained with VGG16. Similar to the ResNet18 model, the proposed AM method shows the best performance improvement rate of 12% compared with conventional methods for noise tampering. CutOut [23] and Auto-Augment [28] show a slightly higher performance than the proposed method for blurred tampering, but the difference is a little below 1%. In weather tampering, Auto-Augment shows the best performance, and the AM method achieves a similar level of performance within a 0.5% difference even though it is designed for OOD detection, compared with previous methods that mainly focused on improving generalization performance. As a result, the AM method does not record the highest performance improvement rate for all types of data tampering, but it still shows a higher performance improvement rate than conventional methods for noise-related tampering which can frequently occur in real life.
Furthermore, the proposed AM method shows a comparable level of performance as SOTA methods evaluated by the mCE according to 15 tampering cases as shown in Figure 13. A straight line along the y -axis in the figure shows the performance level of Auto-Augment [28] which is a SOTA method that achieves the best performance in previous studies. The proposed AM method shows a very minor difference of 0.5% from Auto-Augment and a 9% improvement compared to other previous methods. In the case of VGGNet, the performance improvement rate is around 8% compared to other previous methods.
Auto-Augment has a similar or slightly higher performance than the AM method but involves finding an optimal augmentation scheme through a search algorithm. Additional time and cost overhead could be required due to the computational complexity during the search process, considering the nature of this algorithm. In contrast, the AM method can increase OOD detection and generalization performance by simply training through mixing up adversarial data samples. Considering all of these experimental results, it is proven that the proposed AM method can improve OOD detection and generalization performance with no time complexity and cost overhead.

6. Conclusions

This paper presents a unified AM training framework to simultaneously solve both OOD detection and the OOD generalization problem, which are crucial for the better reliability and robustness of DNNs. Experimental evaluation demonstrates that the proposed method shows more reliable results by inducing a low confidence score for OOD data. Furthermore, the proposed method can be optimized to show better performance than that of conventional methods by employing the MD-based OOD detector during inference. The proposed AM also has a noticeable effect on the generalization of DNNs. Particularly, it achieves the best performance for noise-related tampering types that frequently occur in nature and provides a similar level of OOD generalization performance as previous SOTA methods focusing only on improving generalization performance. In conclusion, this work contributes to providing a simple AM training method that can solve both OOD detection and OOD generalization problems at once for more safe and reliable DNNs robust to covariate shift.
In future work, we will consider adding more adversarial perturbation to the learning process for AM to develop a universal training algorithm because AM did not always perform better in all the cases. Furthermore, auto-tuning the adversarial mixup ratio can be implemented for practitioners.

Author Contributions

Conceptualization, J.Y.; Methodology, K.G.; Software, K.G.; Validation, K.G.; Formal analysis, K.G.; Investigation, J.Y.; Resources, J.Y.; Data curation, K.G.; Writing—original draft, K.G.; Writing—review & editing, J.Y.; Visualization, J.Y.; Supervision, J.Y.; Project administration, J.Y.; Funding acquisition, J.Y. All authors have read and agreed to the published version of the manuscript.

Funding

National Research Foundation of Korea: NRF-2020R1A2C1014768.

Data Availability Statement

No new data were created. We used publicly available datasets.

Acknowledgments

This work was supported by the National Research Foundation of Korea (NRF) grant funded by the Korean Government (MSIT) (NRF-2020R1A2C1014768), and a part of the results of the “Development of Monitoring System Technology Using AI in a Mobile Environment” project supported by IITP funded by the Ministry of National Defense.

Conflicts of Interest

The authors declare no conflict of interest.

References

  1. Dargan, S.; Kumar, M.; Ayyagari, M.R.; Kumar, G. A survey of deep learning and its applications: A new paradigm to machine learning. Arch. Comput. Methods Eng. 2020, 27, 1071–1092. [Google Scholar] [CrossRef]
  2. Cui, P.; Wang, J. Out-of-distribution (OOD) detection based on deep learning: A review. Electronics 2022, 11, 3500. [Google Scholar] [CrossRef]
  3. Yang, J.; Zhou, K.; Li, Y.; Liu, Z. Generalized out-of-distribution detection: A survey. arXiv 2022, arXiv:2110.11334v2. [Google Scholar]
  4. Jeong, K. The Cause of Honda’s Self-Driving Accident is Lack of AI Reliability. Meconomynews. 2020. Available online: https://www.meconomynews.com/news/articleView.html?idxno=47362 (accessed on 10 January 2022).
  5. Bonetti, M. Scientists Now Claim AI Can Predict a Criminal Just Checking Facial Features TrendinTech. 2016. Available online: https://trendintech.com/2016/12/02/scientists-now-claim-ai-can-predict-a-criminal-just-checking-facial-features/ (accessed on 10 January 2022).
  6. Sharif, M.; Bhagavatula, S.; Bauer, L.; Reiter, M.K. Accessorize to a crime: Real and stealthy attacks on state-of-the-art face recognition. In Proceedings of the 2016 ACM SIGSAC Conference on Computer and Communications Security, Vienna, Austria, 24–28 October 2016; pp. 1528–1540. [Google Scholar]
  7. Shen, Z.; Liu, J.; He, Y.; Zhang, X.; Xu, R.; Yu, H.; Cui, P. Towards out-of-distribution generalization: A survey. arXiv 2021, arXiv:2108.13624v1. [Google Scholar]
  8. Zhou, K.; Zhang, Y.; Zang, Y.; Yang, J.; Loy, C.C.; Liu, Z. On-device domain generalization. arXiv 2022, arXiv:2209.07521. [Google Scholar]
  9. Nguyen, A.; Yosinski, J.; Clune, J. Deep neural networks are easily fooled: High confidence predictions for unrecognizable images. In Proceedings of the IEEE Computer Society Conference on Computer Vision and Pattern Recognition, Boston, MA, USA, 7–12 June 2015; pp. 427–436. [Google Scholar]
  10. Hendrycks, D.; Dietterich, T. Benchmarking neural network robustness to common corruptions and perturbations. In Proceedings of the International Conference on Learning Representations (ICLR), New Orleans, LA, USA, 6–9 May 2019. [Google Scholar]
  11. Lee, K.; Lee, H.; Lee, K.; Shin, J. Training confidence-calibrated classifiers for detecting out-of-distribution samples. In Proceedings of the International Conference on Learning Representations (ICLR), Vancouver, BC, Canada, 30 April––3 May 2018. [Google Scholar]
  12. Hendrycks, D.; Mazeika, M.; Dietterich, T. Deep anomaly detection with outlier exposure. In Proceedings of the International Conference on Learning Representations (ICLR), New Orleans, LA, USA, 6–9 May 2019. [Google Scholar]
  13. Hawkins, S.; He, H.; Williams, G.; Baxter, R. Outlier detection using replicator neural networks. In Data Warehousing and Knowledge Discovery; Kambayashi, Y., Winiwarter, W., Arikawa, M., Eds.; Springer: Berlin/Heidelberg, Germany, 2002; pp. 170–180. [Google Scholar]
  14. Chen, T.; Kornblith, S.; Norouzi, M.; Hinton, G. A simple framework for contrastive learning of visual representations. In Proceedings of the 37th International Conference on Machine Learning (ICML), Virtual Event, 12–18 July 2020; pp. 1597–1607. [Google Scholar]
  15. Sehwag, V.; Chiang, M.; Mittal, P. SSD: A unified framework for self-supervised outlier detection. In Proceedings of the International Conference on Learning Representations (ICLR), Vienna, Austria, 4 May 2021. [Google Scholar]
  16. Hendrycks, D.; Gimpel, K. A baseline for detecting misclassified and out-of-distribution examples in neural networks. In Proceedings of the International Conference on Learning Representations (ICLR), Toulon, France, 24–26 April 2017. [Google Scholar]
  17. Liang, S.; Li, Y.; Srikant, R. Enhancing the reliability of out-of-distribution image detection in neural networks. In Proceedings of the International Conference on Learning Representations (ICLR), Vancouver, BC, Canada, 30 April–3 May 2018. [Google Scholar]
  18. Gwon, K.; Yoo, J. Out-of-distribution data detection using mahalanobis distance for reliable deep neural networks. In Proceedings of the IeMeK Symposium on Embedded Technology (ISET 2020), Jeju-si, Republic of Korea, 23–24 July 2020. [Google Scholar]
  19. Lee, K.; Lee, K.; Lee, H.; Shin, J. A simple unified framework for detecting out-of-distribution samples and adversarial attacks. In Proceedings of the 32nd International Conference on Neural Information Processing Systems (NeurIPS), Montreal, QC, Canada, 2–8 December 2018. [Google Scholar]
  20. Yang, D.; Mai Ngoc, K.; Shin, I.; Lee, K.-H.; Hwang, M. Ensemble-Based Out-of-Distribution Detection. Electronics 2021, 10, 567. [Google Scholar] [CrossRef]
  21. Liu, W.; Wang, X.; Owens, J.; Li, Y. Energy-based Out-of-distribution Detection. In Proceedings of the 34th Conference on Neural Information Processing Systems (NeurIPS 2020), Vancouver, BC, Canada, 6–12 December 2020. [Google Scholar]
  22. Djurisic, A.; Bozanic, N.; Ashok, A.; Liu, R. Extremely Simple Activation Shaping for Out-of-Distribution Detection. In Proceedings of the International Conference on Learning Representations (ICLR), Kigali, Rwanda, 1–5 May 2023. [Google Scholar]
  23. Devries, T.; Taylor, G.W. Improved regularization of convolutional neural networks with cutout. In Proceedings of the 2017 Conference on Computer Vision and Pattern Recognition (CVPR), Honolulu, HI, USA, 21–26 July 2017. [Google Scholar]
  24. Yun, S.; Han, D.; Oh, S.; Chun, S.; Choe, J.; Yoo, Y. CutMix: Regularization strategy to train strong classifiers with localizable features. In Proceedings of the 2019 International Conference on Computer Vision (ICCV), Seoul, Republic of Korea, 27 October–2 November 2019. [Google Scholar]
  25. Thulasidasan, S.; Chennupati, G.; Bilmes, J.; Bhattacharya, T.; Michalak, S. On mixup training: Improved calibration and predictive uncertainty for deep neural networks. In Proceedings of the Conference on Neural Information Processing Systems (NeurIPS), Vancouver, BC, Canada, 8–14 December 2019. [Google Scholar]
  26. Hendrycks, D.; Mu, N.; Cubuk, E.D.; Zoph, B.; Gilmer, J.; Lakshminarayanan, B. AugMix: A simple data processing method to improve robustness and uncertainty. In Proceedings of the International Conference on Learning Representations (ICLR), Addis Ababa, Ethiopia, 30 April 2020. [Google Scholar]
  27. Laugros, A.; Caplier, A.; Ospici, M. Addressing neural network robustness with mixup and targeted labeling adversarial training. In Proceedings of the 16th European Conference on Computer Vision (ECCV), Glasgow, UK, 23–28 August 2020. [Google Scholar]
  28. Cubuk, E.D.; Zoph, B.; Mane, D.; Vasudevan, V.; Le, Q.V. AutoAugment: Learning augmentation policies from data. In Proceedings of the Computer Vision and Pattern Recognition (CVPR), Long Beach, CA, USA, 16–20 June 2019. [Google Scholar]
  29. Yang, J.; Zhou, K.; Liu, Z. Full-spectrum out-of-distribution detection. arXiv 2022, arXiv:2204.05306. [Google Scholar]
  30. Zhang, H.; Cisse, M.; Dauphin, Y.N.; Lopez-Paz, D. Mixup: Beyond empirical risk minimization. In Proceedings of the 6th International Conference on Learning Representations (ICLR), Vancouver, BC, Canada, 30 April–3 May 2018. [Google Scholar]
  31. Goodfellow, I.J.; Shlens, J.; Szegedy, C. Explaining and harnessing adversarial examples. In Proceedings of the 3rd International Conference on Learning Representations (ICLR), San Diego, CA, USA, 7–9 May 2015. [Google Scholar]
  32. Kurakin, A.; Goodfellow, I.J.; Bengio, S. Adversarial examples in the physical world. In Proceedings of the International Conference on Learning Representations (ICLR), Toulon, France, 24–26 April 2017. [Google Scholar]
  33. Szgedy, C.; Zaremba, W.; Sutskever, I.; Bruna, J.; Erhan, D.; Goodfellow, I.J.; Fergus, R. Intriguing properties of neural networks. In Proceedings of the International Conference on Learning Representations (ICLR), Banff, AB, Canada, 14–16 April 2014. [Google Scholar]
Figure 1. (a) OOD detection problem; (b) OOD generalization problem (the bars in the graph indicate the confidence scores).
Electronics 12 01421 g001
Figure 2. Schematic diagram of data mixup method.
Electronics 12 01421 g002
Figure 3. FGSM adversarial attack.
Electronics 12 01421 g003
Figure 4. Proposed AM OOD sample generator.
Electronics 12 01421 g004
Figure 5. Process of MD-based OOD detection.
Electronics 12 01421 g005
Figure 6. Performance improvement rate after combining AM with MD-based OOD detector.
Electronics 12 01421 g006
Figure 7. Comparing OOD detection performance according to adversarial mixup ratio.
Electronics 12 01421 g007
Figure 8. Comparing OOD detection performance of ERM-based and VRM-based models.
Electronics 12 01421 g008
Figure 9. OOD generalization performance comparison according to 15 data tampering cases in ResNet18.
Electronics 12 01421 g009
Figure 10. OOD generalization performance comparison according to 15 data tampering cases in VGG16.
Electronics 12 01421 g010
Figure 11. mCE for four categories of data tampering in ResNet18 model.
Electronics 12 01421 g011
Figure 12. mCE for four categories of data tampering in VGG16 model.
Electronics 12 01421 g012
Figure 13. mCE comparison of different OOD generalization methods.
Electronics 12 01421 g013
Table 1. Datasets used for evaluating OOD detection and OOD generalization performance.
For OOD Detection TaskFor OOD Generalization Task
CIFAR10CIFAR10-C
ImageNet-C
SVHN
ImageNet-P
ImageNet (Crop)
ImageNet-A
ImageNet (Resize)
ImageNet-V2
LSUN (Crop)
ObjectNet
LSUN (Resize)
ImageNet-Vid-Robust
iSUN
YouTube-BB-Robust
Table 2. Confusion matrix used in binary classification.
Result
ActualPredicted
True PositiveOODOOD
False NegativeOODID
True NegativeIDID
False PositiveIDOOD
Table 3. OOD detection performance evaluation of the model trained with CIFAR10 dataset in resnet18.
ID DataOOD DataFPR@TPR 95AUROCAUPR InAUPR Out
MSP [16]/MD [19]/AM (Proposed)
CIFAR10SVHN86.7/8.8/8076.9/98.0/83.773.5/94.8/8770/99.2/77.1
ImageNet(C)69/16.8/11.888.1/96.9/98.290.3/97.3/98.583.8/96.2/97.3
ImageNet(R)73/35.1/21.787.1/94.1/96.990.1/95.2/97.682.1/92.1/95.7
LSUN(C)66/6.2/17.890.3/98.5/97.392.7/98.7/97.886/98.3/96.7
LSUN(R)72.5/33.9/18.987.5/94.5/9790.2/95.7/97.682.6/91.5/96.1
iSUN73.7/27.6/19.387.3/95.4/97.190.2/96.7/97.782.1/92.3/96.2
Table 4. OOD detection performance evaluation of the model trained with CIFAR10 data set in VGG16.
ID DataOOD DataFPR@TPR 95AUROCAUPR InAUPR Out
MSP [62]/MD [19]/AM (Proposed)
CIFAR10SVHN81.1/2.4/7583.3/99.4/86.486.2/98.6/89.677.1/99.8/80.6
ImageNet(C)74.6/12.5/1197.1/97.7/98.390.3/98.2/97.882.1/97.0/97.8
ImageNet(R)62.5/31.3/18.790.8/94.6/97.393/95.3/96.787.3/94.0/96.7
LSUN(C)55.8/1.0/11.592.1/99.7/9894/99.7/98.689.6/99.7/97.7
LSUN(R)60.5/46/17.191.3/91.7/97.493.6/92.9/96.988/93.3/96.9
iSUN60.8/30.5/19.491.4/94.6/97.193.7/95.7/96.688/93.4/96.6
Disclaimer/Publisher’s Note: The statements, opinions and data contained in all publications are solely those of the individual author(s) and contributor(s) and not of MDPI and/or the editor(s). MDPI and/or the editor(s) disclaim responsibility for any injury to people or property resulting from any ideas, methods, instructions or products referred to in the content.

