Article

COVID-ResNet: COVID-19 Recognition Based on Improved Attention ResNet

1
School of Computer Science and Engineering, North Minzu University, Yinchuan 750021, China
2
School of Science, Ningxia Medical University, Yinchuan 750004, China
3
School of Electronic & Information Engineering, Suzhou University of Science and Technology, Suzhou 215009, China
*
Author to whom correspondence should be addressed.
Electronics 2023, 12(6), 1413; https://doi.org/10.3390/electronics12061413
Submission received: 15 January 2023 / Revised: 1 March 2023 / Accepted: 9 March 2023 / Published: 16 March 2023
(This article belongs to the Special Issue Deep Learning in Medical Image Process)

Abstract

:
COVID-19 is the most widespread infectious disease in the world. There is an incubation period in the early stage of infection. At present, there are some difficulties in the diagnosis of COVID-19. Medical image analysis based on computed tomography (CT) images is an important tool for clinical diagnosis. However, the lesion size of COVID-19 is smaller, and the lesion shape of COVID-19 is more complex. The effect of the aided diagnosis model is not good. To solve this problem, an aided diagnostic model of COVID-ResNet was proposed based on CT images. Firstly, an improved attention ResNet model was designed based on CT images to focus on the focal lesion area. Secondly, the SE-Res block was constructed. The squeeze excitation mechanism with the residual connection was introduced into the ResNet. The SE-Res block can enhance the correlation degree among different channels and improve the overall accuracy of the model. Thirdly, MFCA (multi-layer feature converge attention) blocks were proposed, which extract multi-layer features. In this model, coordinated attention was used to focus on the direction information of the lesion area. Different layer features were concatenated so that the shallow layer and deep layer features were fused. The experimental results showed that the model could significantly improve the recognition accuracy of COVID-19. Compared with similar models, COVID-ResNet has better performance. On the COVID-19 CT dataset, the accuracy, recall rate, F1 score, and AUC value could reach 96.89%, 98.15%,96.96%, and 99.04%, respectively. Compared with the ResNet model, the accuracy, recall rate, F1 score, and AUC value were higher by 3.1%, 2.46%, 3.0%, and 1.16%, respectively. In ablation experiments, the experimental results showed that the SE-Res block and MFCA model proposed by us were effective. COVID-ResNet transfers the shallow features to the deep, gathers the features, and makes the information complementary. COVID-ResNet can improve the work efficiency of doctors and reduce the misdiagnosis rate. It has a positive significance for the computer-aided diagnosis of COVID-19.

1. Introduction

Since the outbreak of the novel coronavirus in 2019, COVID-19 has become the most widely infected and longest-lasting epidemic disease in the world. There is an incubation period in the initial stage of the virus infection, and there is no obvious infection symptom during the incubation period. If COVID-19 is found, it is basically confirmed. There are still some difficulties in the diagnosis of the virus. Even if the patients show strong symptoms, the nucleic acid test report cannot completely exclude the prevalence of COVID-19 [1]. The method based on artificial recognition depends on the experience of doctors. The lesion features that can be observed by the naked eye are combined. It leads to the fact thatthe accuracy depends on the subjective judgment of doctors. Therefore, it is necessary to use artificial intelligence (AI) to diagnose COVID-19. Several artificial intelligence, machine learning, and deep learning techniques have been deployed in medical image processing in the context of the COVID-19 disease [2]. Lorenzo Famiglini [3] created four models. These may help doctors make better decisions during the care and treatment of patients. M. Raihan [4] solved the problem of class imbalances of COVID-19 datasets using the Adaptive Synthetic (ADASYN) algorithm. Heidari, A. [5] extensively evaluated the existing challenges related to AI methods. The necessity of the AI method in the recognition of COVID-19 was emphasized. Ali Bou Nassif [6] focused mainly on the role of the speech signal and/or image processing in detecting the presence of COVID-19. Three types of experiments were conducted utilizing speech-based, image-based, and speech- and image-based models.
Deep learning (DL) can learn high-level features from a large amount of data adaptively. DL is the most widely used in the field of AI. The features of autonomous learning of deep learning are utilized [7]. A large number of features in medical images are extracted adaptively in batches, which can effectively implement classification tasks. DL overcomes the limitations of a strong subjectivity and the insufficient observation of features in artificial recognition. A DL-based model is a good method forimage classification and object recognition tasks. At present, there are mainly two datasets of X-ray images and CT images for COVID-19 identification. Ye Qinghao [
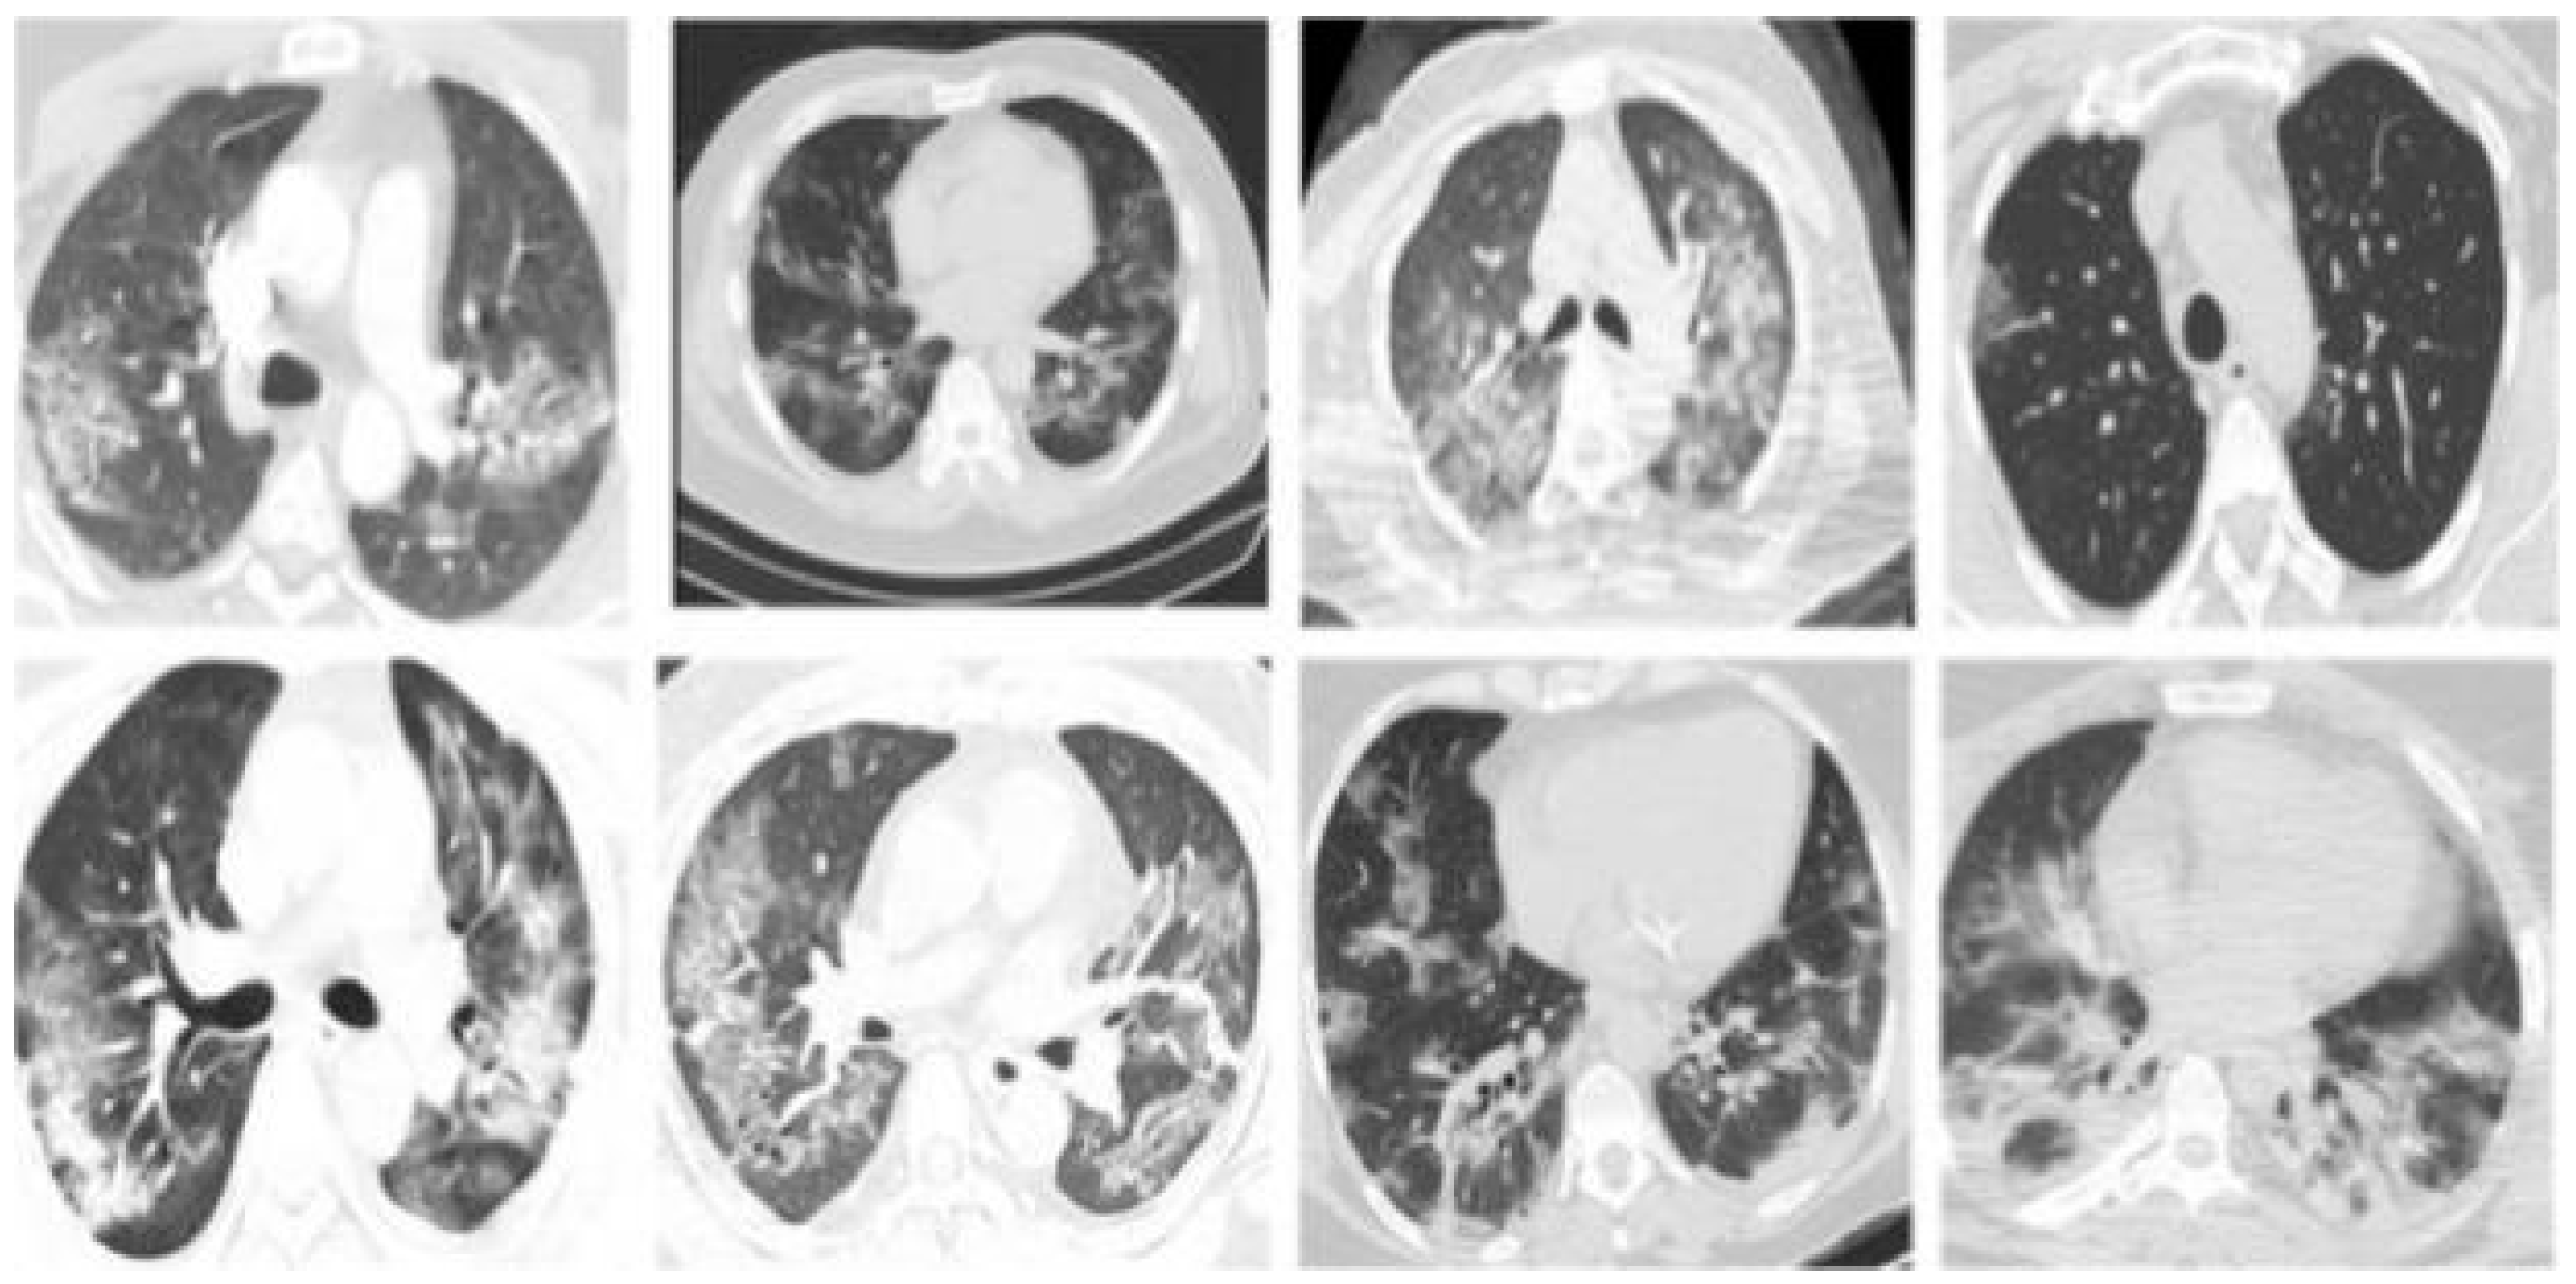
8] pointed out that computed tomography (CT) can detect features such as lung turbidity, consolidation, and pulmonary fibrosis caused by GGO, which is an important tool for the pre-screening and early diagnosis of COVID-19 patients. Song LiPing [9] extracted low-level features of CT images using depth learning. Then, the diagnosis of COVID-19 was carried out by constructing a fuzzy classifier. The algorithm hoped to detect infected objects by observing and analyzing the CT images of suspected patients. It showed that the use of CT images plays a key role in the diagnosis of COVID-19. Kang Bo [10] proposed a method to support supercomputing to build an auxiliary system for the comprehensive analysis of COVID-19 CT images. It showed that a lung CT image is one of the main bases for screening for COVID-19. Therefore, the recognition of COVID-19 based on CT images is more accurate and efficient.
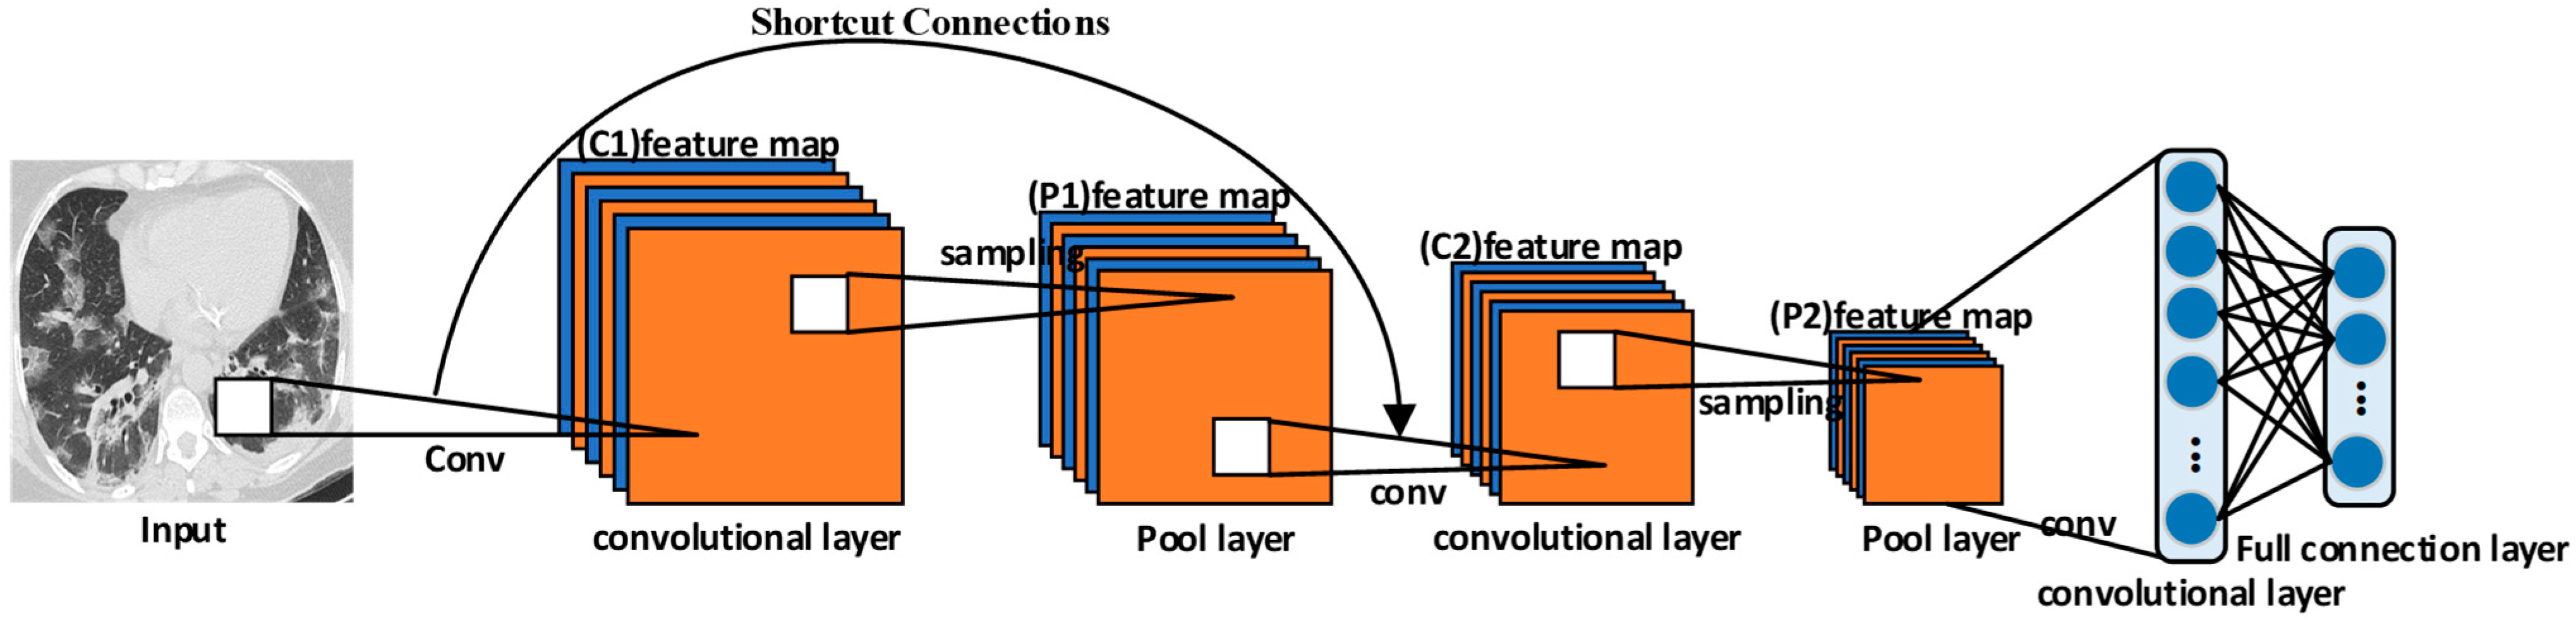
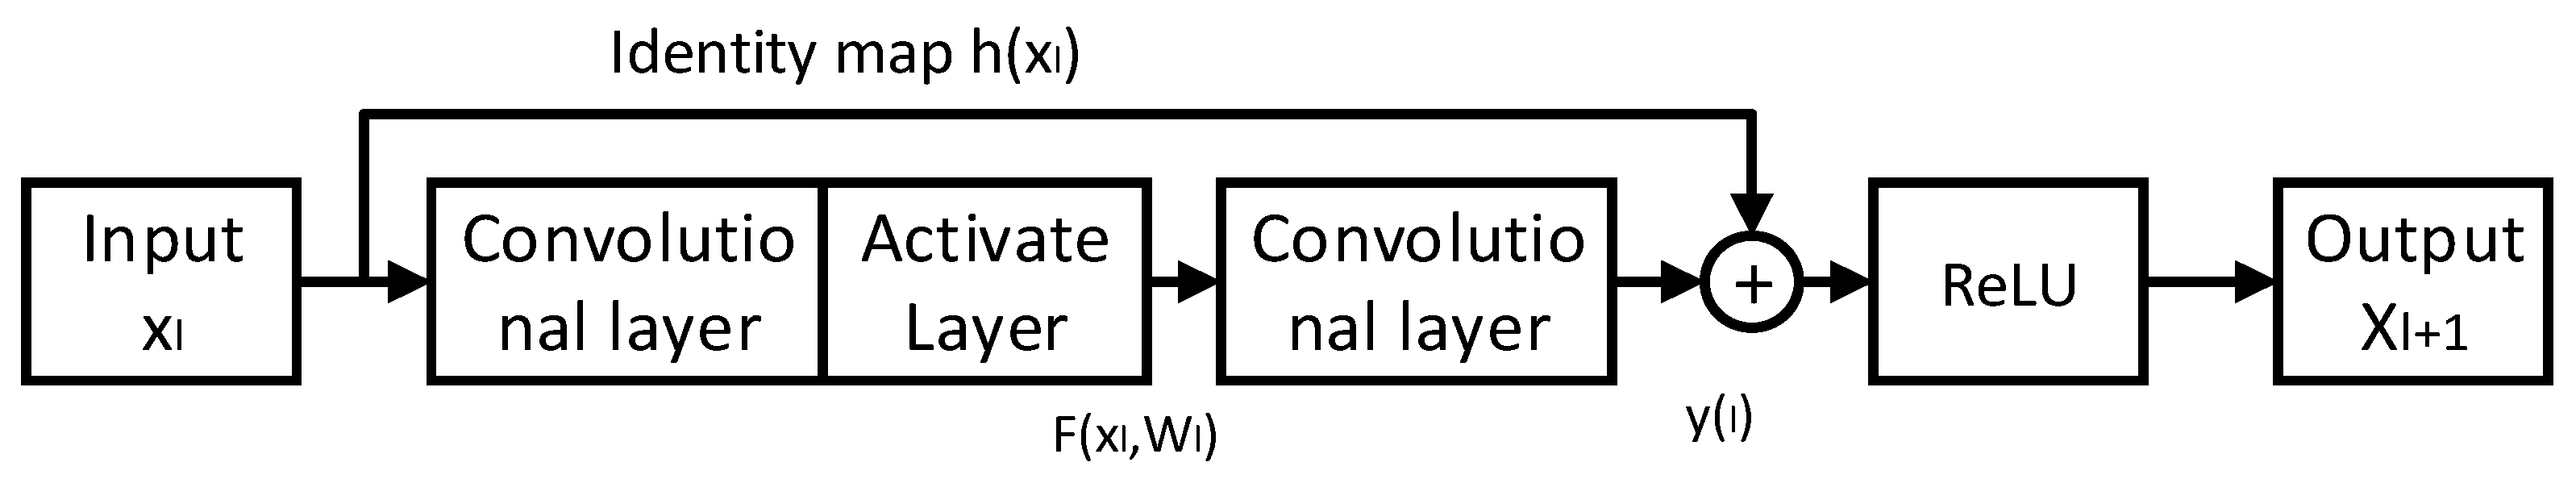
The problem of gradient disappearance in the deep network is solved by the residual neural network (ResNet) [11]. It has the advantages of being a simple network structure and having modularization. In this study, ResNet was selected as the basic network for improvement. At present, ResNet is a hot spot of deep learning and has also obtainedgood achievements in medical image processing. The auxiliary diagnosis of COVID-19 from CT images based on the ResNet model was successfully applied. Zhou [12] had an in-depth discussion on the integrated deep learning model of COVID-19 CT images. They showed that CT detection is one of the diagnostic criteria for COVID-19 and is of great significance for the treatment of COVID-19. Mamalakis M [13] proposed a new deep transfer learning model, DenResCov-19. The DenResCov-19 model can diagnose COVID-19, pneumonia, tuberculosis, or healthy patients according to CXR images. Minaee S [14] used the method based on transfer learning to classify COVID-19 and normal chest images using ResNet18, ResNet50, DenseNet-121 [15], and other models.
Although the ResNet model has made good achievements in the field of medical image classification, there are still some problems with the recognition of COVID-19 CT images. The lesion size of COVID-19 is smaller, the lesion shape of COVID-19 is more complex, and the lesion tissue of COVID-19 is less different from the normal. It is difficult to extract features of COVID-19 from CT images. The modelhas a difficult time focusing on the lesion area of COVID-19, which brings great challenges to the construction of the classification model [
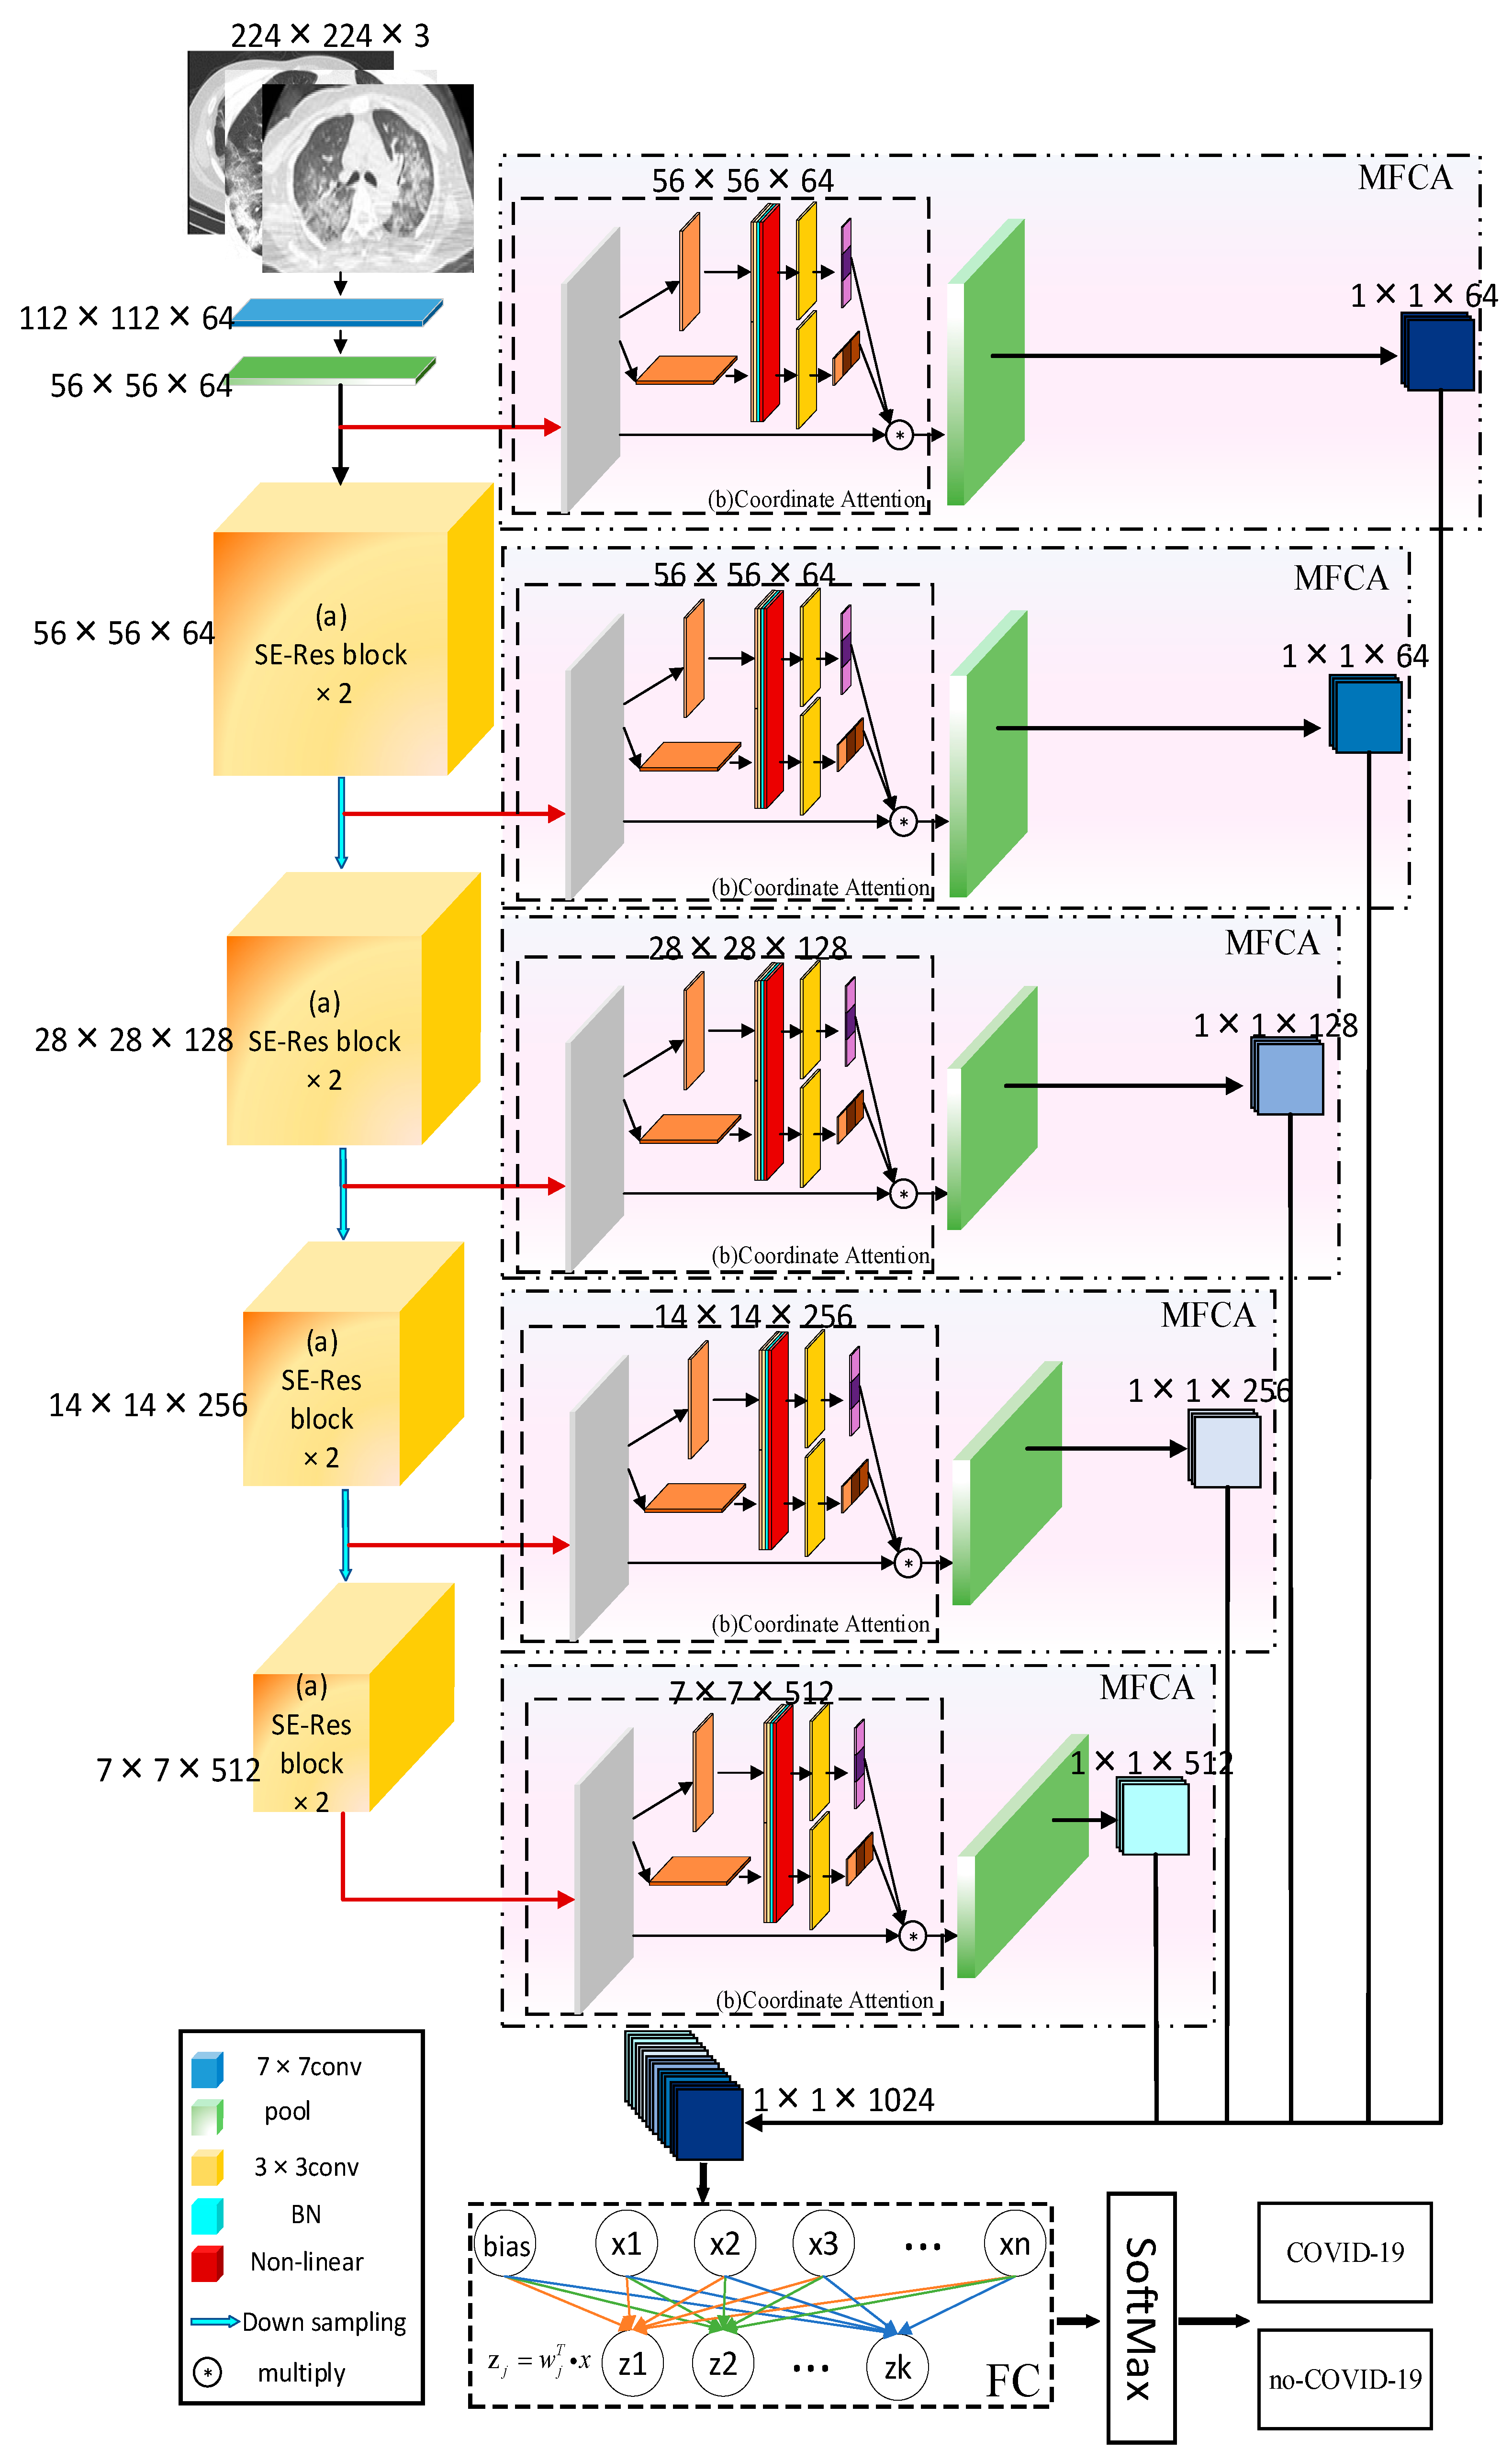
16]. In order to solve these problems, a multilevel feature aggregation attention surplus network model based on ResNet, COVID-ResNet, was proposed. It was used to classify chest CT images and diagnose whether patients were infected with COVID-19. In this study, the main contributions include the following two aspects.
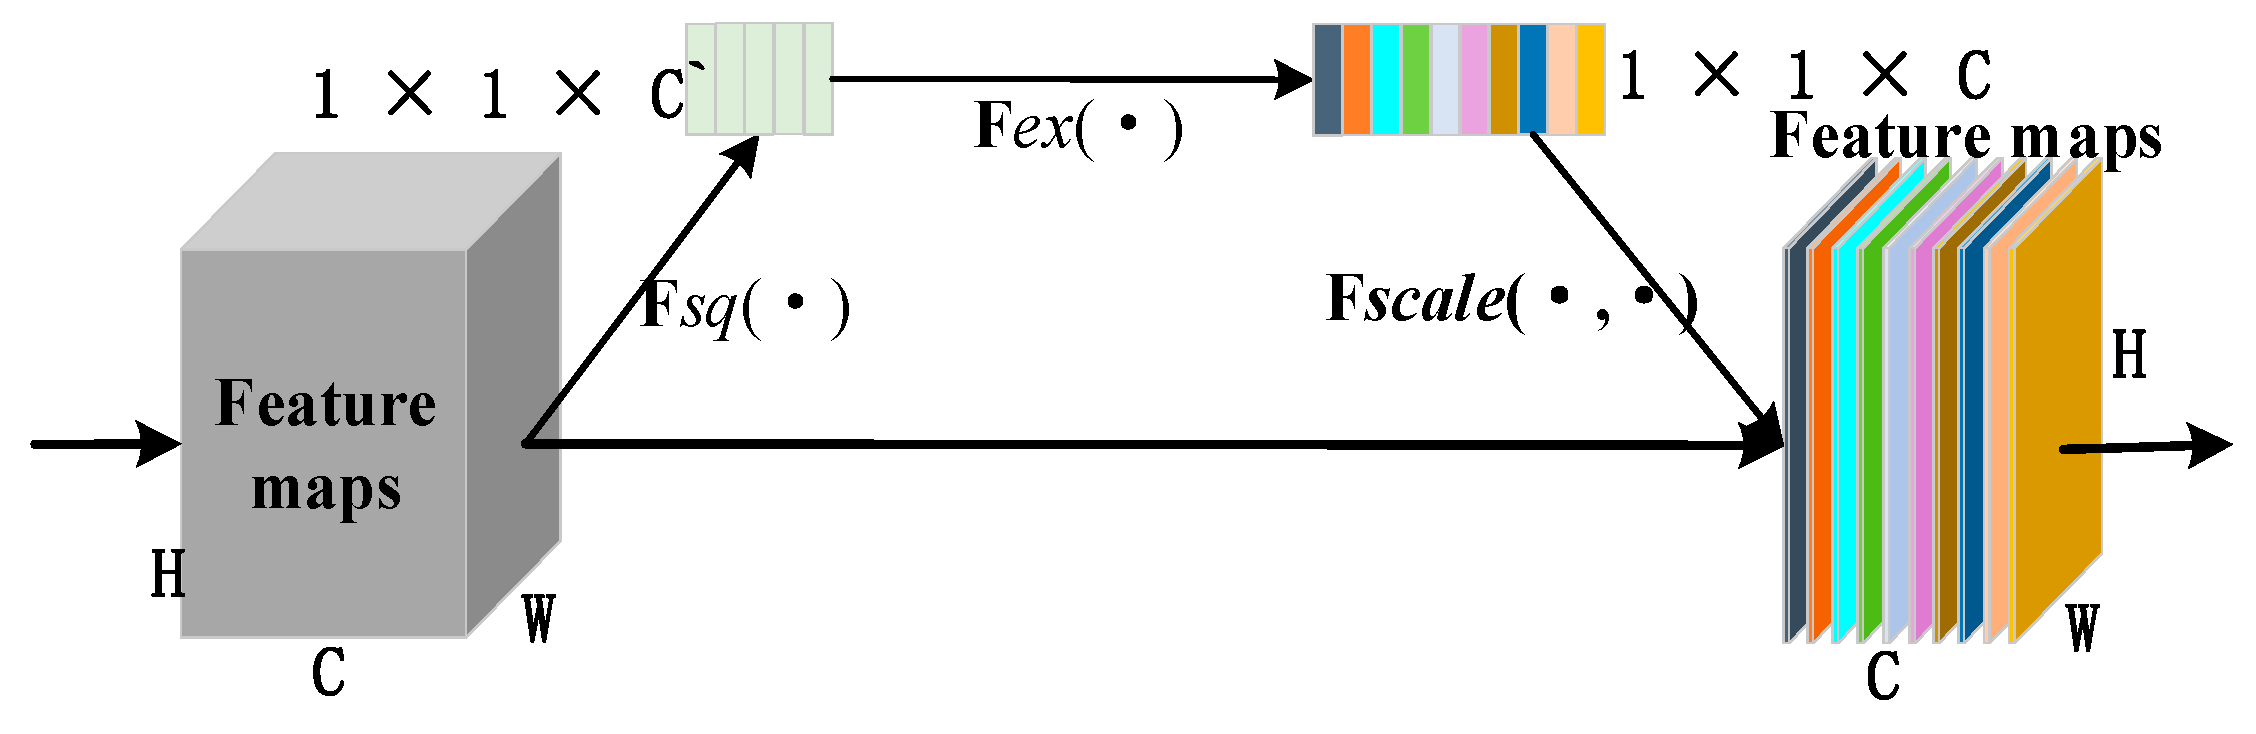
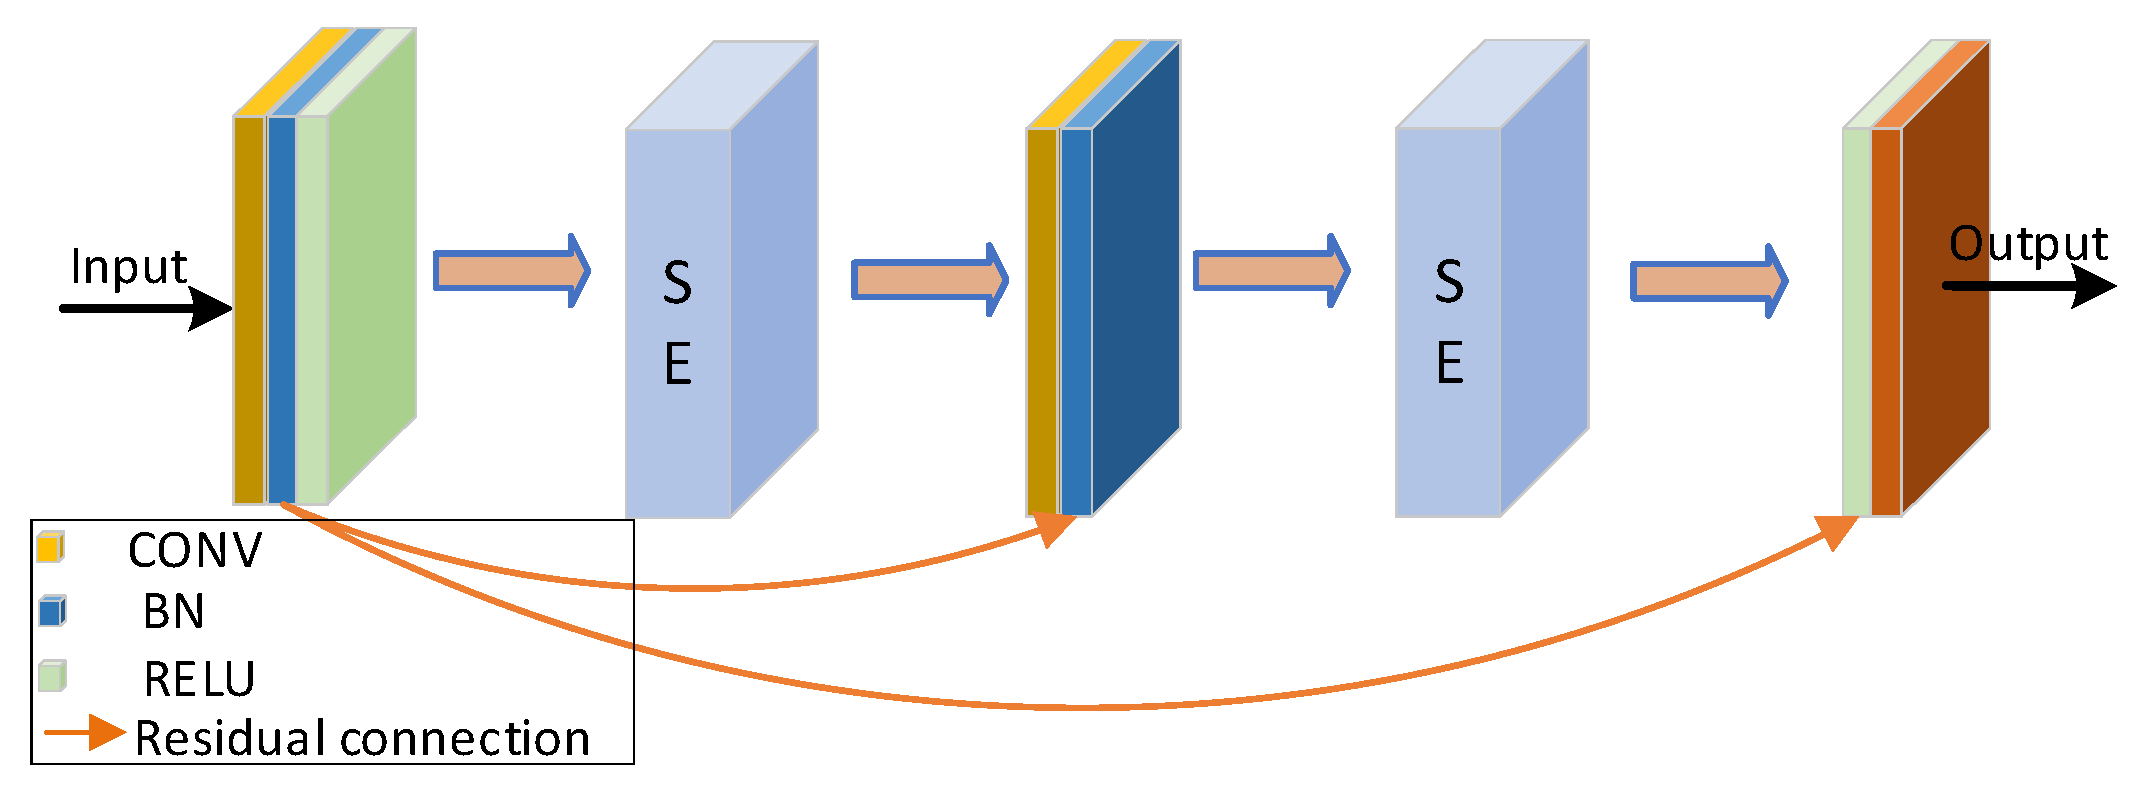
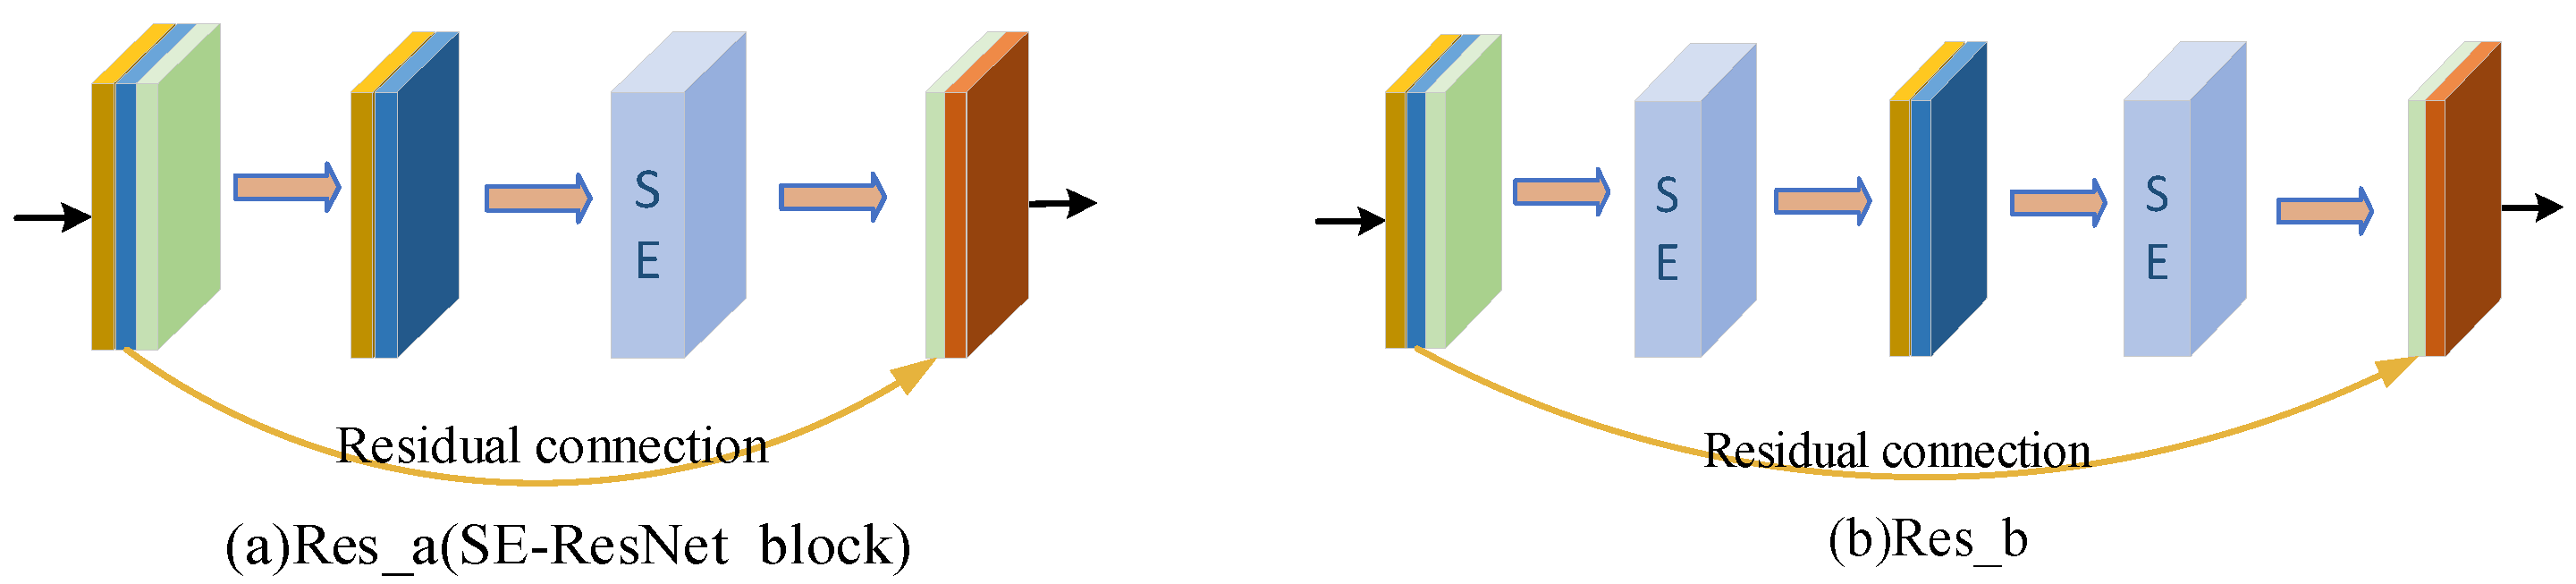
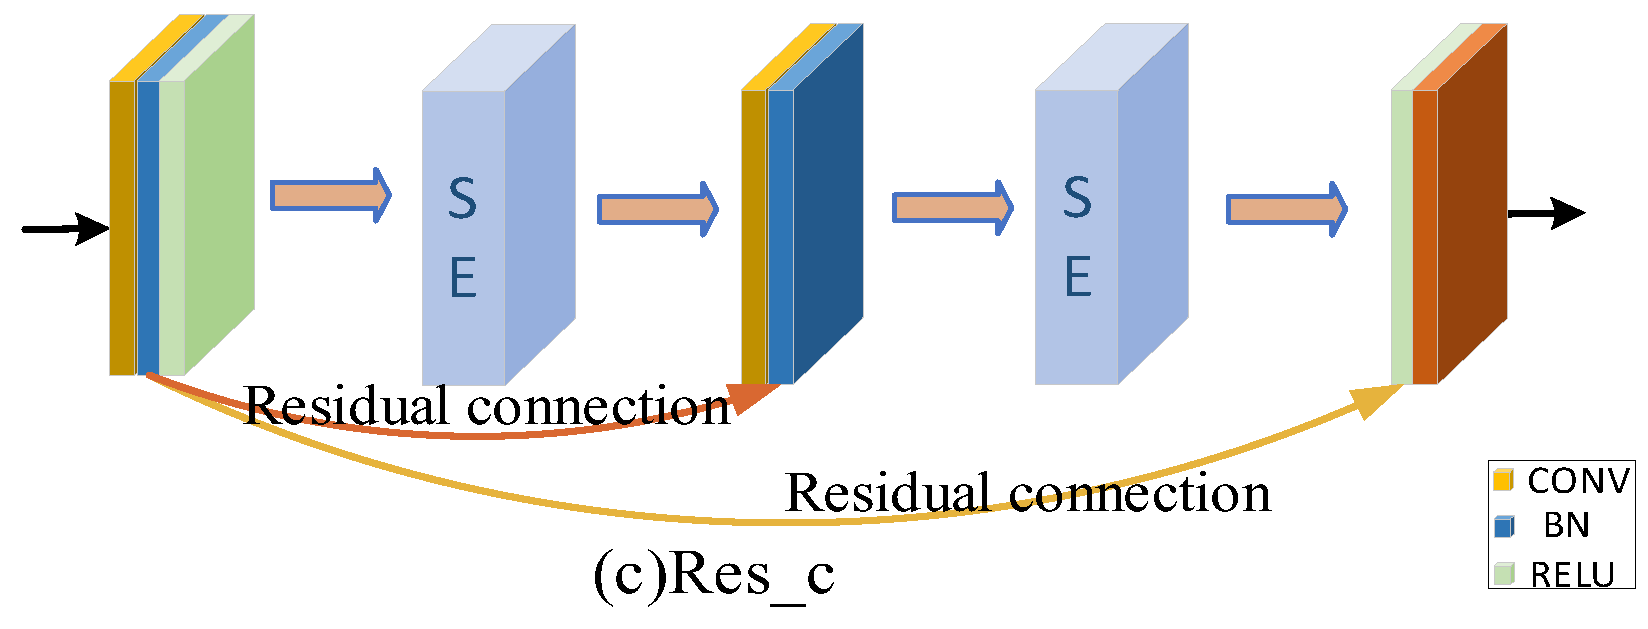
Firstly, according to the analysis of the sample characteristics, the samples with correct classification were more focused on the lesion area. The samples with the wrong classification were more focused on the background or other areas. In order to further improve the screening ability of the network for channels of the feature map, we focused on channels that had more information about the lesion area. The extrusion excitation module was introduced into the residual block and the residual connection was added. We focused on the high response channel of COVID-19 to improve the robustness of the model.
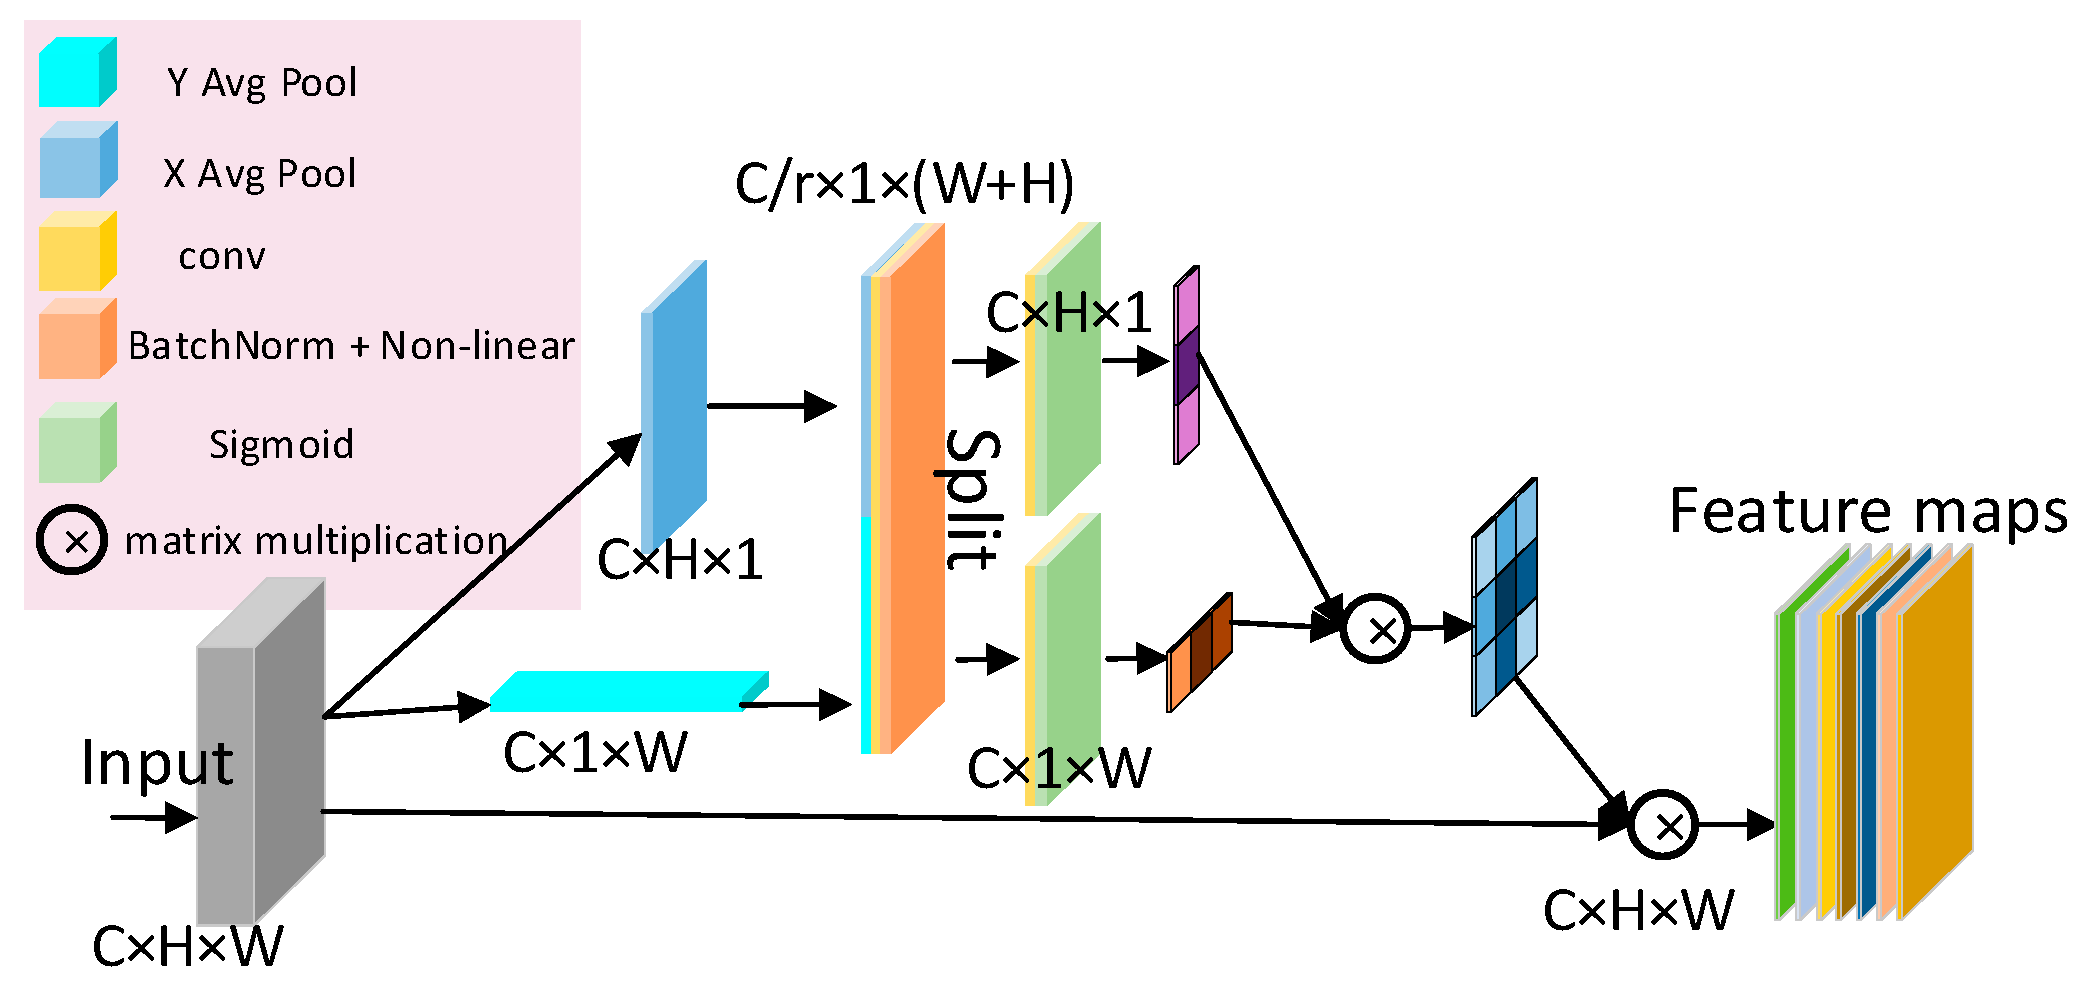
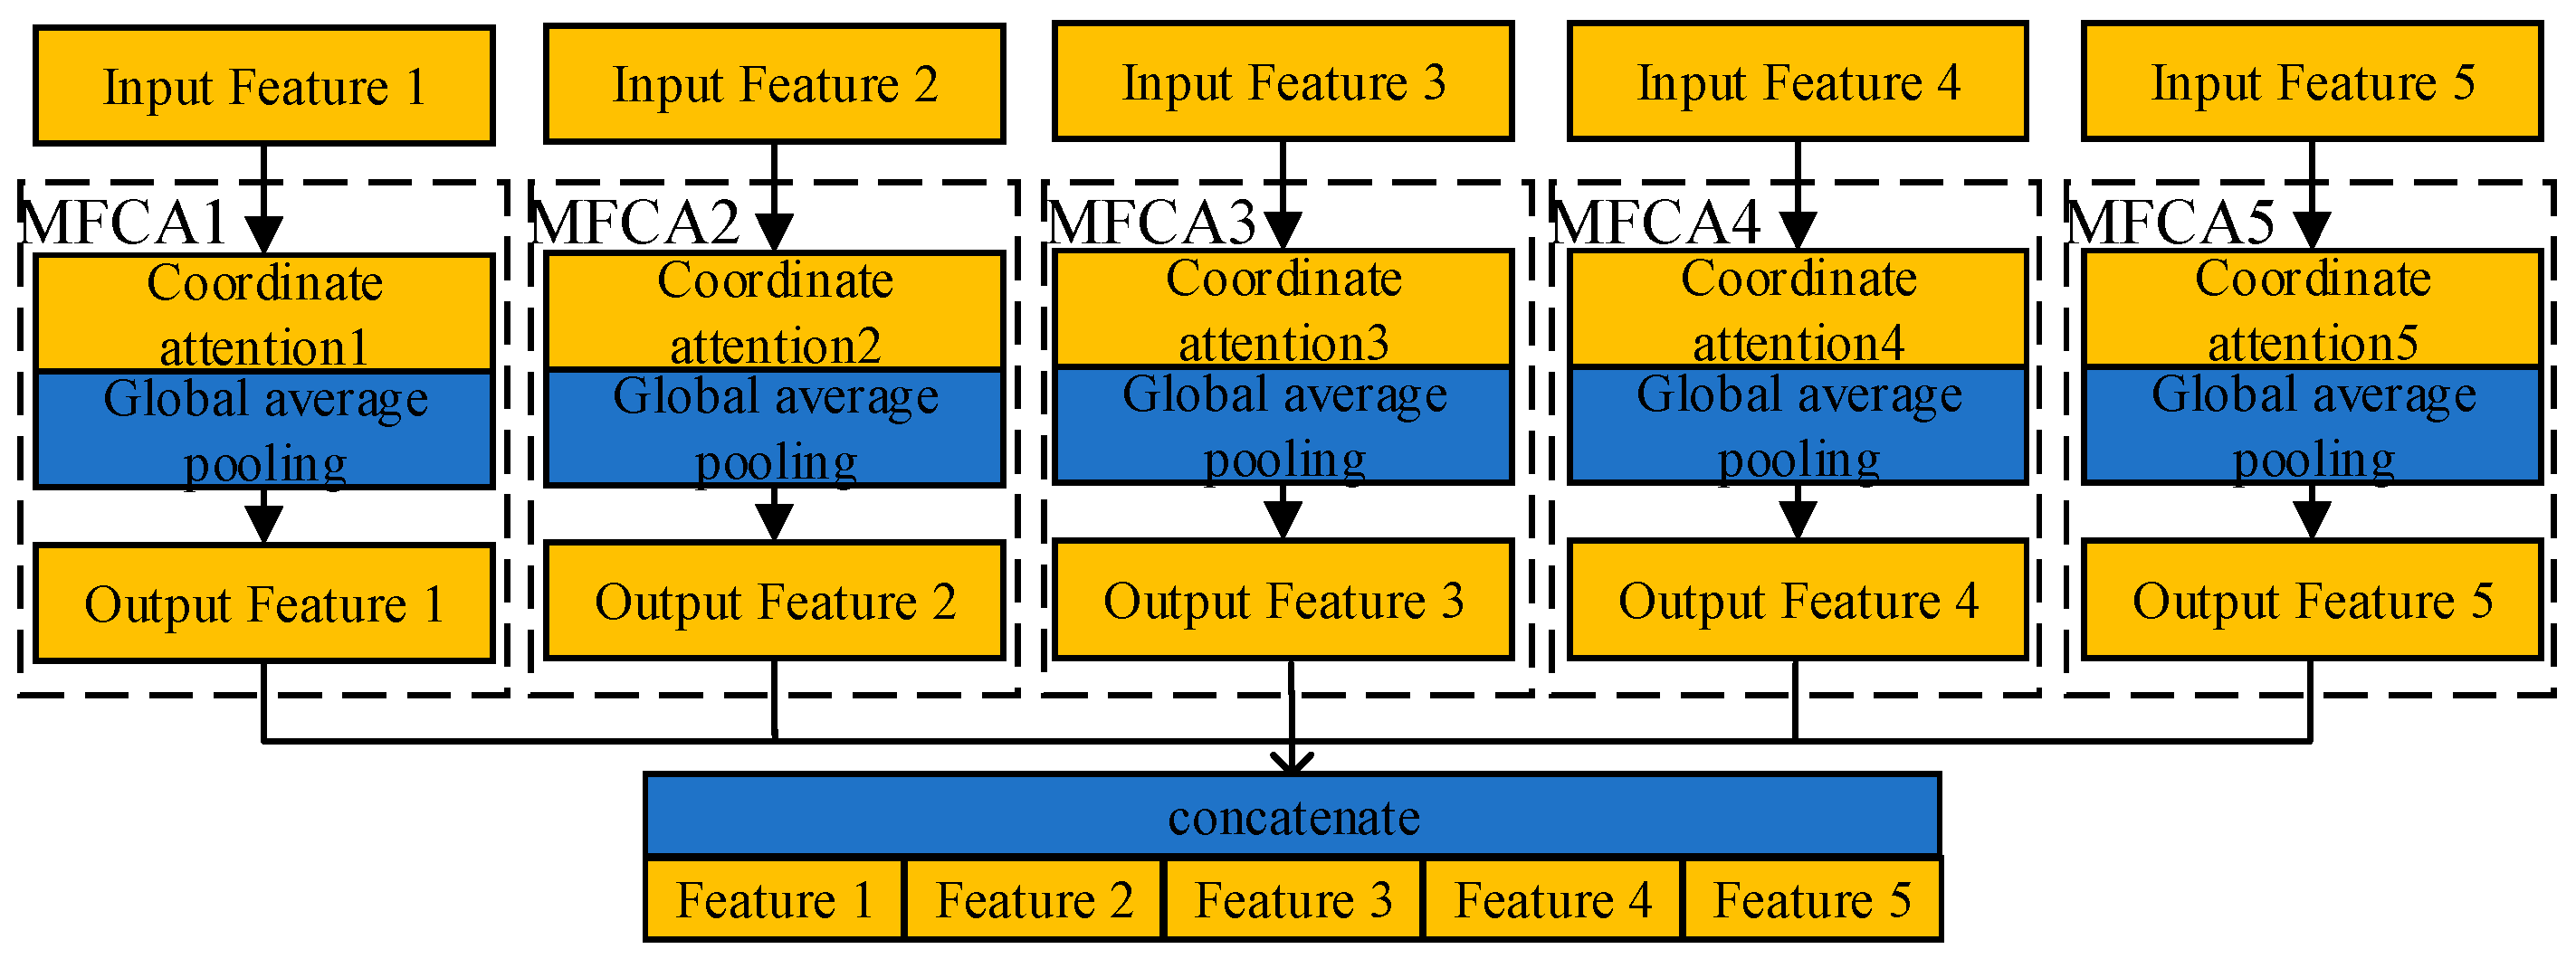
Secondly, most of the lesion areas in the CT images of COVID-19 were widely distributed structures. Deep learning was not enough for the direction feature extraction when featuring extraction. For this reason, a Multi-layer Feature Converge Attention (MFCA) module was proposed. It focused on the direction feature of the COVID-19 lesion area with coordinated attention and enhanced the extraction ability of focus features. It input the features of different levels into the deep layer and gathered the shallow features and deep features. It realized information complementation and avoided overfitting.
The work was organized as follows: Section 2 sketches the structure of ResNet and introduces the COVID-ResNet and all its internal components. Section 3 describes various experiments and ablation experiments for different COVID-19 screening tasks. Results and their discussion are presented in Section 4. Conclusions and future work are presented in Section 5.

2. Materials and Methods

There is a diagnosis of COVID-19 in this article. There were two types of CT images in the dataset: COVID-19 and no COVID-19. The dataset was divided into training sets, verification sets and test sets. The original images of different sizes were scaled to 224 × 224 pixels. The image was imported into the COVID-ResNet. COVID-ResNet was improved based on ResNet. The SE-Res block and the MFCA module were proposed. The following will provide an overview of ResNet and introduce the COVID-ResNet and all its internal components.

2.1. ResNet

The convolutional neural network learns the deep features of images by increasing the number of convolution layers and pooling layers, such as in LeNet [17], AlexNet [18], VGG [19], and other models. With the increase in the number of layers of the convolutional neural network model, some problem appeared, such as gradient disappearance and network degradation. The network convergence speed has become slower and the classification performance has become worse. In order to solve this problem, He Kaiming [11] put forward a residual neural network (ResNet) model in 2016. The network structure is shown in Figure 1. The convolution layer and pooling layer were overlapped to achieve classification effects in the full connection layer.
The ResNet achieved identity mapping by using shortcut connections outside two weight layers. Adjacent convolution layers achieved residual connection by cross-layer connection to form residual blocks. The residual connection made the loss value no longer increase. It solved the problem of gradient disappearance and gradient explosion caused by network deepening. The residual block structure is shown in Figure 2. The input and output are defined as xl and yl, respectively. The residual function based on ResNet learning is F(xl,Wl) = H(x) − x [Appendix A]. The identity mapping ensured that the network performance would not decline, and would retain the shallow features while learning deep features. The identity mapping of ResNet would not increase the additional parameters quantity and computation quantity, but it would also improve the network training effect. Therefore, ResNet was used as the basic framework for the network design.

2.2. COVID-ResNet

COVID-ResNet, an aide diagnosis model of COVID-19 based on CT images, was proposed. Firstly, the network structure with Squeeze-and-Excitation ResNet (SE-Res) block as the main network was constructed, and it was named SE-Res block. The SE-Res block introduced the SE module with the residual connection into ResNet. It made the network focus on channels with more information about the lesion area.secondly, the Multi-layer Feature Converge Attention(MFCA) module was designed. It extracted multi-layer features using coordinate attention, and improved the ability of feature extraction about the lesion area. It could unify the size to 1 × 1 by using the global average pooling operation for different feature scales obtained at different levels. Thirdly, the features were introduced into the deep layer for feature aggregation, which made information complementary and reduced overfitting. Finally, image recognition was achieved. Figure 3 shows the network architecture.
The lung CT dataset image of COVID-19 is shown in Figure 4. From the CT images of the lung, it can be seen that most of the lesions of COVID-19 presented a wide distribution of structures such as sheet, mesh, filamentous, or large scattered spots. In the process of feature extraction, the direction feature extraction of depth learning is not enough, and it is easy to ignore the features of texture direction. In order to solve this problem, a coordinate attention operation was carried out for the features extracted from each residual block. Channel attention was decomposed by coordinate attention into two 1-dimensional feature encoding processes, which aggregated features in horizontal and vertical directions, respectively. Remote dependencies were captured in one direction, location information was retained in another direction, and they improved the ability to extract the direction features of the lesion area.
Table 1 describes the structure, dimensions of the overall architecture in detail.

2.2.1. Squeeze-and-Excitation

In image feature extraction, the attention mechanism can enhance the ability of the feature selection. In 2017, Jie H [20] proposed an attention mechanism structure, Squeeze-and-Exception (SE), and named it SENet. The SE model can pay more attention to channel features with a large amount of information and suppress unimportant channel features. The features of different channels of the image have semantic relevance, but convolution cannot obtain the relevant information with the channels of the feature map. The SE module captures the global channel information of the feature map through the global average pooling operation and full connection layer. It establishes the dependency relationship with different feature channels, improves the screening ability of the network for channels, and makes the network focus on the high response channel of COVID-19.
The structure of the SE module is shown in Figure 5. The input feature map of the SE module is x = x 1 , x 2 , , x c . The dimension of the feature map is W × H . The number of channels is C. The output feature map is X ~ = x 1 ~ , x 2 , ~ , x c ~ . Converting the input feature map X F t r : X U X R W × H × C , U R W × H × C :
u c = v c × X = s = 1 c v c s × X S
This is a set of convolution operations. v c is the cth convolution kernel. X s is the s-th of input. Then the Squeeze operation is performed. The global average pooling operation of the input feature map X, compressed into a vector with the size 1 × 1 × C :
Z c = F s q u c = 1 H × W i = 1 H j = 1 W u c i , j
wherein, Z c is the feature vector of the cth channel in vector Z, and then let the global information merge together through the excitation operation of two full connection layers. Through adaptive learning of the corresponding weight parameter matrix W 1 , W 2 , the vector S is obtained:
S = F e x Z , W = σ g Z , W = σ W 2 δ W 1 Z
Among them, σ activates the function for sigmoid, δ is the ReLU activation function, F e x represents the excitation operation, and W 1 and W 2 are the dimension reduction parameter and dimension increase parameter of the full connection layer or convolution layer, respectively. Finally, once the weight s c of vector S is weighted to the channel of the feature map X , the weighted feature map X ~ is obtained:
x c ~ = F s c a l e u c , s c = s c u c
wherein, x c ~ is the feature map of channel c in X ~ . The function F s c a l e x c , s c multiplies the weight factor and the feature map, and each channel obtains the feature map with different weights, thus enhancing the transmission of useful information.

2.2.2. SE-Res Block (Squeeze-and-Excitation ResNet Block)

As shown in Figure 6, the SE-Res block was improved based on the residual block of the ResNet18 model. There were two convolution layers in the residual block. COVID- ResNetadded an SE module after two-layers convolution of the residual block. The attention mechanism could be used to focus on the channel of important information. In addition, two residual connections were introduced for two SE modules to reduce overfitting.

2.2.3. Coordinate Attention

In view of the widely distributed structure of COVID-19 CT images, it was necessary to propose a feature extraction method that could capture remote dependencies. Channel attention would significantly improve the performance of the model. However, channel attention usually ignores the location information, which is very important for generating spatial selective attention maps. CBAM [21] and other methods obtain location information by reducing the number of channels and using large-size convolution. This model does not work well for long distance dependence. Coordinate attention [22] decomposes the channel attention into two 1-dimensional feature encoding processes. The pooling operation is performed in the horizontal and vertical directions, respectively [23]. These features were combined to capture remote dependencies while retaining accurate location information. It could capture the lesion structure of COVID-19 and enhance the expression of the lesion area. The structure is shown in Figure 7.
Coordinate attention encodes each channel in both the horizontal and vertical directions:
Z c = 1 H × W i = 1 H j = 1 W x c i , j
where, x c is the feature map of the c-th channel, and the feature mapof c × 1 × w and c × 1 × h directions are obtained as follows:
Z c h = 1 W i = 0 W x c h , i ; Z c w = 1 H j = 0 H x c j , w
where Z c h is the output of the c-th channel with height h; and Z c w is the output of the c-th channel with width w. The global receptive field and position information can be obtained through the above operations. After splicing the two output results, use 1 × 1 convolution to transform them:
f = δ F 1 Z h , z w
where, Z h is the output of all channels with height h, Z w is the output of all channels with width w , Z h , Z w is the splicing operation of feature maps in two directions, f is the intermediate feature mapping of spatial information in coding, and δ is a nonlinear activation function. Then, divide the horizontal and vertical dimensions into f h and f w , and conduct the 1 × 1 convolution F h and F w respectively:
g h = σ F h f h ; g w = σ F w f w
Among them, σ is the sigmoid activation function, the output g h and g w values are the weights of the vertical and horizontal attention, and the output feature image is:
y c i , j = x c i , j × g c h i × g c w j

2.2.4. MFCA (Multi-Layer Feature Converge Attention)

The Multi-layer Feature Converge Attention (MFCA) module was built. The structure of the MFCA is shown in Figure 8. The MFCA module performed coordinate attention operations on the feature of different levels of the backbone network. Then, the global average pooling operation unified the size to 1 × 1. the results were input into the deep network for feature aggregation. When multiple features were gathered, downsampling was required to match the final input size. If the size dropped too fast, the information would be lost seriously. Using a single average pooling operation would make the features smooth and lose the feature information of prominent lesions. Therefore, the coordinate attention operation was carried out before the multilevel feature convergence to obtain enhanced expression of lesion information. Downsampling for feature concatenation could reduce the loss of lesion information and simplify the feature smoothing. The MFCA module carried out feature aggregation to aggregate deep and shallow features. It could transmit important information to the deep layer in order to achieve complementary information and prevent overfitting.

3. Results

In this section, the network was used to identify whether the patient was ill. The following will introduce the experimental environment and datasets, compare the classification effect of different networks with COVID-ResNet to prove the advantages of the COVID-ResNet, and the ablation experiment that was carried out to verify the effectiveness of the COVID-ResNet.

3.1. Experimental Environment

Hardware environment: The 64-bit system of the Windows Server 2019 Datacenter was equipped with Intel Xeon Gold 6154 and a3GHz x36 CPU processor. The computer had 256 GB of memory and used two parallel TITANV graphics cards to speed up image processing.
Software environment: The program was written in Python language. The network was built and trained based on the GPU version of the Python framework. The Adam optimizer was used for optimization, and the model architecture was tested and evaluated.
Parameter setting: In the parameter setting, the learning rate was multiplied by 0.9 for every 10 training cycles. An initial learning rate of 0.001 was used on the chest CT dataset of COVID-19. The Adam optimizer randomly selected one sample at a time for the training and gradient updates, and the learning rate decay value was set to 1 × 10⁻⁵ after each update. In order to slow down the oscillation degree of gradient decline and accelerate convergence, a momentum of 0.9 was used. The optimal gradient was a weighted average of the gradient index from the beginning to the current moment. For the chest CT dataset of COVID-19, the training cycle was set to 150 and the training batch size was set to 32. The loss function used cross-entropy loss. From Figure 9, it can be seen that when the number of iterations exceeded 80, the loss value tended to stabilize and eventually dropped to about 0.2.

3.2. Datasets

With the emergence of COVID-19, many academic studies have been carried out so far on COVID-19. Some researchers have created datasets based on the original data and made them available to the public. The COVID-19 patient dataset combines two published COVID-19 recognized public data. The first public dataset is a large CT scan dataset downloaded from Kaggle for SARS-CoV-2(COVID-19) recognition [24]. The dataset was released by researchers at Lancaster University in the UK. It is a public dataset of lung CT imagesof COVID-19 classification collected from real patients in Sao Paulo Hospital, Brazil, which is provided free of charge from Kaggle. The second is the public dataset about COVID-19 (https://github.com/UCSD-AI4H/COVID-CT accessed on 27 January 2021). It includes 349 COVID-19 images and 397 non-COVID-19 images from 216 patients. The original images of the two datasets are shown in Figure 10. According to the ratio of 6:2:2, the dataset was re-divided into the training set, verification set, and test set for the classification experiment. The specific distribution of datasets is shown in Table 2. The original images of different sizes were scaled to 224 × 224 pixels. They were then convertedinto vector format and the pixel values were normalized.

3.3. Experimental Results

The experiment part shows the comparison results of classification effects with different networks. Nine kinds of models that are similar to COVID-ResNetwere selected for comparison. Theywere ResNet18 [11], DenseNet121 [15], Googlenet [25], ResNext50 [26], SE-ResNet18 [20], Xeption [27], Inceptionv3 [28], Inceptionv4 [29], EiffecienNetb0 [30], and the COVID-ResNet training in the sample space of chest CT images. According to the recognition accuracy and training time of different network models, we explored their recognition rate and efficiency in different sample spaces. An experiment with the model parameters, accuracy, precision, recall, F1 score, and AUC value [Appendix B] was used to verify the effectiveness of the experiments.The comparison results are shown in Table 3.
As shown in Table 3, it can be seen that the comprehensive performance of COVID ResNet was better than other models.The COVID-ResNet made improvements based on ResNet18. The parameter of COVID-ResNet was 96.94MB, which is 1.66MB more than the ResNet18. The accuracy rate, precision rate, recall rate, F1 score, and AUC value of COVID-ResNet were 96.89%, 95.79%, 98.15%, 96.96%, and 99.04%, separately. Compared with ResNet18, the accuracy rate increased by 3.1%, which means that the COVID-ResNet has a good improvement effect. In order to intuitively display the contrast effect with other networks, a visual radar chart is added as shown in Figure 11. The red line is the result of COVID-ResNet. It can be seen that the evaluation index based on COVID-ResNet is superior to other models.
Figure 12 shows the confusion matrix for other models identifying COVID-19 in the training set. It was created in order to further compare the performance differences among ResNet18, DenseNet121, Googlenet, ResNext50, SE ResNet18, Xeption, Inceptionv3, Inceptionv4, EiffecienNetb0, and the COVID-ResNet. The details of the prediction of each network can be seen in Figure 12, and the correct and wrong predictions of each network can be compared.
The COVID-ResNet model identified the confusion matrix of COVID-19 on the training set in Figure 13. It can be seen from the comparison result of the confusion matrix that COVID-ResNet had a better recognition effect. It verified the advantages of COVID-ResNet in the CT image recognition of COVID-19. The attention mechanism was used to focus on channels with more information about the lesion area. Multilevel feature aggregation was used to obtain more information. The feature used for classification had enough information about the lesion area, so as to obtain a higher recognition accuracy.

3.4. Ablation Experiment

In order to verify the effectiveness of different modules in the network, ablation experiments were carried out. Two improvements were made, one was to add the SE block and residual connection to the Res block, the other was to add the multilevel feature concatenation method to the overall structure. Ablation experiments were carried out based on the COVID-19 CT image dataset to verify the effectiveness of the algorithm. We improved the SE-Res block, as shown in Figure 14. The module of the SE-ResNetwas shown in Figure 14a. An SE block was added as shown in Figure 14b. A residual connection was also added as shown in Figure 14c. The ablation results of various methods are shown in Table 4.
We improved the SE-Res block and added branches of multilevel features. Experiment 1: ResNet18 network; Experiment 2: ResNet18 was added with the multilevel feature; Experiment 3: SE-Res block was Res_a—it is the SE-ResNet18 network structure; Experiment 4: SE-ResNet18 network structure was added with the multilevel feature; Experiment 5: SE-Res block was improved to Res_b’s network structure; Experiment 6: The network structure of Experiment 5 was added with the multilevel feature; Experiment 7: SE-Res block was improved to Res_c network structure; Experiment 8: the network structure of Experiment 7 was added with the multilevel feature—it is the network architecture of COVID-ResNet. Table 4 shows the comparison results of the ablation experiments. Three kinds of SE-Res blocks were compared in the ablation experiment, Res_a, Res_b, and Res_c, separately. In the case that there is no multilevel feature and there is multilevel feature, Res_c always performed best. It can be seen that the accuracy rate of COVID-ResNet reached 96.89%. The addition of each module or component improved the accuracy of identification. The increase in themultilevel feature made the accuracy rate improve again. It verified the effectiveness of adding modules or components. It can be seen from the ablation experiment that the performance of the network could be significantly improved by adding the multilevel feature aggregation operation. It showed that multilevel feature concatenationwas effective. The method of interactive enhancement and complementary splicing of deep and shallow features could significantly enhance the ability of the model to recognize COVID-19.

4. Discussion

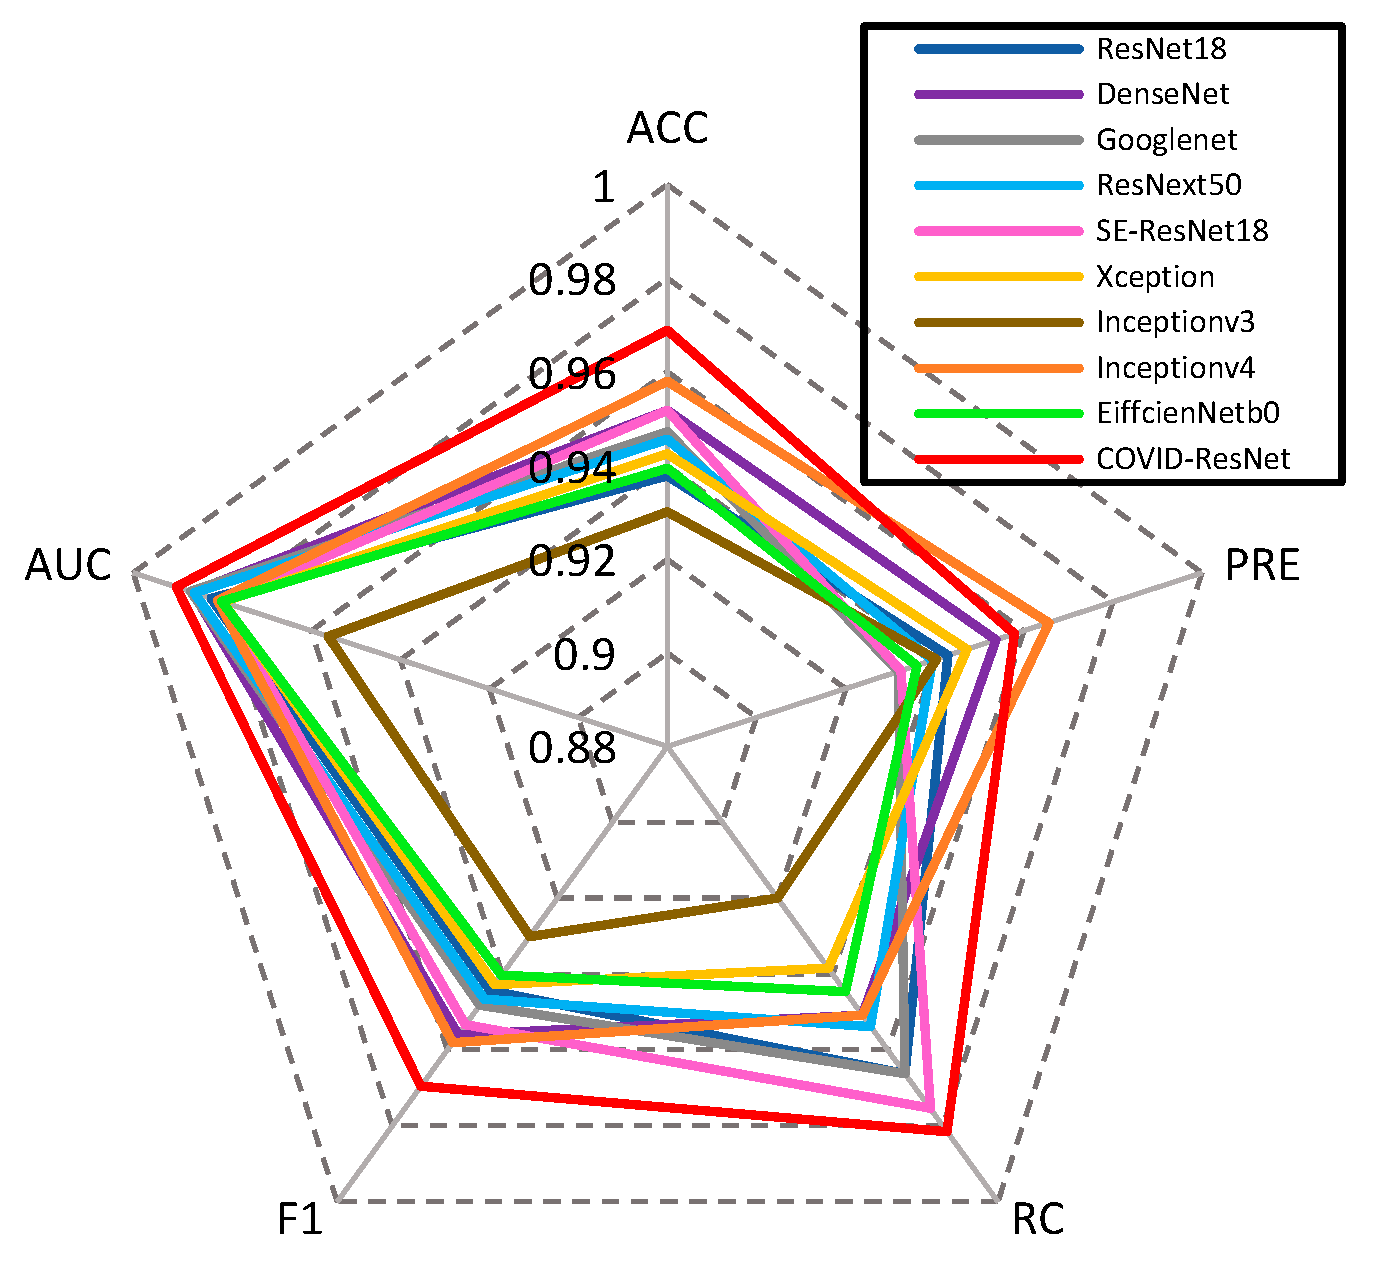
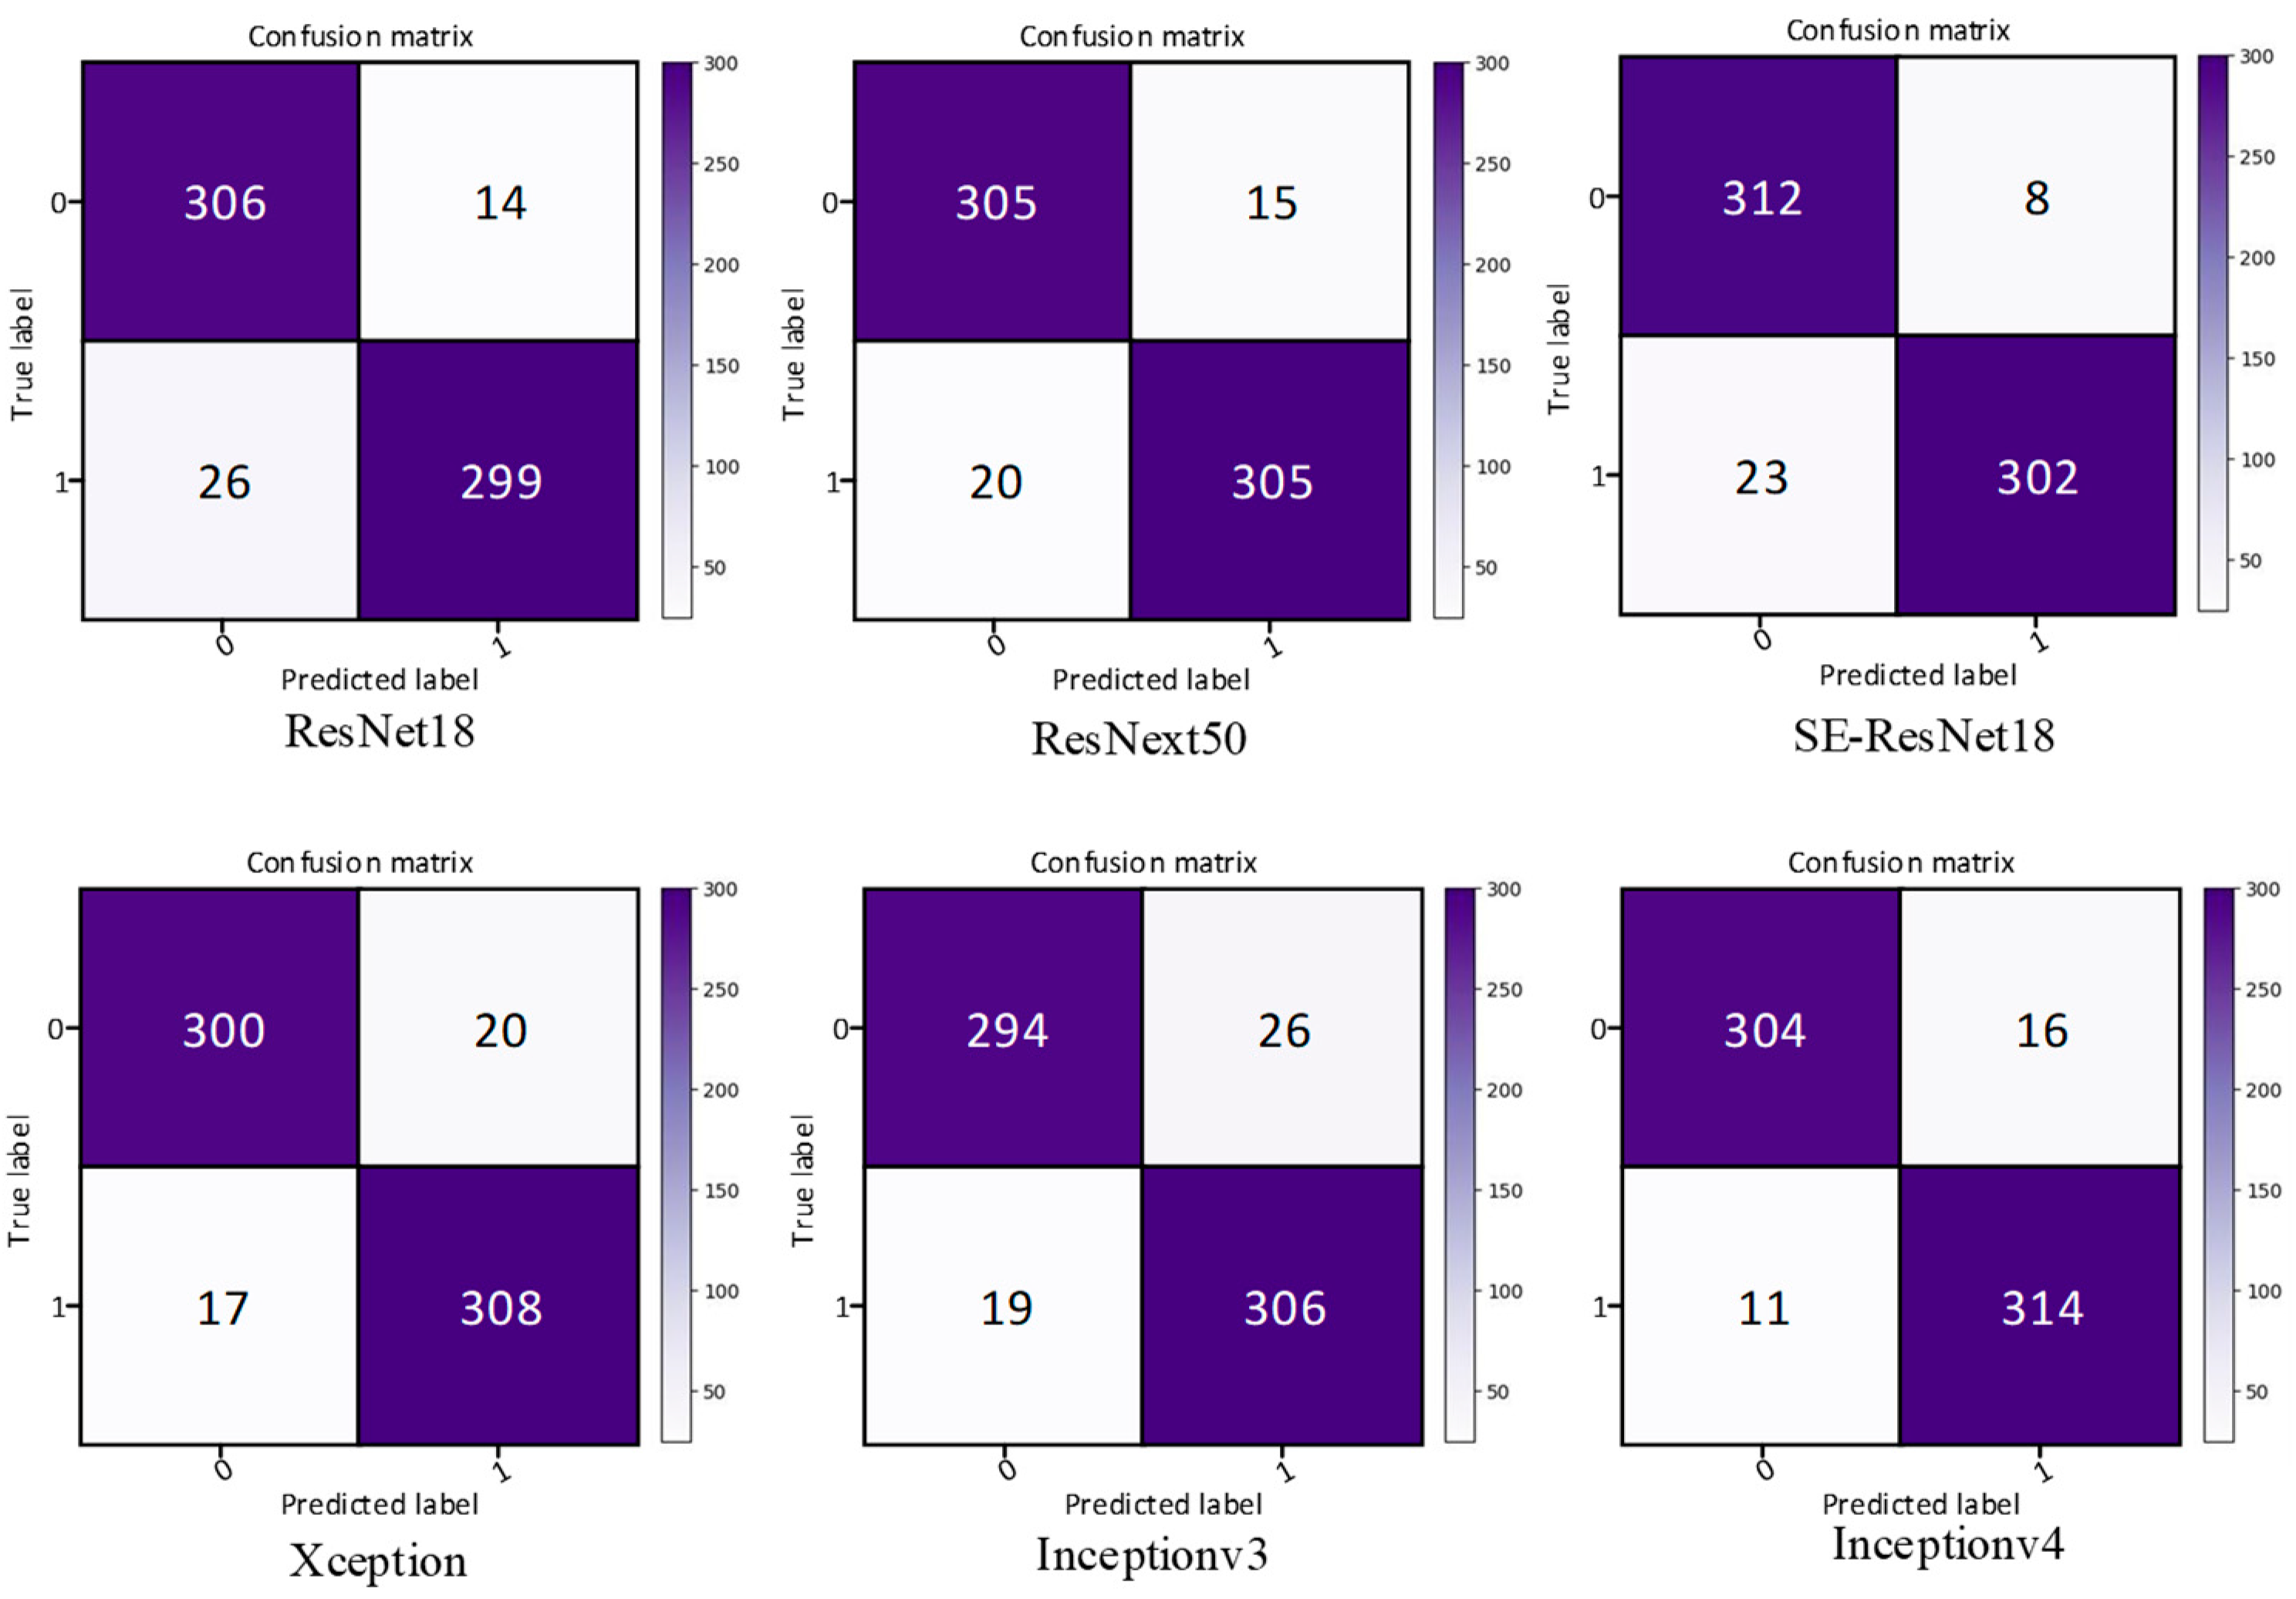
In order to solve the problem of computer aided diagnosis, a CT image diagnosis model based on improved attention ResNet was proposed. Firstly, the SE block was introduced into the residual neural network based on the semantic correlation of features with different channels of COVID-19 CT images. It improved the ability of the network to filter channels, so as to focus on the highly responsive channels of COVID-19. Secondly, in order to extract the directional features of COVID-19, the coordinated attention was introduced to improve the recognition ability of lesion features. Then, the MFCA module was proposed. The MFCA module transferred the features extracted from multiple coordinates into the deep layer for multilevel feature aggregation to make up for the feature loss caused by downsampling. It made the information complementary and further improved the recognition effect. Finally, the features were classified to identify whether they were infected with COVID-19. The COVID-ResNet was used to classify and recognize the CT image dataset of COVID-19. The accuracy, recall rate, F1 score, and AUC value could reach 96.89%, 98.15%,96.96%, and 99.04%, separately. The experimental results showed that the performance of COVID-ResNet was better than similar networks. The results of ablation experiments showed that the accuracy of recognition could be greatly improved by adding the SE block and coordinate attention model. At the same time, the combination of deep features and shallow features for information complementation could significantly improve the recognition rate. The classification based on the CT image dataset of COVID-19 had certain clinical application value for aiding the diagnosis of COVID-19. COVID-ResNet can effectively assist doctors with identifying COVID-19, improve doctors’ work efficiency, and reduce misdiagnosis.

5. Conclusions

A recognition method for COVID-19 based on ResNet was proposed and studied. As a detection framework, it could provide more accurate classification results in the field of recognition through lung CT images. The SE-Res block and MFCA module were proposed. It was aimed at the problemsof there being difficulty in the feature extraction from CT images of COVID-19, and that lesions of COVID-19 are difficult to focuson. In this study, the effectiveness of COVID-19 recognition by COVID-ResNet was tested. The results showed that the SE-Res block could better focus on the lesions of COVID-19. Shallow features and deep features were converging because of the MFCA model, and the extraction ability of lesion features was enhanced.
In the future, we will develop another recognition method from the following aspects:
(1)
COVID-ResNet achieved good results in the classification of COVID-19 CT images. In this study, the dataset of COVID-19 included COVID-19 and no COVID-19. There were other diseases in the lung, including lung cancer, tuberculosis, and so on. Applying the networks to more types and multi-source datasets is the direction for future research tasks.
(2)
With the development of COVID-19, COVID-19 does not only infect the lungs, but also the upper respiratory tract. It is not enough to check the lungs. Other images can be used for screening in the future.
(3)
In the future, other networks of deep learning can be used for auxiliary diagnosis. For example, DenseNet, Capsule Network, Googlenet, etc.

Author Contributions

Conceptualization, T.Z. and X.C.; methodology, X.C. and X.Y.; software, X.C. and X.Y.; validation, T.Z., H.L. and F.H.; formal analysis, X.C. and Y.L.; investigation, X.C.; resources, T.Z.; data curation, X.C.; writing—original draft preparation, X.C.; writing—review and editing, T.Z. and X.C.; visualization, Y.L.; supervision, T.Z.; project administration, X.C.; funding acquisition, T.Z. and F.H. All authors have read and agreed to the published version of the manuscript.

Funding

This research was funded by National Natural Science Foundation of China, grant number 62062003 and This research was funded by Natural Science Foundation of Ningxia, grant number 2022AAC03149.

Informed Consent Statement

Not applicable.

Data Availability Statement

Conflicts of Interest

The authors declare no conflict of interest. Any role of the funders in the design of the study: in the writing of the manuscript.

Appendix A

Table A1. The summary table of mathematical notation.
Means
x 1 features map of input
y 1 features map of output
F x l , W l residual function
H x identity map
Xfeatures map of input about SE block
F t r Conversion operation
u Features after conversion operation
C number of channels
X ~ features map of output about SE block
Z feature vector
W weight matrix
σSigmoid
δReLU
F e x excitation operation
, concat operation
fthe intermediate feature mapping of spatial information in coding
F1 × 1 convolution
gweight

Appendix B

In this study, the accuracy rate, precision rate, recall rate, F1 score, and AUC are used as evaluation indexes to estimate the effectiveness of the model. The confusion matrix for the two-class problem is shown in Table A2. TP means to predict positive samples as positive samples, FP means to predict negative samples as positive samples, FN means to predict positive samples as negative samples, and TN means to predict negative samples as negative samples.
  • Confusion Matrix
The confusion matrix is a standard format for representing the accuracy evaluation. As shown in Table A2, each column of the confusion matrix represents the prediction category, and the total number of each column represents the number of data predicted for that category. Each row represents the real category of data, and the total number of values in each row represents the total number of data instances in this category. The values in each column represent the number of real data that are predicted to be of this type.
Table A2. Confusion Matrix.
Predicted as Positive SamplePredicted as Negative SampleTotal
Label as positive sampleTP (True Positive)FN (False Negative)TP + FN
Label as negative sampleFP (False Positive)TN (True Negative)FP + TN
TotalTP + FPFN + TNTP + TN + FP + FN
2.
Accuracy
Accuracy rate (ACC) refers to the proportion of correctly classified samples in the total samples. The accuracy of the prediction results is evaluated by dividing the number of correctly classified samples by the number of all samples.
A c c u r a c y = T N + T P / ( F P + T N + T P + F N )
3.
Precision
The precision rate (PRE) refers to the proportion of correct classification in the results predicted as positive samples. The PRE of the disease identified by the system is evaluated by calculating the proportion of correct positive predictions to all positive predictions.
P r e c i s i o n = T P / ( F P + T P )
4.
Recall
Recall rate (RC) refers to the proportion of correct classifications in the results of true positive samples. The evaluation system can successfully identify the efficiency of the disease by calculating the proportion of correctly predicted positives to all actual positives.
R e c a l l = T P / ( F N + T P )
5.
F1 score
The F1 score value measures the accuracy of the binary model, taking into account the accuracy rate and recall rate. It is the harmonic average of the accuracy rate and recall rate. The F1 score value is distributed between 0 and 1, and the larger the value, the better the model.
F β 1 + β 2 × P r e c i s i o n × R e c a l l β 2 × P r e c i s i o n × R e c a l l
The larger β is, the greater the weight of Recall. The smaller β is, the greater the weight of Precision. When β = 1 :
F 1 = 2 × P r e c i s i o n × R e c a l l P r e c i s i o n + R e c a l l
6.
AUC (Area under Curve)
AUC is defined as the area enclosed by the ROC curve and the coordinate axis. As a numerical value, it can directly evaluate the quality of the classifier. The larger the value, the better.

References

  1. Watson, J.; Whiting, P.F.; Brush, J.E. Interpreting a COVID-19 test result. BMJ 2020, 369, m1284. [Google Scholar] [CrossRef] [PubMed]
  2. Abumalloh, R.A.; Nilashi, M.; Ismail, M.Y.; Alhargan, A.; Alghamdi, A.; Alzahrani, A.O.; Saraireh, L.; Osman, R.; Asadi, S. Medical image processing and COVID-19: A literature review and bibliometric analysis. J. Infect. Public Health 2021, 15, 75–93. [Google Scholar] [CrossRef] [PubMed]
  3. Famiglini, L.; Campagner, A.; Carobene, A.; Cabitza, F. A robust and parsimonious machine learning method to predict ICU admission of COVID-19 patients. Med. Biol. Eng. Comput. 2022, 1–13. [Google Scholar] [CrossRef] [PubMed]
  4. Raihan, M.; Hassan, M.; Hasan, T.; Bulbul, A.A.-M.; Hasan, K.; Hossain, S.; Roy, D.S.; Awal, A. Development of a Smartphone-Based Expert System for COVID-19 Risk Prediction at Early Stage. Bioengineering 2022, 9, 281. [Google Scholar] [CrossRef] [PubMed]
  5. Heidari, A.; Navimipour, N.J.; Unal, M.; Toumaj, S. Machine learning applications for COVID-19 outbreak management. Neural Comput. Appl. 2022, 34, 15313–15348. [Google Scholar] [CrossRef] [PubMed]
  6. Nassif, A.B.; Shahin, I.; Bader, M.; Hassan, A.; Werghi, N. COVID-19 Detection Systems Using Deep-Learning Algorithms Based on Speech and Image Data. Mathematics 2022, 10, 564. [Google Scholar] [CrossRef]
  7. Zheng, F.; Chen, X.Z. Research progress of deep learning in lioblastoma. Chin. J. Magn. Reson. Imaging 2022, 13, 115–117. [Google Scholar] [CrossRef]
  8. Ye, Q.; Gao, Y.; Ding, W.; Niu, Z.; Wang, C.; Jiang, Y.; Wang, M.; Fang, E.F.; Menpes-Smith, W.; Xia, J.; et al. Robust weakly supervised learning for COVID-19 recognition using multi-center CT images. Appl. Soft Comput. 2021, 116, 108291. [Google Scholar] [CrossRef] [PubMed]
  9. Song, L.; Liu, X.; Chen, S.; Liu, S.; Liu, X.; Muhammad, K.; Bhattacharyya, S. A deep fuzzy model for diagnosis of COVID-19 from CT images. Appl. Soft Comput. 2022, 122, 108883. [Google Scholar] [CrossRef] [PubMed]
  10. Kang, B.; Guo, J.; Wang, S.; Xu, B.; Meng, X.F. Supercomputing-supported COVID-l9 CT image comprehensive analysis assistant system. J. Image Graph. 2020, 25, 2142–2150. [Google Scholar]
  11. He, K.; Zhang, X.; Ren, S.; Sun, J. Deep residual learning for image recognition. In Proceedings of the IEEE Computer Society Conference on Computer Vision and Pattern Recognition (CVPR), Las Vegas, NV, USA, 27–30 June 2016; pp. 770–778. [Google Scholar] [CrossRef] [Green Version]
  12. Zhou, T.; Lu, H.; Yang, Z.; Qiu, S.; Huo, B.; Dong, Y. The ensemble deep learning model for novel COVID-19 on CT images. Appl. Soft Comput. 2021, 98, 106885. [Google Scholar] [CrossRef]
  13. Mamalakis, M.; Swift, A.J.; Vorselaars, B.; Ray, S.; Weeks, S.; Ding, W.; Clayton, R.H.; Mackenzie, L.S.; Banerjee, A. DenResCov-19: A deep transfer learning network for robust automatic classification of COVID-19, pneumonia, and tuberculosis from X-rays. Comput. Med. Imaging Graph. 2021, 94, 102008. [Google Scholar] [CrossRef]
  14. Minaee, S.; Kafieh, R.; Sonka, M.; Yazdani, S.; Soufi, G.J. Deep-COVID: Predicting COVID-19 from chest X-ray images using deep transfer learning. Med. Image Anal. 2020, 65, 101794. [Google Scholar] [CrossRef]
  15. Zhou, T.; Ye, X.; Lu, H.; Zheng, X.; Qiu, S.; Liu, Y. Dense Convolutional Network and Its Application in Medical Image Analysis. BioMed Res. Int. 2022, 2022, 2384830. [Google Scholar] [CrossRef] [PubMed]
  16. Basu, A.; Sheikh, K.H.; Cuevas, E.; Sarkar, R. COVID-19 detection from CT scans using a two-stage framework. Expert Syst. Appl. 2022, 193, 116377. [Google Scholar] [CrossRef] [PubMed]
  17. LeCun, Y.; Boser, B.; Denker, J.; Henderson, D.; Howard, R.; Hubbard, W.; Jackel, L. Handwritten digit recognition with a back-propagation network. Adv. Neural Inf. Process. Syst. 1990, 2, 396–404. [Google Scholar]
  18. Krizhevsky, A.; Sutskever, I.; Hinton, G.E. Imagenet classification with deep convolutional neural networks. Commun. ACM 2017, 60, 84–90. [Google Scholar] [CrossRef] [Green Version]
  19. Simonyan, K.; Zisserman, A. Very Deep Convolutional Networks for Large-Scale Image Recognition. Comput. Sci. 2015, 6, 1–14. [Google Scholar] [CrossRef]
  20. Hu, J.; Shen, L.; Sun, G. Squeeze-and-Excitation Networks. In Proceedings of the 2018 IEEE/CVF Conference on Computer Vision and Pattern Recognition, Salt Lake City, UT, USA, 18–22 June 2018; pp. 7132–7141. [Google Scholar]
  21. Woo, S.; Park, J.; Lee, J.Y.; Kweon, I.S. CBAM: Convolutional block attention module. In Proceedings of the European Conference on Computer Vision, Munich, Germany, 8–14 September 2018. [Google Scholar] [CrossRef] [Green Version]
  22. Hou, Q.; Zhou, D.; Feng, J. Coordinate Attention for Efficient Mobile Network Design. In Proceedings of the IEEE/CVF Conference on Computer Vision and Pattern Recognition, Virtual Conference, 19–25 June 2021; pp. 13708–13717. [Google Scholar] [CrossRef]
  23. Zhou, T.; Chang, X.Y.; Lu, H.L.; Ye, X.Y.; Liu, Y.C.; Zheng, X.M. Pooling Operations in Deep Learning: From “Invariable” to “Variable”. BioMed Res. Int. 2022, 2022, 17. [Google Scholar] [CrossRef]
  24. Soares, E.; Angelov, P.; Biaso, S.; Froes, M.H.; Abe, D.K. SARS-CoV-2 CT-Scan Dataset: A Large Dataset of Real Patients CT Scans for SARS-CoV-2 Identification; Cold Spring Harbor Laboratory Press: New York, NY, USA, 2020. [Google Scholar] [CrossRef]
  25. Szegedy, C.; Liu, W.; Jia, Y.; Sermanet, P.; Reed, S.; Anguelov, D.; Rabinovich, A. Going Deeper with Convolutions. Computer Vision and Pattern Recognition. Available online: https://arxiv.org/abs/1409.4842 (accessed on 30 December 2015).
  26. Xie, S.; Girshick, R.; Dollár, P.; Tu, Z.; He, K. Aggregated Residual Transformations for Deep Neural Networks. In Proceedings of the IEEE Conference on Computer Vision and Pattern Recognition (CVPR), Honolulu, HI, USA, 21–26 July 2017; pp. 5987–5995. [Google Scholar] [CrossRef] [Green Version]
  27. Chollet, F. Xception: Deep learning with depthwise separable convolutions. In Proceedings of the 2017 IEEE Conference on Computer Vision and Pattern Recognition (CVPR), Honolulu, HI, USA, 21–26 July 2017. [Google Scholar]
  28. Szegedy, C.; Vanhoucke, V.; Ioffe, S.; Shlens, J.; Wojna, Z. Rethinking the Inception Architecture for Computer Vision. In Proceedings of the IEEE Conference on Computer Vision and Pattern Recognition (CVPR), Las Vegas, NV, USA, 27–30 June 2016; pp. 2818–2826. [Google Scholar] [CrossRef] [Green Version]
  29. Szegedy, C.; Ioffe, S.; Vanhoucke, V.; Alemi, A. Inception-v4, Inception-ResNet and the Impact of Residual Connections on Learning. In Proceedings of the AAAI Conference on Artificial Intelligence, San Francisco, CA, USA, 4–9 February 2017; Available online: https://arxiv.org/abs/1602.07261 (accessed on 30 December 2015).
  30. Tan, M.; Le, Q. EfficientNet: Rethinking Model Scaling for Convolutional Neural Networks. In Proceedings of the International Conference on Machine Learning, Long Beach, CA, USA, 10–15 June 2019; pp. 6105–6114. [Google Scholar]
Figure 1. Residual neural network structure diagram.
Electronics 12 01413 g001
Figure 2. Residual block structure.
Electronics 12 01413 g002
Figure 3. COVID-ResNet network architecture.
Electronics 12 01413 g003
Figure 4. CT images of the lungs of patients with COVID-19.
Electronics 12 01413 g004
Figure 5. Structural diagram of Squeeze-and-Excitation module.
Electronics 12 01413 g005
Figure 6. SE-Res block.
Electronics 12 01413 g006
Figure 7. Coordinate attention block.
Electronics 12 01413 g007
Figure 8. MFCA module structure in COVID-ResNet.
Electronics 12 01413 g008
Figure 9. Test loss.
Electronics 12 01413 g009
Figure 10. Example of COVID-19 dataset: (a) SARS-CoV-2; (b) COVID-19 CT.
Electronics 12 01413 g010
Figure 11. Radar chart.
Electronics 12 01413 g011
Figure 12. Confusion matrix of other models.
Electronics 12 01413 g012aElectronics 12 01413 g012b
Figure 13. Confusion matrix of COVID-ResNet.
Electronics 12 01413 g013
Figure 14. The 3 variants of the Res block.
Electronics 12 01413 g014aElectronics 12 01413 g014b
Table 1. Structure of COVID-ResNet framework.
ResNet Structural [11]COVID-ResNet StructuralCOVID-ResNet18Input SizeOutput Size
Convolutional layerConvolutional layer 7 × 7   C o n v × 1 224 × 224 × 3 112 × 112 × 64
Maxpooling layerMaxpooling layer 3 × 3   M a x P o o l × 1 112 × 112 × 64 56 × 56 × 64
MFCA block n × 1   a v g p o o l   1 × n   a v g p o o l 1 × 1   c o n v 1 × 1   c o n v   1 × 1   c o n v G l o b a l   A v e r a g e   P o o l i n g × 1 56 × 56 × 64 1 × 1 × 64
Res blockSE-Res block 3 × 3   c o n v S E   l a y e r 3 × 3   c o n v S E   l a y e r × 2 56 × 56 × 64 112 × 112 × 64
MFCA block n × 1   a v g p o o l   1 × n   a v g p o o l 1 × 1   c o n v 1 × 1   c o n v   1 × 1   c o n v G l o b a l   A v e r a g e   P o o l i n g × 1 56 × 56 × 64 1 × 1 × 64
Res blockSE-Res block 3 × 3   c o n v S E   l a y e r 3 × 3   c o n v S E   l a y e r × 2 112 × 112 × 64 14 × 14 × 256
MFCA block n × 1   a v g p o o l   1 × n   a v g p o o l 1 × 1   c o n v 1 × 1   c o n v   1 × 1   c o n v G l o b a l   A v e r a g e   P o o l i n g × 1 112 × 112 × 64 1 × 1 × 128
Res blockSE-Res block 3 × 3   c o n v S E   l a y e r 3 × 3   c o n v S E   l a y e r × 2 14 × 14 × 256 7 × 7 × 512
MFCA block n × 1   a v g p o o l   1 × n   a v g p o o l 1 × 1   c o n v 1 × 1   c o n v   1 × 1   c o n v G l o b a l   A v e r a g e   P o o l i n g × 1 14 × 14 × 256 1 × 1 × 256
Res blockSE-Res block 3 × 3   c o n v S E   l a y e r 3 × 3   c o n v S E   l a y e r × 2 7 × 7 × 512 7 × 7 × 512
MFCA block n × 1   a v g p o o l   1 × n   a v g p o o l 1 × 1   c o n v 1 × 1   c o n v   1 × 1   c o n v G l o b a l   A v e r a g e   P o o l i n g × 1 7 × 7 × 512 1 × 1 × 512
Classification layerClassification layerFull connection 1 × 1 × 1024 1 × 1 × 2
Table 2. Dataset distribution of CT images.
DatasetTrainValidationTest
COVID-19No-COVID-19COVID-19No-COVID-19COVID-19No-COVID-19
SARS-CoV-2752737250246250246
COVID-19 CT20923970797079
Table 3. Comparison results of different networks.
Model Parameter Quantity (MB)ACCPRERCF1AUC
ResNet18 [11]85.280.93790.92280.95690.93960.9788
DenseNet [15]53.070.95190.95370.95080.95600.9868
Googlenet [25]48.080.94730.93180.96620.94820.9871
ResNext50 [26]175.350.94570.93940.95380.94660.9863
SE-ResNet18 [20]85.960.95190.93240.97540.95340.9803
Xception [27]158.780.94260.94720.93850.94280.9799
Inceptionv3 [28]168.740.93020.94030.92000.93000.9562
Inceptionv4 [29]313.920.95810.96560.95080.95810.9811
EiffcienNetb0 [30]30.590.93950.93590.94460.94030.9802
COVID-ResNet86.940.96890.95790.98150.96960.9904
Table 4. Comparison results of ablation experiments.
Parameter Quantity (MB)ACCPRERCF1AUC
Experiment 185.280.93790.94290.96620.94440.9825
Experiment 285.580.95350.94290.96620.95440.9867
Experiment 385.960.95190.93240.97540.95340.9803
Experiment 486.260.95500.94050.97230.95610.9857
Experiment 586.640.95350.94560.96310.95430.9875
Experiment 686.940.96280.95740.96920.96330.9935
Experiment 786.640.95970.95720.96310.96010.9910
Experiment 886.940.96890.95790.98150.96960.9904
Disclaimer/Publisher’s Note: The statements, opinions and data contained in all publications are solely those of the individual author(s) and contributor(s) and not of MDPI and/or the editor(s). MDPI and/or the editor(s) disclaim responsibility for any injury to people or property resulting from any ideas, methods, instructions or products referred to in the content.

