1. Introduction
The role of stock price forecasting methods was recognized as early as the establishment of the stock market. Investors all over the world have attempted to devise a common method to accurately predict the trend of stock prices, but the results are still controversial. Because the maturity of stock markets in different countries is different, the general method is effective for high-level stock markets, but not for low-level stock markets.
According to the Efficient Market Hypothesis (EMH) mentioned in [
1], there are three forms of market efficiency: strong form efficiency, weak form efficiency, and semi-strong form efficiency. Weak form efficiency is when a current stock price reflects all past information, including historical stock price data and public information. Because this information has been made public, traders cannot use an analysis of past stock prices to accurately predict future stock prices. While this feature renders the technical analysis of stock prices useless, industry analysis and trend analysis can help investors to obtain excess profits. Strong form efficiency entails that all information about a company’s operating prospects is fully reflected in the stock prices. Such information comprises inside information and private information. Thus, even if they have obtained top-secret information, investors will not be able to generate massive profits in a strong form efficient market. Finally, semi-strong form efficiency means that a current stock price reflects all public information, including past information. However, in this case, behind-the-scenes information and private information are not disclosed. Investors may therefore be able to use this masked information to obtain extraordinary profits.
The United States is considered a semi-strong market according to [
2]. As this author believes that information, such as a presidential election, affects the U.S. stock market, the assumption that the comments of stock market experts are related to trends in the U.S. stock market is also reasonable.
In a mature market such as the American stock market, a stock price is determined by the demand and supply within it [
3]. After a company goes public and its shares start to be traded in a stock exchange, its share price is determined by the supply and demand for its shares in its market. Stock price changes in a stock market mainly come from the sentiment fluctuations of investors [
4].
Because our focus is on a semi-strong form efficient market in this paper, behind-the-scenes information and private information must exist. Many factors determine the trend of the stock market, especially the historical stock price data, including the opening price, highest price, lowest price, trading volume, yield, and other characteristics. However, in the semi-strong form efficient market, investors can no longer obtain higher returns than the average market returns by relying on public information. This causes the authors to pay more attention to the non-public information rather than the public information in the stock market.
Behind-the-scenes information is the information known by the management of a listed company that has not yet been published, such as personnel changes. Private information refers to information known only to “insiders”. These people have more internal knowledge, allowing them to display their advantages to outsiders. Private and behind-the-scenes information could thus be used by a trader to create abnormally large (and illegal) profiles. These profiles are special datasets used in this model and are not generated from historical stock price data. Due to the professionalism of expert opinions and the concealment of private information, the special data source used in this model is more suitable than the historical stock price data in the U.S. stock market.
However, the authors do not support the view that all market participants can immediately accept and understand all public and useful information. Only experienced professional analysts or investors can respond quickly to new information. Moreover, if investors cannot properly understand such information, other, more skilled investors will exploit this opportunity to conclude transactions, making any abnormal returns in the market disappear rapidly. When non-public information is available, stock buyers and sellers will adjust their expectations accordingly to complete transactions at the new equilibrium price level. This clearly shows the superiority of a semi-strong effective market only when many investors use non-public information to obtain abnormal returns.
Due to the complexity of stock trends, it is unreliable to rely solely on investors’ personal experience to judge them, and there are massive risks. Today, some financial and stock experts express their views on different stocks in a special stock market forum to generate profits for or attract the attention of investors. There must be some connection between expert stock comments and stock prices, and the feasibility of this type of opinion stems from several factors.
First, because experts focus on the stock market for a long time, they are highly professional and knowledgeable. Therefore, they can provide more accurate insights into the trends of a stock market than non-experts.
Second, for ordinary shareholders, many experts represent the authority and barometer of a stock market; thus, their words have a guiding effect on and play an incentivizing role in ordinary shareholder investment.
Third, experts consider not only financial factors in a stock market but also other uncertain factors, such as stock market policies and crude oil prices.
Vast quantities of information, forums, social media posts, articles, and comments published on the internet provide references for investors to analyze their investments. For instance, [
5] argues that expert stock comments contain abundant essential information for investment decisions. In the top financial forum, stock comments by experts largely demonstrate both professionalism and timeliness. Because there are so many miscellaneous articles on the forum, selecting the optimal short-term comments to reference has become a complex task. Therefore, to conserve as much effort as possible and help non-professional investors to profit from a stock market, we introduce an intelligent stock speculation model to assist investors in correctly judging a stock price.
In modern society, advanced technology has been integrated into all walks of life, allowing people to experience the benefits of science and technology assistance. According to [
6], based on other literature, ML usually produces better results than statistical and other economic models and can capture the nonlinear nature of a stock market better than other methods. This provides empirical support for research using ML.
In the financial investment industry, numerous resources are devoted to analyzing and quantifying information. With the ongoing shortening of the information cycle and the increasingly onerous reporting requirements for listed companies, the negative impact of this problem continues to intensify. It is necessary to replace people with computers to complete these tasks. At present, a large amount of content and abstracts needs to be classified and extracted, and the computer will replace human beings to understand the context. Such data processing tasks are exactly the area in which natural language understanding technology (NLP) excels.
The current trend of deep learning architectures [
7,
8] indicates that the Convolutional Neural Network (CNN) is one of the most prominent and widely used techniques that has been successfully implemented in NLP, computer vision, and pattern recognition. The CNN is the most popular model among deep learning techniques in the field of NLP because of its simplicity and parallelism, even if the dataset is huge [
9]. Hence, the model proposed in this paper is a prediction model based on a CNN and NLP.
Accordingly, our approach is based on general text analysis to address all pending articles. This essay discusses the necessity and construction process of establishing a stock price prediction model using non-public information and shows why this CNN-SC model is better than other advanced IT models in predicting stock prices.
The rest of this paper is organized as follows. In
Section 2, we introduce the relevant literature and its disadvantages. We then present some of the methodologies of our proposed model in
Section 3. Next, we experiment with our model and explain our results in
Section 4 and
Section 5. Finally, the conclusions of the paper and their implications for future work are presented in
Section 6.
2. Literature Review
In the field of stock market prediction, many prediction methods are based on historical stock data. Ref. [
10] suggests that a change in stock price is closely related to historical trading data. However, historical data are not the only factor that affects the stock price trend. At present, the authors have found many articles that use only historical data and non-historical data to predict stock prices.
Works using historical data as materials mainly use various machine learning methods. If only historical data are used for stock price prediction, the lack of materials leads to huge shortcomings in the prediction results. When a market faces a major turning point, its investors will accept large prediction errors if they use an inappropriate model. In [
11], the proposed hybrid prediction network combines clustering and integration to create a C-E-SVR&RF algorithm. A comparison of similar methods that are designed for the same purpose is included in this text. Ref. [
12] proposes using an improved CNN to predict stock price fluctuations and compares this method with a variety of popular machine learning methods.
To avoid the problem of using historical data alone, researchers have found the method of introducing other features. Many works of literature use non-historical data to predict stock prices. Some studies have linked the comments of experts with the securities market [
13] to develop a simple stock-flow consistent (SFC) model by using comments and conclude that using SFC models is particularly suitable when dealing with issues that integrate real and financial variables. Ref. [
14] has considered the impact of the release of analysts’ comments on the Russian stock market, finding that other factors, such as the size of a company and the overall economic situation, also have an effect. Surprisingly, the impact of a crisis is not the main factor affecting the changes in a stock market. However, this discussion on the influence of analysts’ comments is limited to the Russian stock market, where the validity of analysts’ comments does not exceed 3 days.
Financial sentiment analysis is an emerging approach in stock prediction research. Many studies have recorded the high correlation between words and users’ sentiment connections in short texts. Twitter is a typical source of short texts that are composed of their authors’ sentiments. The author of [
15] studied the relationship between a well-known Twitter micro-blogging platform and the Tunisian financial market. Ref. [
16] showed that sentiment analysis of tweets has potential as a real-time barometer of public sentiment toward negotiating outcomes to inform government decision-making. Ref. [
17] collected relative Twitter tweets and calculated their sentiment scores. Their experiment implied that sentiment had a significant impact or was significantly impacted by stock market prices. In addition, ref. [
18] introduced the relationship between mobile trading and investor sentiment and demonstrated that mobile trading transforms irrational investors into informed, rational investors.
The model proposed in this paper combines comments’ analysis and financial sensitivity analysis. As experts’ suggestions align with a current trend and situation, they are more often real-time than historical. Since the method proposed in this paper depends on an expert’s knowledge of a stock comment, it produces less impact than a method that relies only on historical data. Hence, when a stock market fluctuates greatly, it will not produce as many errors as other forecasting methods.
3. Materials and Methods
3.1. Interpretation of Data Sources
StockTwits is an international social media platform for stock market investment, and many investors have used it. The message format of this platform limits the length of any message; thus, every user’s message is a short text. Investors can share their thoughts on single or multiple stocks on this platform. These ideas are temporary, short-term, and may not be mature, but they can express an individual’s thoughts on individual stocks in a timely and intuitive manner. Specifically, users first write the name of the stock that they are interested in and then attach their comments on the rise or fall of the stock’s price. Before submitting a message, users must indicate whether a stock is in a bull or bear market.
SeekingAlpha is the largest investment community globally, where millions of enthusiastic investors share investment ideas, discuss major information, and make wise investment decisions everyday. The expert forum column in the community is very forward-looking, timely, and authoritative. The datasets used in this paper are all composed of available empirical data from this platform and StockTwits.
Since StockTwits mainly contains tweets with short sentences, we consider StockTwits a short-text website. As SeekingAlpha mainly contains long articles on stock comments, we define SeekingAlpha as a long-text website. When dealing with tweets, we use supervised learning. This method uses a large number of labeled samples to carefully train a model so as to improve the model’s performance. In terms of classification accuracy, this type of supervised learning is more efficient than unsupervised learning, which only uses information. Specifically, we seek to obtain the sentiment value of each word in the economic field by mining StockTwits’ short-text comments and then using them as basic elements to analyze the ready-made sentences on the long-text website SeekingAlpha to derive sentences’ sentiment value. Our system will then calculate the sentiment value of each article published by an expert. Finally, according to the sentiment value of each article, the system predicts a stock price after seven days to help investors to make decisions. Regarding our choice of long texts, we focus on the following: (1) comments on short-term rather than long-term stock trends (long-term stock trends are generally different from short-term trends)—thus, the sentiment of stock comments is not related to long-term stock trends; (2) texts containing key sentences in a summary rather than texts that lack a summary—stock reviews with key sentences more clearly reflect an author’s attitude.
3.2. Architecture and Procedures
A diagram of the whole system model is shown in
Figure 1,
Figure 2 and
Figure 3. The key steps in this model are as follows.
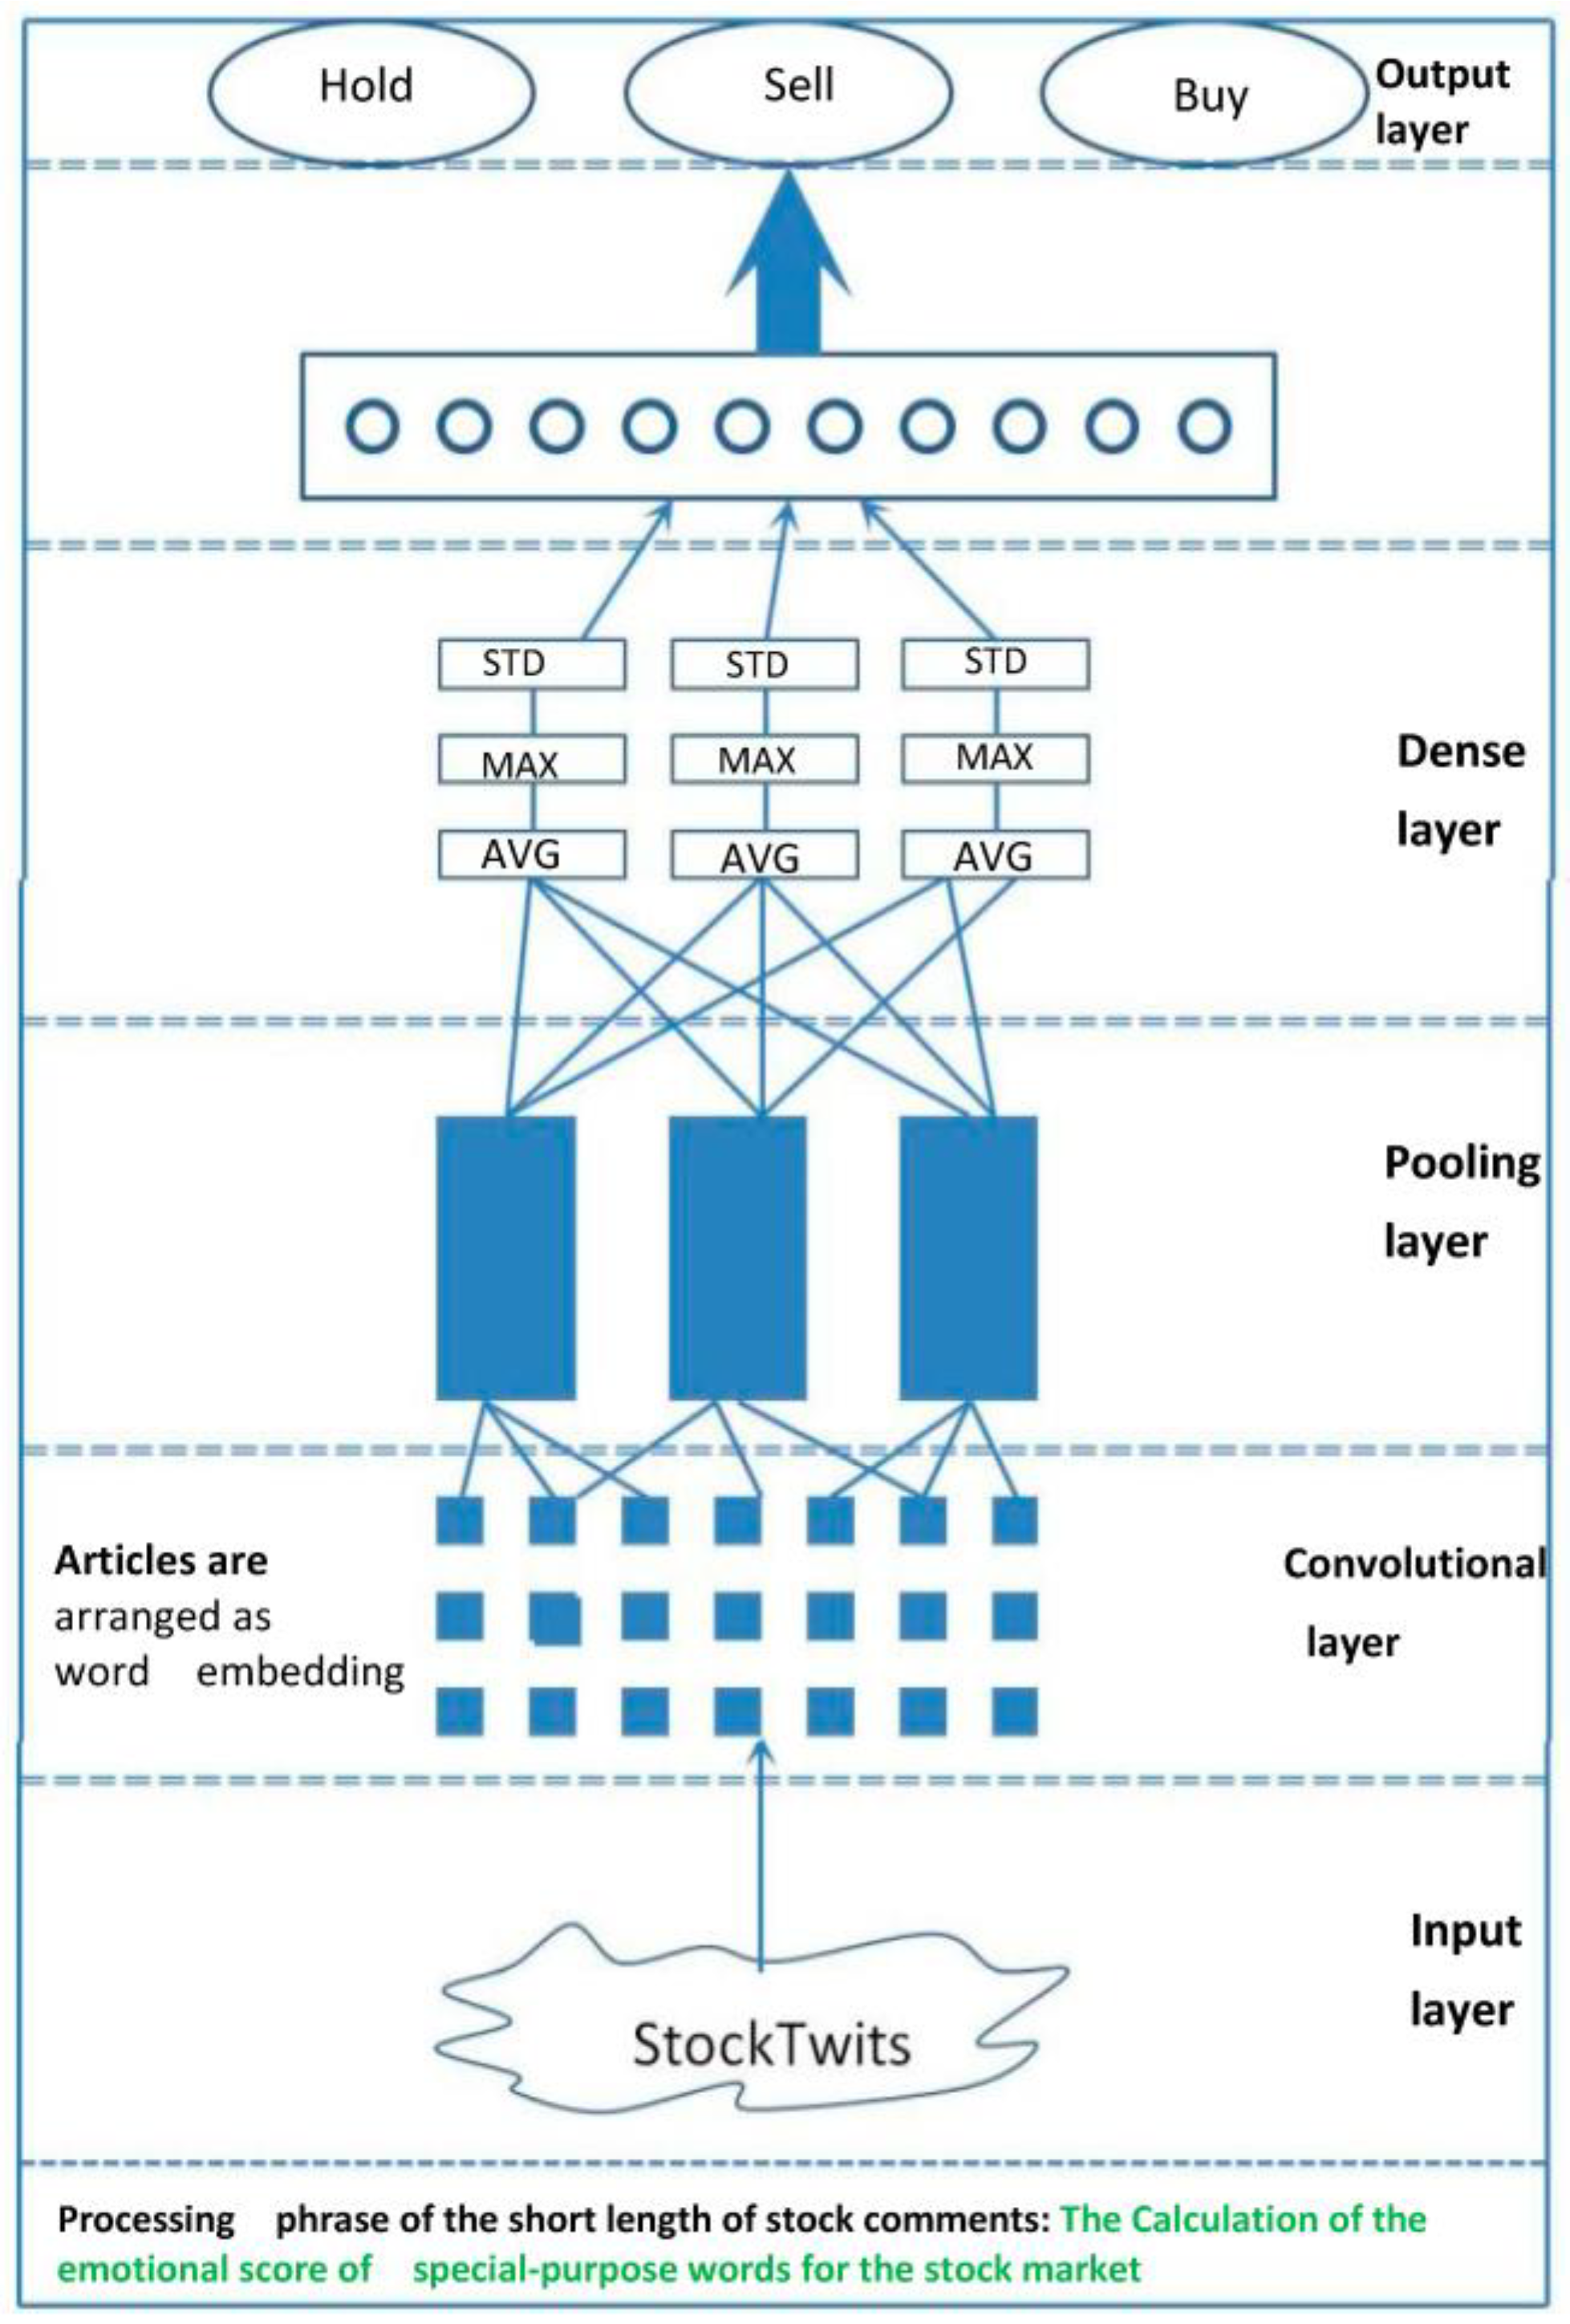
(1) In the financial word processing stage, the model uses the query interface provided by StockTwits to identify posts with a trend direction and then uses a CNN to train the financial word matrix and obtain the stock sentiment values that correspond to all words, as shown in
Figure 1. Then, the IF-IDF and score values of these words are calculated in bull/bear markets.
(2) By integrating the results of the previous step, the models form a unique stock-market-specific list of word sentiments.
Table 1 shows the field properties and property meanings of the list of word sentiments. The characteristics of almost all the stock-market-specific words collected in this list are also weights that are used to measure the sentiments of stock comments with words.
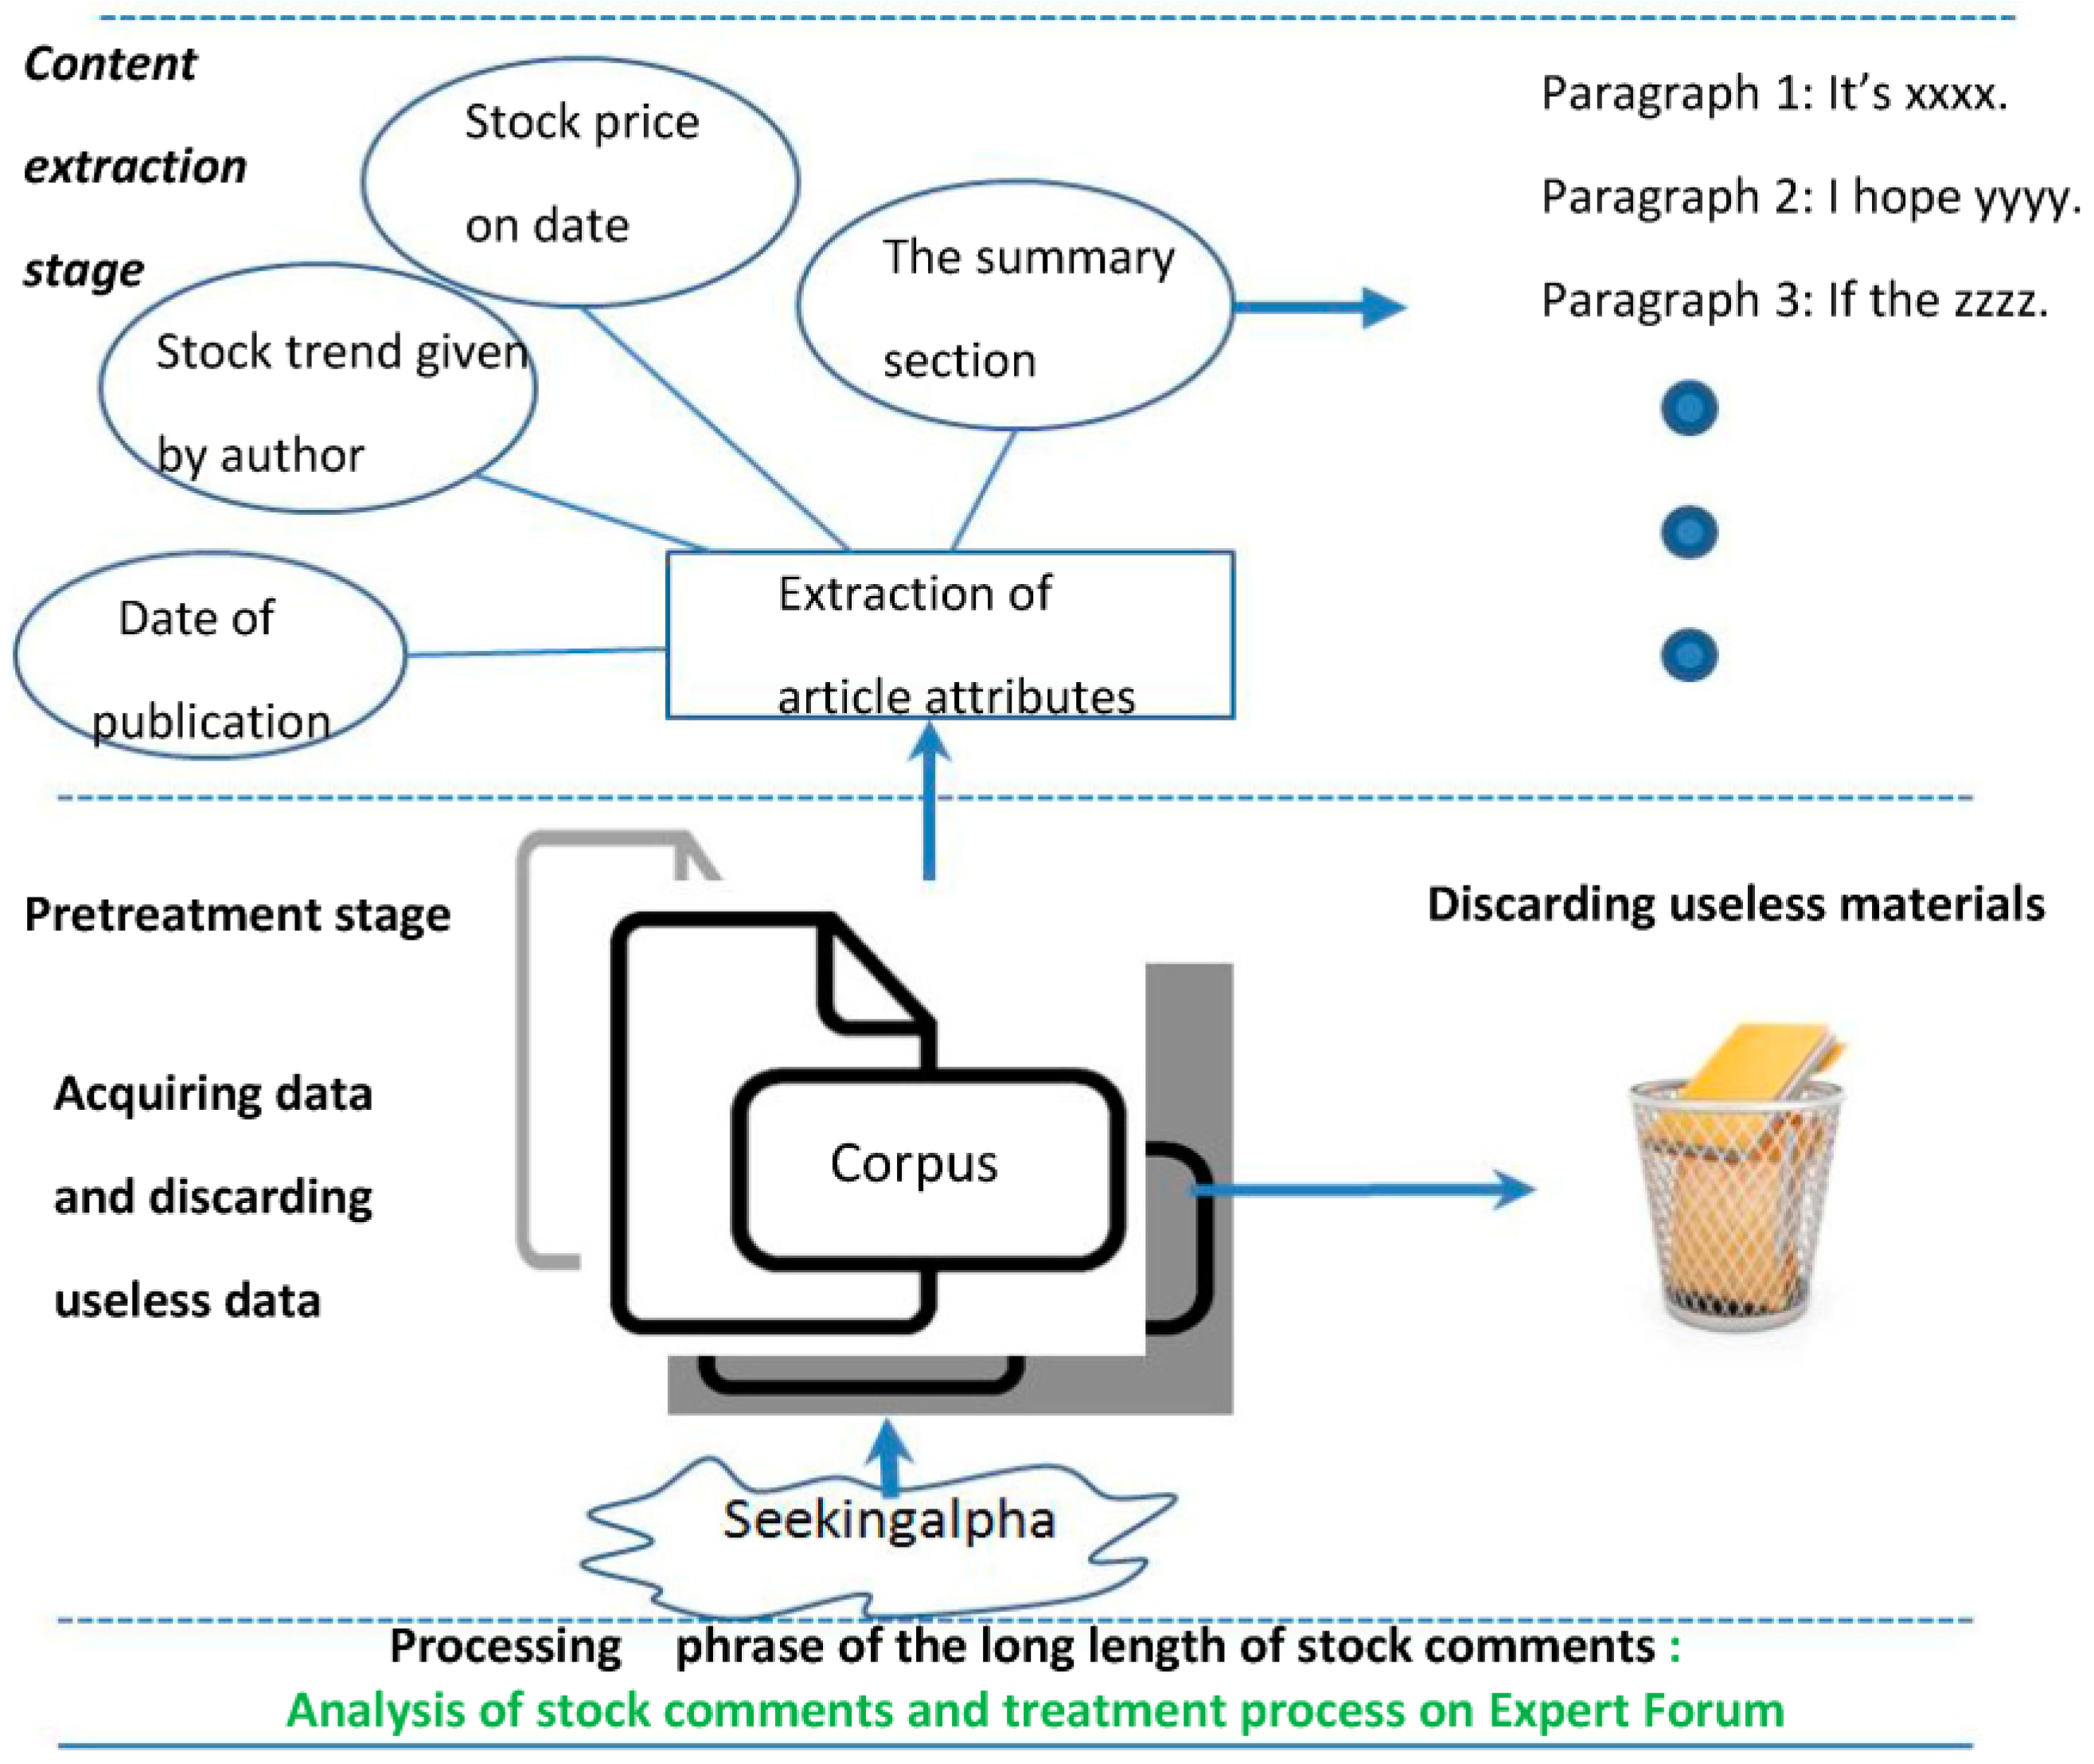
(3) In the stage of stock comment processing, as shown in
Figure 2, the model uses crawler tools to obtain stock comments that contain a stock trend direction from the SeekingAlpha website and removes useless posts. Then, useful attributes are extracted from each post (including long/short ideas, the author’s view on a stock, the name of the company, the date of the issue, a summary, and the stock price of the issue). Next, the system filters the keywords of the sentence(s) in the summary and calculates the sentiment value of each sentence via the obtained sentiment list. Thus, we can judge the sentiment value of an article.
(4) After obtaining the sentiment value of an article, the model calculates the price fluctuation of a single stock and then combines it with the initial stock price to calculate the stock price after seven days, as shown in
Figure 3. Users can thus obtain stock price feedback before a computer, which can be used as the basis of their stock investment.
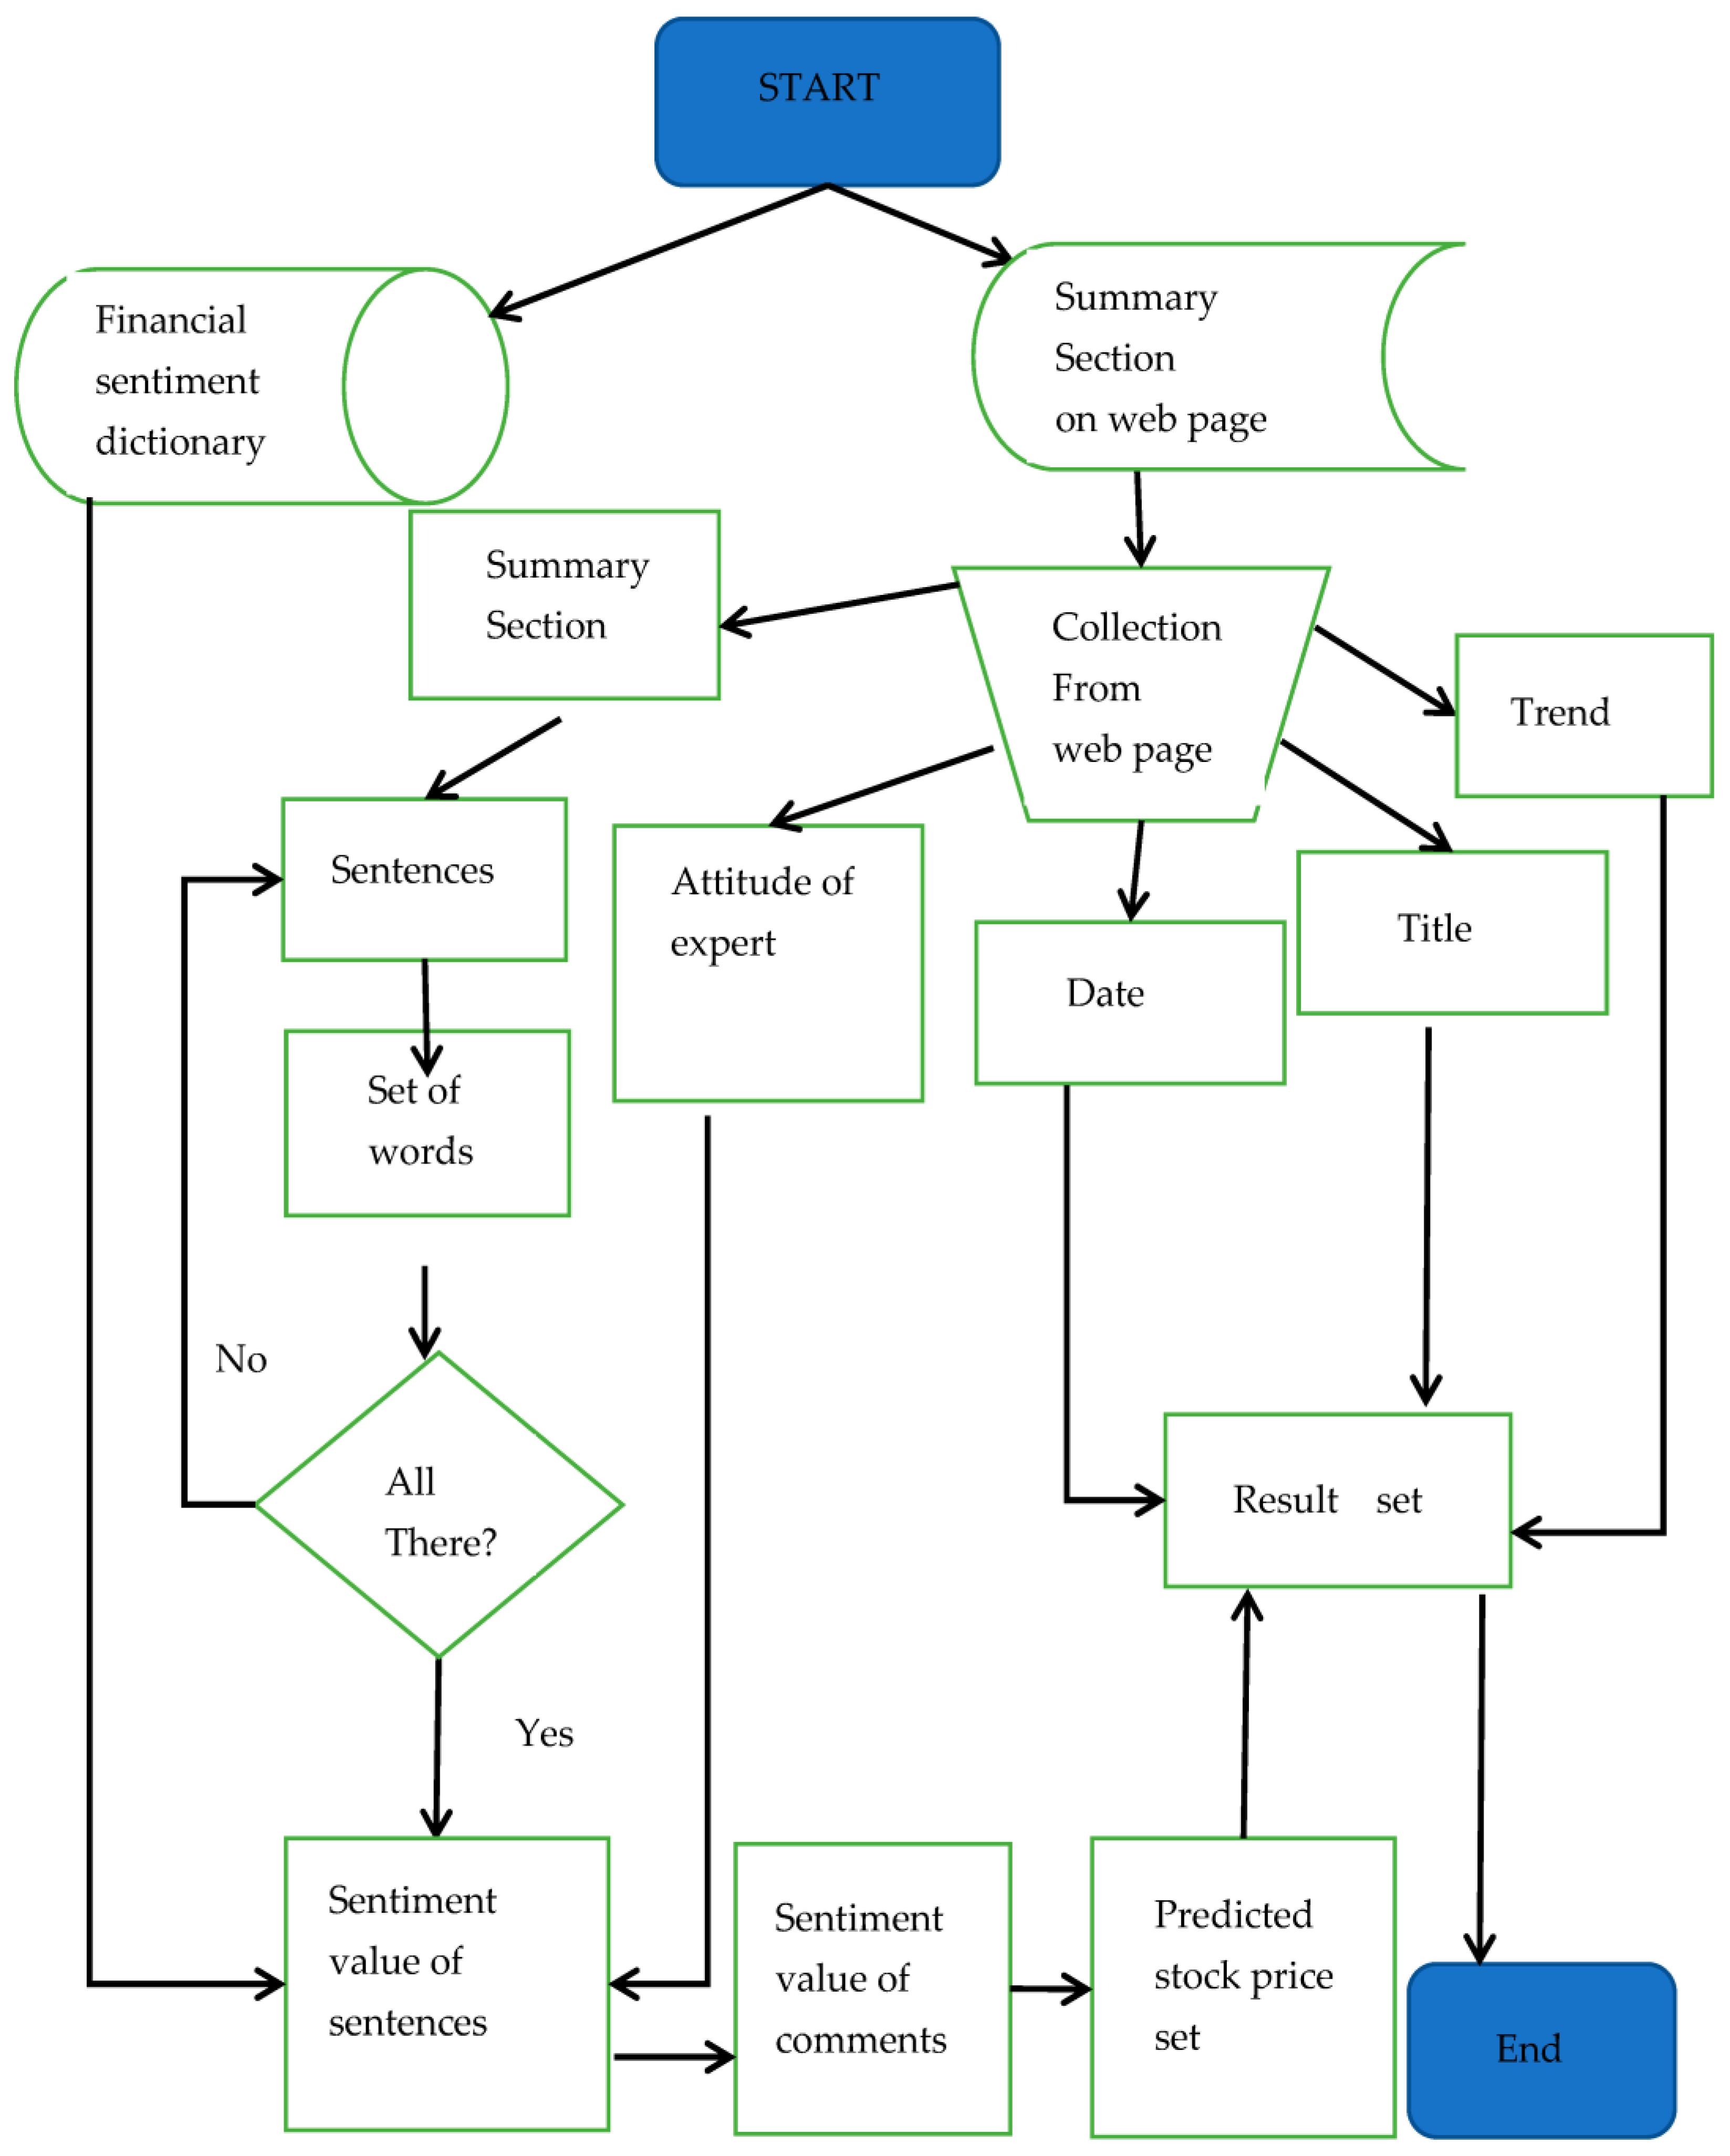
(5) The model uses a confusion matrix and evaluation equations to evaluate its effects. Five new forecasting models for stock prices are thus compared with the model in this paper. Algorithm 1 and the flowchart in
Figure 4 of this model for calculating the sentimental value are shown as follows.
| Algorithm 1 Predicting the stock price after seven days by calculating the sentimental value of stock comments |
| Input: Financial sentiment dictionary U, Stock comments Y |
Output: Date D = {d1,d2,d3,… dn}, Title T = {t1,t2,t3,… tn},
Predicted sentiment value P = {f1,f2,f3,… fn},
Predicted stock price N = {g1,g2,g3,… gn},
Attitude A = {a1,a2,a3,… an}, Stock trend DF = {δ1,δ2,δ3,… δn} |
1. for (i = 1; i < len(Y); i++)
2. Gain di //Gain issue date of each stock comment
3. Gain ti //Gain the title of each comment
4. Gain δi //Gain each stock price difference
5. Gain ai //Gain the author’s attitude toward each comment
6. Compute βi //Gain the number of sentences in each summary section
7. for (j = 1; j < βi; j++)
8. Gain Cij //Gain the collection of sentences in each summary section
9. Gain Setc //Gain the word set contained in each sentence from Cij
10. for (k = 1; k < len(Setc); k++)
11. for (n = 1; n < len(U); n++):
12. If (Setc(k) == U(n))
13. Gain valuec //Compute sentiment value of each sentence according to Equation (11)
14. End If
15. Compute fi //Gain the sentiment value of an article according to Equation (12)
16. Compute gi //Gain the predicted stock value after seven days according to Equation (14)
17. End for
18. End for
19. End for
20. End for
Return D, T, P, A, DF, N |
3.3. Frequency Pointwise Mutual Information
Because webpages are composed of language and other elements, they can be analyzed by NLP. In NLP, pointwise mutual information (PMI) [
19] is used to measure the correlation between two factors. We also consider that the probability of words appearing in the dataset affects the relationships between words and their sentiments; hence, we use the value of frequency pointwise mutual information (FPMI) to express the relationship between words and post sentiments. The equation of FPMI is as follows:
where X is a word in a bear or bull dataset.
is the probability of word X when X appears and
is the probability of sentiment Y.
is the probability of sentiment Y when word Y appears. N
w is the frequency of the token X and
is the total number of tokens in the dataset. Then, we can calculate the FPMI value of word X in a bearish market or a bullish market. Is it a bear market or a bull market when the same word appears? We can obtain the answer via Equation (2), which can reflect the market sentiment score of the word.
When is positive, users use the word in a bull market; when the is negative, users use the word in a bear market.
3.4. TF-IDF Value
Term Frequency–Inverse Document Frequency (TF-IDF) [
20] is a statistical algorithm that is used to express the importance of words. As the number of times that a word appears in the file increases, the importance of this word increases. In contrast, with a decrease in its frequency, the importance of the word decreases.
We must therefore divide TF-IDF into two parts. The first part is Term Frequency (TF), and the equation is (3), where
is the number of financial keywords t in file
, and the denominator is, in each file
, the summation of the occurrences of word t.
The second part is the Inverse Document Frequency (IDF). The principle of IDF is, in brief, the fewer documents that contain the word, the stronger the document category characteristics of the word. The equation is as shown below (4):
where |D| is the total number of files in the corpus, and the denominator is the total number of files D containing financial keywords t.
We can use TF-IDF to calculate the weight of a word by comprehensively considering the TF and IDF of the word. The equation of TF-IDF is shown in (5).
Thus, TF-IDF is the value of the importance of the financial keyword t in a sentence. The high frequency of words in a specific file and the low frequency of words in the whole file set can produce the value of high-weight word importance. The TF-IDF algorithm also tends to filter out common words and retain keywords.
Here, it is important to mention why we do not use an improved TF-IDF algorithm such as BM25. The original document contains some meaningless and a large number of stopping words, such as ‘THE’ and ‘AND’. If not handled, the weight of these stopping words will be artificially amplified. In addition, the long text will adversely affect the calculation results of TF-IDF. BM25 overcomes these two problems, so it is also a commonly used AI algorithm. However, there is no increase in abnormal results because the stopping words are deleted when the author uses TF-IDF. In addition, TF-IDF is used to process short-length stock comments, so the BM25 algorithm is not specifically used by the authors.
TF-IDF, which is suitable for processing short documents, has the advantages of simplicity and directness. On the other hand, the disadvantage of the TF-IDF algorithm is that an increase in the total number of documents will cause low-frequency words to be given greater weight, which magnifies the importance of obscure words. To overcome this problem, the authors restrict the import of words with overly large IDF values when importing Twitter sentences. This method prevents obscure words from being considered keywords.
3.5. The Emotional Value of a Sentence
Since the words contained in the financial word set constitute sentences, the emotional value of a sentence can be obtained by combining (2) and (5), which is expressed as Equation (6).
where t is a financial keyword and
is the sentiment value of a sentence that includes n financial words.
3.6. Basis of Using Behind-the-Scenes Data in Informatics
3.6.1. Information Entropy and Related Equations
The financial market that is established through messaging is mainly affected by two data sources: public data and behind-the-scenes data. These two types of data promote the fluctuation of stock prices; thus, they can be regarded as two channels of information flow. We consider the following information flows: (1) public information→market returns (FP→R) and (2) behind-the-scenes information→market returns (FB→R). Public information and behind-the-scenes information are sources of information that are transmitted in FP→R and FB→R, respectively, ultimately driving a relevant stock price to change. Since the long-term stock market evaluation that we wish to obtain is based on an analysis of public information and behind-the-scenes information, the following section describes our definition and measurement of information entropy [
21].
3.6.2. Measurement of Entropy
We suppose that
is a time series that contains data points arranged according to time.
represents activities that occur within a time interval and is a set of discrete values at different time points. We then define the result sequence obtained through the observation of the period.
,
...,
,
is the (t + 1) st observation based on the previous k − 1 observation. The following formula can be used to obtain the status of
:
where H
is the Shannon entropy, defined as (8). Increasing k will result in decreasing h
(k) as long as
contains more information than
to forecast
.
3.6.3. The Premise of Judging by Information Entropy
When the variable
is independent of Y, and when observing the result of t + 1, we wish to consider whether y will have an impact on
. Therefore, we have Equation (9), and the following equation is (10).
Equation (10) shows that when two factors act on the observed value, the influence of Y independently is equal to the influence of X, and the influence of Y and X is removed. This shows that the formula is reasonable if we apply public and private data. According to [
21], Granger causality and transfer entropy are equivalent if all variables involved are distributed as multivariate normal distributions. Therefore, using information entropy to measure the impact of variables on stock prices is a rational and logical judgment method.
3.7. Calculation of the Emotional Value of Articles
We use Equation (6) to obtain Equation (11) and derive the sentiments of the key sentences. Namely, Equation (11) shows the sentiment results that correspond to different sentence sentiment values.
where µ is the mean of the data and d is the threshold for partitioning.
When the sentiment values of key sentences in the stock comment have been obtained, the model will obtain the number of sentences with the dominant sentiment through the sentence sentiment election method and then calculate the sentiment of the whole article through Equation (12). This equation is called the election law.
where θ is the maximum number of sentences with a trend in an article.
is the sentiment value of an article when the article is published, and N is the number of sentences in the summary.
represents the author’s opinion on a stock, expressed in Equation (13).
where
is the author’s opinion of a stock. When the maximum sentiment value of a sentence is a neutral sentiment, the sentiment value of a sentence cannot represent the stock market trend. At this point, the factor that determines the sentiment of a sentence becomes the author’s opinion of a stock, which is expressed as
.
This is a supplementary judgment method, and our reasons for using this method are as follows. When calculating the sentiments of articles on the SeekingAlpha website, there may be a large difference between the sentiments calculated by the method recommended in this paper and the sentiment tags marked by authors. This is because the application of this method will reveal an author’s subconscious ideas when judging a customer’s ideas; one author alone cannot grasp all sentence sentiments. However, when a sentence is identified as a neutral sentiment by the first method, the label marked by the author can be used as a supplementary method to determine the sentiment of the relevant article.
To infer the relationship between sentiment value and stock fluctuation, we can determine the formula form with sentimental value as the independent variable and stock fluctuation value as the dependent variable, as shown in (14):
where M is the sentiment value of a certain article, Y is the predicted difference between the market price on the first day and the market price on the eighth day of a stock, and P
1~P
4 are correlation coefficients. The model thus calculates the emotional value of a single article through Equation (12) and then calculates the predicted difference through Equation (14). The sum of the predicted difference and the stock price on the first day is used to obtain the stock price on the eighth day. This value is the one-day predicted stock price that is generated by the CNN-SC model. The curve distribution formed by multiple values is the stock price distribution curve that is generated by using the model.
3.8. Stock Comment Collection
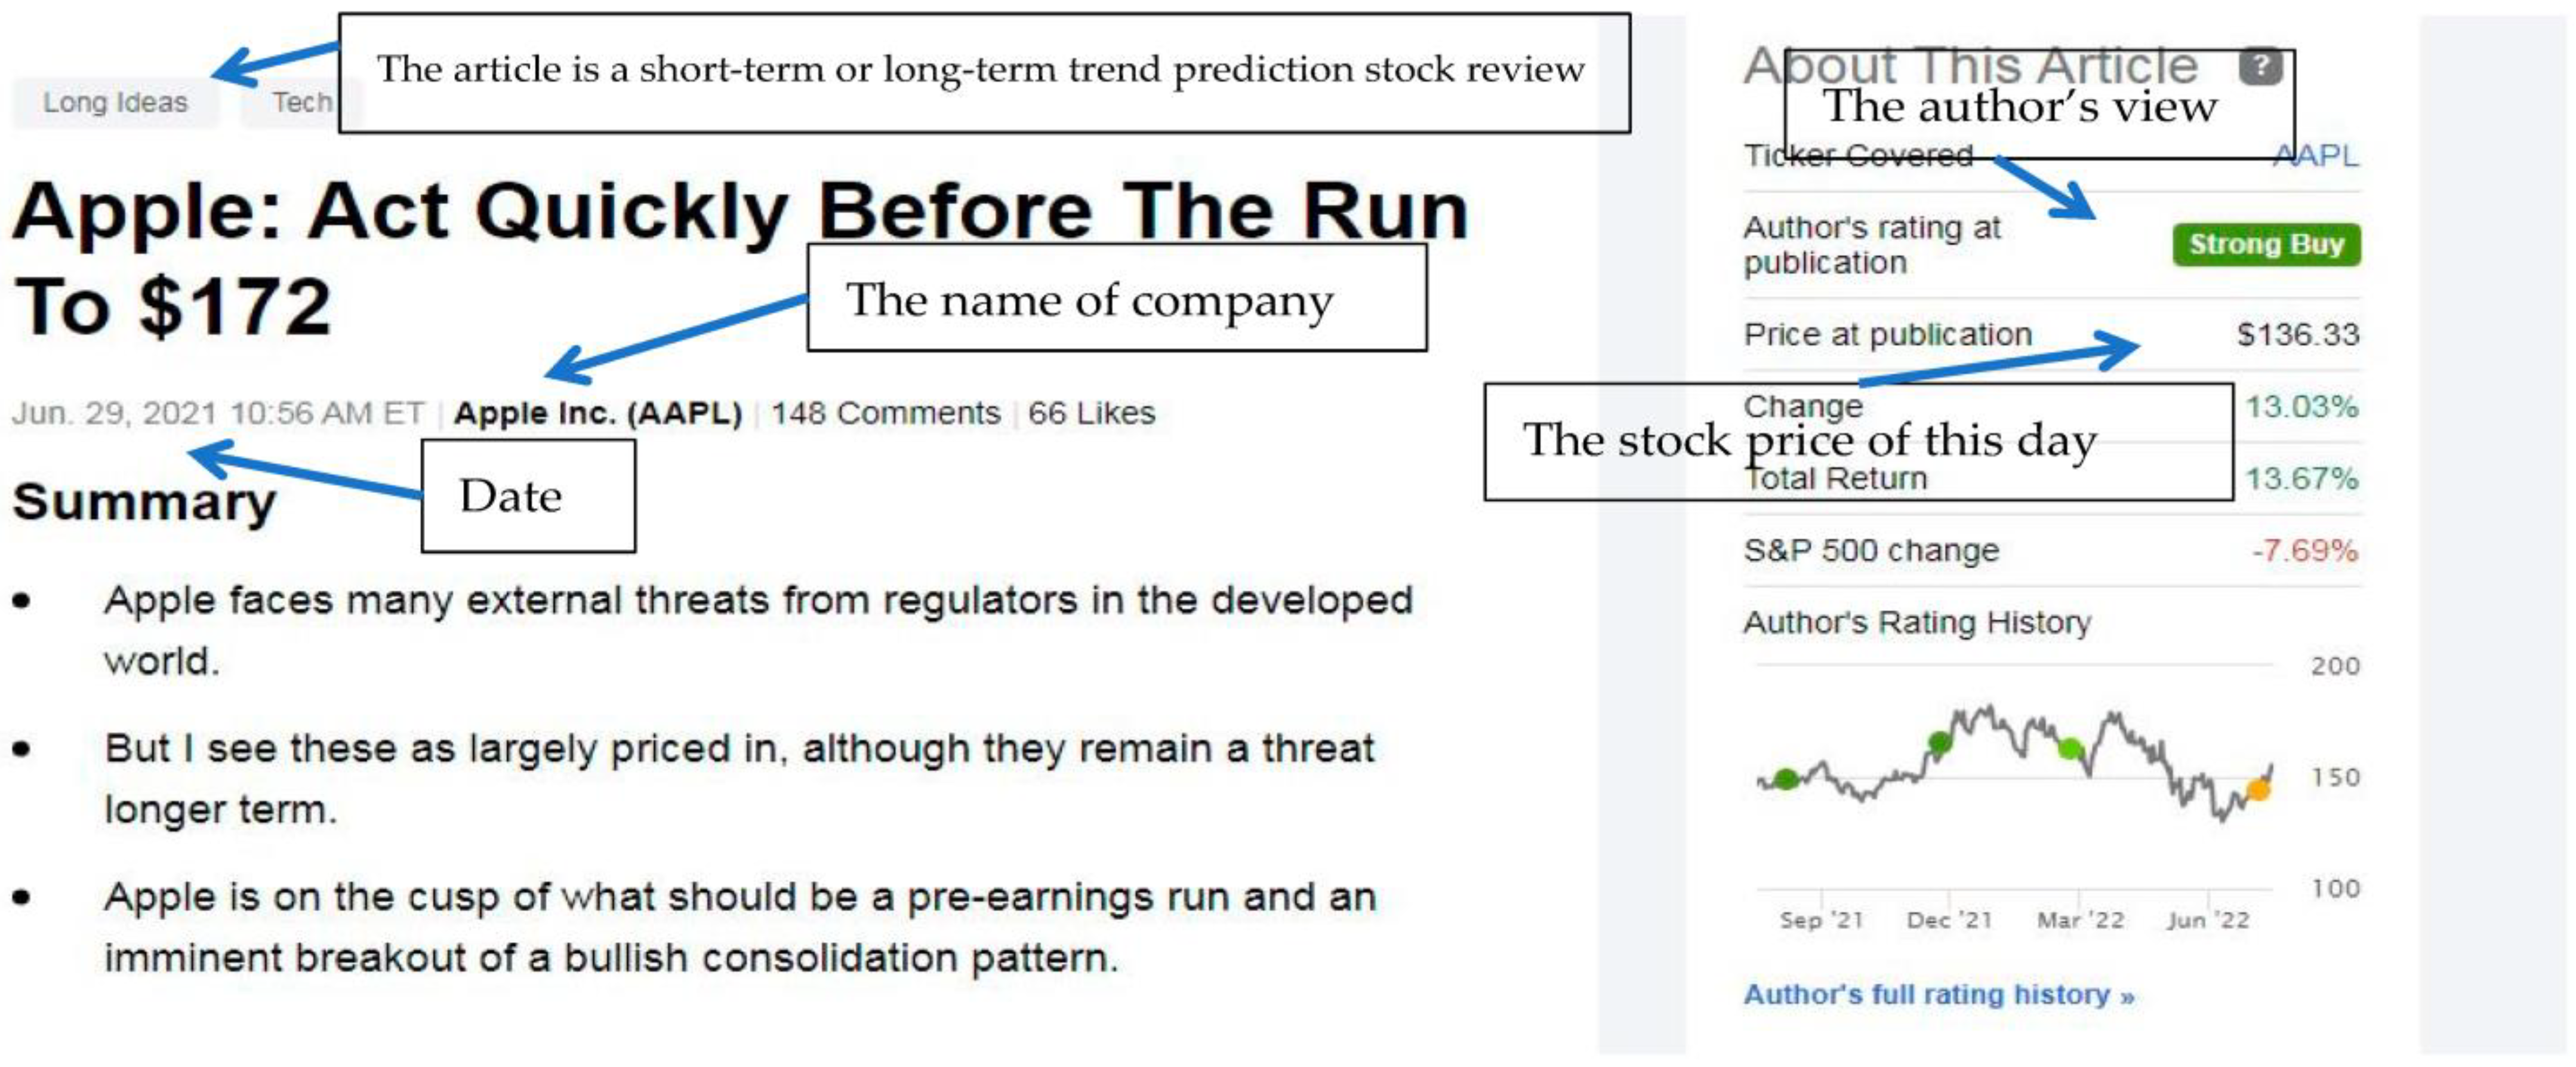
Below, we provide a screenshot of the stock comment page on SeekingAlpha. Through the forum’s search engine, we have obtained all the stock comments on the focal stocks. The key features of the dataset provided to CNN-SC are obtained through this collection process, and the stock comments of other companies are also obtained through this method. As
Figure 5 shows, the crawler investigates each webpage and obtains its title, short-term/long-term stock comments, publication date, company name, the author’s attitude towards a stock when the article was published, and the sentences in the summary section.
3.9. Comparative Methods
To show the computational performance of the proposed method, we compared the results of the proposed method with those obtained by other methods.
3.9.1. C-E-SVR&RF Model
A novel model called C-E-SVR&RF, first proposed in [
11], selects a different combination of two technical indicators from ten technical indicators. These indicators are input into a system that combines k-means clustering and ensemble learning to improve the prediction accuracy for a simple stock.
3.9.2. GC-CNN Model
In [
12], the creators of the GC-CNN model perform a correlation analysis with the target stock and other listed stocks and produce a different combination of overall stock market information and individual stock information. The overall information of individual stocks includes the closing price, turnover, and average equity static P/E ratio. The overall stock market information includes the market price of total equity, total transaction volume, and the Nasdaq Index. Then, they enter these into the adjacent matrix as the names of the vertical and horizontal coordinates to be processed. After obtaining the pairwise Spearman rank correlation values of stocks in the focal stock market, the authors use this connection matrix as the basis for calculating and generating the positive and negative relationship images. Following the network calculation, the system finally obtains the transaction data images of four channels: the highest price, opening price, closing price, and lowest price.
3.9.3. AffectiveSpace-NN Model
AffectiveSpace [
22] is a vector space model built utilizing random projection that allows for reasoning by analogy on natural language concepts. In AffectiveSpace, each concept is mapped to a 100-dimensional vector through a dimensionality reduction in affective common-sense knowledge. This procedure allows semantic features associated with concepts to be generalized and, hence, allows concepts to be intuitively clustered according to their semantic and affective relatedness.
3.9.4. DSPNN Model
In DSPNN [
23], the stock market information module constructs a market indicator vector for each stock, finds the stocks that are relevant to the target, and then weighs and sums their indicator vectors to produce the market information vector of the target stock. Afterward, in the stock trading information module, the investors are clustered according to their trading behavior profiles. The trading feature matrices are then constructed based on the transaction behaviors of the investor clusters concerning the target and relevant stocks. These matrices are subsequently fed into the CNN to obtain the group trading vector of the target stock. Finally, the two vectors are concatenated and fed into the attention-based BiLSTM prediction module to predict the target stock’s price movement direction and trend.
3.9.5. RNN-M Model
RNN-M [
24] is a variant of RNN. Generally, it takes sequence data as inputs to effectively capture the relationship characteristics between sequences through network internal structure design and produces outputs in the form of sequences.
3.10. Comparison Results of Different Methods
- (1)
The proposed GC-CNN-based method obtains a stable sentiment dictionary after processing the words of short-length stock comments. This dictionary can be used for stock price prediction for a long time. However, other methods do not use this storage mechanism and need to retrain the data every time.
- (2)
The computational efficiencies of the RNN-M, DSPNN and CNN-SC methods are high, but for the GC-CNN, AffectiveSpace-NN and C-E-SVR&RF methods, the computational efficiencies are low. In particular, the C-E-SVR&RF method and GC-CNN method require longer training times.
- (3)
In the field of machine learning, researchers who perform pattern recognition pay more attention to the accuracy of the model. On the other hand, researchers who perform reinforcement learning pay more attention to the effect of strategies obtained by optimization. Thus, most people do not pay attention to time complexity. Since time complexity is not discussed in almost all relevant documents, this paper will not discuss it.
- (4)
From the perspective of conception, the proposed GC-CNN-based method combines the thinking ability of people and the computing ability of machines. Due to the introduction of humans’ thinking ability, the GC-CNN method outperforms other comparison methods. Accordingly, this prediction model is the result of improvements to the traditional machine learning model.
4. Experimentations
The CNN-SC model can predict stock price changes—rises and falls—seven days after the publication of a stock comment. The model obtains stock trends by judging short-term stock comments on SeekingAlpha. The method used in this model is fundamentally different from the traditional machine learning method. Specifically, since expert opinions are used to assist the machine learning method and obtain stock trends, the model does not need much historical data for training. Its programming language is Python, and the data crawler tool that we use is selenium. The authors have uploaded the source code on github (
https://github.com/changzc1/sentiment-database). Through selenium and the corresponding program, a computer system can automatically obtain relevant information from a website. Selenium’s programs run directly in a browser, similar to how real users operate a website and complete the work that they wish to perform. Through it, the authors achieved the goal of the automatic acquisition and switching of web information.
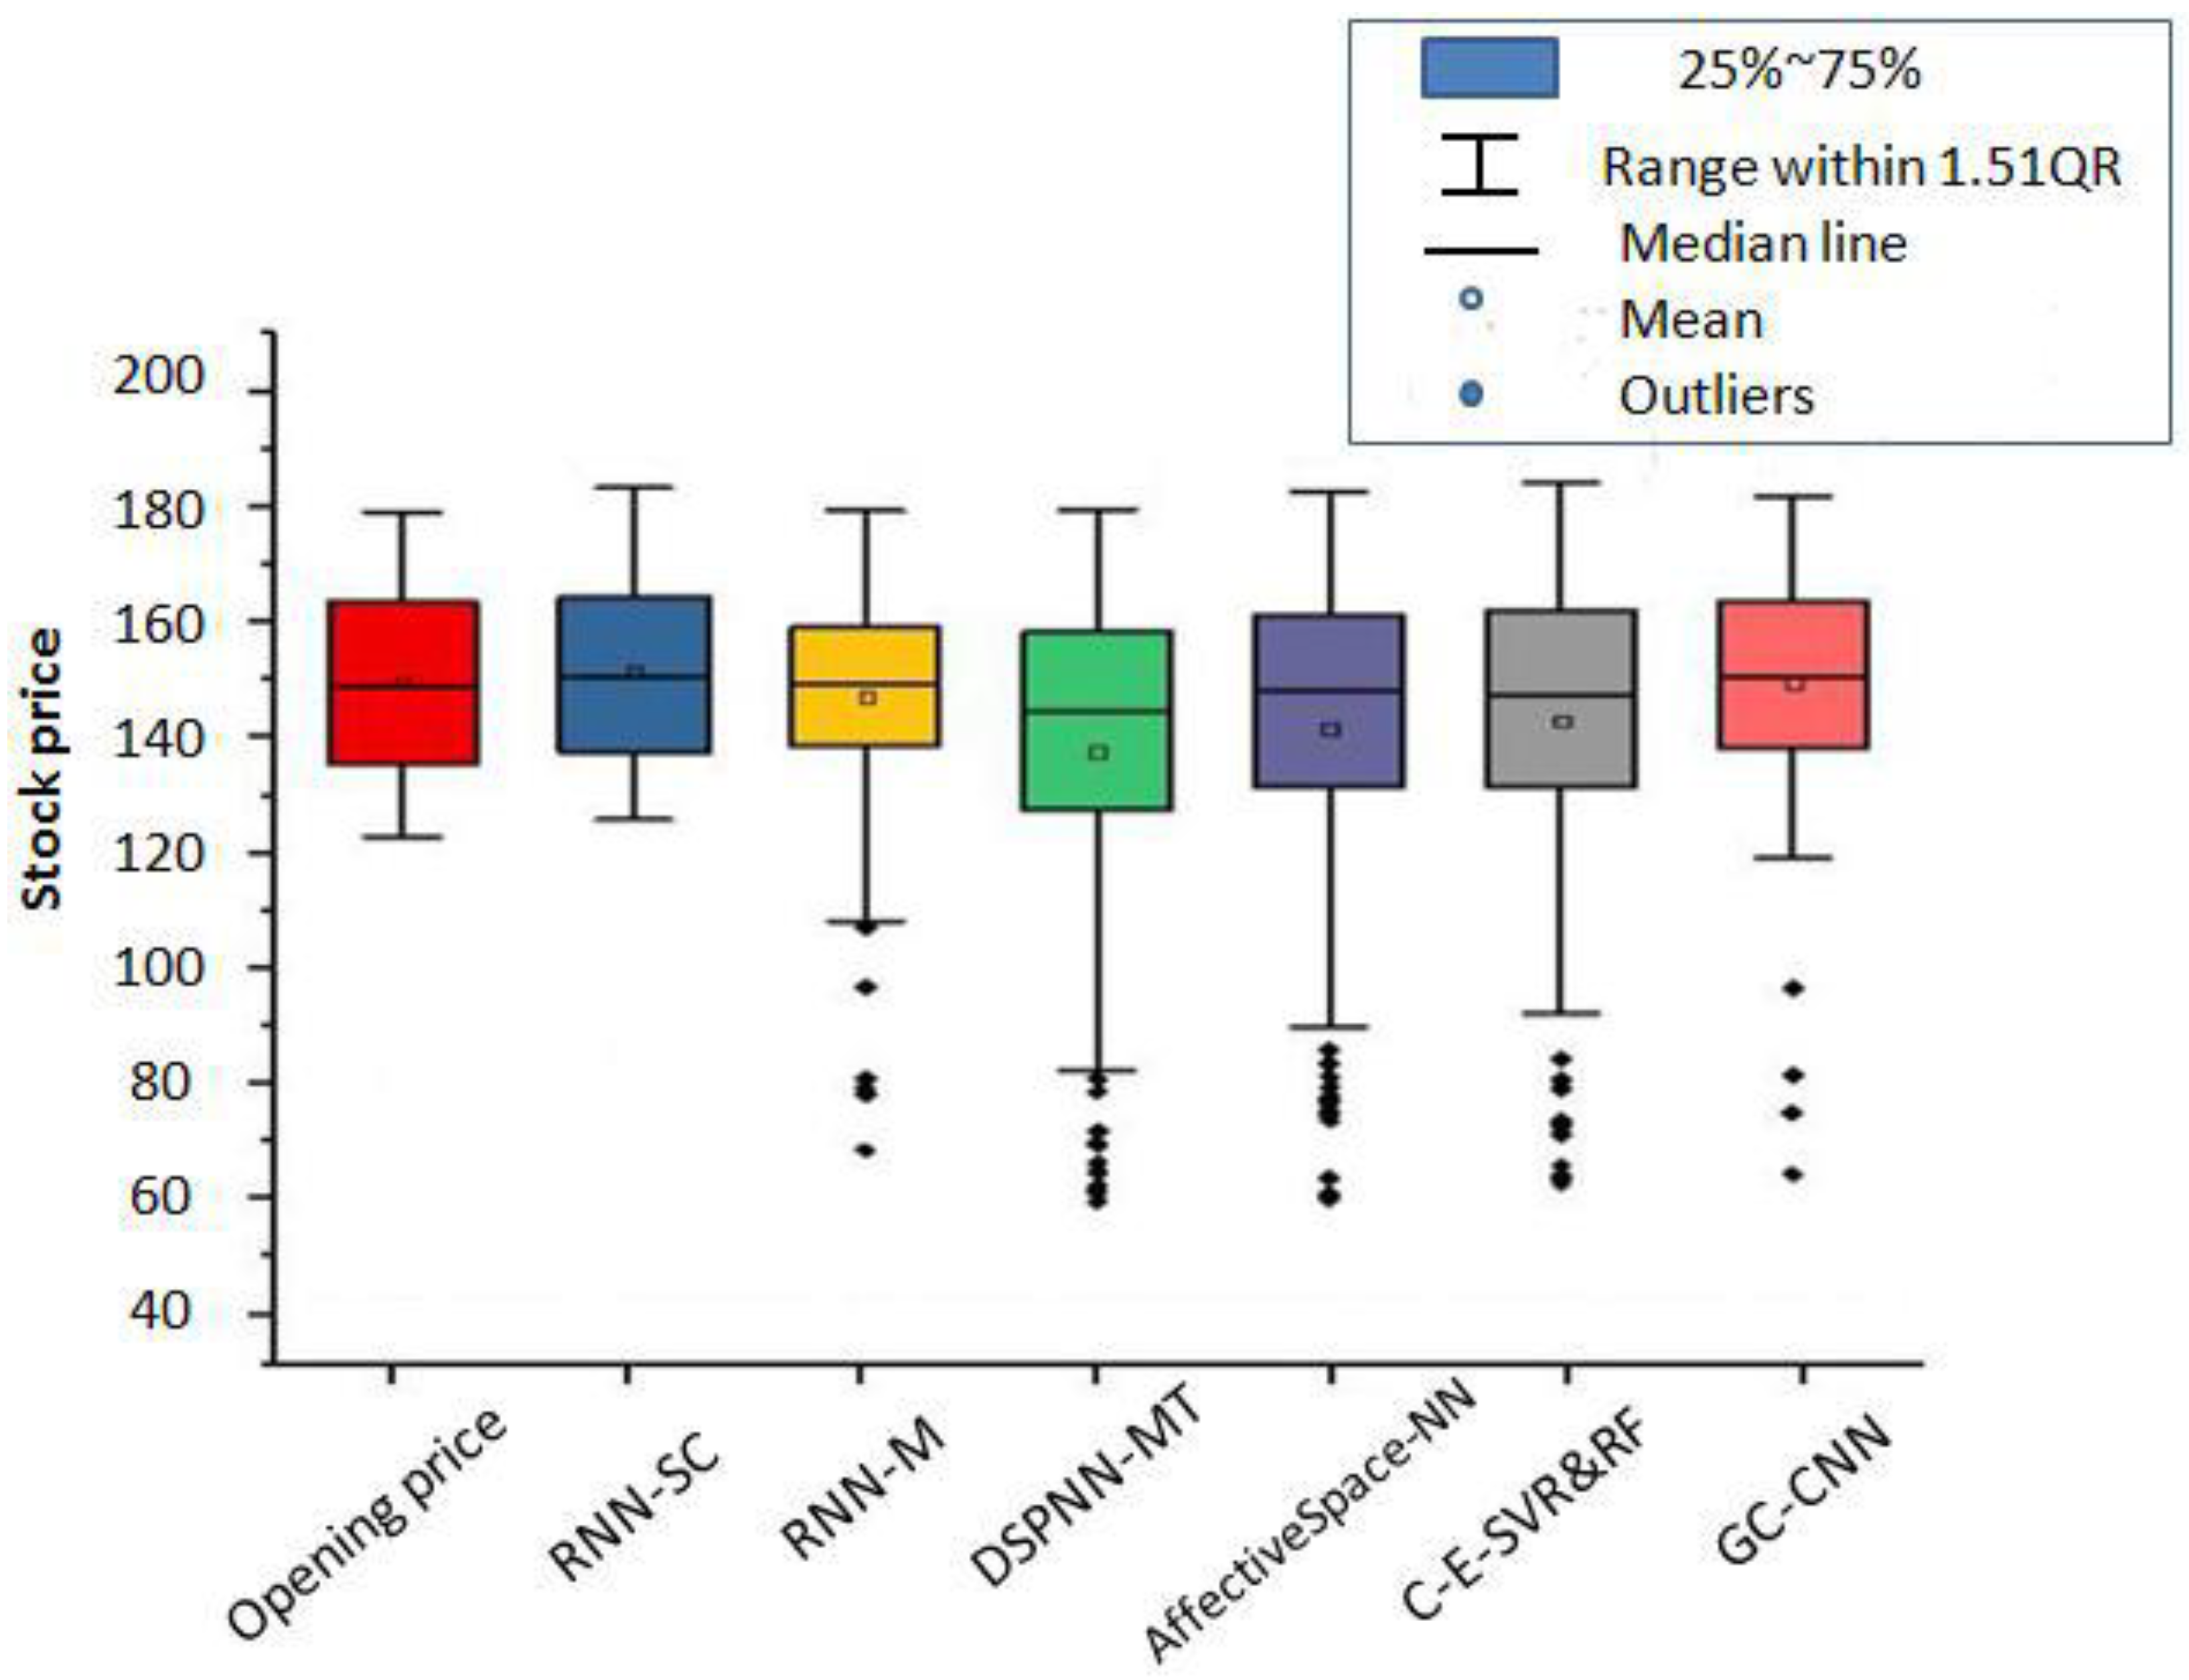
Through the data tool selenium, we collected 392 stock evaluation articles (AAPL (251), KO (70), MSFT (71)) regarding three stocks over a year and a half from SeekingAlpha, including 190 articles that were unrelated to the short-term trends of these stocks (simply comments on market trends, the long-term trends of stocks, etc.). We selected these three stocks because they represent three world-class multinational companies, and investors and financial experts worldwide are familiar with these stocks. Therefore, the number of stock reviews of these three stocks is greater than that of other stocks. Moreover, since the model eliminates all irrelevant articles, the necessary short-term trend stock comments in this experiment ultimately totaled 202.
In addition, total reliance on the analysis method of manual processing entails some limitations for the use of data. Because the analyzed data mentioned in other research have been based on information materials without labels (i.e., we do not know which emotion type these materials represent), if we want to analyze them using ML, we must manually add label types to allow the computer to train and learn. In this experiment, short comment articles with labels were thus used for training (these articles have the corresponding author’s emotional types); there was no need to add label types manually, thereby improving the accuracy of word-splitting training. CNN-SC can process large-scale text data with little manual intervention and realize the analysis, description, and knowledge discovery of massive data resources.
Our datasets were derived from two famous financial websites. We used data from StockTwits mainly to calculate the score value and FPMI value of the words that are unique to the financial field; we used data from SeekingAlpha to analyze the specific attitudes of experts towards stocks. We, therefore, obtained a reliable judgment basis and were able to judge a single stock’s stock price and trend through these two data sources. The creators of these data were senior investors and industry experts. After providing their comments on a stock, they also mark their sentiment towards the stock. In contrast to other research methods that generally use non-comment publishers to annotate sentiments, our method uses the sentiment annotations of comment publishers, which are extremely authentic. Therefore, the dataset used in this paper is reasonable and reliable.
The dataset used for other model experiments is a continuous historical dataset from 2012 to 2022. The data from 2012 to 2020 are training sets, and the data from 2020 to 2022 are test sets. In contrast, the dataset used for the CNN model experiment is collected by the authors, and is discrete. This dataset is attached to the article. The authors need to compare the result generated by the CNN with the results generated by other models. From 2020 to 2022, when there is a corresponding sample in the supplementary datasets on a certain day, the system will select the sample of the corresponding date from the historical dataset.
6. Conclusions
In this paper, a unique method to predict stock trends through the sentiments of expert stock comments is described. When determining the price fluctuation of a single stock, in contrast to other models that posit stock price fluctuations by training historical transaction data, we construct a model to show that the basic elements of stock comments determine their emotional tendency and, ultimately, the value of their predicted price fluctuation. Our empirical data results suggest that this method is reasonable and efficient. The model that we recommend in this paper thus enables users to flexibly select appropriate stocks from a potentially risky stock market and to quickly generate profit. Moreover, it can quickly clarify trends for users and help to prevent their asset loss in an upcoming bear market.
Given that one of the keys to examining stock market trends comprises the attitudes of stock evaluation experts towards stocks, rather than historical data, the model recommended in this paper only needs the sentiment value of experts’ stock evaluations. Most people who trust expert comments can obtain profits from a stock market, but these people account for only a small part of the total number of investors. The benefits of using insider information will decrease with an increase in the number of people who apply it, which reflects how only a small number of people in each market can obtain a profit. In addition, the prediction results that we have derived in this paper are not necessarily consistent with the opinions of authors concerning stock evaluation; thus, the method that we have recommended is not equivalent to directly using expert opinions to predict stock prices.
Accordingly, to evaluate the universality of our expert system, we investigated the prediction performance of our focal three stocks after 7 days. These stocks were selected to capture different industries, stock price volatilities, and change patterns. Our results, summarized in
Table 3 and
Table 4, show that the CNN-SC method is generally better than other methods in this regard. The CNN-SC method can obtain the necessary data through one instance of training, which reflects its high efficiency. However, for the GC-CNN, AffectiveSpace-NN, and C-E-SVR&RF methods, the computational efficiencies are low. Specifically, the C-E-SVR&RF method and GC-CNN method require longer training times. Here, the process of training the dataset in other judgment methods is omitted, and the efficiency of stock trend judgment is improved. Moreover, these findings demonstrate that the proposed method can correctly judge a short-term (seven days later) stock trend, even in the absence of historical data.
Nevertheless, concerning long-term stock trends, the method recommended in this paper cannot predict them effectively. There is thus still great room for improvement, which researchers should consider in the future.


