Article

A Hybrid Attention Network for Malware Detection Based on Multi-Feature Aligned and Fusion

School of Cyber Science and Engineering, Sichuan University, Chengdu 610207, China
*
Author to whom correspondence should be addressed.
Electronics 2023, 12(3), 713; https://doi.org/10.3390/electronics12030713
Submission received: 22 December 2022 / Revised: 19 January 2023 / Accepted: 20 January 2023 / Published: 1 February 2023
(This article belongs to the Special Issue Big Data Analytics and Artificial Intelligence in Electronics)

Abstract

:
With the widespread use of computers, the amount of malware has increased exponentially. Since dynamic detection is costly in both time and resources, most existing malware detection methods are based on static features. However, existing static methods mainly rely on single feature types of malware, while few pay attention to multi-feature fusion. This paper presents a novel multi-feature extraction and fusion method to effectively detect malware variants by combining binary and opcode features. We propose a stacked convolutional network to capture the temporal and discontinuity information in the function call of the binary file from malware. Additionally, we adopt the triangular attention algorithm to extract code-level features from assembly code. Additionally, these two extracted features are aligned and fused by the cross-attention, which could provide a stable feature representation. We evaluate our method on two different datasets. It achieves an accuracy of 0.9954 on the Kaggle Malware Classification dataset and an accuracy of 0.9544 on a large real-world dataset. To optimize our detection model, we conduct in-depth discussions on different feature extractors and multi-feature fusion strategies. Moreover, a visualized attention module in our model is provided to explain its superiority in the opcode feature extraction. An experimental analysis is performed against five baseline deep learning models and five state-of-the-art malware detection models, which reveals that our strategy outperforms competing approaches in all evaluation circumstances.

1. Introduction

The global explosion of COVID-19 at the start of 2020 gradually transformed the workplace orientation in different fields to online. The proliferation of online office users also provides business opportunities for malware developers. Cyber-criminals have produced a variety of malicious software, such as malicious advertising, extortion software and mining viruses. According to the Kaspersky Security Network (KSN) statistics from November 2019 to October 2021, during the year, 15.45% of internet user machines were subjected to at least one malware attack, with ransomware targeting 366,256 networkers, and the miner virus illegally controlled 1,184,986 devices. These viruses carry out harmful actions on the machine that has been infected, such as collecting private information, property, or corporate data, taking use of computational resources available on desktops, servers, and cloud settings, and infecting hosts on the internet with zombie applications to manage their network resource usage. Malware poses a significant danger to individual security as well as the security across all fields. Detecting and responding to malware in time has become essential infrastructure to ensure network office security.
Malware is typically defined as programs that infiltrate the system in an unauthorized manner with the intent of compromising the confidentiality, integrity, and availability of the target host’s data, applications, or operating systems. In comparison to other types of cyber-attacks, malware requires files as carriers and employs illicit techniques to deceive victims into downloading them. Earlier studies on malware detection focused on signature-based analysis, such as YARA rules [1] and program segment matching. This method is effective in detecting known malware. However, malware creators alter the binary structure of the program by reordering the program instructions and unrelated code encryption, which leads to the failure of signature detection and interferes with traditional static detection methods.
Malware families that frequently occur in cyber assault reports include viruses, trojans, spyware, worms, scareware, and bots. According to the feedback from the malware detection supplier counted by AV-Test, the majority of the malware received is a version of existing malware. This means that malware from the same family shows the same or highly similar behavior. For example, malware of the same family has similar binary sequence fragments and has assembly code blocks that represent the same behavior, etc. Hence, researchers [2,3,4] gradually began to use machine learning methods to develop malware detection models. Ahmadi et al. [5] used machine learning methods to automatically learn the representative behavior patterns of malware, but this approach required some expert knowledge. With the migration of vision processing methods based on deep learning to malware detection, converting binary files to images [6,7] has become the focus of increasing research. However, this method often goes through compression and deformation operations such as resizing, which make it difficult to restore import tables, export tables and other resources, and result in information loss. Alternatively, assembly operation code is another common feature in static detection. Raff et al. [8] used CNN to extract a n-gram of important instructions. This method usually focuses on the local features of the specific function patterns, while ignoring the integrity and long-distance calling relationship during the function call. In the study of Guen et al. [9], diverse features are fed into different models for training and the models are then comprehensively evaluated in the process of generating results. However, they did not propose a multi-feature fusion method to improve model performance effectively.
To address the aforementioned issues, we propose a hybrid attention model for malware detection by effectively integrating binary file and assembly code. To overcome the problem of incomplete capture of binary sequence information, we take the binary sequence as the original input, and its features are extracted by the stacked double-layer convolution network. The first convolution layer extracts the temporal information, while the second convolution layer catches the discontinuity during function call and jump. Simultaneously, we use the triangular attention module to extract code-level features, which not only considers the integrated relationship of functions, but also combines the usage pattern of opcodes locally. Finally, the cross-attention module is used to align and fuse these two features, so that the network can learn the relation between binary files and assembly code and improve the stability of the fusion feature representation, and thus achieve better performance in the independent test.
Our experiment takes the Microsoft Malware Classification Challenge dataset as the benchmark dataset, which is widely used to verify the performance of malware detection models [5,10,11]. Moreover, to verify our model has the capability to detect new malware, we collected software uploaded by network users from Malshare as additional datasets, including recently popular malware such as the ransomware and mining software. To demonstrate the validity of each module in our model, we construct comprehensive comparison analysis for binary feature extraction methods, opcode feature extraction methods, feature fusion methods, and their combinations. We then compare our model with the deep learning method which is commonly applied in current research. According to the results, we argue that our framework performs well in malware detection and can effectively identify new malicious software.
Our contributions can be summarized as follows:
  • We proposed a stacked double-layer convolution network to extract binary file features, which overcame the limitations of the previous image processing method.
  • We adopted the triangular attention algorithm to extract opcodes usage patterns, which could focus on the key subroutine in the program while considering the long-distance relationship between function call.
  • We used the cross-attention to realize the fusion of different features by enabling cross-modal connections at different depths, which improved the effect of feature representation and brought considerably improved accuracy.
  • We collected and labeled the PE format files for the most recent five years on the Malshare website, and the dataset can be further studied.
The rest of the paper is organized as follows. Section 2 reviews some related work. Section 3 explains the overall architecture of our framework and describes every module in detail. Section 4 introduces the dataset used in this study and outlines the results. Section 5 discusses the optimization process of the model and shows the visual analysis of the attention module, and conclusions are given in Section 6.

2. Related Work

According to the previous work, based on the method of feature extraction, we describe the related work from the following three aspects: (1) traditional static detection method; (2) dynamic detection method; and (3) multi-feature fusion detection method.

2.1. Traditional Static Detection Method

In this analysis, the study extracts features without running the malware samples. Signature-based detection method is a conventional method and widely used within commercial antivirus programs, which can quickly detect known malware. It is a basic method for creating malware file signatures using a hash algorithm such as message-digest algorithm 5 (MD5), secure hash algorithm 1 (SHA1), and so on.
The early work attempts to liberate from manual feature extraction by using the n-gram feature extraction method and constructs a machine learning classifier to classify files. Zhang et al. [12] proposed a method of using n-gram byte sequence features to detect malware, and utilized a classifier constructed by probabilistic neural network techniques. Shabtai et al. [13] developed the usage of feature sets of opcode patterns, made opcode sequence into different grams. However, the length of the n-gram could significantly affect the model performance. Relying on disassembly tools such as Interactive Disassembler (IDA Pro), many researchers use the malware’s calling function sequence as an identifying feature. Sharif et al. [14] statically analyzed the Windows System32 files, extracted the relevant application programming interface (API), and used these API calls to train the support vector machine classifier. Furthermore, Elhadi et al. [15] created an API call graph for each malware, stored the graph in the database, and matched the similarity using the longest common subsequence (LCS) technique between unknown and known harmful files.
This method has the problem of being unable to detect unknown malware, since simply a single byte change of the malware file might modify its signature, making it extremely vulnerable.

2.2. Dynamic Detection Method

Dynamic detection method entails running the target program in a sandbox to capture the activity characteristics of the software during execution, such as API calls, system registry, execution process, and network activities [16]. Trinius et al. [17] used CWSandbox to analyze malware and convert the generated report into a malware instruction set (MIST), while Vasilescu et al. [18] used a sandbox to collect dynamic analytic features, and trained malware detectors with log directory and execution information of binary files. Ghiasi et al. [19] proposed a method relying on the contents of CPU registers. A similarity in distance between two binary files was estimated to identify malware by executing binary files in the monitored environment and extracting API calls with dynamic analysis. In recent years, many researchers [20,21] have used graph encoding technology to extract more complex functional connections from dynamically extracted API calls. Angelo et al. [22] proposed a detection method based on depth map convolution neural network, which can directly learn API behavior information, and proved that on a public domain dataset, the model can successfully learn and discriminate between harmful and benign performance patterns. The strategy of building the call relationship into graph is worth learning.
Dynamic detection methods need to use a sandbox to extract dynamic behavior features from samples. The features extraction process takes more time and resources.

2.3. Multi-Feature Fusion Detection Method

There have always been limitations to the detection method based on a single feature. It is intuitively a superior solution that combines multiple static features, or both static and dynamic features. Gibert et al. [23] applied two-level convolution blocks to assemble opcodes and functions and extracted the features of n-gram from these two levels when constructing malware feature representation. Subsequently, Li et al. [20] input two features into CNN for automatic feature learning and classification, which greatly reduced the cost of manual feature extraction and achieved good results. O’Shaughnessy et al. [24] transformed static and dynamic information into pictures mapped for classification. Recently, in the construction of multimodal models, the idea of cross-attention has performed well and become increasingly popular [25,26,27].
Table 1 provides a summary of the associated malware detection research. They consist of techniques for feature extraction and malware classification. Incorporating multiple features enables a more efficient representation of software. In our work, we use convolution network and attention mechanisms to extract intrinsic expression of features and adopt cross-attention to achieve information interactions across modalities. Our method realizes automatic feature extraction without manual work. Based on ensuring that the extracted features contain the local and global information of the samples, we focus on how to carry out the approach of multi-feature fusion.

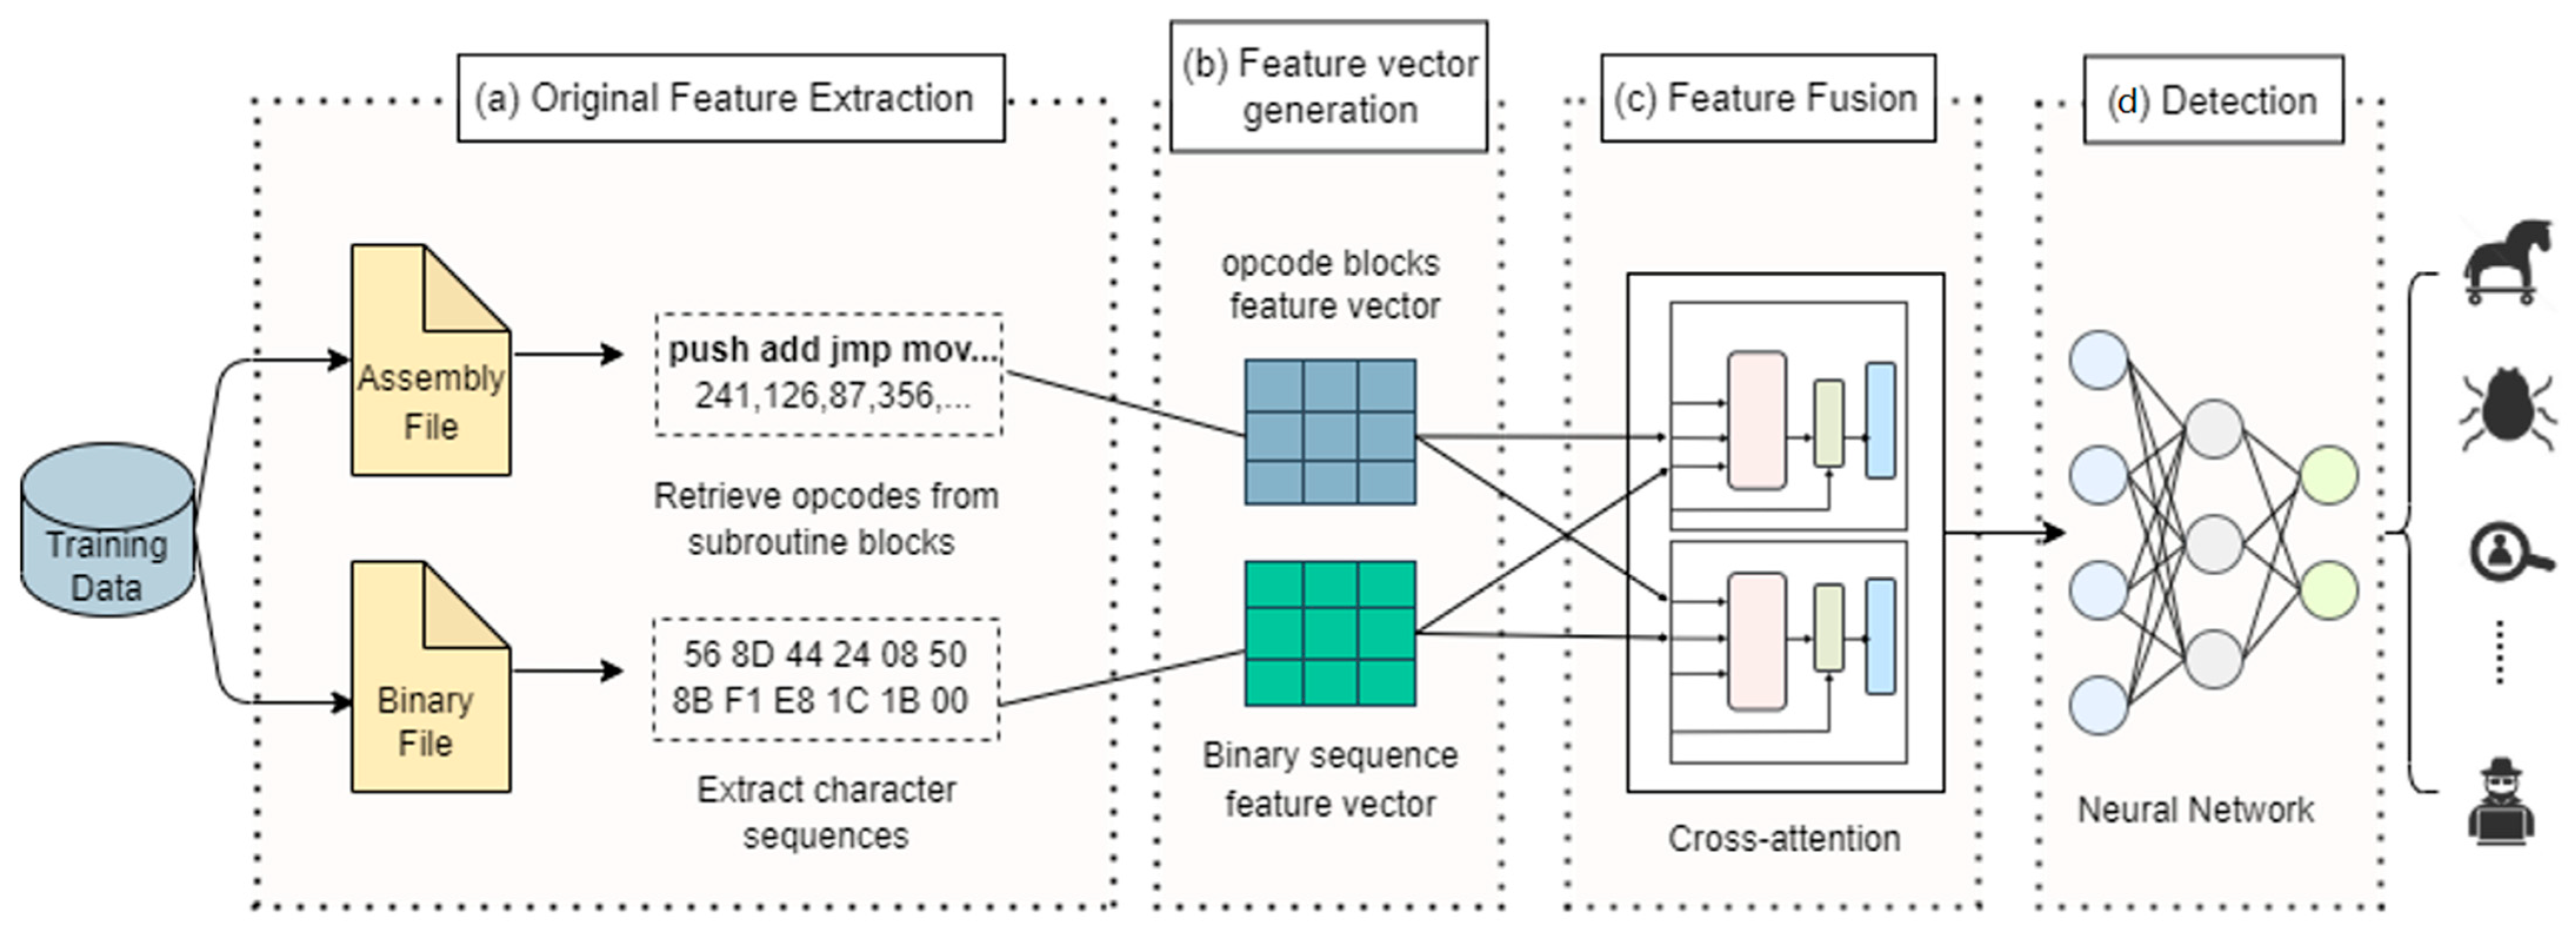
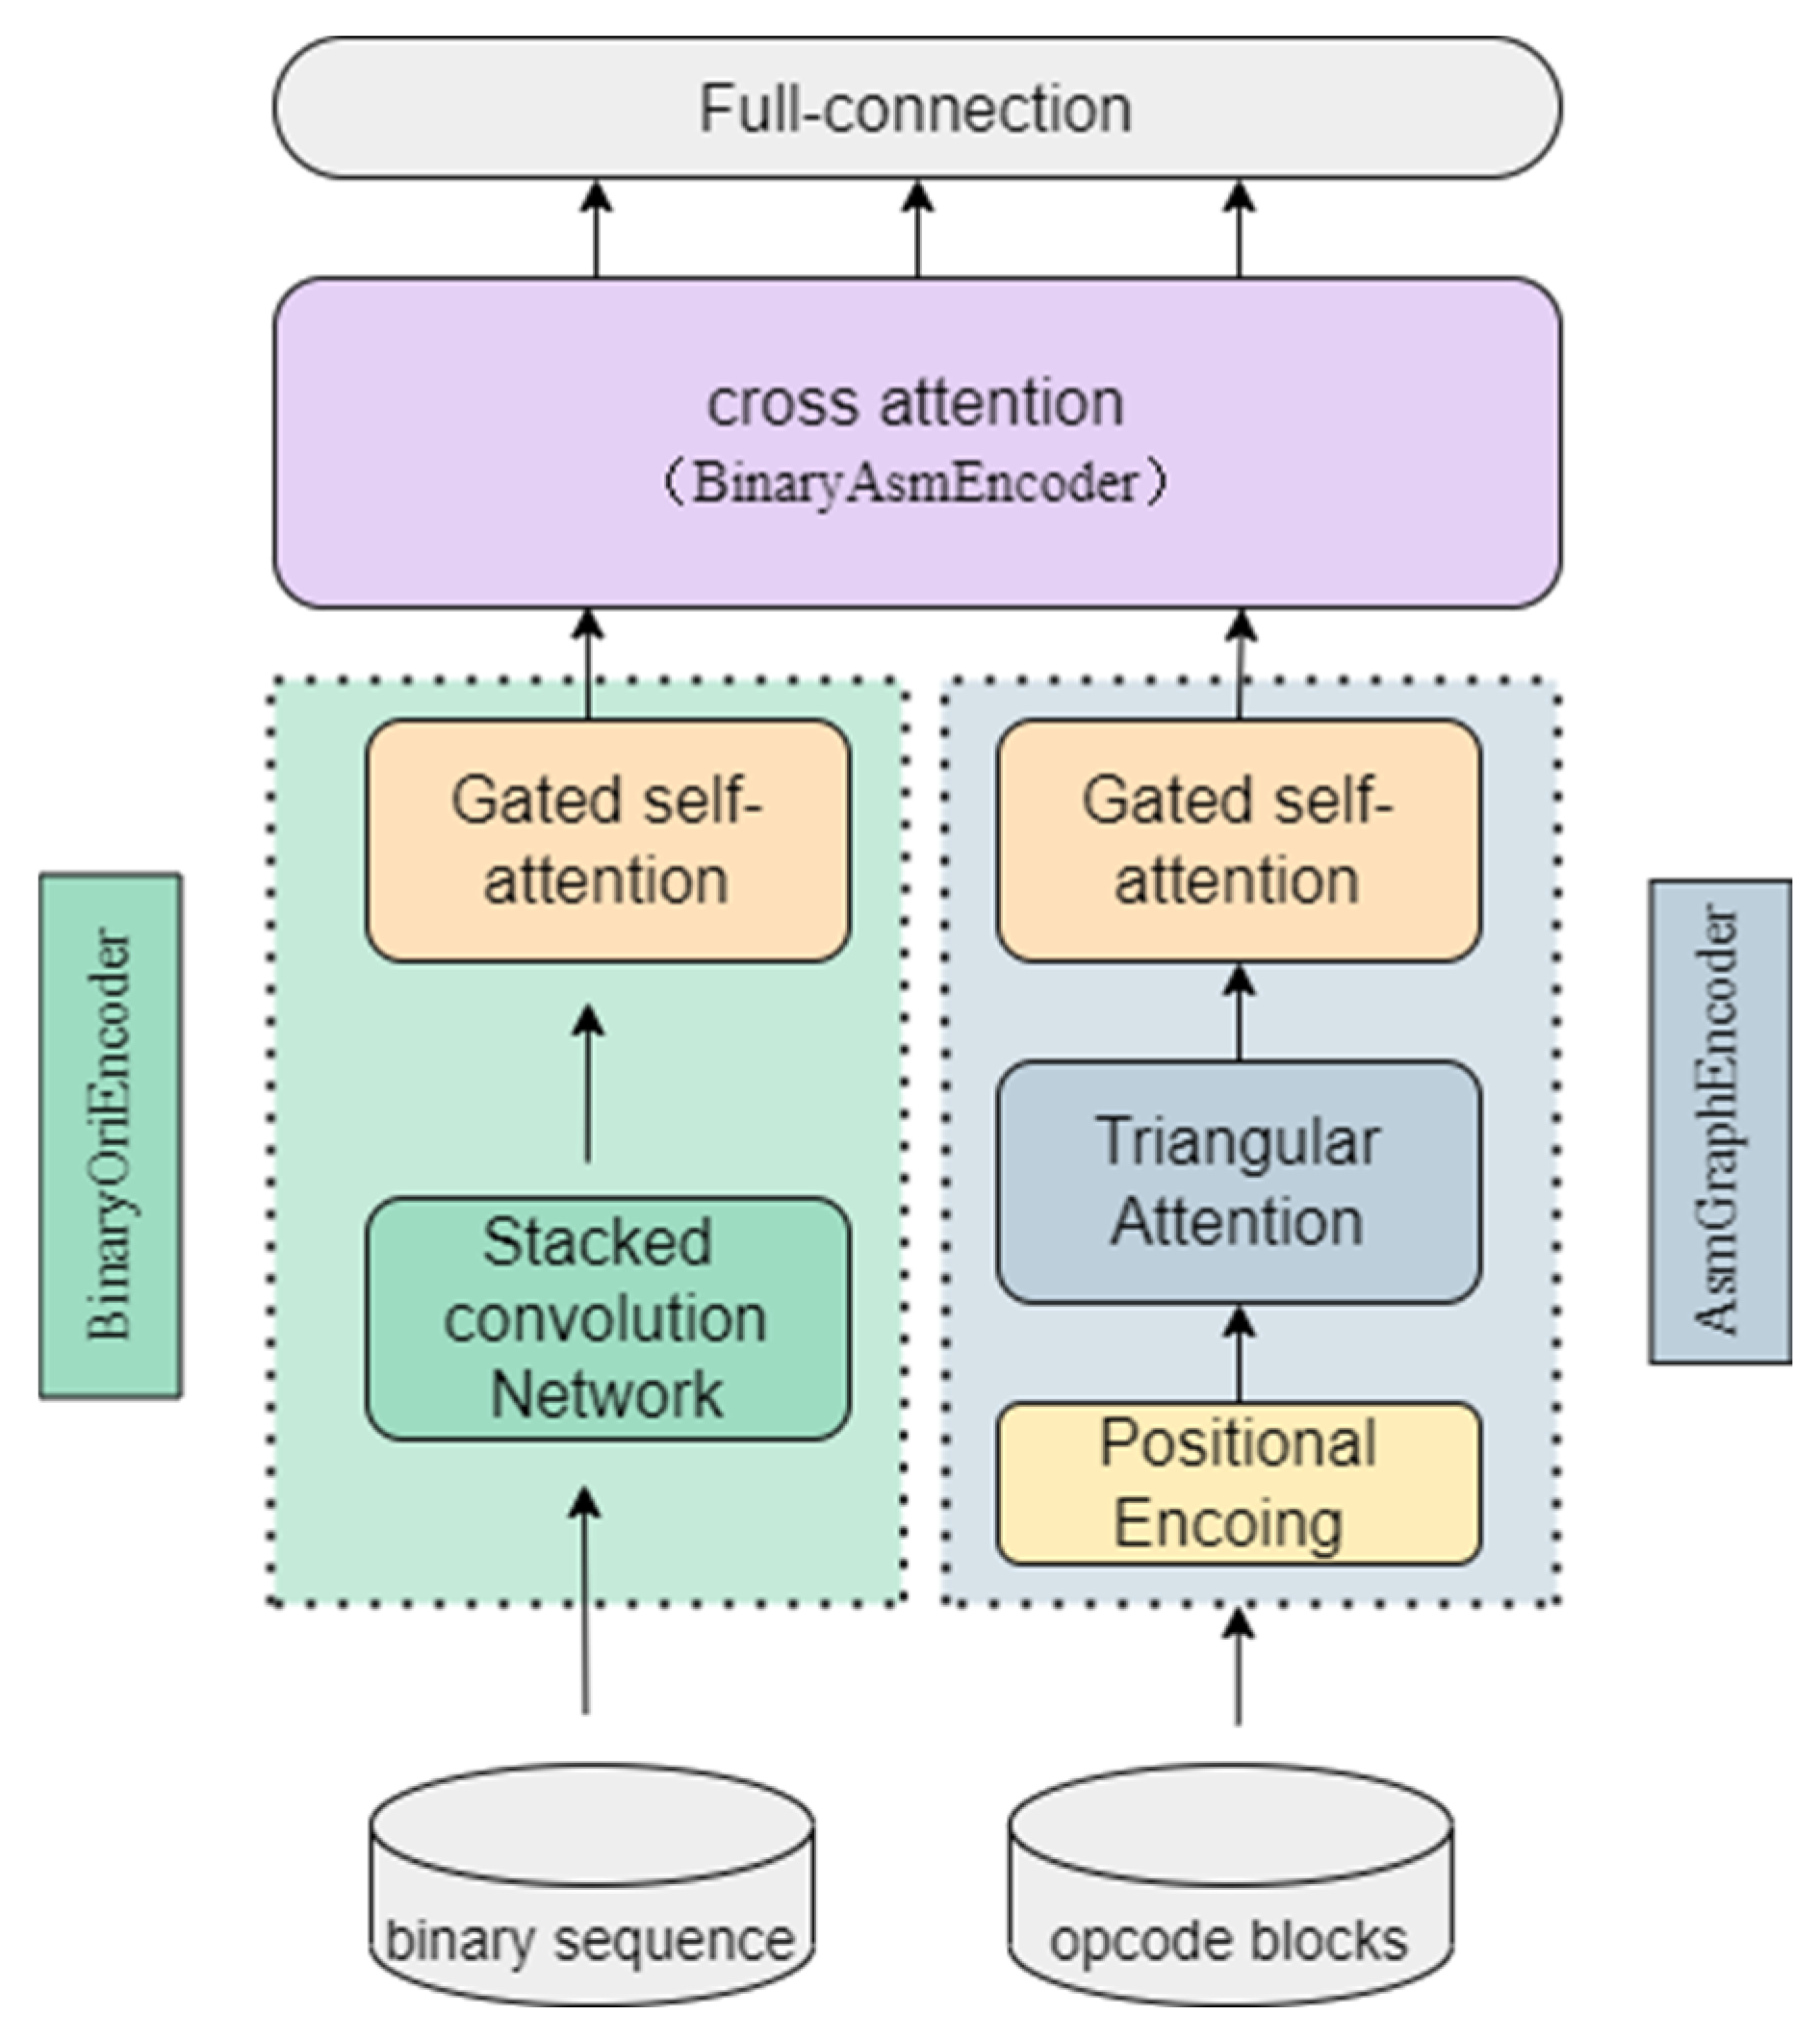
3. Proposed Framework

In this section, we introduce our malware detection model in depth. Figure 1 shows the overall framework of our model. The framework includes four major modules: original feature extraction module, feature vector generation module, multi-feature fusion module, and detection module. Firstly, the model extracts binary files and assembly files from the original data and converts these two files into a standard input format. Then, binary sequence and assembly operation code are fed into the feature extractor module for additional representation extraction. These two kinds of features are aligned and fused, and then fed into the classification module for malware detection.

3.1. Original Feature Extraction Module

We use IDA Pro [28] to statically decompile the sample software to obtain binary files and assembly files. Then, we extract character sequences from binary files and retrieve program blocks such as “.text” or “. Code” blocks in PE files from assembly files. We divide the program blocks into subroutine blocks and count the frequency of the key opcodes in each one. We choose the key opcodes that refer to Zhang’s work [29] and add some variables and registers on his basis. The operation codes, variable names and registers are selected as the key opcodes. Table 2 shows the key opcodes we extracted.

3.2. Feature Vector Generation Module

After extracting the original features of the sample, our model adopts different feature vector generation modules for the two extracted features.

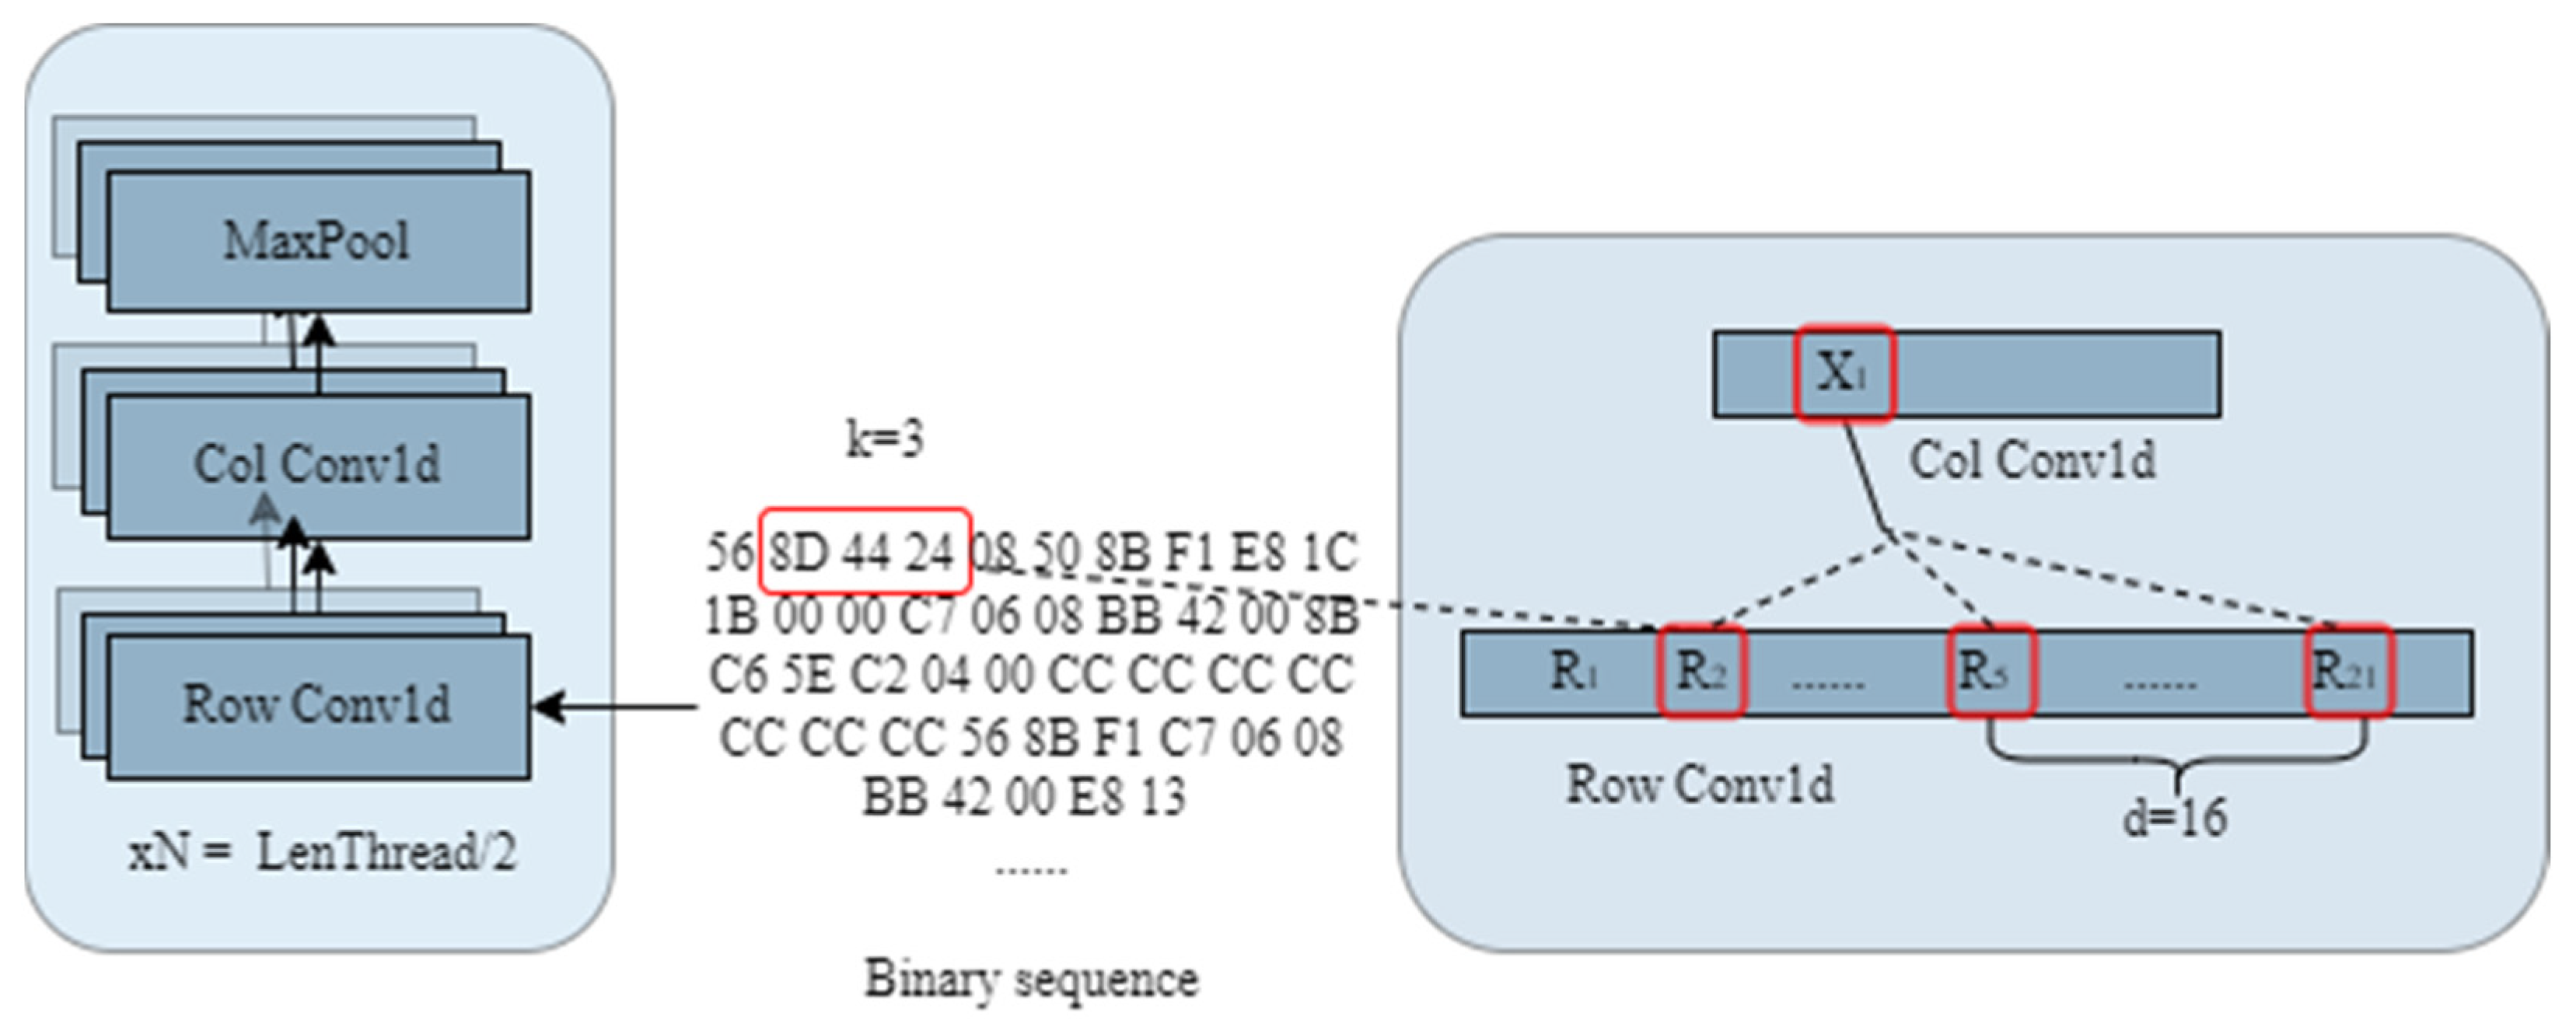
3.2.1. Stacked Convolution Network for Binary Feature Representation

A one-dimensional convolutional neural network is often used in time series feature extraction. Compared with other models like long-short-term memory (LSTM), one-dimensional convolution neural network (1D CNN) [30] has the benefit of being faster to train. Considering that the binary sequence is a one-dimensional linear structure, which contains the information represented by binary sequence, such as core function and resource call, they are discretely distributed in the whole sequence. Consequently, we use a one-dimensional convolution network to extract features. The specific framework of the module is shown in Figure 2.
The binary sequence is first input into the one-dimensional convolution to extract the byte characteristics within the fixed window size. The formulation of the convolution operation is as follows.
Given a sequence of binaries b 1 : n = b 1 , , b n ,where each range is between 0 and 255 (FF). Moving a sliding-window of size k across the sequence produces a 1D convolution of width-k:
x i = [ b i , b i + 1 , , b i + k ]
which is a dot-product of a weight vector u and the concatenation of the binary vector in a certain window k . A non-linear activation function g is followed. The filter is applied to each window of binary in the sequence { x i , x i + 1 , x n } to produce a feature map.
r i = g ( x i · u )   R
R = [ r 1 , r 2 , , r n ]
Then, the dilation convolution is used to extract a vector every d vectors based on the output vectors R 1 : n = R 1 , R n of the previous convolution. Similarly, a sliding window of size k is used to obtain the output sequence.
X i = [ R i , R i + d , R i + k d ]
By increasing the receptive field, the range of information included in each convolution output is enlarged and overcomes the problem of binary text’s long-distance information reliance.
To decrease the dimension and compress the information, the pooling layer receives the feature map produced by the double-1D-CNN layer. The infrastructure composed of a double-1D-CNN layer and pooling layer will be repeated until the dimension of the output feature matches the threshold the subsequent module accepts.

3.2.2. Opcode Embedding

A fundamental feature representation technique that is common in the field of NLP is the embedding layer [31]. In our framework, we use the embedding layer to turn the opcode blocks into a graph. Let A n × 36 be the n-blocks sample; n represents the number of code blocks contained in the assembly file and each block was represented as a 36-dimensional vector, which is then converted to a preset embedding size e. Then, the opcode blocks A n × e is extended to a relation matrix A n × n × e by direct adding two transformed matrices, A 1 × n × e and A n × 1 × e .

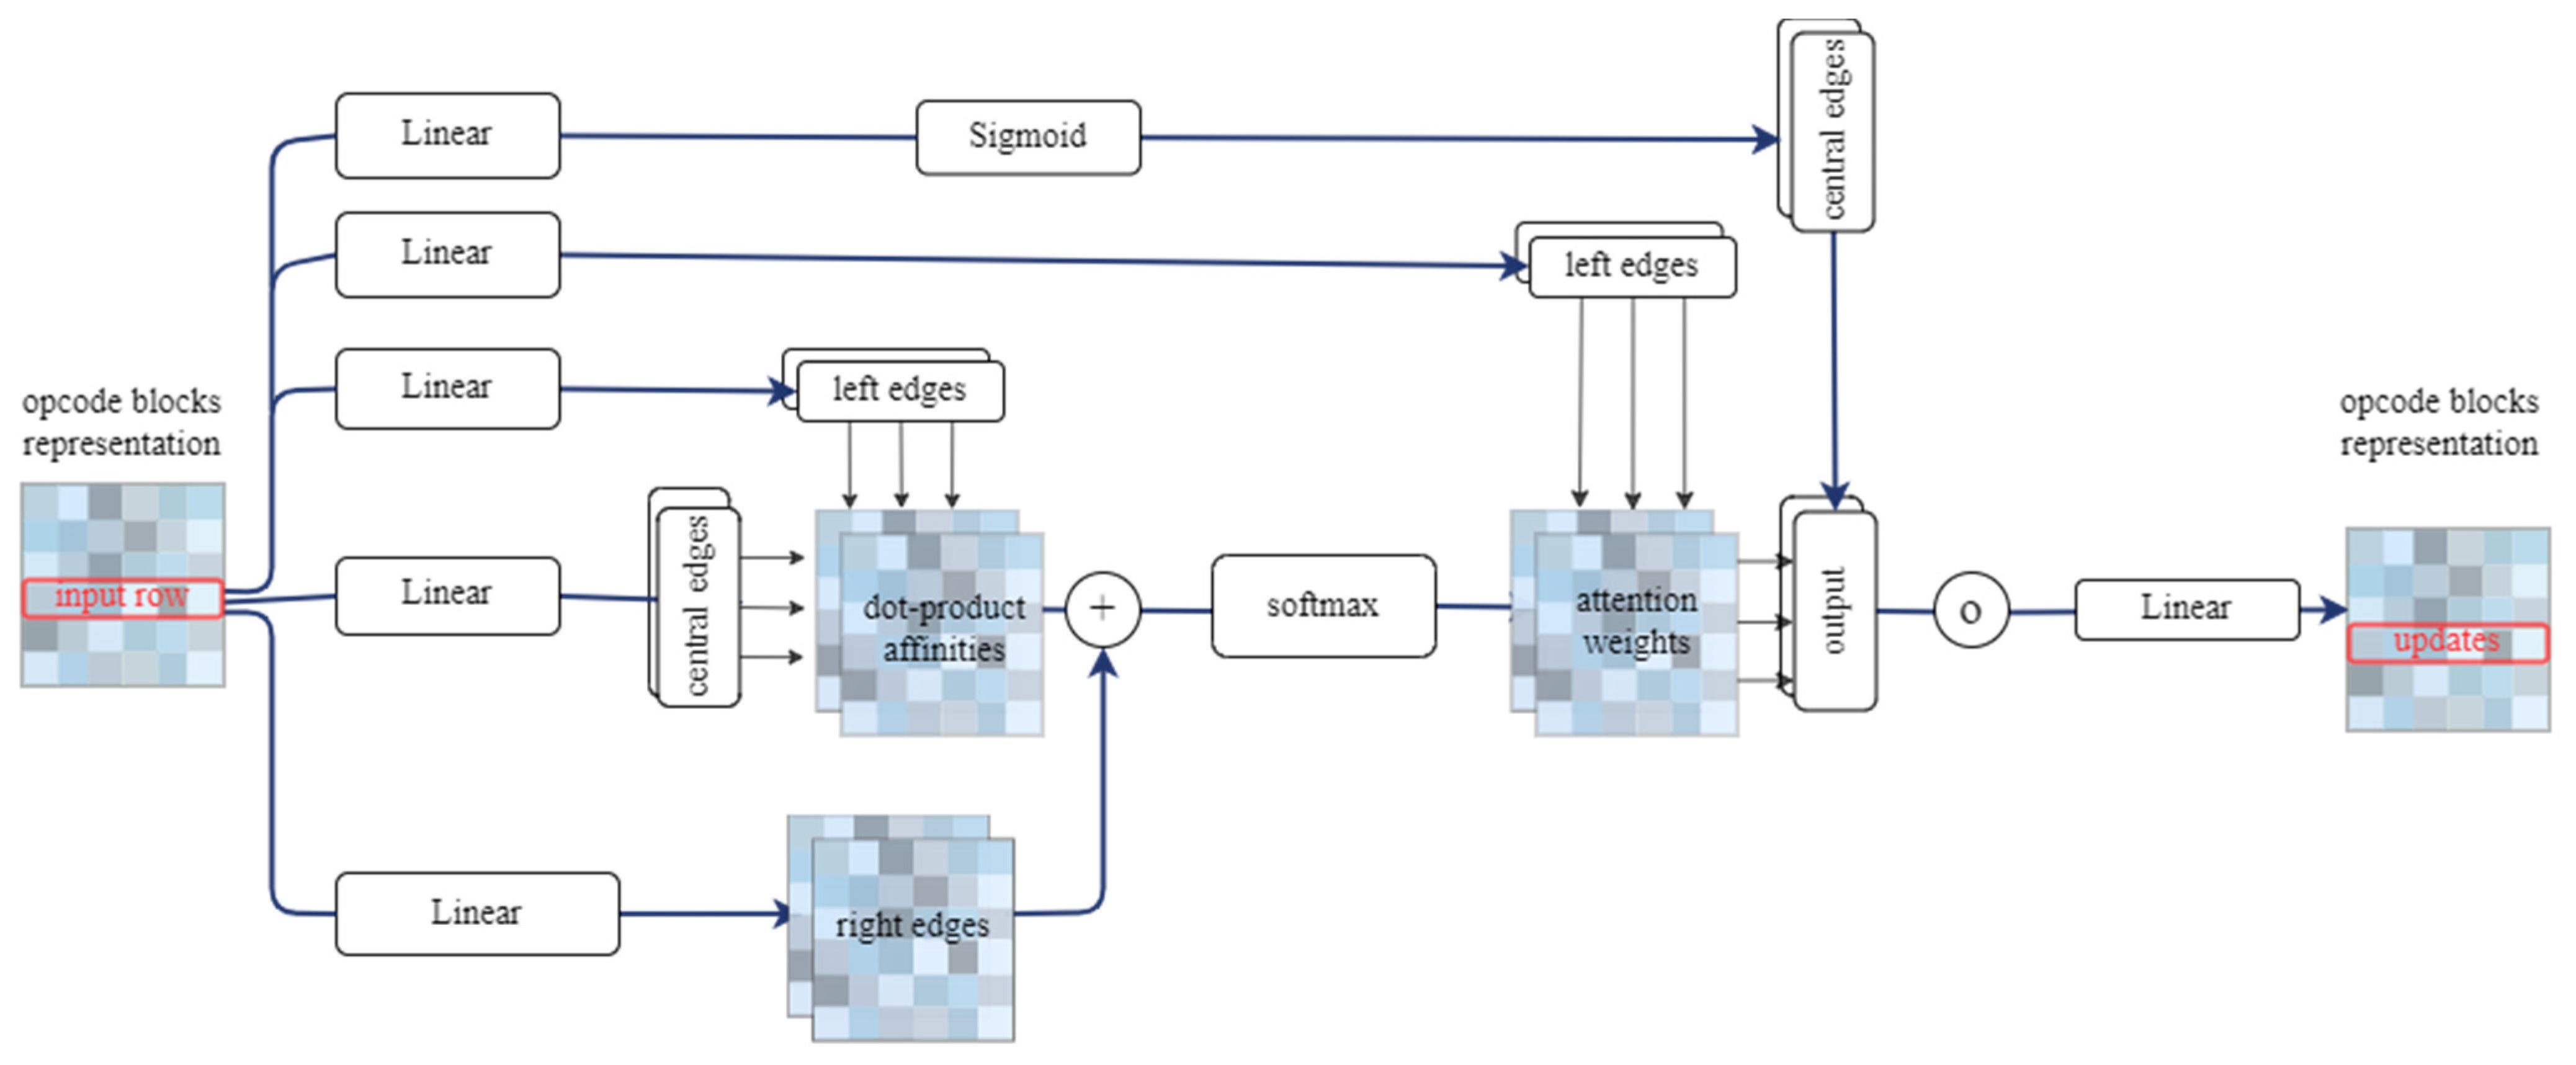
3.2.3. Triangular Attention for Opcode Feature Extracting

Referring to the method of feature modeling for amino acid pairs in AlphaFold [32], we use the triangular self-attention algorithm to extract the internal association of opcode blocks and the long-distance relationship between different opcode blocks. The triangular self-attention is defined as follows:
Calculate the q i j h ,   k i j h , v i j h   b i j h   c ,   h { 1 , ,   N h e a d = 4 } , c = 32 from the input opcode vector z i j , and the output z i j ˜ can be calculated by the following formula.
Firstly, calculate the Attention score as:
a i j k h = s o f t m a x k ( 1 c q i j h T k i k h + b j k h )
and the output gate as:
g i j h = s i g m o i d ( L i n e a r ( z i j ) )
Secondly, calculate the result as:
o i j h = g i j h k a i j k h v i k h
Finally, the output is concatenated by N h e a d results as:
z i j ˜ = L i n e a r ( c o n c a t h ( o i j h ) )
The “starting node” version updates the edge i j with values from all edges that share the same starting node i , (i.e., all edges i k ). The decision whether edge i j will receive an update from edge i k is not only determined by their query-key similarity (as in standard attention), but also modulated by the information b j k derived from the third edge j k of this triangle. Furthermore, we extend the update with an additional gating g i j derived from edge i j . The symmetric pair of this module operates on the edges around the ending node. The complete structure is shown in Figure 3.

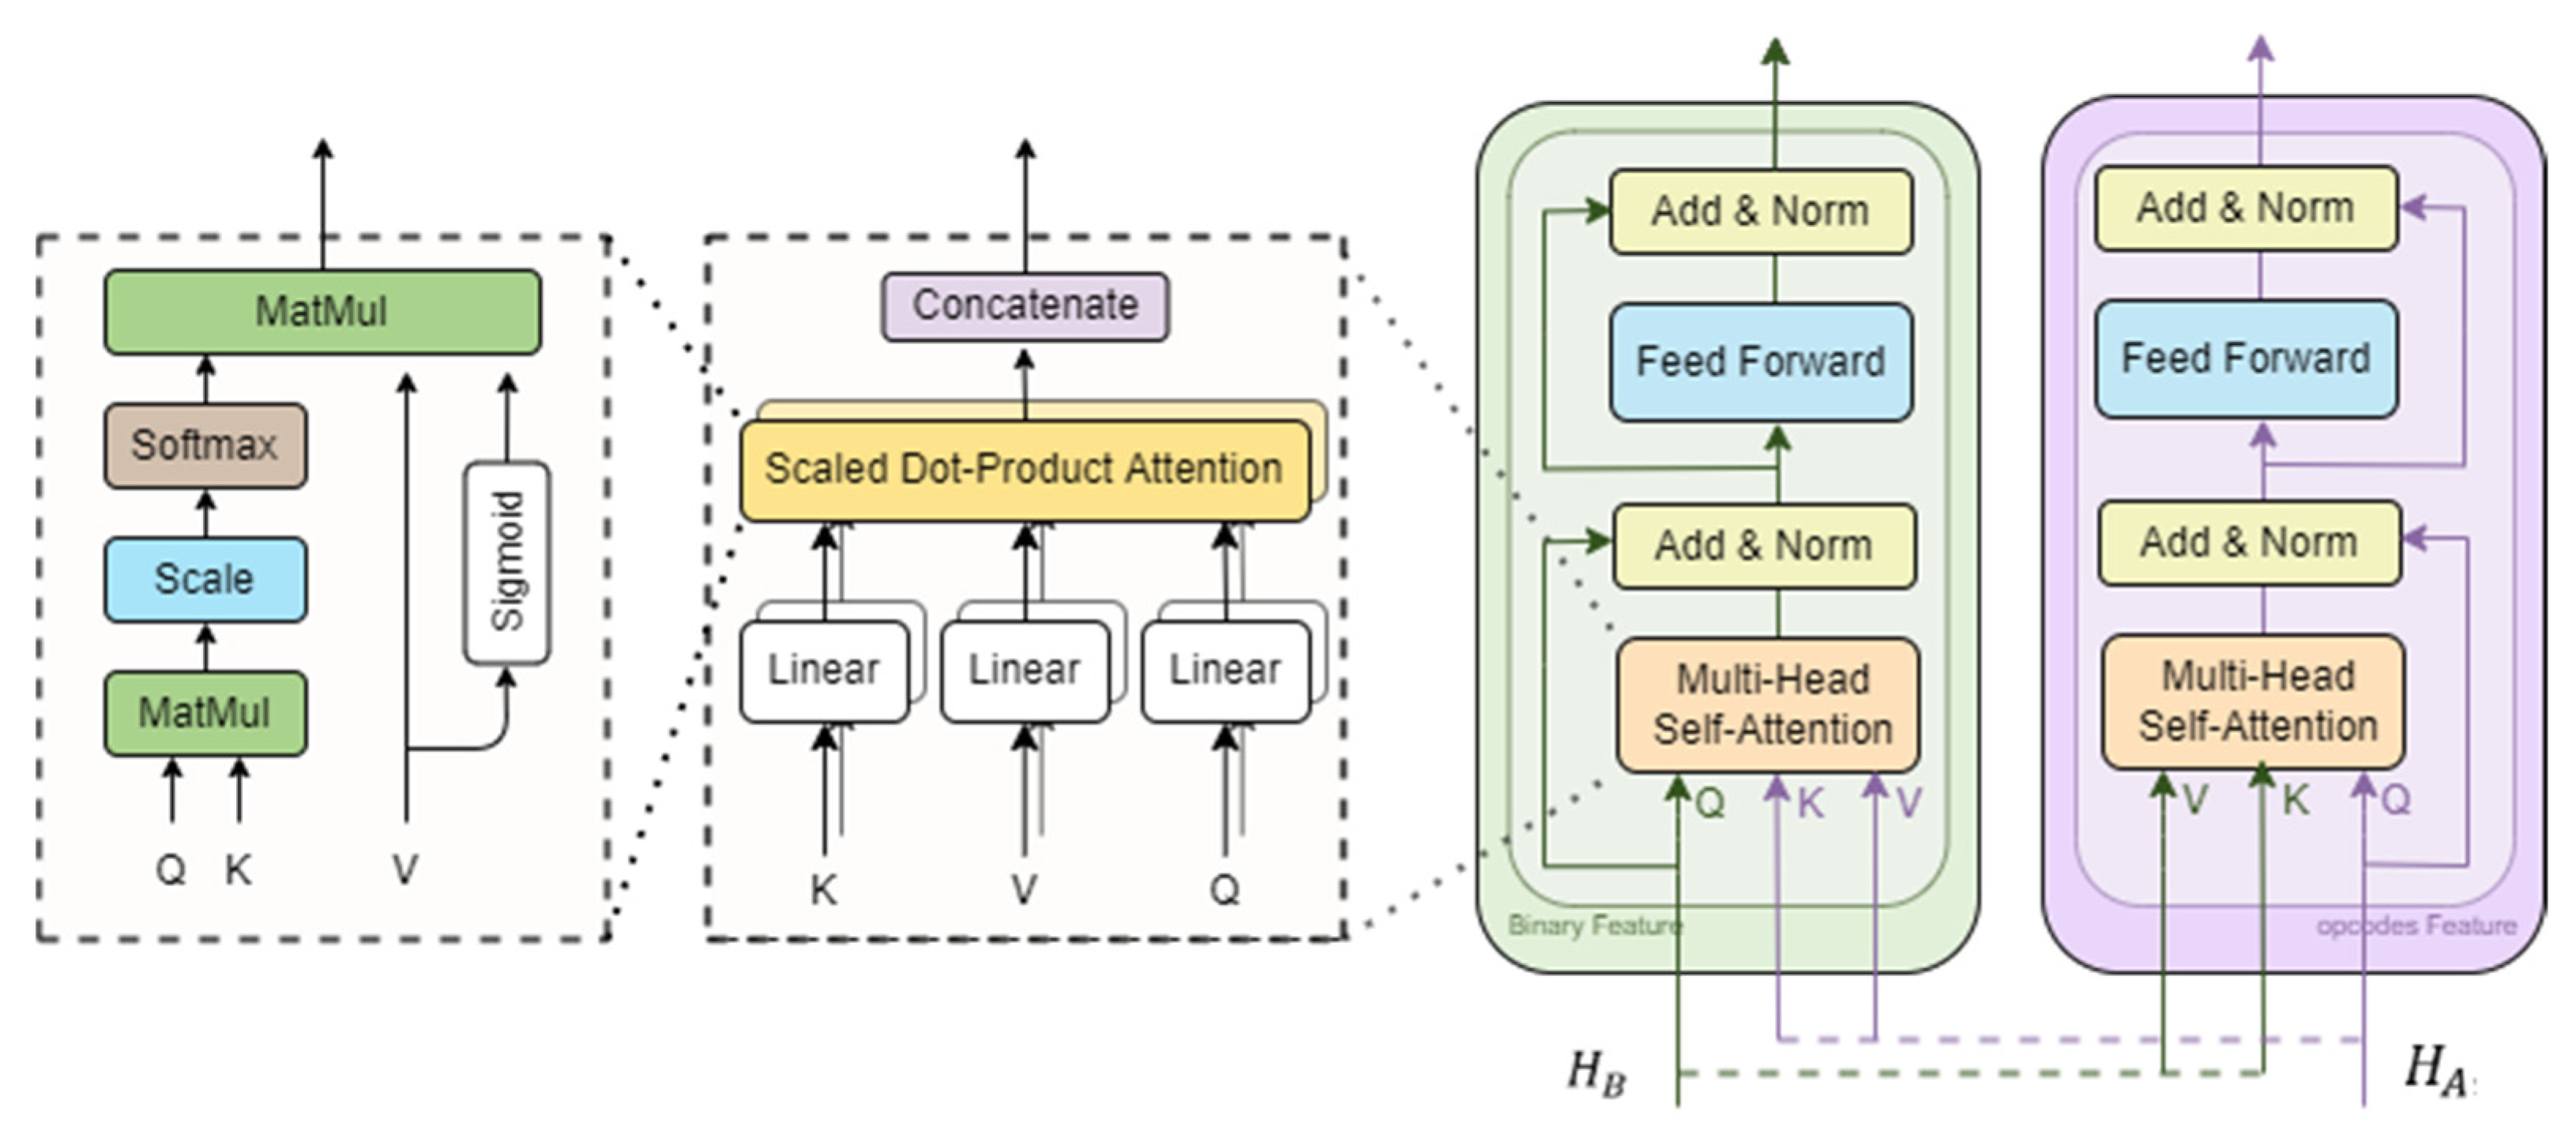
3.3. Multi-Feature Fusion Module

In order to effectively align and fuse multi features, we propose the following method: firstly, we further integrate the feature vector information using the gated self-attention module, and then use the cross-attention module to fuse the information. The definitions of relevant modules are as follows.

3.3.1. Gated Self-Attention for Further Information Representation

For the extracted features, similar to nature language processing tasks, we focused on the critical information for identifying malware, while ignoring the unimportant features, such as conventional function. By using the self-attention mechanism, the internal dependency is obtained by calculating the correlation value of the internal characteristics of the binary sequence (opcode block). Firstly, we calculated the correlation matrix of the input generated Query vector, Key vector, and Value vector, which can be defined by the following formula:
Q i = W Q X i
K i = W K X i
V i = W V X i
Then, we calculated the correlation between Query and Key and normalized the correlation score. At the same time, we added gated mechanism g to the output; g is generated by a sigmoid function, while d k is the scaling factor that prevents the inner product Q K T from becoming excessively large.
A i = a t t ( Q i , K i , V i ) = s o f t m a x ( Q i K i T d k ) · G i V i
To reduce the information loss in the transmission of training model, we used the residual structure. A small fully-connected network follows the attention module in our model, and both are encased with residual adds. This structure appears frequently in the attention module.

3.3.2. Cross-Attention for Fusion Features Representation

For calculating self-attention, we displayed the attentional distributions across value vectors after computing the dot-product similarity between queries and keys.
With reference to this idea, we altered the query-conditioned key-value attention mechanism to develop a multi-feature cross-attention module. We introduced the cross-attention module shown in Figure 4 to enable information exchange between the binary sequence and opcode blocks. Given intermediate representations H B and H A , as in a standard attention block, the module computed query, key, and value matrices. However, the keys and values from each input-feature were supplied as input to the attention block of the other input-feature. Then, the attention block produced weight-averaged value vector for each input-feature conditioned on the other. The rest of the module is the same as previously, with the exception of a residual add with the starting representations, which resulted in a multi-feature fusion.

3.4. Detection Model

Figure 5 shows the architecture of the multi-feature deep neural network for malware detection in our framework. The detection model includes three parts: BinaryOriEncoder, AsmGraphEncoder and BinaryAsmEncoder, which represent the binary feature extractor, opcode feature extractor and hybrid feature extractor respectively. The final network is a DNN to produce the classification results. We employed the Softmax function in the output layer to identify an input software’s harmful family. Our network is modified during the learning process to minimize the value of the loss function. The following is a description of the loss function:
J ( L , L ) = i = 1 n L ( i ) l o g L ( i ) + ( 1 L ( i ) ) log ( 1 L ( i ) )
Taking the sample with a length of 1,000 characters and number of code blocks of 20 as an example, the parameters used in each layer in the detection model are shown in Table 3.

4. Experiments and Result

In this section, we describe the experimental datasets, which includes a public dataset and a self-collected dataset. We also introduce the hyperparameter settings used for experiments. To thoroughly evaluate our model’s malware detection and classification capabilities, we compare our model with other deep learning methods.

4.1. Dataset

4.1.1. Kaggle Malware Classification Challenge

The Kaggle Malware Classification Challenge, referred to as Dataset A, is widely used to verify the performance of malware detection models. It contains Ramnit, Kelihos ver.3, and Simda and Kelihos ver.1. Vundo, Tracur and Gatak are Trojan horses; also included is the adware Lollipop and the combination malware Obfuscator.ACY. These malwares will cause malicious effects once they are executed on the computer. However, this dataset does not provide the original software; only the binary files and the assembly file disassembled by IDA Pro (remove the PE header) are given. Table 4 shows the number of malwares for each class. The train and test datasets total 9,000 and 1,726, respectively.

4.1.2. Malshare Dataset

Dataset A contains only well-known malware reported before 2015. To further assess our model’s ability to detect new malware, we collected Windows PE files uploaded by users on the Malshare website in the most recent five years (2017–2021). Referred to as Dataset B, this contained malicious and benign software, and they were all unpackaged. We uploaded the samples to the VirusTotal platform for labeling, where over 40 antivirus engines are used to determine whether the software is malicious or not. To avoid the influence of label flip (a flip refers to a change between two consecutive labels), the marking approach described in Yang [33] was utilized, in which the same sample was tested for three consecutive days. In our dataset, software with more than eight harmful votes were classified as malware, while those with zero votes were classified as benign. We give the authoritative engines double voting weight, including Kaspersky, Symantec, AVG, Ikarus and McAfee. We labeled 27,487 malicious samples and 6,939 benign samples, and divided this dataset into four categories: Emotet, Trojan, Other malware, and Benign. Its distribution is shown in Table 5.

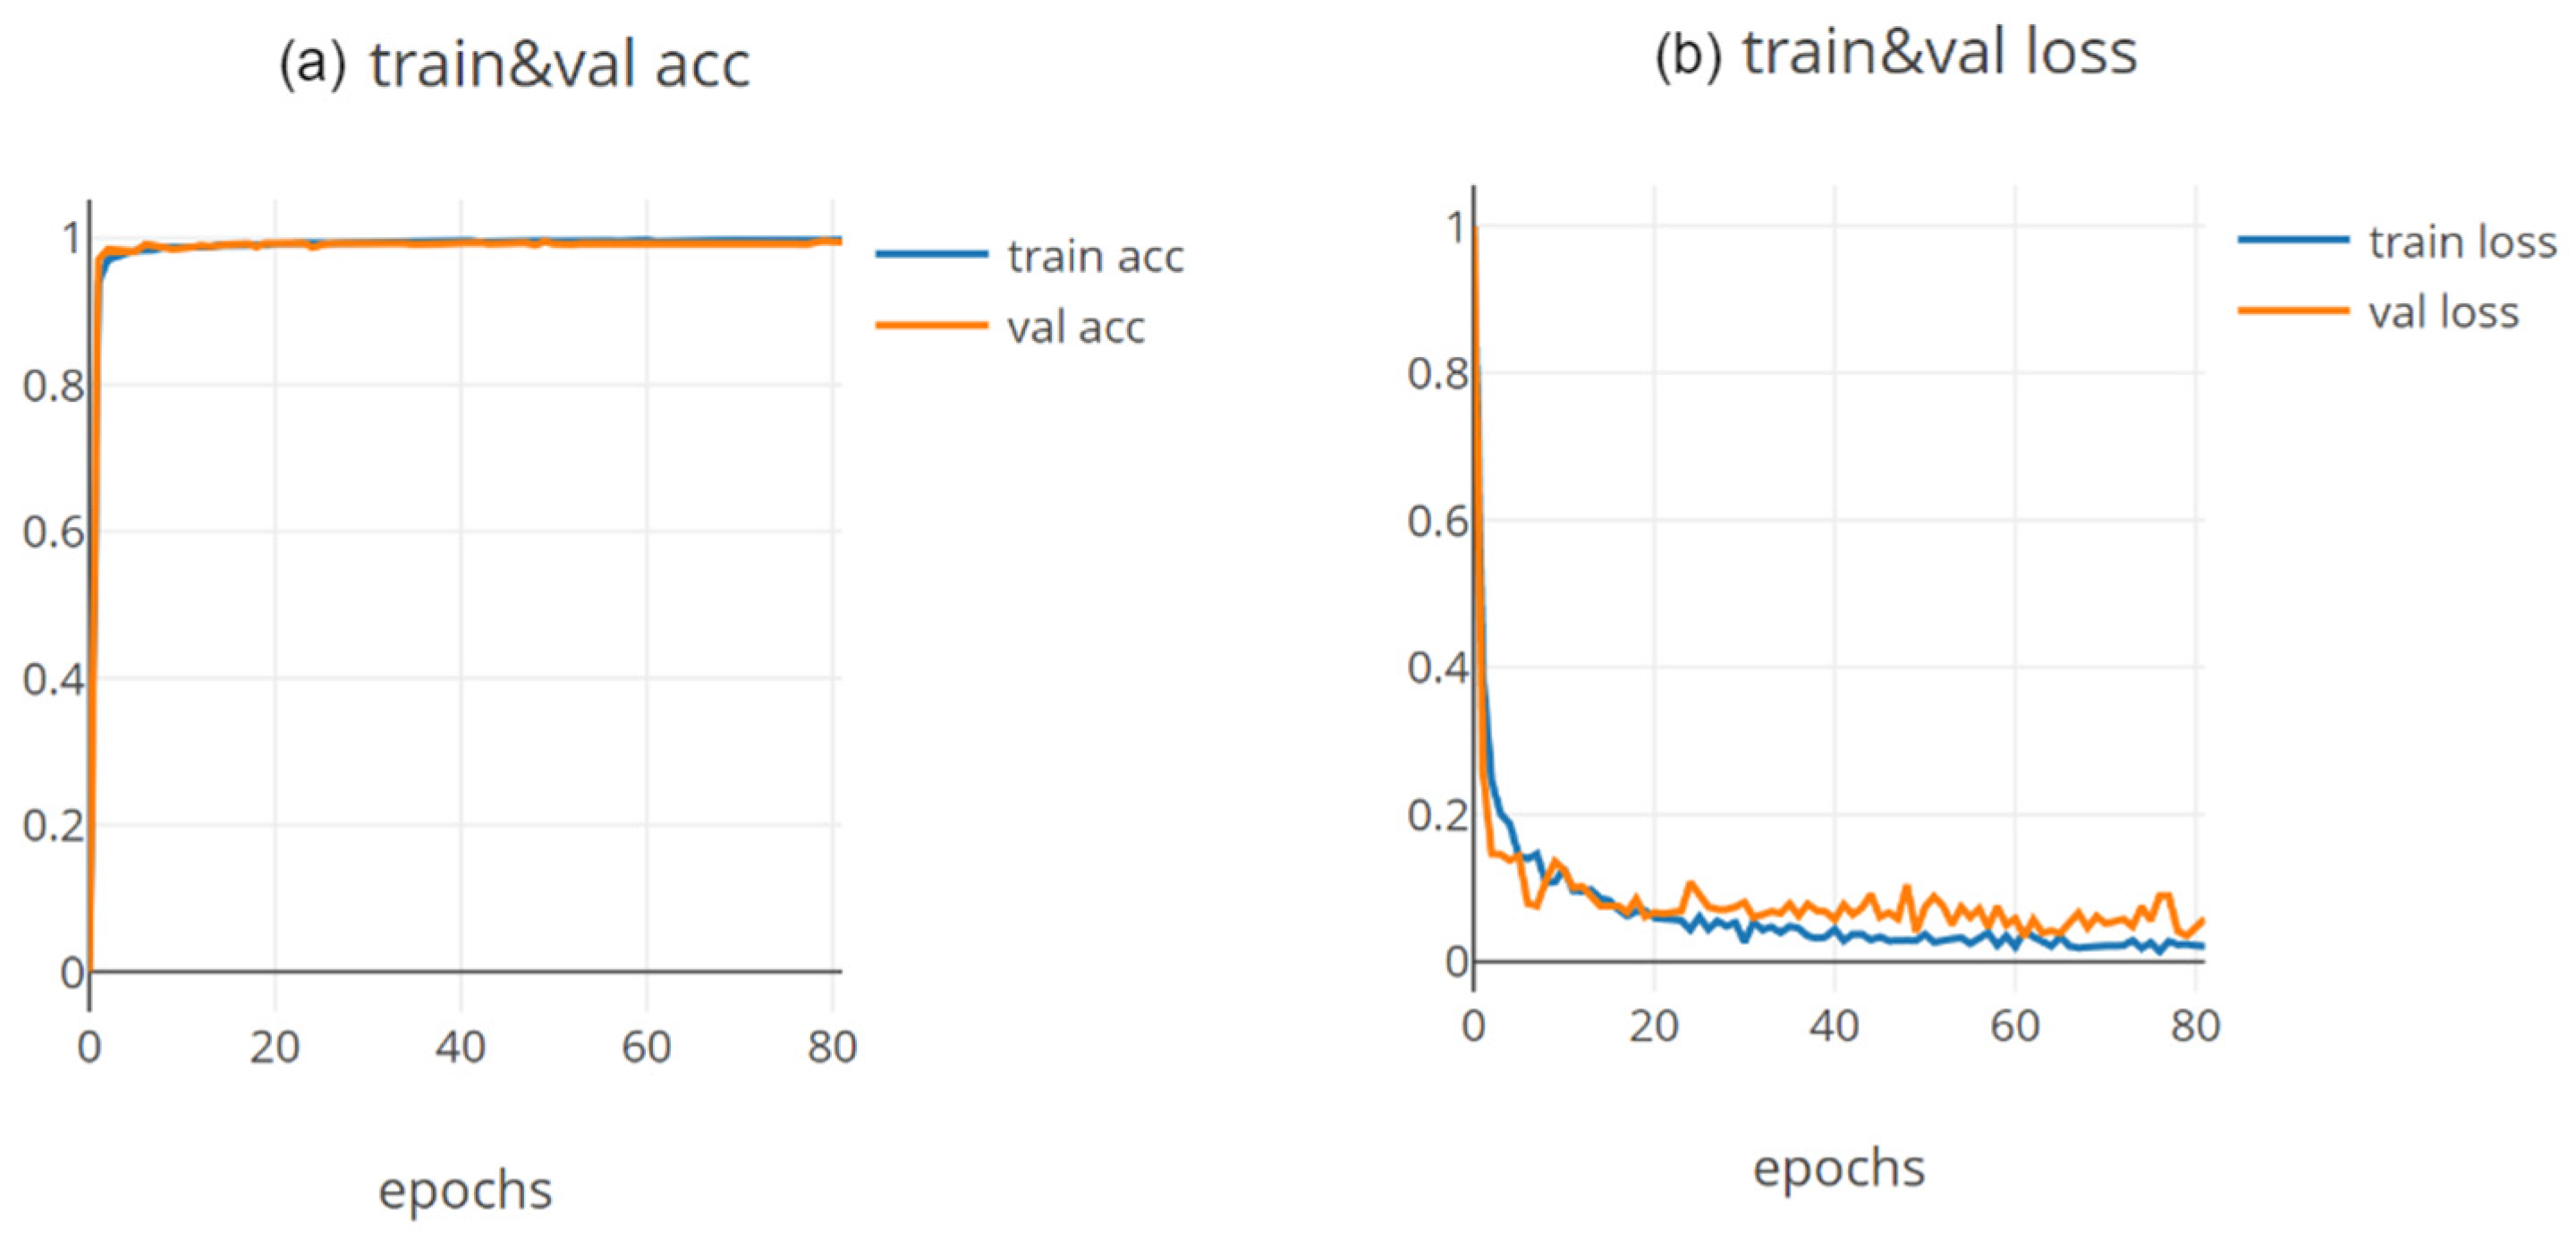
4.2. Experiment Settings

We randomly divided the dataset into training data and validation data in a ratio of 8:2. The validation data was used to test the convergence of the model and select the best hyperparameters. All the models were trained with Adam optimizer. We adoptrf EarlyStopping during model training to ensure that the training was terminated before the model reached its extreme fit, and we saved the model parameters every ten epochs to facilitate model optimization and subsequent testing.

4.3. Evaluation Metrics

To evaluate the performance of our model in predicting malware families, we used evaluation indicators that are similar to those used in previous research. Specifically, for each category L i , we assessed a work’s performance with the following four metrics:
Precision (P): measures among all the samples labeled as “ L i ” by the model, how many of them actually belong to that class.
P i = # s a m p l e s   o f   L i T o t a l   #   s a m p l e s   o f   m o d e l   l a b e l e d   a s   L i  
Recall (Re): measures among all samples belonging to L i , how many of them are labels by the technique as L i .
R e i = #   o f   m o d e l   l a b e l e d   a s   L i T o t a l   #   s a m p l e s   o f   L i
F1 score (F1): The harmonic mean of recall and precision.
F = ( α 2 + 1 ) P * R α 2 ( P + R )
F 1 l = 2 * P l * R l P l + R l
Accuracy (Acc): The percentage of all categories that are correct.
A c c = T o t a l   # s a m p l e s   l a b e l e d   a s   Li   a n d   b e l o n g i n g   t o   L i   T o t a l   s a m p l e s

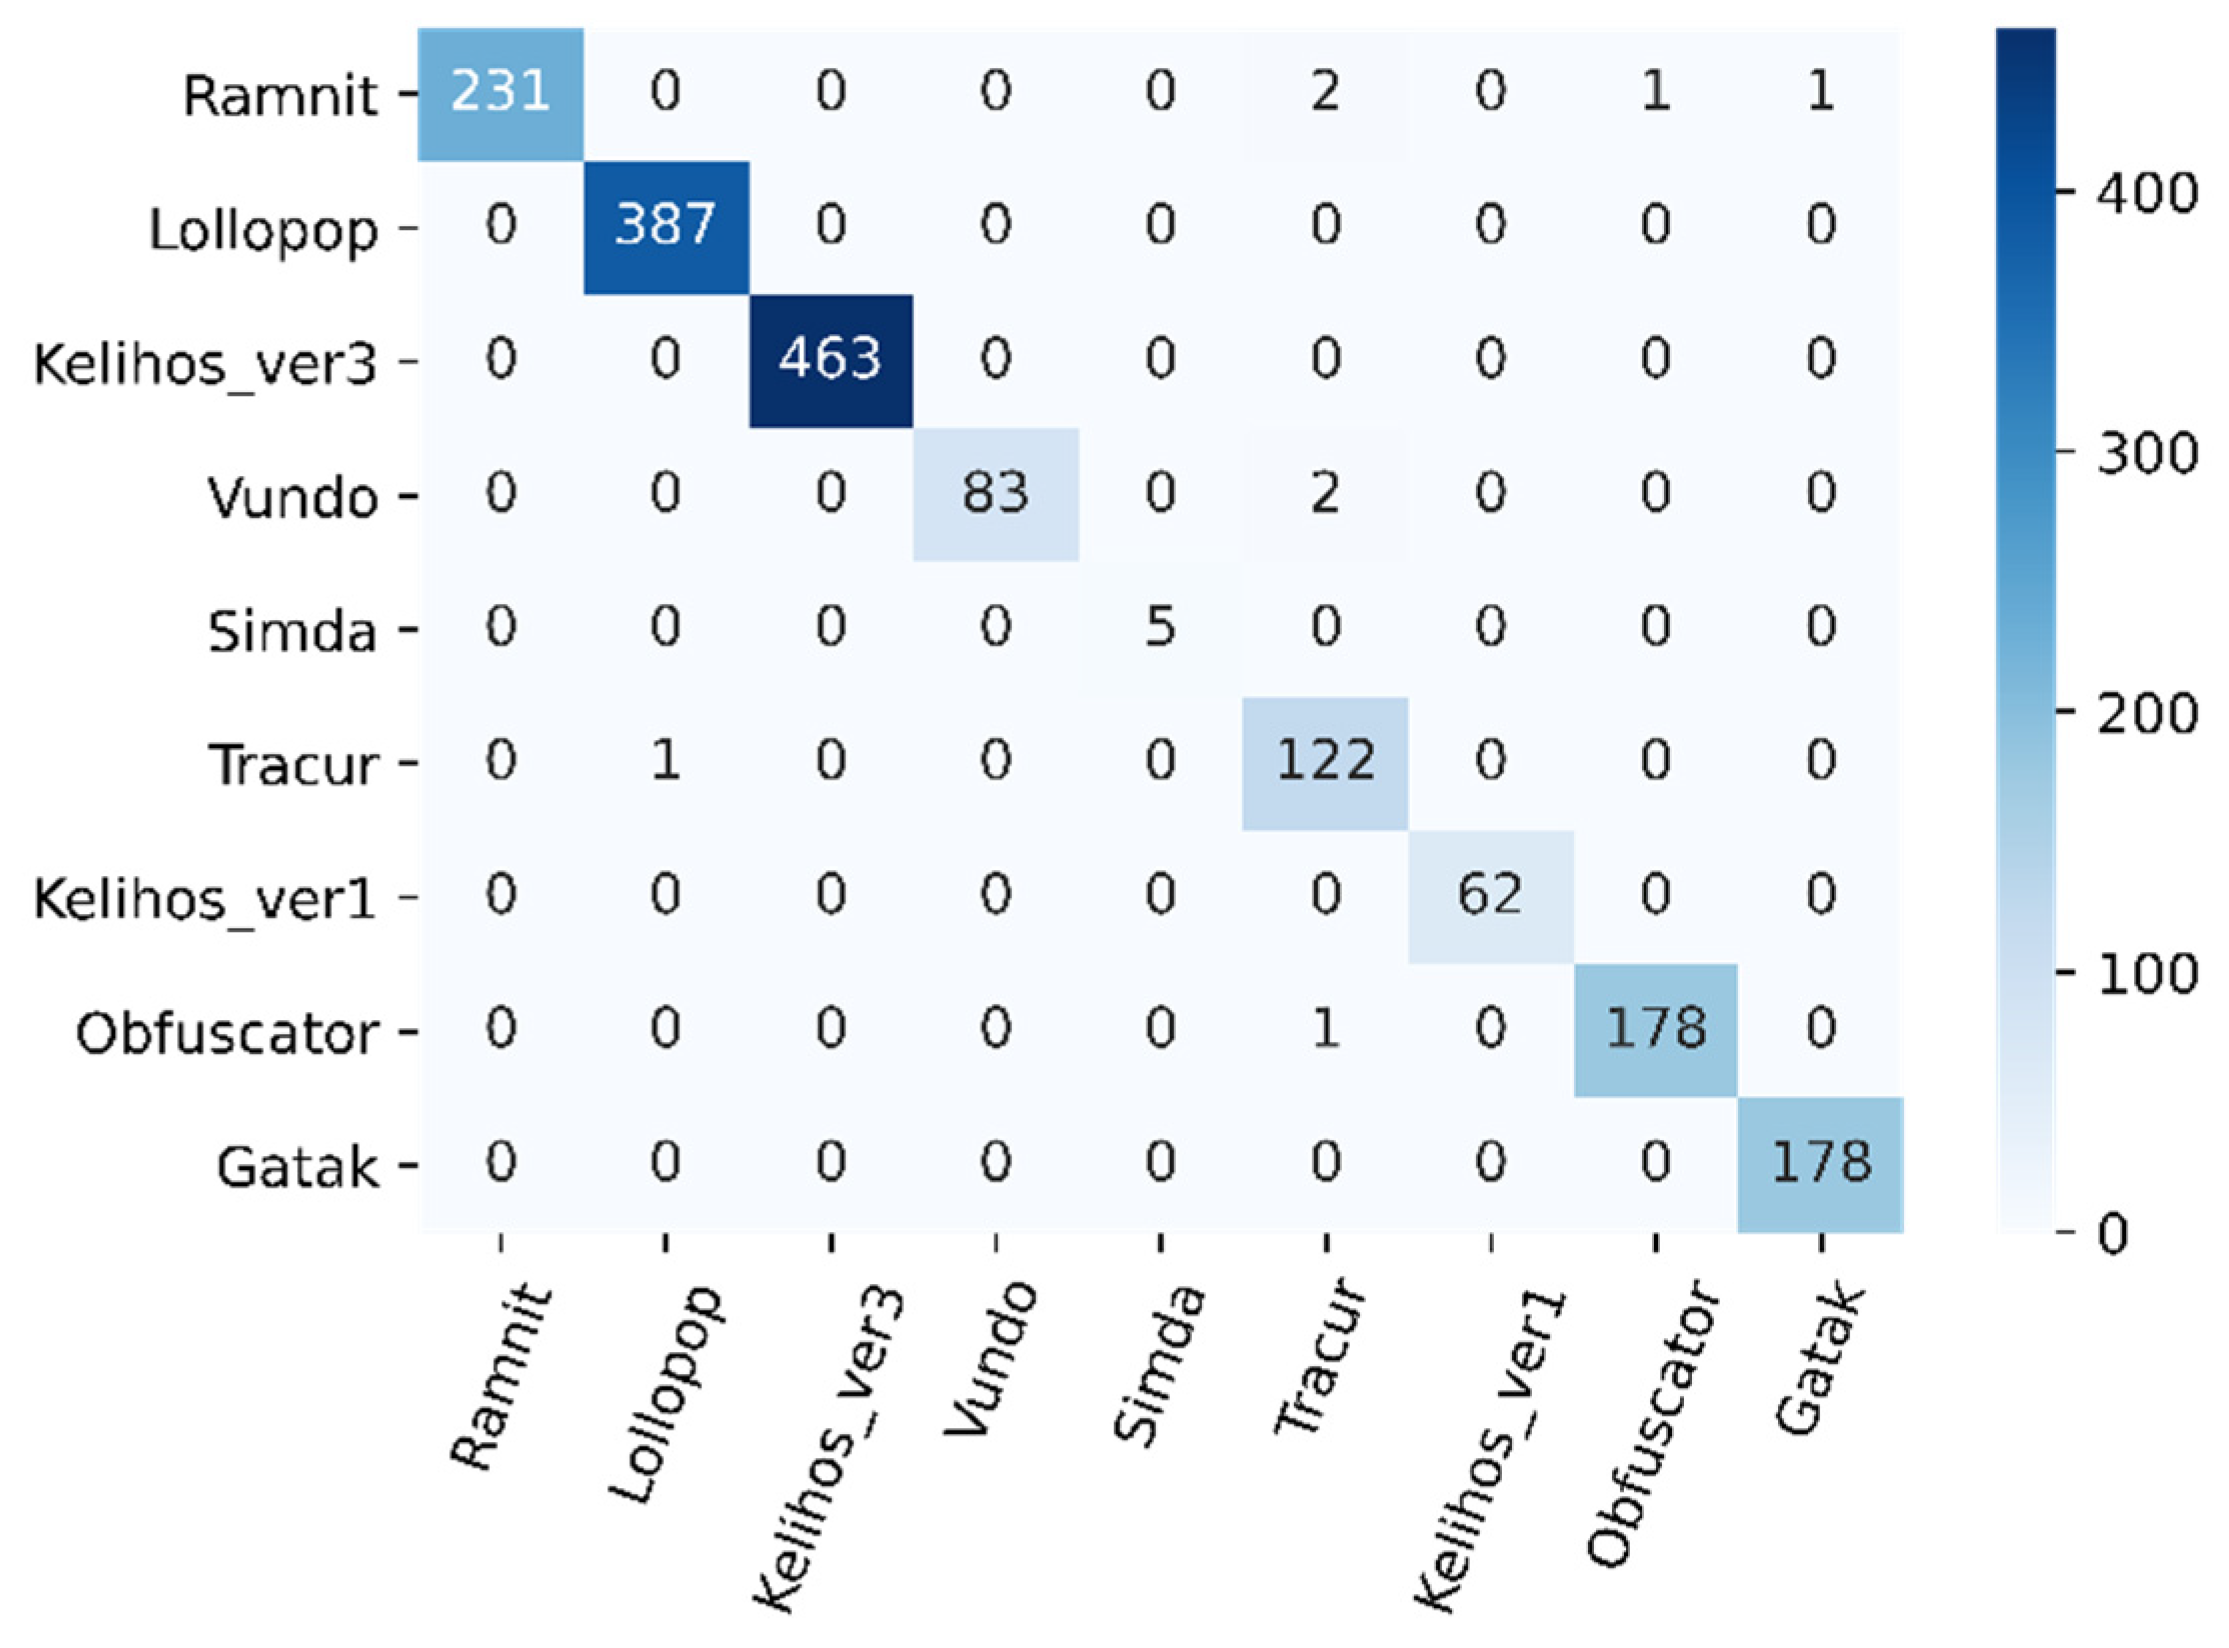
4.4. Malware Family Classification

In this section, we take Dataset A as the comparison basis and benchmark the efficiency of the proposed method with existing relevant approaches. Firstly, we chose the model which was widely acknowledged and utilized as the foundation for numerous subsequent investigations in the field. Then, we chose two gray-image-based approaches which received the most attention in malware detection. Finally, we compared our method to the research that adopts multi-feature fusion.
In Table 6, we compare the performance of our model with six existing methods on Dataset A. The MalConv [8] is the first one which used the entire binary sequence for training. However, this method used only one type of feature. Our model draws on this idea and makes improvements, mainly reflected in effectively fusing the binary sequence features extracted from CNN with opcode features. It outperforms MalConv by 3% in accuracy and 10% in recall. The high recall performance demonstrates our model could effectively reduce false negatives, which is important in malware detection. As for the other five malware detection methods, since the author does not reveal the model’s source code, the indicators given in their papers are mainly used as the comparison basis. The DenseNet-based [34] model and the Vision-based [35] model transformed the binary file into gray images and then used a neural network model to extract the features of images, achieving 98.46% and 97.2% accuracy, respectively. The Deep Generative [25] model converted the binary files into images and sequences simultaneously. It used CNN to extract local features while using LSTM to extract extended sequence features, achieving an accuracy of 97.47%. The Deep Neural Network [36] used features similar to our method and achieved an accuracy of 98.31%. The feature extraction process of our method is mainly automatically extracted by the model without manual intervention. The accuracy of the experimental result is 99.54%, which is superior to the evaluation matrix of other models. Figure 6 shows our method’s confusion matrix, and Figure 7 displays the epoch curves of loss and accuracy for training and validation data.
In terms of time cost, it spent about 38 min per epoch when training the model and reached convergence in about 40 epochs. During the model test, a total of 1,726 pieces of data were tested, and the test time remained at about 400 s. To summarize, the training model took around 25 h to complete, and the detection of one piece of data took 0.23 s.

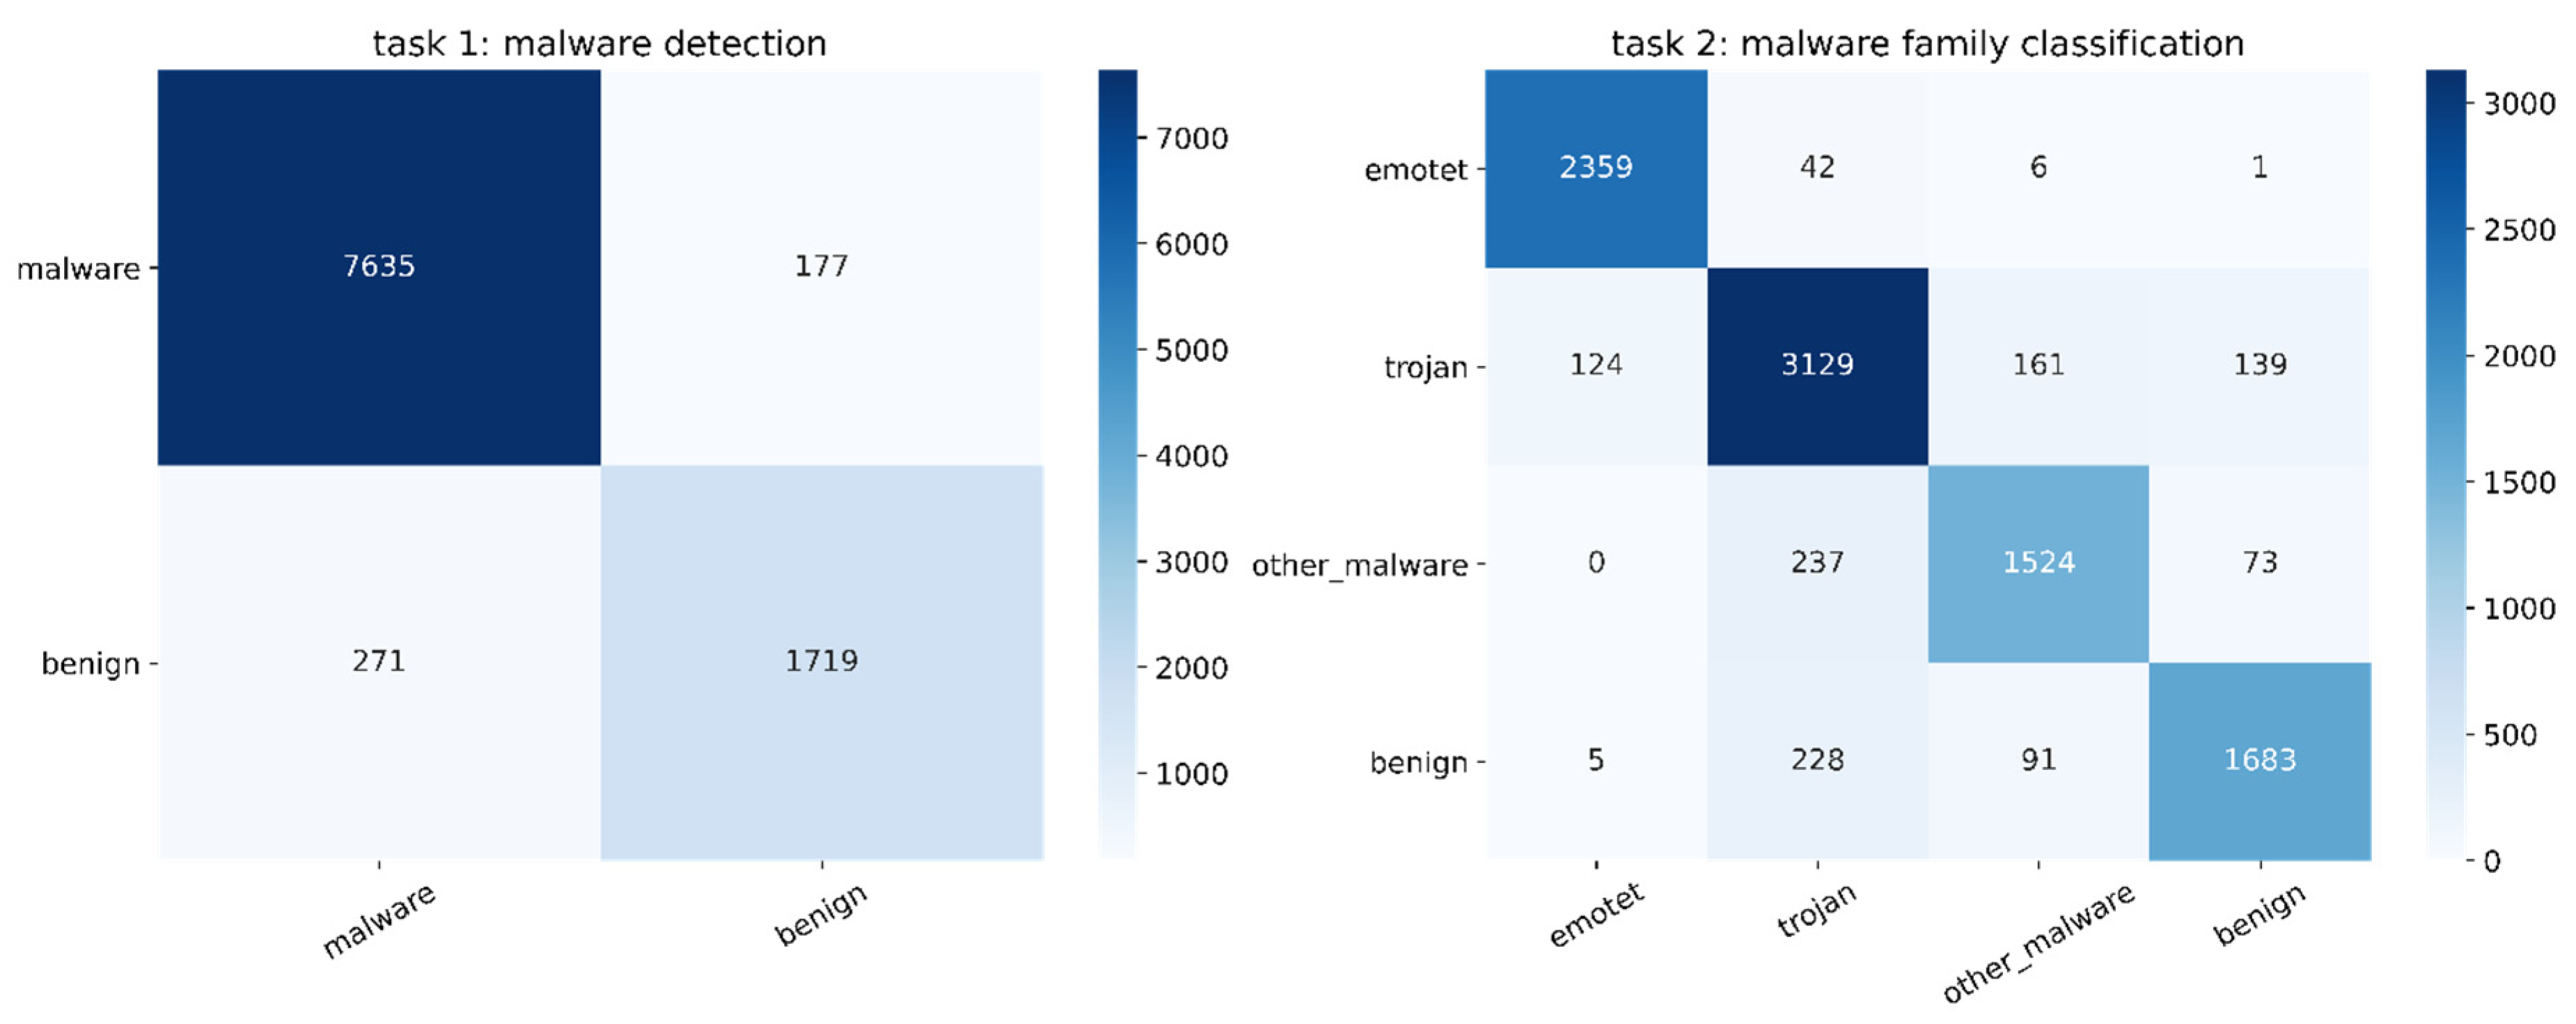
4.5. Detected Malware from Malshare Website

In this section, we compare our model with Malconv and its optimized models on Dataset B to further verify the capability of our model for detecting new malware in the public domain. We compare the models on the following two tasks:
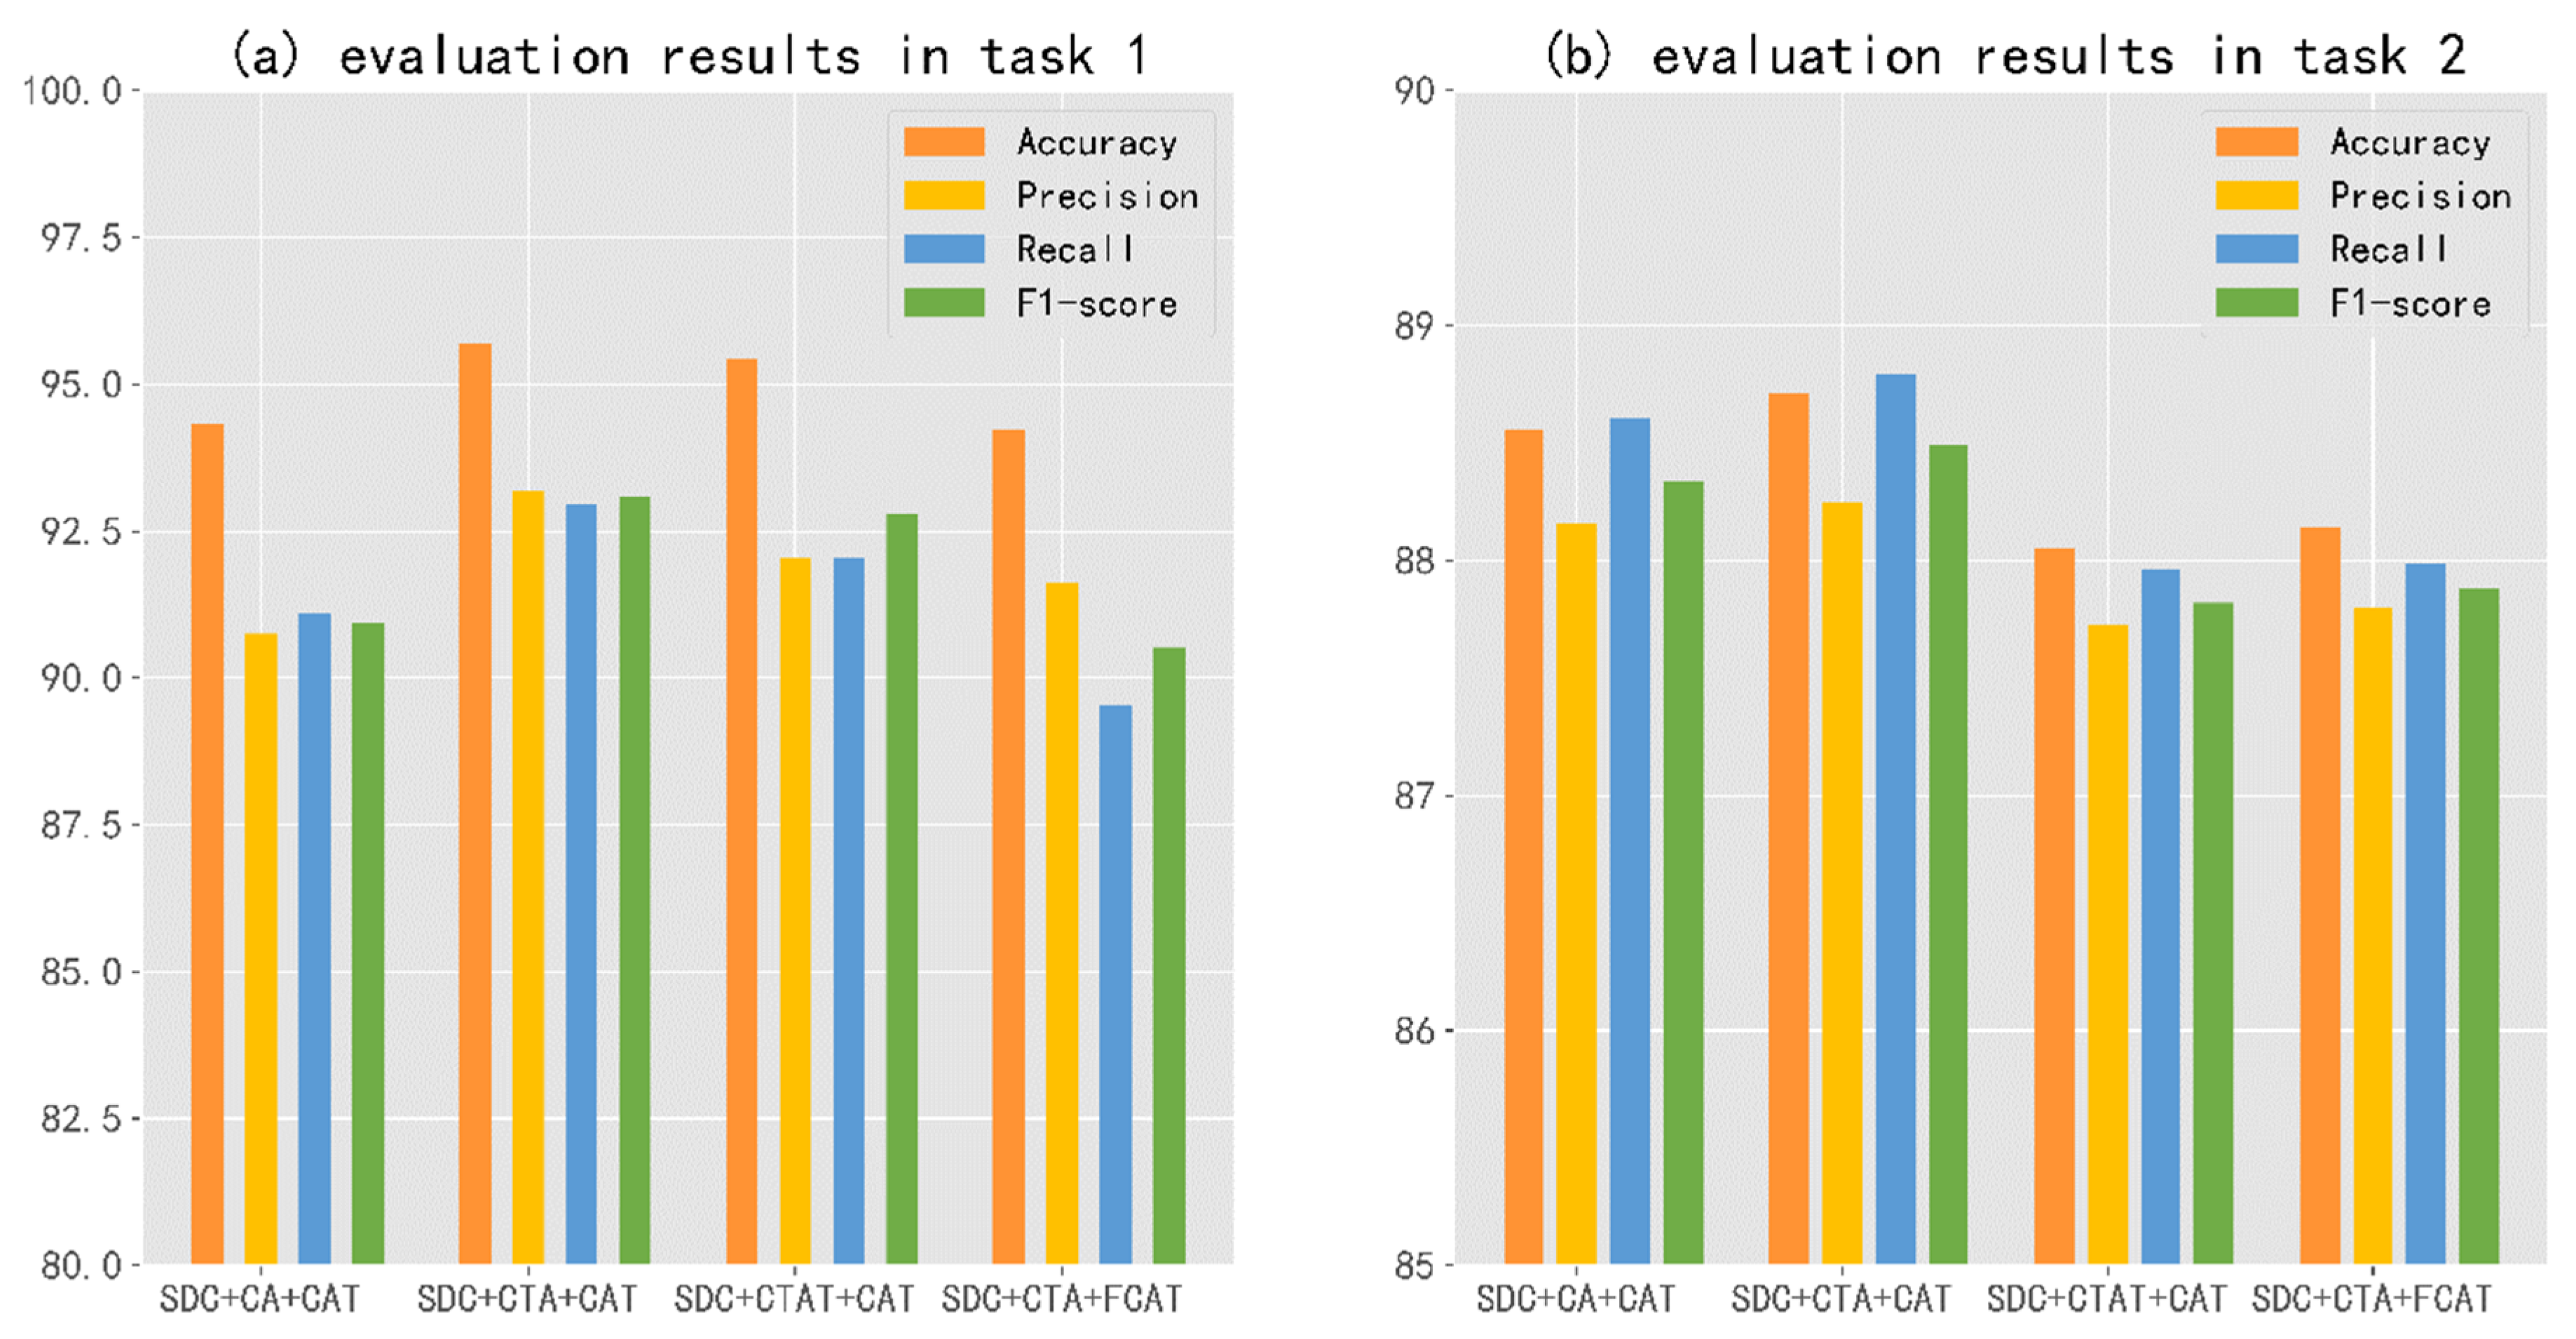
  • Task 1: Identify whether the samples are malware or benign
  • Task 2: Identify the family of malware to which the samples belong
The significance of detecting whether the sample is malware or not is to respond to malicious behavior quickly. Table 7 compares the proposed technique to baseline models, and Figure 8 depicts the confusion matrix. In task 1, our model had an accuracy of 95.44%, a precision of 92.06%, a recall of 93.62%, and a recall of 92.81%. In task 2, an accuracy rate of 88.71%, a precision rate of 88.25%, recall of 88.79% and an F1-score of 88.49% were achieved, which demonstrates that our proposed method significantly outperforms these deep learning baselines.

5. Discussion

In this section, we discuss related details of model construction and optimization. Our model mainly handles three kinds of modules: binary feature extractor, opcode feature extractor, and fusion module. To analyze each module’s extraordinary contribution, we altered each module of the model design and then assessed the effectiveness of the remaining model. Dataset A and Dataset B were used as the benchmark dataset for all the sub-sections. Eight models were built to optimize the structure of the model. We additionally performed case studies to illustrate the attention patterns to prove the effectiveness of the extracted features.

5.1. Ablation Studies

We explored and compared the performance of different modules in our model. The ablation experiments were performed from three aspects: binary file feature extraction module, opcode feature extraction module and multi-feature fusion module. We first introduce the alternative module used for comparison and explain why it is chosen for comparison. Then their relative performance is outlined.
1.
Binary file feature extractor
We kept other structures and solely tweaked the binary feature extractor to investigate the performance of different feature extractors for binary sequences. Considering that each character’s range in the binary sequence is between 0 and 255, which conforms to the value range of pixels, we first converted the binary sequence into grayscale according to this rule. The image feature extraction method refers to the VIT model [37], which segments and realigns the image and then inputs it into the transformer’s encoder layer for further extraction. We called this module imgVIT and compared it with our stacked convolution (SDC) feature extraction module proposed in this work.
2.
Opcode block feature extractor
Technically, the convolution network captures the local information surrounding a certain point, and the attention mechanism obtains the interdependence between information from a global perspective. As a comparison, the triangular attention introduced in Section 3.2.3 had a different emphasis from the standard attention. The standard attention regards a code block as a whole and focuses on capturing the correlation between different code blocks in the program, while the triangular attention also considers the relationship among multiple code blocks to extract the code-level features of assembly files from a deeper perspective. In general, we tried three opcode feature extraction methods: convolution + self-attention (CA), convolution + triangular attention (CTA), and convolution + triangular attention + transposed convolution (CTAT).
3.
Multi-feature fusion method
We extracted two types of features from the sample software and then compared different fusion strategies. Direct addition (Add) is the simplest and easiest feature fusion method. However, considering there is no equivalent structure between the assembly file and the binary file, the underlying behavior patterns would not always be aligned in the two added vectors. We therefore used cross-attention to align features as introduced in Section 3.3.2 in the initial experiment, and took it as the core module. We compared these two strategies: feature fusion after feature extraction (CAT), and feature fusion for the extracted feature through each layer (FCAT).
4.
Single feature method
In order to compare the difference between the method of fusing multi-features and the method of using only a single feature, we built models with binary sequences and opcodes respectively. We chose the stacked double one-dimensional convolution method and the triangular attention algorithm proposed in this paper as the feature extraction strategies and used the multilayer perceptron (MLP) as the classification method.
5.
Comparison experiments
Eight models were built based on different combinations of the above modules, which were trained and tested on both Dataset A and Dataset B. Here, a progressive model-building procedure was adopted, meaning that for each module the method with the best performance would be retained for the following model construction. Table 8 shows the results of the different models trained on Dataset A.
Model 1 directly added the features extracted from ImgVIT and CA, while model 2 adopted the cross-attention module to replace the feature fusion method in model 1, which improved the accuracy. In model 3, we replaced grayscale features with binary sequences and input the whole binary file into the feature extractor to obtain the original information of the file to a greater extent. We find that the alternative use of the SDC could improve the model performance. Based on model 3, models 4 and 5 replaced the opcode feature extractor with CTA and CTAT, respectively. From the results, the effect of the CTA module was equivalent to that of the CA module, while the effect of the CTAT module was even slightly decreased. However, this might have been induced by the dataset size, which we will explain in the following experiments. Referring to these results, the feature representation after the cross-attention module could perform better. Model 6 implemented the idea of feature fusion throughout the whole model. However, it was not the most optimal model when compared with model 4, which implied separating feature extraction and feature fusion is better than mixing these two operations. Model 7 and model 8 were built with binary sequences and opcodes, respectively. According to the results, the model trained with binary sequences performs better than the model trained with opcodes, but the results of both models were not as good as that of the feature fusion model. It is concluded that the multi-feature model can synthesize the key information of the two types of features and improve the representation ability of the fused features.
Considering that the latter four models have significantly better performance than models 1 and 2, we conducted malware detection and malicious family identification experiments on Dataset B for these four models. The experimental results are shown in Figure 9.
For both two tasks on Dataset B, model 4 shows the best performance, which proves that the triangular attention module used in model 4 is effective in extracting opcode features and can perform well on larger datasets. Based on the results of Table 8 and Figure 9, we draw the following conclusions. The binary features extracted by the stacked convolution network are more representative than those extracted based on visual processing technology; using convolution + self-attention module and triangular attention module to extract opcode features is not obviously different, but the triangular attention module could perform better when on a large dataset. In addition, the cross-attention module significantly improves the characterization ability of the fusion features. From the above experiments, we illustrate the model construction process in this paper and prove the superiority of the final selected model.

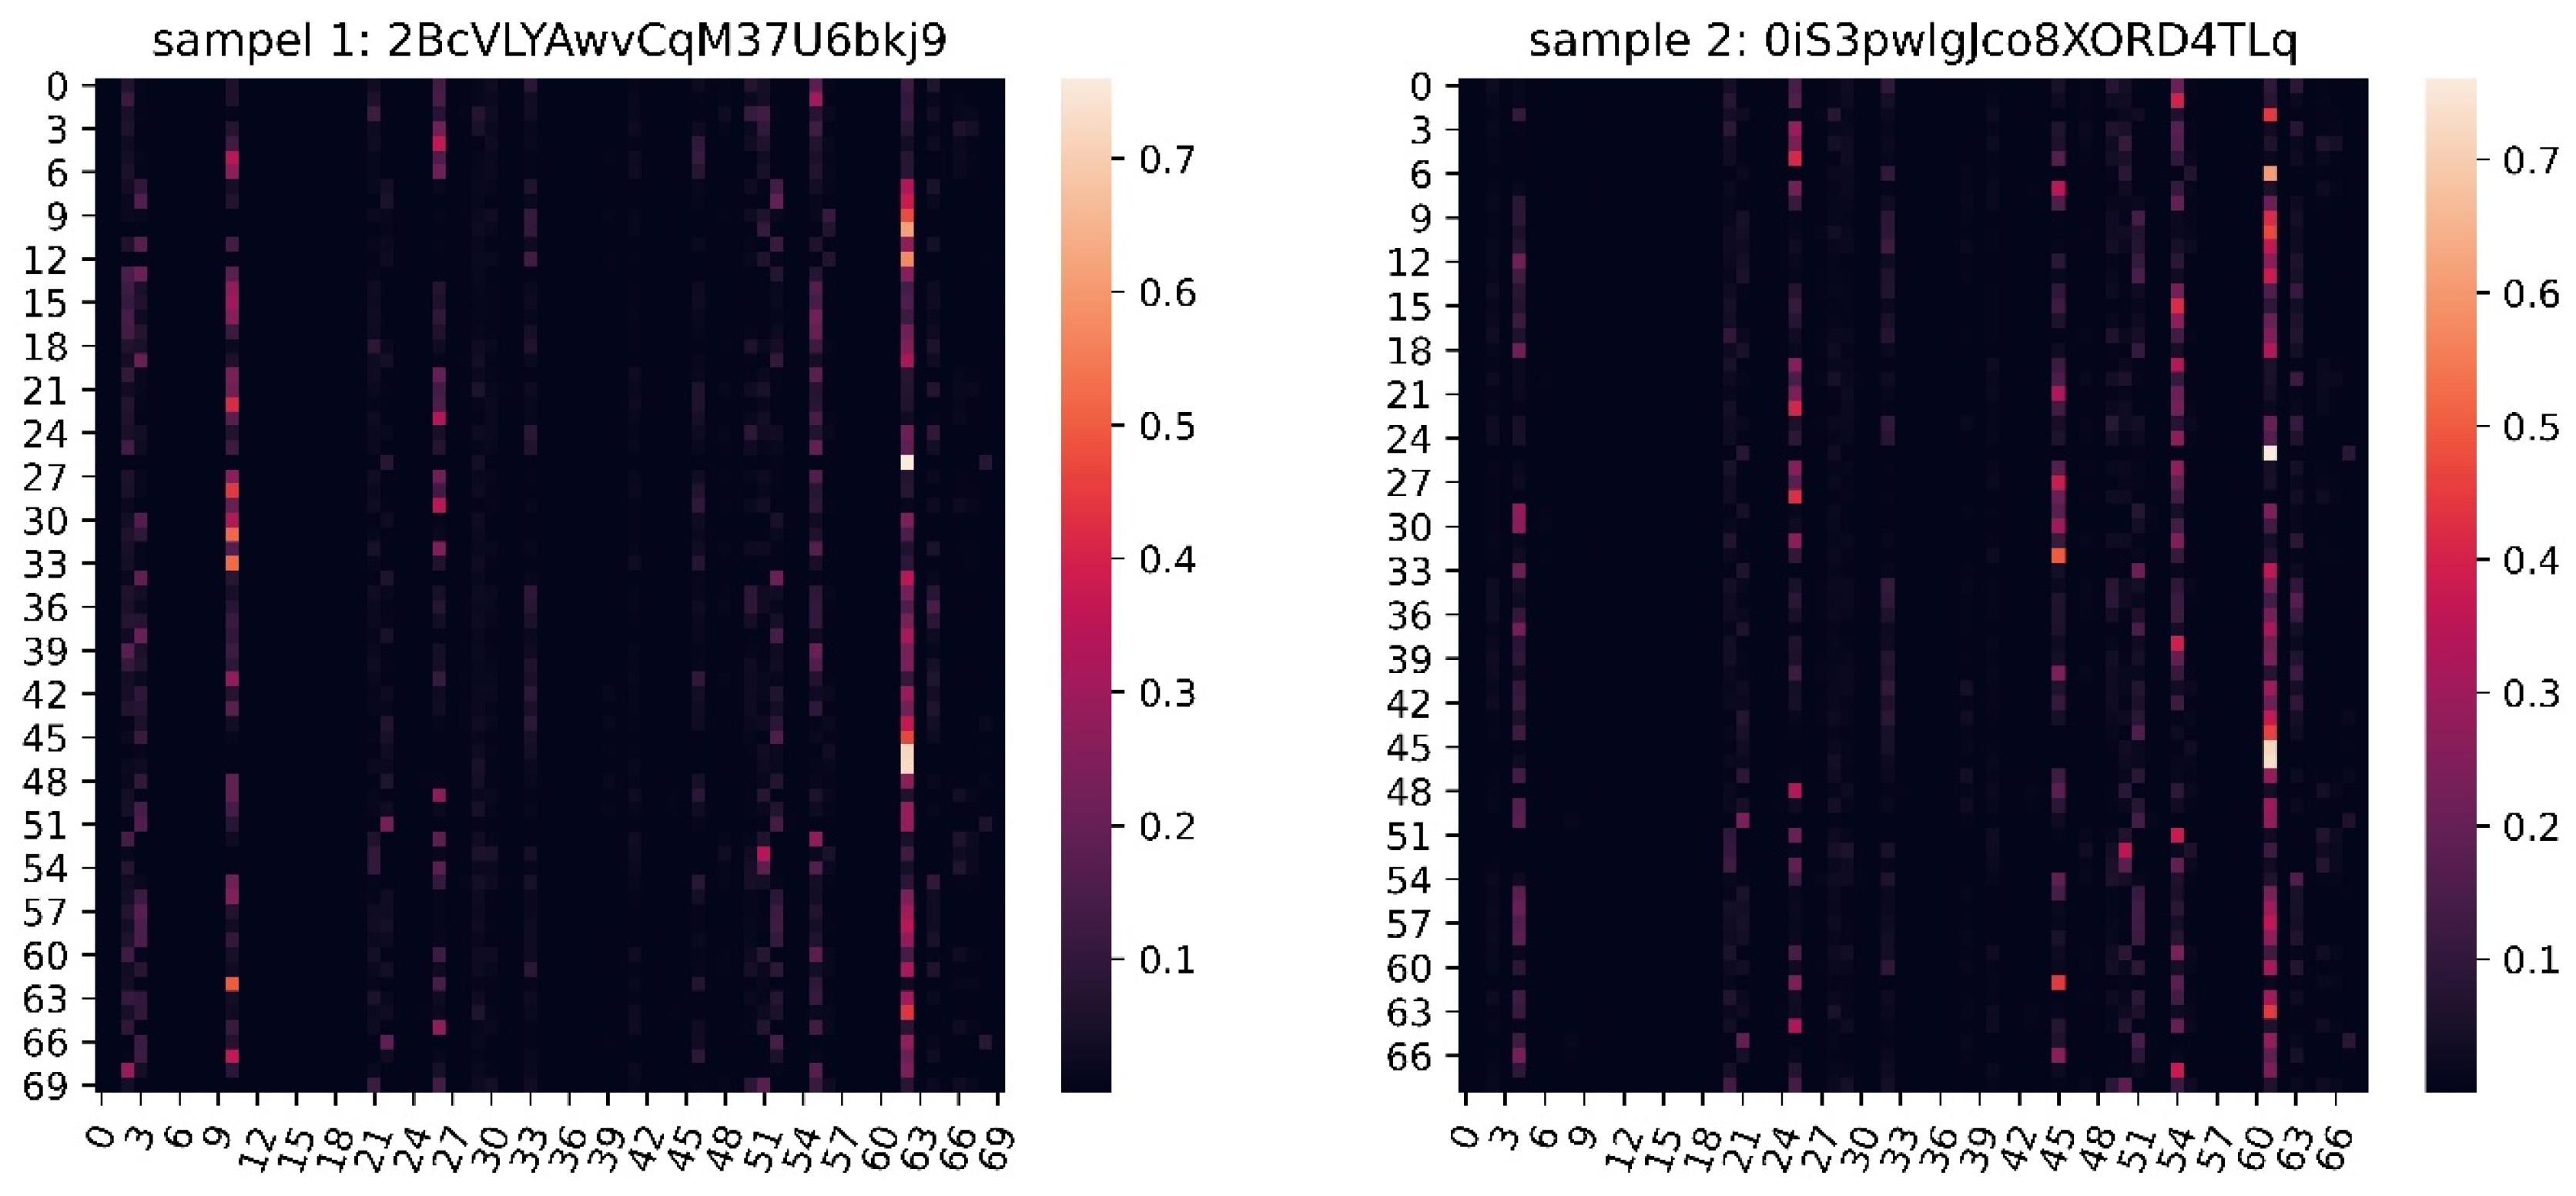
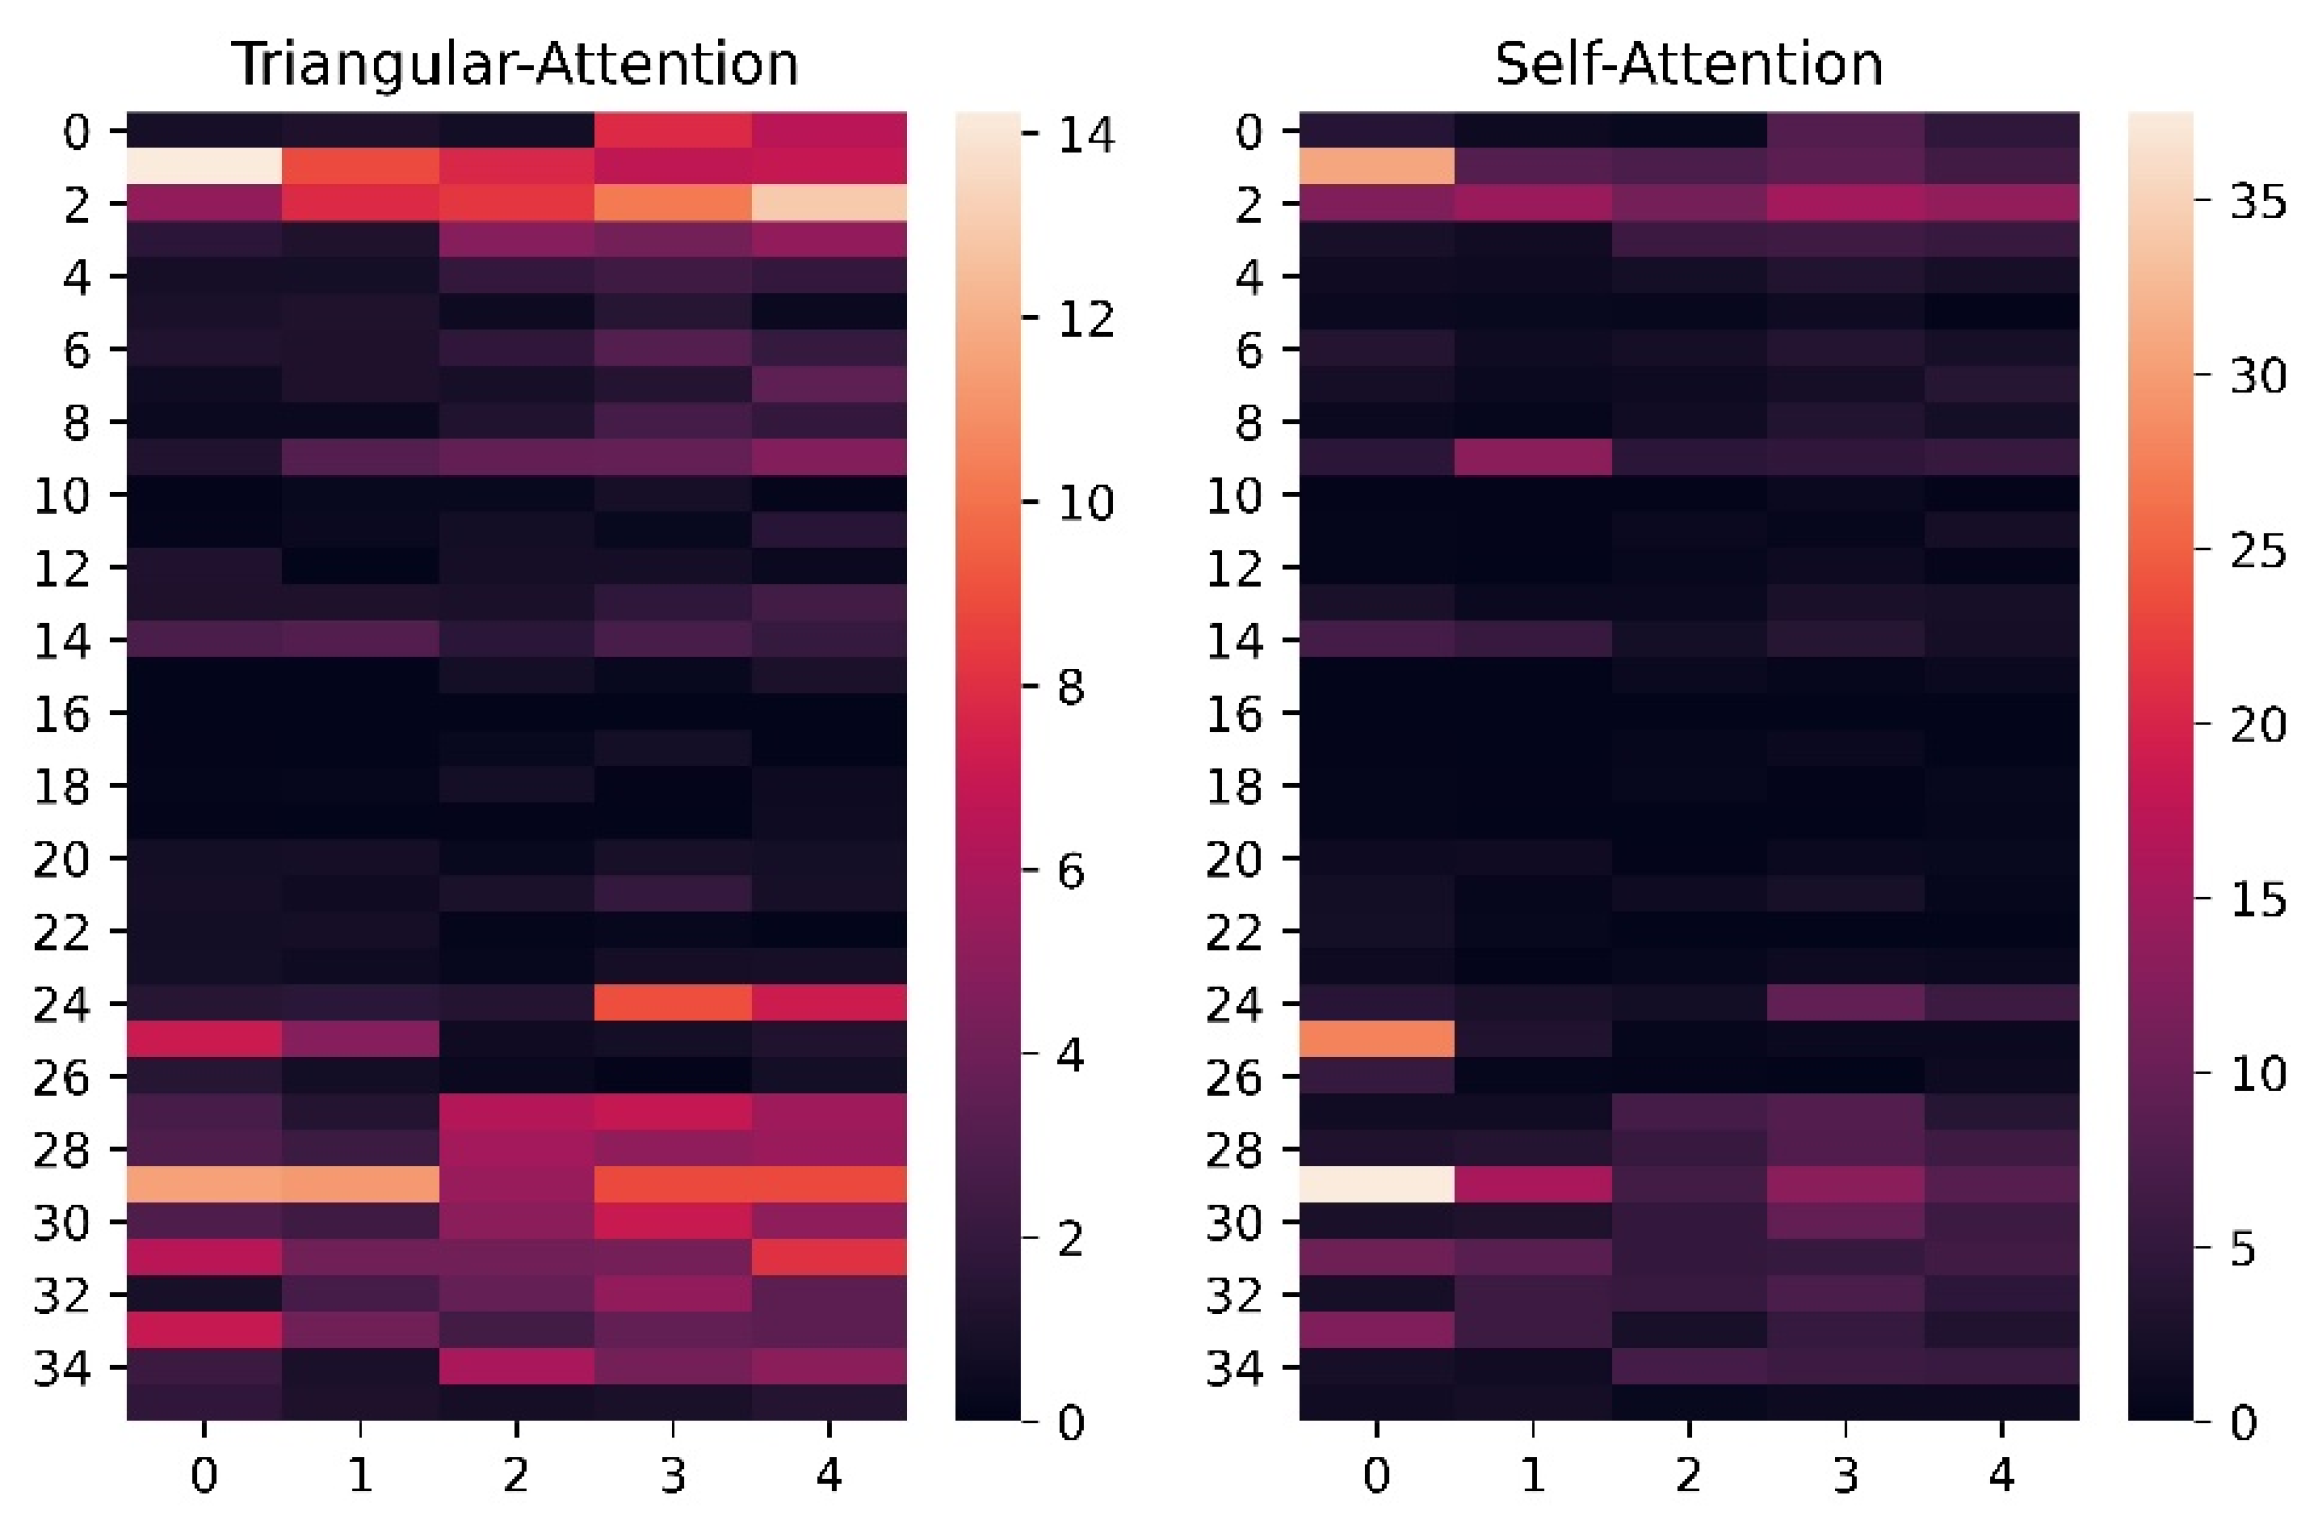
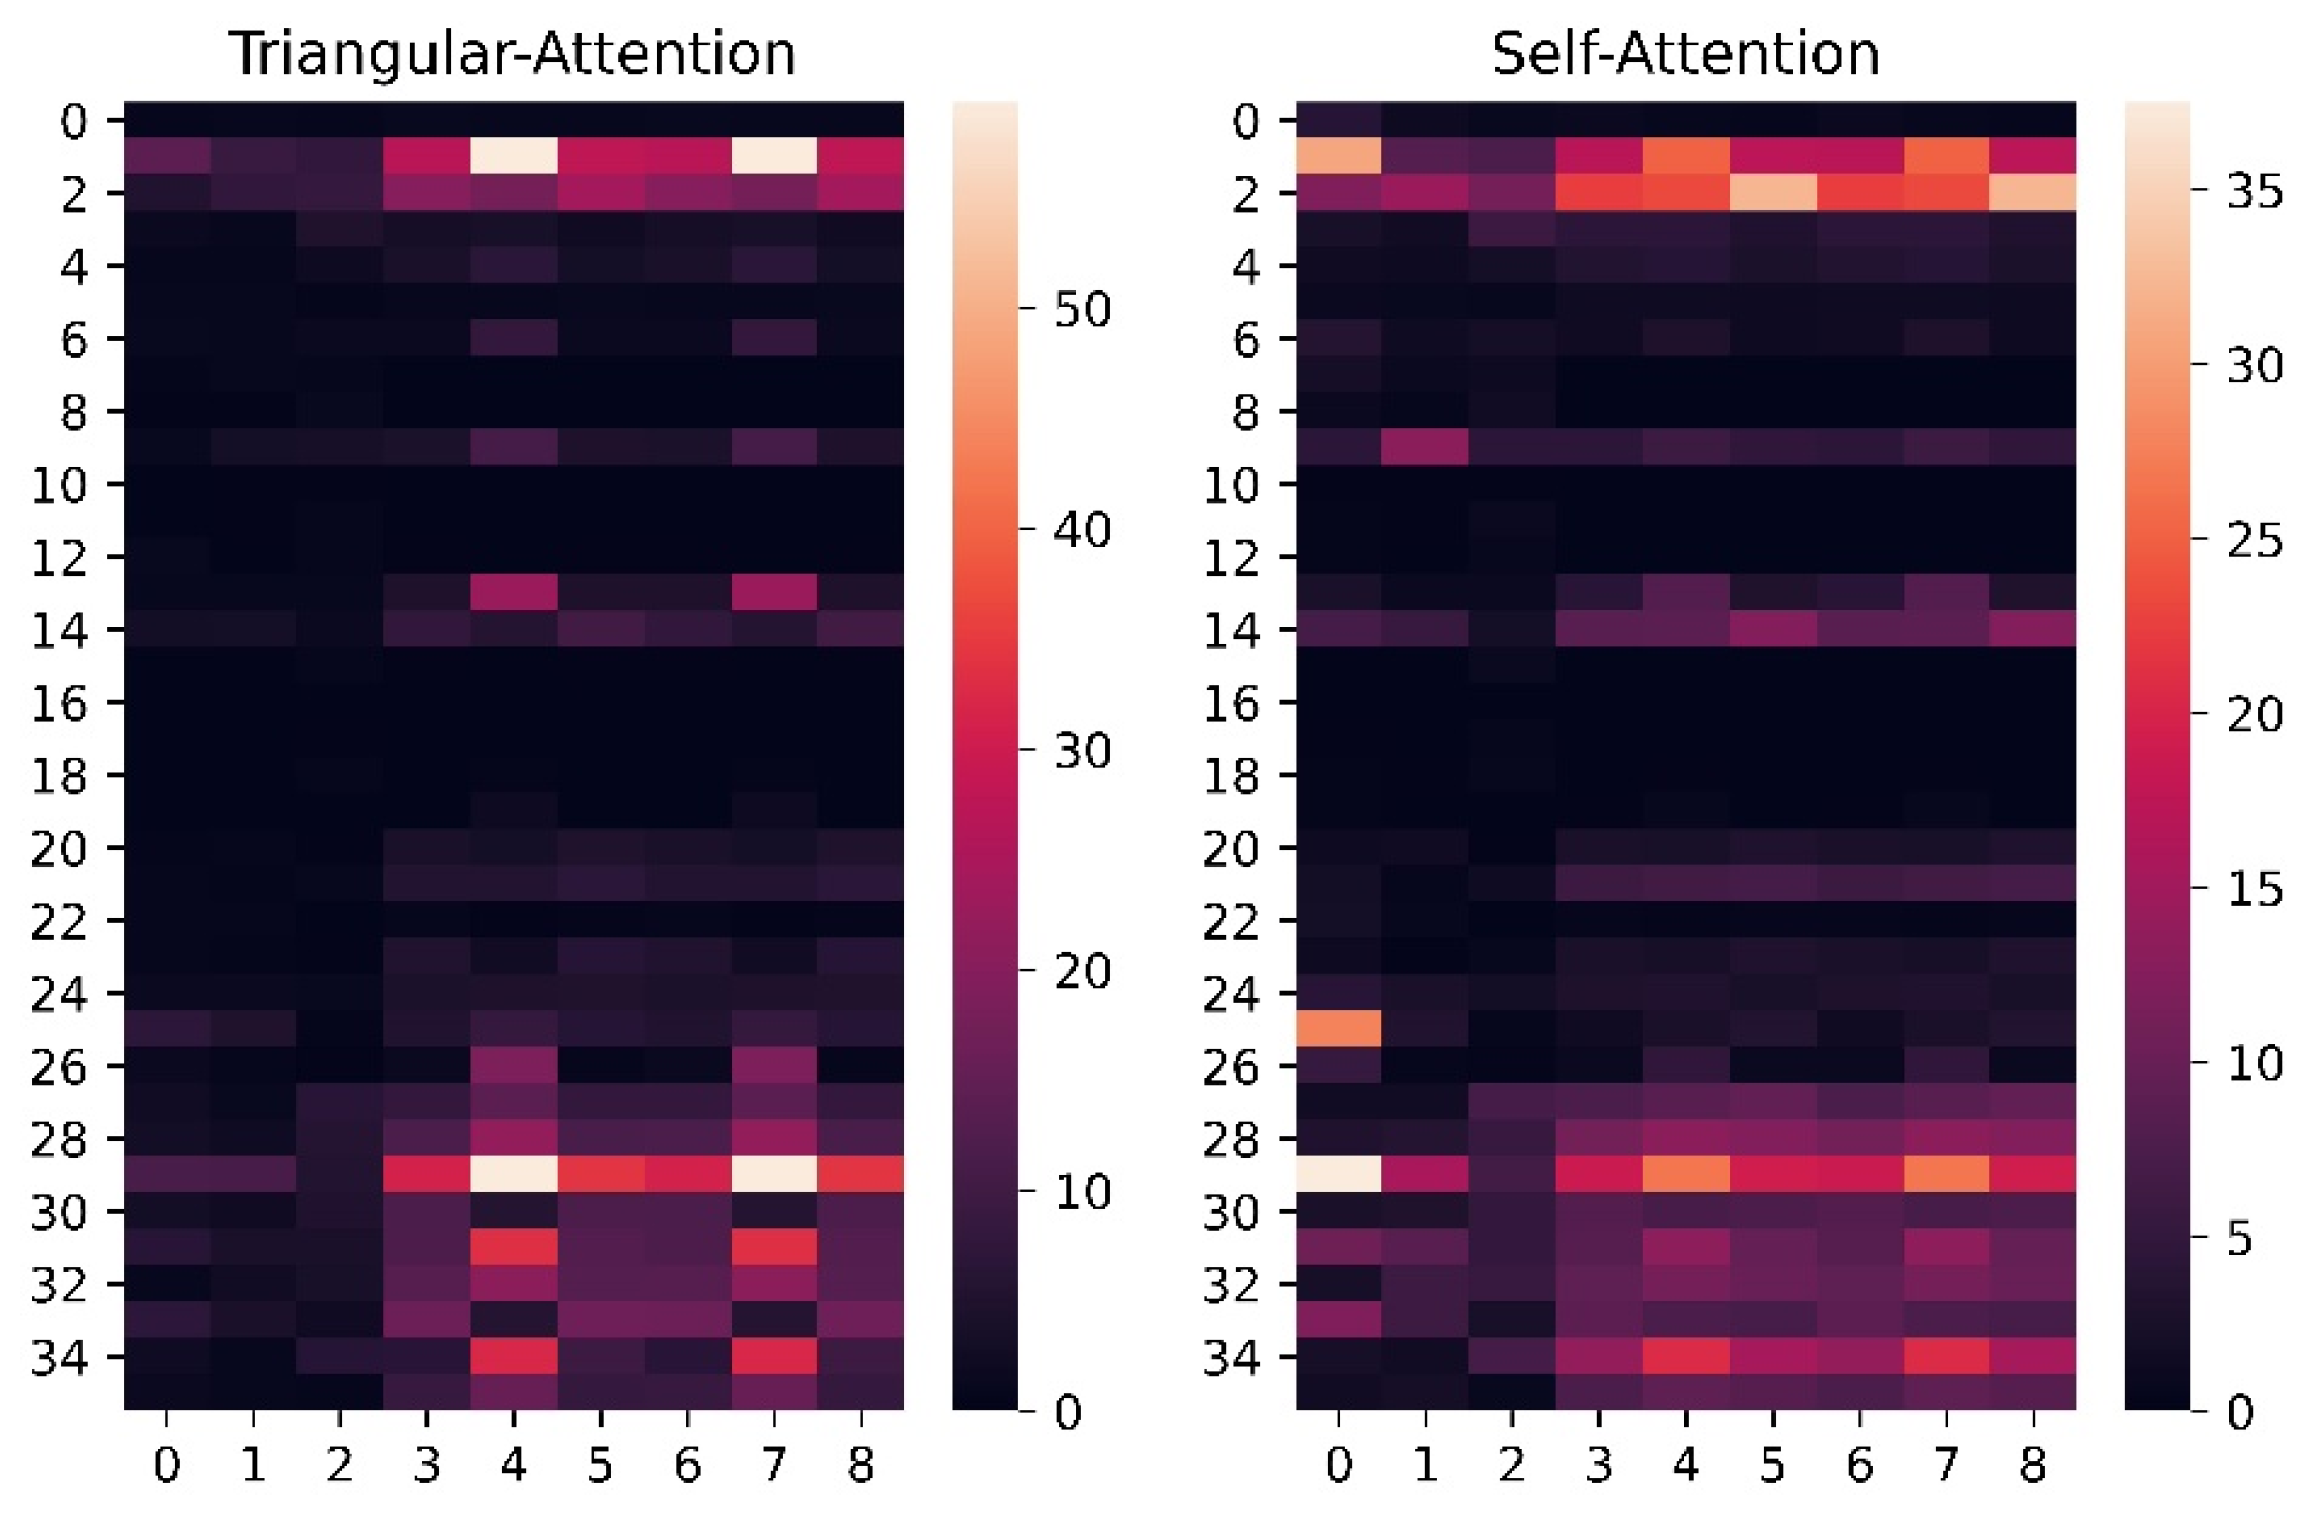
5.2. Visualization of Attention

In order to better demonstrate the effect of our model on the feature extraction of opcode blocks, we use the triangular-attention module and the self-attention module to weight each opcode vector with the weighting score calculated from the opcode blocks and visualize the attention intensity coefficients of opcodes for different malware. We randomly selected two malicious family samples of Vundo and three malicious family samples of Tracur from the correctly-predicted test samples in Dataset A. In addition, we randomly selected three samples of Vundo from the correctly-predicted test samples in Dataset B. Vundo and Tracur are both trojan software. We compare samples belonging to the same malicious family in different datasets and samples belonging to different malicious families in different datasets. The visual results are presented below.

5.2.1. Comparison of Code Block with Attention

In this section, we are going to analyze a small subset of the triangular attention we see in the main part of the model. We randomly selected two samples, which are both Ramnit, and with relatively few opcode blocks (without compression or folding) for easier visualization.
We are going to examine the weighting scores on the pair representation in the triangular-attention module. The attention pattern for a given head h is a third order tensor, a i j k h . Here, we investigate averages slice along the i axis and display the j k array as a heat map. We show the attention patterns in Figure 10.
According to the heat map generated by attention, we find that the two samples give the highest weight in opcode block 62 and opcode block 61 of the code block, respectively. When mapping these opcode blocks to the assembly source code, we find that the code blocks they point to are highly similar, which proves that the triangular-attention module used in our model has extracted the most representative features of the Ramnit malicious family in the two samples.

5.2.2. Comparison of Opcode’s Weighting Score

The abscissa in the figure represents the five samples for comparison. The three samples numbered 0 to 2 in Figure 11 represent the Vundo software in Dataset B, and the two samples numbered 3 and 4 represent the Vundo software in Dataset A. It can be observed from the figure that there is a similar relationship between the concerned opcode vectors and the calculated weighting scores of the software from the same family after being processed by the triangular-attention module and self-attention module. Furthermore, the triangular-attention module can more effectively extract the core features of the opcode blocks, which shows that the weighting scores of opcodes between the same family calculated by the triangular-attention module are closer than those calculated by the self-attention module. After we mapped the highlighted opcode vector to the initial opcode character and combined it with the visualization results, we found that the malware family Vundo frequently performed “push” and “mov” operations on various registers. We conclude this might be a common manifestation of the malicious behavior of the trojan family.
In addition, to compare the differences between different families of trojan software, we compared Vundo and Tracur. As shown in Figure 12, three samples numbered 0 to 2 represent Vundo in Dataset A, and three samples numbered 3 to 5 represent Tracur in Dataset A. Compared with Figure 11, it can be observed that different malicious families have apparent differences in the weighting scores calculated by the attention module. Moreover, the triangular-attention module gives more attention to the register vectors and main opcode vectors of the Tracur family, which can detect the trojan software by referring to the highlighted opcode vector and identifying its family by the weighting score distribution of different opcodes. Although the self-attention module also shows the difference between the two families to some extent, the effect is not as strong as for the triangular-attention module.

5.3. Future Work

According to the results shown in Figure 8, we can conclude that our model has good performance in detecting Trojan and their family Emotet. However, due to the insufficient number of other malicious families in Dataset B, we have not performed a more detailed classification for other malicious families. Therefore, we will conduct further research on the other prevalent malware in future work. Furthermore, as indicated in Section 4.4, our model requires 25 h for training, although our method achieves higher accuracy than previous methods. In the future, we will try to optimize the algorithm of the model and simplify the network to reduce the training time and computation cost.

6. Conclusions

As the number of malwares grows exponentially, it is critical to detect malware and its variants promptly and effectively. To overcome the disadvantages of existing methods, including converting binary sequences to images which leads to information loss, and extracting n-gram from opcode which cannot capture the long-distance function call relationship, this work proposed a novel multi-feature learning method based on whole and local feature extraction respectively, and proposed a multi-feature align and fusion method. We compared our method with other available methods on the Kaggle Malware Classification Challenge dataset and an additional collected dataset. The experimental results reveal that our strategy outperforms competing approaches in all evaluation circumstances. The strategies developed in this study could be utilized to improve the effectiveness of automated malware analysis tools by raising variant classification rates and lowering the chance of ambiguity in malware labeling.

Author Contributions

Data curation, D.Y.; Formal analysis, X.Y.; Investigation, X.Y.; Project administration, Y.L.; Writing—original draft, X.Y. and D.Y.; Writing—review and editing, X.Y. All authors have read and agreed to the published version of the manuscript.

Funding

This research received no external funding.

Conflicts of Interest

The authors declare no conflict of interest.

References

  1. Cohen, M. Scanning memory with yara. Digit. Investig. 2017, 20, 34–43. [Google Scholar] [CrossRef]
  2. Kaur, R.; Singh, M. Hybrid real-time zero-day malware analysis and reporting system. Int. J. Inf. Technol. Comput. Sci. 2016, 8, 63–73. [Google Scholar] [CrossRef]
  3. Kolosnjaji, B.; Zarras, A.; Lengyel, T.; Webster, G.; Eckert, C. Adaptive semantics-aware malware classification. In Lecture Notes in Computer Science (including subseries Lecture Notes in Artificial Intelligence and Lecture Notes in Bioinformatics); Springer: Cham, Switzerland, 2016; Volume 9721, pp. 419–439. [Google Scholar] [CrossRef]
  4. Huda, S.; Miah, S.; Hassan, M.M.; Islam, R.; Yearwood, J.; Alrubaian, M.; Almogren, A. Defending unknown attacks on cyber-physical systems by semi-supervised approach and available unlabeled data. Inform. Sci. 2017, 379, 211–228. [Google Scholar] [CrossRef]
  5. Ahmadi, M.; Ulyanov, D.; Semenov, S.; Trofimov, M.; Giacinto, G. Novel Feature Extraction, Selection and Fusion for Effective Malware Family Classification. In Proceedings of the Sixth ACM Conference on Data and Application Security and Privacy, New Orleans, LA, USA, 9–11 March 2016; ACM: New York, NY, USA, 2016. [Google Scholar] [CrossRef]
  6. Park, Y.; Reeves, D.S.; Stamp, M. Deriving common malware behavior through graph clustering. Comput. Secur. 2013, 39, 419–430. [Google Scholar] [CrossRef]
  7. Kolbitsch, C.; Comparetti, P.M.; Kruegel, C.; Kirda, E.; Zhou, X.; Wang, X. Effective and Efficient Malware Detection at the End Host. In Proceedings of the 18th Conference on USENIX Security Symposium (SSYM’09), Montreal, QC, Canada, 10–14 August 2009; Usenix Association: Berkeley, CA, USA, 2009; pp. 351–366. [Google Scholar]
  8. Raff, E.; Barker, J.; Sylvester, J.; Brandon, R.; Catanzaro, B.; Nicholas, C. Malware Detection by Eating a Whole EXE. arXiv 2017. [Google Scholar] [CrossRef]
  9. Guen, K.T.; Kang, B.J.; Mina, R.; Sakir, S.; Gyu, I.E. A multimodal deep learning method for android malware detection using various features. IEEE Trans. Inf. Forensics Secur. 2018, 14, 773–788. [Google Scholar] [CrossRef]
  10. Ronen, R.; Radu, M.; Feuerstein, C.; Yom-Tov, E.; Ahmadi, M. Microsoft malware classification challenge. arXiv 2018. [Google Scholar] [CrossRef]
  11. Fan, J.; Guan, C.; Ren, K.; Cui, Y.; Qiao, C. Spabox: Safeguarding privacy during deep packet inspection at a middlebox. IEEE/ACM Trans. Netw. 2017, 25, 3753–3766. [Google Scholar] [CrossRef]
  12. Zhang, B.; Yin, J.; Hao, J.; Zhang, D.; Wang, S. Malicious codes detection based on ensemble learning. In International Conference on Autonomic and Trusted Computing; Springer: Berlin/Heidelberg, Germany, 2007. [Google Scholar]
  13. Shabtai, A.; Moskovitch, R.; Feher, C.; Dolev, S.; Elovici, Y. Detecting unknown malicious code by applying classification techniques on OpCode patterns. Secur. Inform. 2012, 1, 1. [Google Scholar] [CrossRef]
  14. Sharif, M.I.; Yegneswaran, V.; HSaïdi Porras, P.A.; Lee, W. Eureka: A framework for enabling static malware analysis. In European Symposium on Research in Computer Security; Springer: Berlin/Heidelberg, Germany, 2008. [Google Scholar] [CrossRef]
  15. Elhadi, A.A.; Maarof, M.A.; Barry, B. Improving the detection of malware behaviour using simplified data dependent api call graph. Int. J. Secur. Its Appl. 2015, 7, 29–42. [Google Scholar] [CrossRef]
  16. Bidoki, S.M.; Jalili, S.; Tajoddin, A. Pbmmd: A novel policy based multi-process malware detection. Eng. Appl. Artif. Intell. 2017, 60, 57–70. [Google Scholar] [CrossRef]
  17. Trinius, P.; Willems, C.; Holz, T.; Rieck, K. A malware instruction set for behavior-based analysis. In Sicherheit 2010. Sicherheit, Schutz und Zuverlässigkeit; Freiling, F.C., Ed.; Gesellschaft für Informatik e.V.: Berlin, Germany, 2010; pp. 205–216. [Google Scholar]
  18. Vasilescu, M.; Gheorghe, L.; Tapus, N. Practical malware analysis based on sandboxing. In Proceedings of the 2014 RoEduNet Conference 13th Edition: Networking in Education and Research Joint Event RENAM 8th Conference, Chisinau, Moldova, 11–13 September 2014. [Google Scholar] [CrossRef]
  19. Ghiasi, M.; Sami, A.; Salehi, Z. Dynamic VSA: A framework for malware detection based on register contents. Eng. Appl. Artif. Intell. 2015, 44, 111–122. [Google Scholar] [CrossRef]
  20. Li, S.; Zhou, Q.; Zhou, R.; Lv, Q. Intelligent malware detection based on graph convolutional network. J. Supercomput. 2022, 78, 4182–4198. [Google Scholar] [CrossRef] [PubMed]
  21. Chai, Y.; Qiu, J.; Su, S.; Zhu, C.; Yin, L.; Tian, Z. LGMal: A Joint Framework Based on Local and Global Features for Malware Detection. In Proceedings of the 2020 International Wireless Communications and Mobile Computing (IWCMC), Limassol, Cyprus, 15–19 June 2020; pp. 463–468. [Google Scholar] [CrossRef]
  22. de Oliveira, A.S.; Sassi, R.J. Behavioral Malware Detection Using Deep Graph Convolutional Neural Networks. TechRxiv 2019. [Google Scholar] [CrossRef]
  23. Gibert, D.; Mateu, C.; Planes, J. A Hierarchical Convolutional Neural Network for Malware Classification. In Proceedings of the 2019 International Joint Conference on Neural Networks (IJCNN), Budapest, Hungary, 14–19 July 2019; pp. 1–8. [Google Scholar] [CrossRef]
  24. O’Shaughnessy, S.; Sheridan, S. Image-based malware classification hybrid framework based on space-filling curves. Comput. Secur. 2022, 116, 102660. [Google Scholar] [CrossRef]
  25. Kim, J.; Cho, S. Obfuscated Malware Detection Using Deep Generative Model based on Global/Local Features. Comput. Secur. 2022, 112, 102501. [Google Scholar] [CrossRef]
  26. Lu, J.; Batra, D.; Parikh, D.; Lee, S. Vilbert: Pretraining Task-Agnostic Visiolinguistic Representations for Vision-and-Language Tasks; Curran Associates Inc.: Red Hook, NY, USA, 2019. [Google Scholar]
  27. Chen, C.F.; Fan, Q.; Panda, R. Crossvit: Cross-attention multi-scale vision transformer for image classification. arXiv 2021. [Google Scholar] [CrossRef]
  28. IDA Pro. Available online: https://www.hex-rays.com/products/ida (accessed on 1 September 2017).
  29. Zhang, J.; Wen, Y. Malware Detection Based on Opcode Dynamic Analysis. EAI Endorsed Trans. Secur. Saf. 2020, 7, e4. [Google Scholar] [CrossRef]
  30. Kim, Y. Convolutional neural networks for sentence classification. In Proceedings of the Conference on Empirical Methods in Natural Language Processing, EMNLP, ACL, Doha, Qatar, 26–28 October 2014; pp. 1746–1751. [Google Scholar] [CrossRef]
  31. Santana, K.; Ketkar, E. Deep Learning with Python 1; Springer: Berlin/Heidelberg, Germany, 2017. [Google Scholar]
  32. Tunyasuvunakool, K.; Adler, J.; Wu, Z.; Green, T.; Zielinski, M.; Žídek, A.; Bridgland, A.; Cowie, A.; Meyer, C.; Laydon, A.; et al. Highly accurate protein structure prediction for the human proteome. Nature 2021, 596, 590–596. [Google Scholar] [CrossRef]
  33. Zhu, S.; Shi, J.; Yang, L.; Qin, B.; Zhang, Z.; Song, L.; Wang, G. Measuring and modeling the label dynamics of online anti-malware engines. In Proceedings of the 29th USENIX Conference on Security Symposium (SEC’20), Online, 12–14 August 2020; USENIX Association: Berkeley, CA, USA; pp. 2361–2378. [Google Scholar]
  34. Hemalatha, J.; Roseline, S.A.; Geetha, S.; Kadry, S.; Damaeviius, R. An efficient densenet-based deep learning model for malware detection. Entropy 2021, 23, 344. [Google Scholar] [CrossRef]
  35. Roseline, S.A.; Geetha, S.; Kadry, S.; Nam, Y. Intelligent Vision-Based Malware Detection and Classification Using Deep Random Forest Paradigm. IEEE Access 2020, 8, 206303–206324. [Google Scholar] [CrossRef]
  36. Jian, Y.; Kuang, H.; Ren, C.; Ma, Z.; Wang, H. A novel framework for image-based malware detection with a deep neural network. Comput. Secur. 2021, 109, 102400. [Google Scholar] [CrossRef]
  37. Dosovitskiy, A.; Beyer, L.; Kolesnikov, A.; Weissenborn, D.; Houlsby, N. An image is worth 16x16 words: Transformers for image recognition at scale. arXiv 2020. [Google Scholar] [CrossRef]
Figure 1. Architecture of the framework. Our framework is made up of four modules: (a) original feature extraction module, (b) feature vector generation module, (c) feature fusion module, and (d) detection module.
Electronics 12 00713 g001
Figure 2. Stacked convolution network. A linear layer turns binary to a vector b . A convolutional layer represents multiple binary ( b i : n = b i , , b n ) as feature R i , while a dilation convolution layer is applied to extract binary of different position. The pooling layer further refines features.
Electronics 12 00713 g002
Figure 3. Triangular self-attention around starting opcode.
Electronics 12 00713 g003
Figure 4. The standard attention architecture is used to support cross-attention. This structure incorporates binary-attention features into opcode feature representation by exchanging key-value pairs in multi-headed attention.
Electronics 12 00713 g004
Figure 5. The model architecture for malware detection.
Electronics 12 00713 g005
Figure 6. Confusion matrix of malware family detection. (On Dataset A.)
Electronics 12 00713 g006
Figure 7. The epoch curves of loss and accuracy for training and validation data. (a)The epoch curves of accuracy for training and validation. (b)The epoch curves of loss for training and validation.
Electronics 12 00713 g007
Figure 8. Confusion matrix for tasks of malware detection and malware family classification.
Electronics 12 00713 g008
Figure 9. Comparisons of accuracy, precision, recall, and F1-score of the model on Dataset B for task 1, malware detection, and task 2, malware family classification. (a) evaluation result in task 1. (b) evaluation result in task 2.
Electronics 12 00713 g009
Figure 10. Visualization of triangular attention on two random malware samples.
Electronics 12 00713 g010
Figure 11. Visualization of weighting score calculated by the triangular attention and the self-attention. The three samples numbered 0 to 2 represent the Vundo software in Dataset B, and the two samples numbered 3 and 4 represent the Vundo software in Dataset A.
Electronics 12 00713 g011
Figure 12. Visualization of weighting score calculated by the triangular attention and the self-attention. The three samples numbered 0 to 2 represent Vundo in Dataset A, and the three samples numbered 3 to 5 represent Tracur in Dataset A.
Electronics 12 00713 g012
Table 1. The summary of the related works.
TechniqueFeaturesMethod
Static detectionn-gram binary sequence [12]Probabilistic neural network technique
Features set of opcode patterns [13]K-means and random forest
API calls of Windows System32 files [14]Support vector machine classifier
API call of malware [15]Longest common subsequence (LCS) technique
Dynamic detectionLog directory and execution information of binary file [17]Cuckoo sandbox
Contents of CPU registers [19]Propose an algorithm to find similarities of run-time behaviors
API calls [22]Depth map convolution neural network
Multi-feature fusion detectionAssemble opcodes and functions [23]Two-level convolution neural network
Assemble opcodes and binary sequence [20]Convolution neural network
Feature image [24]Convolution neural network
Table 2. Three kinds of primary extracted opcodes.
TypeOpcode
Operation‘jmp’, ‘mov’, ‘push’, ‘pop’, ‘xor’, ‘retn’, ‘sub’, ‘inc’, ‘dec’, ‘add’, ‘imul’, ‘or’, ‘shr’, ‘cmp’, ‘call’, ‘shl’, ‘neg’, ‘jnb’, ‘jb’, ‘jbe’, ‘jz’, ‘lea’, ‘movzx’, ‘test’
Variable‘short’, ‘word’, ‘byte’
Register‘edx’, ‘esi’, ‘eax’, ‘ebx’, ‘ecx’, ‘edi’, ‘ebp’, ‘esp’
Table 3. The dimension change of each module on the detection model.
NetworkParameter SettingLayer
Stacked
Convolution
Network
(receiving length = 256)
Row conv.Kernel size: 3
Stride: 1
repeat time = 1input (1000,64)
output:(998,64)
repeat time = 2input (435,64)
output:(433,64)
Col conv.Kernel size: 3
Stride: 1
Dilation: 64
repeat time = 1input (998,64)
output (870,64)
repeat time = 2input (433,64)
output:(305,64)
PoolKernel size: 2repeat time = 1input (870,64)
output (435,64)
repeat time = 2input (305,64)
output:(152,64)
Triangular attentionHead num: 4input (20, 36)
output (20,64)
Cross
attention
Head num: 4input ((20,64), (152,64))
output (20,64)
Softmax classificationinput (20,64)
output (9)
Table 4. Summary of malware data in Dataset A.
Malware FamilyNumber of SamplesDescription
TrainTest
Ramnit1301231Worm
Lollipop2081388Adware
Kelihos ver32473463Backdoor
Vundo36383Trojan
Simda295Backdoor
Tracur605127Trojan downloader
Kelihos ver.132562Backdoor
Obfuscator.ACY998179Obfuscated malware
Gatak825188Backdoor
Table 5. Summary of malware data in Dataset B.
LabelMalware/BenignNumber of Samples
EmotetMalware6235
TrojanMalware9022
Other malwareMalware4529
BenignBenign4837
Total34,426
Table 6. Comparisons with the existing models on Dataset A.
AuthorsTechniqueFeaturesAccuracyPrecisionRecallF1-Score
Raff et al.
2017 [8]
MalConvbinary sequence96.8797.0589.9892.05
Hemalatha et al. 2021 [34]DenseNet-basedgrey image98.4698.5897.8498.21
Roseline et al.
2020 [35]
Vision-basedgrey image97.296.6196.7997.20
Kim et al.
2022 [25]
Deep Generative modelgrey image and binary codes97.47---
Jian et al.
2021 [36]
Deep Neural Networkbinary sequence and opcode98.3198.6897.9398.30
Our methodbinary sequence and opcode99.5499.4099.4199.40
Table 7. Comparisons with the baseline models on the test set of Dataset B.
MethodTask 1: Malware DetectedTask 2: Malware Family Classification
AccuracyPrecisionRecallF1-ScoreAccuracyPrecisionRecallF1-Score
MalConv88.7282.3880.5281.3983.2584.0682.2683.05
MalConv plus87.0882.3282.4075.7578.3280.0279.3978.85
GRU-CNN88.9686.0975.9379.5681.4481.4881.4281.34
BiGRU-CNN89.0484.4878.1380.7179.9882.2677.4779.28
ResGRU-CNN87.8781.1578.4679.6878.7279.3680.4079.13
Our method95.4492.0693.6292.8188.7188.2588.7988.49
Table 8. Comparisons of accuracy, precision, recall, and F1-score of the model with different structures.
MethodAccuracyPrecisionRecallF1-Score
Model 1: ImgVIT + CA + Add98.3297.2598.0297.42
Model 2: ImgVIT + CA + CAT98.7397.6297.9697.35
Model 3: SDC + CA + CAT99.5999.3499.3699.42
Model 4 (proposed model): SDC + CTA + CAT99.5499.4099.4199.40
Model 5: SDC + CTAT + CAT99.3099.1699.3099.22
Model 6: SDC + CTA + FCAT99.3699.2797.1398.08
Model 7: SDC + MLP97.3397.1597.3397.23
Model 8: CTA + MLP95.9296.2996.4096.33
Disclaimer/Publisher’s Note: The statements, opinions and data contained in all publications are solely those of the individual author(s) and contributor(s) and not of MDPI and/or the editor(s). MDPI and/or the editor(s) disclaim responsibility for any injury to people or property resulting from any ideas, methods, instructions or products referred to in the content.

