Article

Optimized and Efficient Image-Based IoT Malware Detection Method

by
Amir El-Ghamry
1,2,3,†,
Tarek Gaber
4,5,*,†,
Kamel K. Mohammed
6,† and
Aboul Ella Hassanien
7,† on behalf of the Scientific Research Group
1
Faculty of Computers and Information, Mansoura University, Mansoura 35516, Egypt
2
School of Engineering and Computer Science, University of Hertfordshire Hosted by Global Academic Foundation, Cairo 16192, Egypt
3
Faculty of Computer Science and Engineering, New Mansoura University, Mansoura 35516, Egypt
4
School of Science, Engineering, and Environment, University of Salford, Salford M5 4WT, UK
5
Faculty of Computers and Informatics, Suez Canal University, Ismailia 41522, Egypt
6
Center for Virus Research and Studies, Al-Azhar University, Cairo 11754, Egypt
7
Faculty of Computer and Artificial Intelligence, Cairo University, Giza 13062, Egypt
*
Author to whom correspondence should be addressed.
Scientific Research Group in Egypt (SRGE), Giza 13062, Egypt.
Electronics 2023, 12(3), 708; https://doi.org/10.3390/electronics12030708
Submission received: 31 December 2022 / Revised: 22 January 2023 / Accepted: 28 January 2023 / Published: 31 January 2023
(This article belongs to the Special Issue Artificial Intelligence in Cybersecurity for Industry 4.0)

Abstract

:
With the widespread use of IoT applications, malware has become a difficult and sophisticated threat. Without robust security measures, a massive volume of confidential and classified data could be exposed to vulnerabilities through which hackers could do various illicit acts. As a result, improved network security mechanisms that can analyse network traffic and detect malicious traffic in real-time are required. In this paper, a novel optimized machine learning image-based IoT malware detection method is proposed using visual representation (i.e., images) of the network traffic. In this method, the ant colony optimizer (ACO)-based feature selection method was proposed to get a minimum number of features while improving the support vector machines (SVMs) classifier’s results (i.e., the malware detection results). Further, the PSO algorithm tuned the SVM parameters of the different kernel functions. Using a public dataset, the experimental results showed that the SVM linear function kernel is the best with an accuracy of 95.56%, recall of 96.43%, precision of 94.12%, and F1_score of 95.26%. Comparing with the literature, it was concluded that bio-inspired techniques, i.e., ACO and PSO, could be used to build an effective and lightweight machine-learning-based malware detection system for the IoT environment.

1. Introduction

Internet of Things (IoT) technologies have found various applications, including health, industry, smart cities/homes, and education [1]. As reported in [2], in the next two years, it is estimated that more than 75.44 billion IoT devices will be embedded in applications. The work in [1,2] confirms that the next important phase in the dream of connecting the world will be establishing a network of connected smart gadgets. This technology, however, brings with it new security and privacy concerns. Considering the nature of IoT networks, it is obvious that they typically consist of low-cost sensors and/or devices (surveillance cameras, different types of sensors such as CO2 or temperature). Such sensors/devices are not only remotely located but also have constrained resources (i.e., processing capacity and low-power sources) [1]. These constraints make it difficult to carry out complicated security activities on those devices, thus allowing the attackers to exploit these devices and threaten the network by abusing the integrity and/or the network’s security [3].
In late 2019, a study by Avast [4] revealed that two out of five IoT devices are vulnerable to hackers [4]. It is also found that botnet attacks are the most prevalent kind of attack. Such attacks can conduct devastating DDOS (Distributed Denial of Service), which use vulnerable IoT devices to mount major security breaches. A well-known example of these attacks is the Mirai botnet [5]. In late 2016 [6], the Mirai attack blocked the Internet by knocking out hundreds of services, including DNS providers, Twitter, Netflix, GitHub, Amazon, Reddit, etc. Unlike other botnets, Mirai is mostly made up of IoT devices such as digital cameras, DVR players, temperature sensors, and so on [6,7]. According to investigations, this devastating DDoS attack (Mirai) featured over 400,000 compromised IoT devices, making it the most powerful DDoS attack ever.
Malware is defined as software designed to cause damage to a computer system, smart appliances, or Internet-connected devices, typically with the aim of stealing data or causing damage to a network. Malware is considered one of these dangerous attacks embedded with IoT devices that make the detection of such malware extremely challenging. Malicious software only works on the system for which it was written. A Linux system’s executable ELF files are functionally equivalent to Windows’ PE files (.exe, .obj, .dll, etc.). Most IoT devices run a modified version of Linux based on the Debian distribution, but their CPU architectures vary widely (ARM, MIPS, ×86, etc.). There is a significant increase in the number of zero-day malware variants on a daily basis. As a result, personally analyzing each assault occurrence will become increasingly difficult. That is why it is crucial to create a malware detection methodology for threats aimed squarely at the infrastructure and devices of the internet of things [8,9].
Most malware detection systems for such attacks depend on a signature-based malware detection approach, which compares incoming traffic to a stored signature of previously known malware to identify potential attacks [10]. While these techniques are extremely precise and effective in detecting known attacks, they frequently fail to detect new attacks/threats without signatures [10,11]. Additionally, they need considerable resources and manual intervention to update attack signatures [11]. As a result, they cannot detect zero-day attacks. Significant work has been invested in overcoming these constraints, with various techniques concentrating on behavior analysis or anomaly detection [12,13].
Several papers [14,15,16,17] used a visual representation of the network traffic to detect malware issues. However, there are two main limitations in the literature. Firstly, the accuracy measure was the only evaluation metric used to assess the performance of the proposed solution. The accuracy alone is not enough of a measure to assess the false and positive alarm rates. Secondly, deep learning models were used and showed that they could improve performance, but this comes at a massive computational cost that may not be visible/sustainable for IoT-based systems with limited computational capabilities [18].
Although applying transfer learning to image classification is well known, the proposed model used classical machine learning to classify the converted PCAP into images into normal or abnormal classes. The disadvantages of transfer learning for image classification are the reason for using traditional machine learning [19]. One limitation is what is known as a negative transfer which occurs when transfer learning decreases the new model’s performance or accuracy. Transfer learning works well if both models’ beginning and target problems are comparable [19]. If the new task uses a set of training data that is too different from the previous task, the trained models may perform poorly. Even if developers think two pieces of training data are similar, algorithms may disagree. No standards exist for what activities are connected or how algorithms decide, making negative transfer difficult to solve. Another problem of transfer learning discovering optimum AI models. If the initial layers are removed, the dense layers’ trainable parameters will be changed too. Further, dense layers can be a good place to start cutting layers but determining how many to drop to avoid overfitting is time-consuming. Overfitting limits practically all prediction methods. It is a major data bias. In transfer learning, overfitting occurs when a new model learns features and noise from training data that affect its outputs [19,20].
In this paper, to address the above limitations, a method of IoT malware detection was proposed. Still, shallow machine learning (SML) with a visual representation of the network traffic is proposed. Moreover, a bio-inspired optimization algorithm is used to select the best features using ACO and tune the SVM parameters using PSO to get the best performance of the proposed solution. The proposed method leveraged the benefits of two popular bio-inspired techniques to first reduce the data dimensions (done by ACO) and then improve the performance of the SVM classifier (done by PSO for parameter tuning). The two algorithms are applied to malware features represented as images rather than normal numerical features. As a result, based on traditional machine learning, the proposed method can detect malware with high accuracy and low processing time, and it can thus be deployed in any IOT environment that uses limited capability resources efficiently and effectively. The proposed model is considered a form of early warning for any IoT-based system, keeping sensitive data secure and protected.
The proposed method consists of various stages. Firstly, the network Pcap files are converted into 2D RGB images. Secondly, the images are transferred to numerical vectors, then features are extracted using various statistical texture features that fully capture the original image’s spatial distribution of intensity variations. Thirdly, a feature selection process was proposed using ACO to minimize processing time, thus addressing the IDS limitation of IoT applications. This process removes superfluous and unnecessary features as noisy data can negatively impact the accuracy of the malware detection process. Therefore, an efficient feature selection method would minimize the dimensionality of the feature space and enhance the efficiency as well as the performance of IDS. Fourthly, the next stage includes presenting the selected features to the detection process where the selected features are classified as normal or attack network flow. In this detection phase, the PSO was employed to select the best parameter values of the SVM classifier to find the most accurate solution.
The contribution of this paper is as follows:
  • Employing the ACO algorithm as a feature selection technique, i.e., selecting a minimum number of features while improving the classification results of an image-based malware detection system using the SVM classifier.
  • Determining the best SVM kernel function gives the best results of the proposed method.
  • Utilizing the PSO algorithm for tuning the SVM parameters of the best-determined kernel function.
  • Integrating bio-inspired and ML techniques in proposing a malware detection approach can be effectively used in the IoT environment.
  • Evaluating the proposed approach in terms of various evaluation metrics: accuracy, recall, precision, and F1-score and comparing it with the most related published work.
The rest of the paper is organized as follows. Section 2 gives a detailed survey about IoT malware detection using a visual representation of the network traffic. Section 3 gives an overview of the algorithms/techniques used in the proposed malware detection system. Section 4 presents the proposed system, while Section 5 reports the results, discussion, and comparison with the literature. Finally, the conclusion is given in Section 6.

2. Literature Review

Malware classification is used to decide if a software program is malicious or benign. Using signature-based algorithms for malware detection fails when facing zero-day attacks or advanced malware attacks. In addition, different techniques (e.g., obfuscation, polymorphism, encryption, and meta-morphism) can be used to deceive the malware detectors built using the signature-based approach. Machine learning techniques (such as supervised ANN, Decision tree, MLP, SVM, and deep learning) are adopted to mitigate the bad effects of malware on individuals and industries. Machine learning techniques can identify zero-day and new malware attacks. Malware detectors based on advanced machine learning approaches can be effectively adopted in IoT environments because cloud services can accommodate the heavy computation of machine learning methods. The learning stage can be processed on a cloud server, and the trained model is transferred to the IoT devices with limited resources to execute it locally.
There are two methods of applying machine learning techniques to detect and classify malware: Feature-based technique and Image-based technique. The former method extracts different features from malware file samples to train the classifier. The latter method uses image processing for malware classification. This method transforms binary malware instances into images, and then malware detection is accomplished using image classification techniques that take the image representation of the malware as their input. In this section, we highlight a few malware detection and classification works based on the representation of the malware as images, which are closely related to ours.
Machine learning-based malware detection: Nataraj et al. [21] were the first to employ byte plot visualisation as grayscale images for automatic malware detection. They transformed the structure of packed binary samples into 2D grayscale images. They extracted global image features (i.e., GIST features) from images, and then they performed classification using the K-nearest neighbor algorithm and applied Euclidean distance as the distance metric. With the Euclidean distance, they achieved a 97.18% accuracy rate. One limitation of their approach is that it has a high computational overhead since the GIST algorithm is time-consuming. Another limitation is the ability of an attacker to defend itself against the system due to its dependability on the global features of images.
Naeem et al. [15] proposed an image-based malware detection system that represents images globally and locally. First, the proposed technique converts a malware file to a grayscale image and then extracts local descriptors (D-SIFT) and global descriptors (GIST) from the malware image. Finally, a Linear SVM model is trained to perform malware classification. They reported 97.4% accuracy. The drawback of the proposed system is that they applied an analysis method that involves only malware that assaults windows. This limitation makes it difficult to prove the system’s performance on heterogeneous malware images. Furthermore, the used approach is extremely complex due to the texture feature analysis.
Su et al. [16] proposed a lightweight neural network framework to differentiate between DDoS malware and goodware in IoT applications. The system converted program binaries to grayscale images. They used a data set of 500 samples of image size (64 × 64). They achieved a 94% classification accuracy. One limitation of this approach is the very limited dataset, both in size and diversity. Another limitation is that they did not try any other image size variations. Makandar et al. [22] proposed Support Vector Machine (SVM) malware classification using images as input. They used wavelet transform and GIST to build effective texture feature vectors from the malware images. They used KNN and SVM for classification. They achieved an accuracy rate of 98.84% and 98.88% for KNN and SVM, respectively. Liu et al. [23] used ensemble learning to detect malware effectively based on grayscale images. The method constructs disassembled files from malware executable files. After that, disassembly files are transformed into grayscale images. The dimensions of grayscale images are reduced using the local mean approach. An ensemble learning method that combines K-means and bagging algorithms is applied for classification and achieves an accuracy of 98.2% on grayscale images and 94.20% on n-grams.
Han et al. [17] analysed malware using entropy graphs with bitmap images to classify malware files. The method converts malware binaries into bitmap images, then calculates the similarities by converting images into entropy graphs. The limitation of this approach is that it can be applied only to Windows portable executable files because the proposed system depends on the PE header’s information to identify the converted sections. Additionally, the applied entropy graph method cannot detect packed malware samples. Turker et al. [24] proposed a model for malware classification using hybrid features. The model used singular value decomposition, a local binary pattern, and a new local ternary pattern network to extract features. Next, Principal Component Analysis is applied to reduce the set of attributes. Finally, the obtained features are fed to the linear discriminant analysis for classification. The applied method achieved an 88.08% accuracy rate.
Deep learning-based malware detection: Malware can be classified based on its texture, text, or a combination of both. Furthermore, some researchers have used a CNN model to classify malware images without using unique characteristics with descriptors. AdStop, a machine learning-based technique for detecting malware in network traffic, was first presented in [25] by Alani et al. Textual features and a multi-layer perceptron were used in the suggested technique to accurately categorise malware. By combining latent Dirichlet allocation and hierarchical clustering, Acharya et al. [26] established a method for extracting clusters. They relied on a Convolutional Neural Network (CNN) model that has a 98.3% accuracy rate to categorise malware. Texture features have been incorporated in the CNN and TCN models for malware classification in [26,27,28,29]. Without first picking out the unique features using descriptors, the suggested deep learning models gather the malware images directly for classification. Classification of malware based on textual features has been explored using the multi-layer perceptron (MLP), gradient boosting, and ensemble approaches [25,30,31]. We present here different techniques for malware classification that make use of different image-based features.
Robert et al. [32] proposed a method for malware traffic analysis using NN and binary visualization. The system is used to classify new zero-day malware in less time. They employed CNN as a classifier. The system consists of three subsystems: first, sniffer-based network traffic collection. Secondly, an ASCII-based 2D traffic visualisation of collected traffic. Finally, TensorFlow NN traffic analysis was used to analyse the produced images against the trained module. They employed the MobileNet algorithm for the training phase. The problems with this approach are the limited training and testing that used samples and did not consider encrypted traffic. They achieved an accuracy of 91.32%. Bendiab et al. [14] employed a deep learning and visual representation approach to identify malicious network traffic in the IoT environment quickly. They applied transfer learning with a 50-layer CovNet. They evaluate the system on 1000 pcap files representing normal and malware traffic. The pcap files are converted images with the aid of the Binvis visualizer tool. They achieve an accuracy of 94.5%. The limitation is the low predictive accuracy rate due to small test and training samples.
Kalash et al. [33] designed a deep CNN model for malware categorization from malware binary files. First, the malware binaries are visualised as grayscale images, and then a CNN architecture is applied for classification. The applied method randomly selects 10% of instances per cycle to evaluate the malware family. On the Malimg and Microsoft datasets, their proposed model achieved 98.52% and 99.97% accuracy, respectively. Cui et al. [34] proposed a framework that detects malicious code using CNNs. The proposed method converted malicious code binaries into fixed-size grayscale images. Then, the CNNs are utilised to classify the mapped images. A genetic-based sorting algorithm is employed to overcome dataset imbalance in malware files. Experiments report 97.6% classification accuracy. Akarsh et al. [35] proposed a malware categorization technique that is based on a feedforward deep learning architecture (CNN) and a recurrent neural network architecture (LSTM). The proposed method converted malware into images. Then, the images are flattened to be transformed into one-dimensional vectors. The vectors act as an input to the CNN layer, followed by an LSTM layer and a fully connected classification layer. The results obtained showed an accuracy of 94.4%.
Wang et al. [36] applied a method that helped in lowering the cost of feature engineering and improving the malware analysis ecosystem for detecting zero-day threats. The attacker uses several evasion methods and recycles the code to create new forms of polymorphic and metamorphic malware. Deep learning-based detection models are developed by first extracting and processing low-level image characteristics based on intensity and textual information.
Moti et al. [37] proposed a framework for discovering and creating new malware samples from the raw byte code at the edge layer of IoT networks. High-level characteristics were extracted using a Convolutional Neural Network (CNN), and new mal-ware samples were generated using a boundary-seeking Generative Adversarial Net-work approach. They used an attention-based model, comprised of CNN and LSTM, to identify the features’ temporal dependence. Standard Windows malware and Internet of Things malware datasets are used to test the suggested technique.
Asam [38] proposed an architecture to detect malware based on CNN (iMDA) which integrates numerous feature learning strategies in blocks, including edge exploration and smoothing, channel squeezing and boosting in CNN, and multipath dilated convolutional operations, in order to learn a wide collection of features. Edge and smoothing techniques are used to understand the local structural differences that exist within malware classes, while its global structure is detected by the multi-path dilated convolutional technique.
Marin et al. [39] released research with the goal of removing designed characteristics and, by extension, the requirement for domain experts. They reintroduced two methods for detecting malware based on packet content: raw packets and raw flows. To get there, they fed raw byte-streams from pcaps into a deep learning model they were training. The ML model they used was a hybrid of LSTM and a 1D convolutional neural network. Compared to the byte-stream of a packet, the raw byte-stream of flow fared better (98.6 percent accuracy). Conventional feature-based models and raw byte-based models were tested side by side in a comparison experiment. The standard model was trained with a random forest (RF) using data from 200 incoming features. Each of the raw-byte-based models outperformed RF. For the purpose of classifying malware based on network-to-image relationships, the Falcon technique was presented by Xu et al. [40]. When it comes to categorising network traffic, each network packet is handled as a two-dimensional image. They processed two-dimensional images using a bidirectional LSTM network in order to produce significant vectors for the categorization of malware. The suggested technique yields a categorization of malicious software that is 97.16% accurate.
Ullah et al. [41] presented a transfer learning-based malware detection system. Their detection method uses textual and visual characteristics. The Bidirectional Encoder Representations from Transformers (BERT) model was pre-trained to extract trained textual characteristics. Second, the malware-to-image conversion technique would visualise network byte streams. FAST and BRIEF were also utilised to effectively extract and mark significant characteristics. Third, the training and texture features were mixed and balanced using Synthetic Minority Over-Sampling (SMOTE), and then the CNN network mined deep features. The ensemble model classified and detected malware using balanced features. Additionally, Ullah et al. [42] improved prediction time and accuracy by using a hybrid multimodel image representation for malware classification. —Their multimodel strategy achieved between 98% and 99.4% accuracy across two distinct collections of malware samples. They used textual and texture aspects of network traffic to maximise their benefits. Transfer learning initially extracts trained vocabulary from network flow. For data traffic visualisation, the malware-to-image technique visualises network bytes. Following that, malware image texture features (ORBs) are extracted using scale-invariant feature transformations (SIFTs) and oriented fast and rotated brief transforms. A CNN also extracts deep features from learned vocabulary and texture characteristics. Finally, a textual-texture ensemble model classifies and detects malware.
Saridou et al. [43] proposed a fast binary visualisation approach using the Fuzzy Set theory and the H-indexing space-filling curve to detect malware. Their technique assigns distinct colour tones to a byte, allowing it to be impacted by neighbouring values while retaining optimal locality indexing. GRNET’s High-Performance Computing services tested the applied technique. It was also compared to binary-visualized machine learning-based detection applications. Despite poor tuning, SAGMAD achieved 91.94% accuracy, 90.63% precision, 92.7% recall, and an F-score of 91.61%.
From the above discussion and Table 1, it could be concluded that there are two main problems in the literature. Firstly, accuracy was the only evaluation metric used to evaluate the proposed methods; see [15,17,22,23]. To evaluate malware detection systems, accuracy could be misleading. Other evaluation metrics, such as recall, precision, and F1-score, should be used to thoroughly evaluate such systems. Secondly, other papers [15,16,32,33,34,35] have used deep learning models. However, most recently, a study [28] showed that deep learning-based solutions could improve performance, but this came at a massive computational cost. Given the limited computational capabilities of the IoT-based systems compared with the business systems, deep-learning-based solutions would not be sustainable in IoT environments such as smart cities, smart homes, smart hospitals, etc. Additionally, transfer learning models suffer from two problems for image classification: negative transfer and overfitting applications, as discussed in the Introduction section.
This research effort has gone further than a prior study that suggested an optimized-based machine learning framework for malware detection. This work is distinct from other research work that has been done in the past. We presented a novel and unified approach to the categorization of input packets into normal and malicious classes. In order to detect unknown malware samples, our technique leveraged a fine-tuned machine learning model that utilised different hand-crafted statistical methods for feature extraction, the ACO algorithm for feature selection, and PSO-based SVM classification. The model was trained using an image-based dataset [14]. The findings of our experiments demonstrated that the proposed model achieved acceptable detection performance, taking different indicators such as accuracy, F1 score, precision, and recall into consideration.

3. Work Preliminaries

This section gives an overview of the algorithms and techniques (Ant Colony Optimization (ACO), Particle Swarm Optimization (PSO), and Support Vector Machine (SVM)) used in the proposed malware detection system.

3.1. Ant Colony Optimization

Ant colony optimization (ACO) [45] is one of the well-known metaheuristic optimization algorithms. Its main idea is based on the food-gathering behavior of ants, and it is a branch of swarm intelligence. Ants can identify the shortest path between food and their nest without direct communication or visual information. The ant deposits a chemical substance called a pheromone to mark its route between the food source and the nest. Probabilistically, each ant chooses to travel in a direction with a lot of this chemical. After some time, however, the pheromone degrades, leaving less of it on less widespread roads. Additionally, the fundamental factor that allows real ants to locate the shortest paths over time is mostly due to pheromone deposition. The shortest route will be reinforced over time, while the others will be weakened until all ants take the same shortest way. The ACO algorithm is a highly successful method for determining the optimal subsets in feature selection problems. The ant colony optimization feature selection works as follow: There are initially an infinite number of ants (k), each with a random starting feature. To traverse the search space, each ant must follow the probabilistic transition rule described in Equation (1):
a i j = [ τ i j ] α   .   [ η i j ] β l ϵ N i [ τ i j ] α   .   [ η i j ] β               j N i
Here, the ant is in node i, ηij is the heuristic desirability of choosing feature j when at feature i, τij is the amount of pheromone in the i to j path, Ni is the set of neighboring nodes from the node i, and parameters α and β are constants that establish a pheromone’s relative importance and heuristic information, respectively. To choose which node j to visit after node i, the kth ant uses the likelihood of moving between nodes as. Shown in Equation (2):
p i j k ( t ) = a i j ( t ) l ϵ N i a i j ( t )
ηij is the heuristic information and it is given by Equation (3):
η i j = 1 d i j
where dij represents the distance between node i and node j.
The pheromone values are updated after each iteration by the k ants that have created solutions during that iteration. The pheromone τij, which is linked to the path between vertices i and j, is updated as shown in Equation (4):
τ i j ( 1 ρ ) τ i j + k = 1 m τ i j k
where ρ is the evaporation rate, k is the number of ants, and (τij)k is the quantity of pheromone laid on edge (i,j) by ant k, where τ i j k is defined in Equation (5):
τ i j k = { Q l k i f   a n t   u s e d   e d g e   ( i   ,   j ) i n   i t s   t o u r 0   o t h e r w i s e
where Q is constant, and Lk is the length of the tour established by ant k.

3.2. Particle Swarm Optimization (PSO)

PSO is another effective metaheuristic optimization algorithm frequently employed to address optimization problems [46]. PSO solves such problems by iteratively optimizing a solution in terms of some quality metric by generating a swarm of particles to randomly probe the search region. Particle swarm optimization (PSO) techniques find the best answer through communication and cooperation between a collection of particles. In PSO, a group of particles is called a “swarm”. Currently known position, velocity, and best-guess position are all stored in the vector representation of each particle. Each particle’s position and velocity are initialized, and then their current position and performance score are calculated. After calculating the position and the current global ideal location, the next iteration adjusts each particle’s velocity based on those data. Next, the particles move along the new vectors of velocity. If the iterations fail to converge or terminate according to some predetermined condition, they will be repeated until they accomplish this [46].

3.3. Support Vector Machines

The Support Vector Machine [47] is a well-known classifier from the linear machine learning approach. It is designed based on the statistical learning theory. Even though it does not require prior knowledge, SVM demonstrates excellent generalization abilities. Furthermore, it is not affected by the local minimum and can deal with noisy datasets, among other things. These characteristics make the SVM classifier a good machine-learning technique for creating an effective malware detection system.
After training on labeled inputs of two classes, for each given input, the SVM can classify (using a binary linear classifier) them into two possible classes as output. Figure 1 shows an example of the SVM classification technique. As illustrated in Figure 1, an SVM model shows the instances as points in space, arranged to divide the individual categories by a distinct gap as large as feasible. Such that stars, triangles, and parallelogram shapes represent points belongs to different categories. Then, new examples are plotted into the same space and assigned to a category based on which side of the gap they lie on. SVMs may also efficiently conduct nonlinear classification by utilizing the kernel method. SVM predicts whether fresh data belongs to the attack group or the normal data group [47].

4. The Proposed IoT Malware Detection System

The proposed image-based IoT malware detection method using machine learning consists of four phases: pre-processing, feature extraction, feature selection, and classification. These phases are briefly described in Figure 2 below.

4.1. Pre-Processing Phase

To prepare the data for detection, two processes have been done. Firstly, the network traffic is converted into a Pcap format, and using the Binvis tool [35], the Pcap file is converted into 2D RGB images. Figure 3 shows an example of normal and abnormal pcap files [16]. Secondly, the imbalance problem of the data was addressed. Generally, malware detection is one of the application domains where the data is not balanced [48]. As described below in Section 5.1, the used dataset is not balanced where the normal images (338 images) are nearly 70% of the malicious images (512 images). Using such unbalanced data would lead to biased learning during the classification process. As reported in [44,48], it is possible that such biased learning would result from training on unbalanced data. We used the SMOTE algorithm [49] to handle the imbalanced data to address this problem. The SMOTE algorithm is used during the training phase only.
Generally, the imbalanced data problem could be solved at the data level in two ways: undersampling or oversampling. In random under-sampling, samples are randomly deleted from the majority class until there is a balance between this class and the minority class. This will lead to data loss, i.e., knowledge will not be used to its maximum potential. On the other hand, the minority class will be increased by randomly replicating its samples in random oversampling. However, this could cause an overfitting problem. The SMOTE algorithm is used in this study to avoid these two problems because it duplicates samples in the minority class and augments this class with new samples, thus addressing the overfitting problem.
The training data (i.e., 80%) has been given to the SMOTE algorithm to handle the imbalanced data (i.e., to increase the number of training sets for minority classes to alleviate class imbalance). The imbalanced data were first divided into 80% and 20% training and testing sets, respectively. Then the training was conducted, and its results were reported later.

4.2. Feature Extraction Phase

One of the essential approaches used in the study and classification of images displaying repetition or quasi-repetition of key features is texture analysis, a fundamental step in the comprehension and description of natural imagery. The extraction of texture features that fully encompass information about the spatial distribution of intensity variations in the original image is the first and most critical stage in texture analysis. Normal and malicious photos share texture characteristics. Malware image features contain black (Null Bytes) or white areas (Spaces) predominate, as shown in Figure 3. On the other hand, normal traffic can be identified by spreading ASCII characters or colors over the image. Each of the 858 malware images was subjected to a set of four statistical texture features: an intensity histogram, a gray-level co-occurrence matrix (GLCM), a gray-level run-length matrix (GLRLM), and invariant moments.

4.3. Feature Selection Phase

Feature Selection (FS) is a typical stage in machine learning, particularly when a high-dimensional space of features is involved [50]. As the name suggests, feature selection aims at lowering the dimensionality of the whole extracted features by discovering the most significant features subset without compromising the accuracy of the classification process [51]. In other words, the classification rate may be improved by adding more features but selecting the most relevant features to your model is more important. Furthermore, as the number of features increases, the number of training samples required to train a classifier to a specific degree of accuracy grows exponentially. As a result, unnecessary features must be removed, and the most appropriate features must be chosen. We used Ant colony optimization for feature selection. We selected 23 features from 46 features.

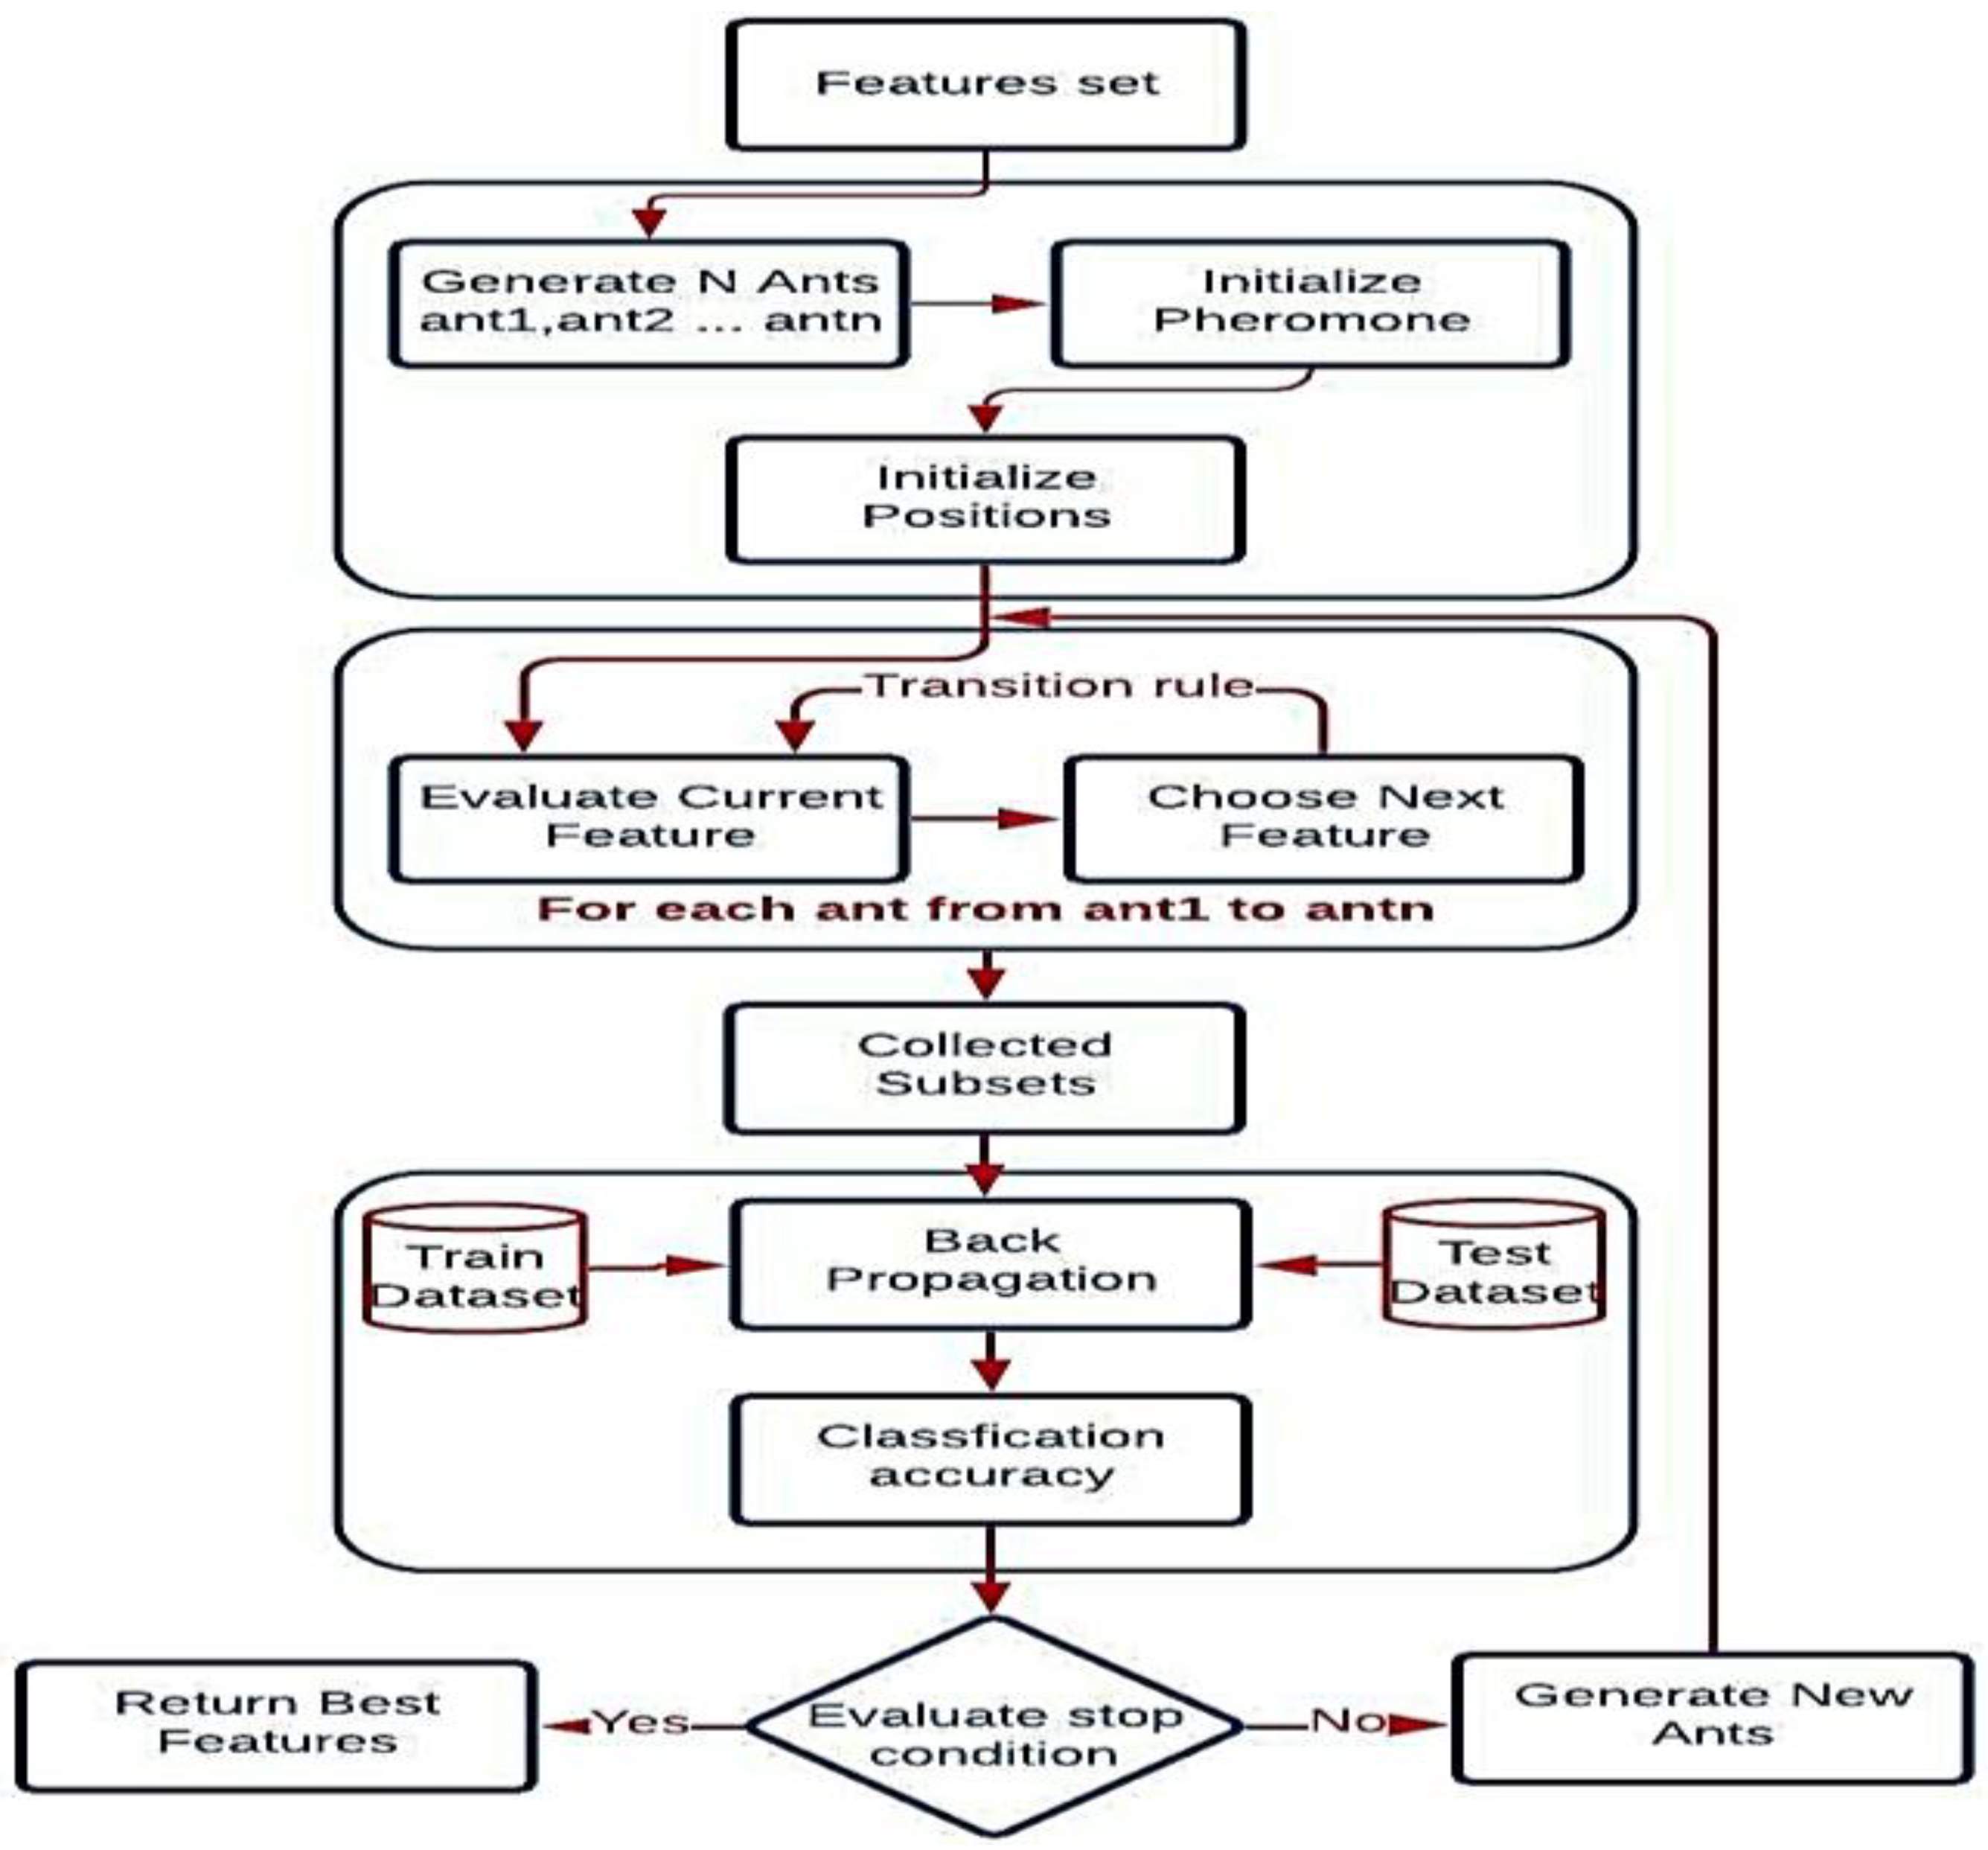
4.3.1. Feature Selection Using ACO

The main purpose of ACO algorithm is to choose more informative features from the extracted feature set and lower the problem space’s dimension. With the ACO algorithm, we can probe the space of all possible feature subsets. To assess how well various feature subsets perform in classification tasks, we run an evaluation function on the constrained feature set [52,53]. Figure 4 depicts the full feature selection procedure for ACOs. The procedure begins with the generation of a number of ants, m, which are then distributed arbitrarily around the graph; each ant is given a single random trait at the beginning. Another possibility is that there are as many ants on the graph as there are features in the data, with each ant beginning its path creation somewhere distinct from the others. This probabilistic traversal continues until a stopping condition is met. As a result of these iterations, subsets are generated and gathered for evaluation. The process continues until the optimal subset is found or a predefined number of iterations are reached. Then the resulting optimal feature subset will be used for the classification stage. In case none of these conditions are satisfied, the pheromone is updated, and the process continues with a newly generated set of ants.

4.3.2. Fitness Function

Evaluating the ant’s feature subset is a crucial part of the ACO feature selection procedure. In order to maximise the classifier’s predictive power, it is important to evaluate how well it does that task. To weigh the pros and cons of the ants’ chosen traits, a fitness function is developed. The fitness value is calculated based on the test set’s mean of square error (MSE). The fitness function is shown in Equation (6), where f(x) is the fitness value, yk is the model’s output, zk is the reference output, and N denotes the test set samples.
f ( x ) = 1 N 1 N ( y k z k ) 2

4.4. PSO-Based SVM Classification Phase

Recently, the Support Vector Machine has become one of the most prominent algorithms for anomalous malware detection as a result of its ability to overcome the curse of dimensionality. A further advantage of SVM is that it is effective for locating a global minimum of the significant risk through structural risk reduction since it generalizes well with kernel techniques even in high-dimensional spaces under conditions of limited training samples. One of the SVM classifier’s strong advantages is that it allowed us to circumvent the challenge of over-fitting because of its strong generalisation capabilities. Moreover, the SVM performs well when there is a reasonable gap in dissimilarity across classes. The SVM’s Convex Optimization nature also aids in achieving the best possible outcomes. The SVM can identify malware in real-time, hence the speed of the SVM is one of its primary advantages for IDS. SVMs may learn a bigger collection of patterns and scale better since classification difficulty is not dependent on the size of the feature space. SVMs are also capable of dynamically updating training patterns if a new pattern is encountered during classification [54].
For the aforementioned advantages, SVM is the classification algorithm applied in our method. After the feature extraction process from the images, the SVM uses the features selected as input. A support vector machine is utilized to perform image categorization, and this is done by finding a hyperplane that separates positive and negative classes. Kernel functions are used to translate the training data to a higher-dimensional space. Support Vector Machine (SVM) finds the hyperplane with optimum separation between classes in the new higher-dimensional space.
The optimal combination of SVM parameters plays a crucial role in the way that samples are distributed across a particular search space. The penalty parameter C and the kernel function parameter, such as gamma, have significant effects on the SVM’s performance. In our proposed methodology, we used PSO to optimize SVM detection capability. To select the hyperparameters of an SVM using PSO, a cost function must be created [55]. The primary objective of hyperparameter selection is to increase the performance of SVM classification. The cost function therefore should be a performance metric, such as accuracy or F1-score. As the SVM is more likely to categorize all samples in the positive class (to enhance specificity) or the negative class (to increase sensitivity), sensitivity and specificity are unsuitable measurements (to improve sensitivity) [55,56]. Then. we utilized accuracy as the cost function in this work. An accuracy of 1 denotes ideal classification; hence, PSO selects hyperparameters that optimize the SVM accuracy.

5. Experiments and Results

This section presents the experiments designed to evaluate the proposed method above. Firstly, it describes the dataset, evaluation metrics, conducted experiments, results, and discussion.

5.1. Dataset Description

The converted Pcap images are imported from a publicly available dataset [14] which, consists of 858 Binvis images (in binary visualization format, .PNG) of legitimate (338 images) and malicious (512 images) traffic obtained from various network traffic sources. The legitimate PCAP files contain a portion of the regular traffic recorded throughout the Cyber-trust project’s development network, as well as additional sources. The malware’s pcap files contain authentic malicious traffic created due to several forms of attacks, including trojans, botnets, attacks against the Internet of Things (OS scans, spyware, DDoS, Key loggers), backdoors, and so forth. For more details about the dataset [14]. Figure 5 shows the percentage of malicious traffic samples of the whole dataset.

5.2. Evaluation Metrics

Four evaluation metrics are used to test the performance of the proposed method. The accuracy, precision, recall, and F-score are the evaluation metrics used. The accuracy metric refers to the proportion of successfully categorized samples that are either normal or malicious. Precision (P) indicates the proportion of positive samples labeled as positive. The recall metric indicates the proportion of normal samples categorized correctly, whereas the F-score is the precision and recall weighted average.
To compute these metrics, True Positive (TP), True Negative (TN), False Positive (FP), and False Negative (FN) are used. TP refers to instances that are correctly classified as malware traffic. TN denotes samples that are correctly identified as normal traffic. FP denotes the instances which are incorrectly organized as malware traffic. Finally, FN refers to occurrences that are incorrectly identified as normal traffic. The equation for each of these metrics is shown in Table 2.

5.3. Results and Discussion

The dataset is divided 80–20% for training and testing, respectively. Then, three experiments were designed and conducted, and the results obtained in the training and testing are summarized in the relative tables below. The k-fold validation method has been used in all training and testing experiments.
Feature selection impact: In the first experiment, to investigate whether the performance of the proposed method would improve using a feature selection technique, we designed two sub-experiments: one without any feature selection and one with feature selection (i.e., ACO). The results of the first experiments, without any feature selection, are given in Table 3 and Table 4, while the effects of using ACO as a feature selector are summarized in Table 5 and Table 6.
From Table 3, we can conclude that using the polynomial kernel achieved an accuracy of 90.63%, recall of 89.10%, precision of 88.64%, and an F1 score of 90.43% after data balancing. While Table 4 shows the result without data balance and the results show an accuracy of 92.22%, recall of 92.98%, precision of 88.24%, and an F1 score of 89.55% using the linear kernel. Table 5 summarises the results of our proposed system after data balancing, and the results show that using a polynomial kernel achieved 90.75%, 89.13%, 88.64%, and 90.54%, respectively, while Table 6 shows results without data balancing as 95%, 95.58%, 92.65%, and 93.33% using a quadratic kernel for accuracy, recall, precision, and F1 score in both balanced and unbalanced data. From the results of the above tables, the following remarks can be noticed. Firstly, generally, the use of the ACO-based feature selection method has improved all results. This means that our method is also an IoT-friendly method of computing power. With fewer features, i.e., less power consumption, malware can be detected. The quadratic function achieved the best results among all SVM kernel functions. Comparing the results of our proposed method and the work in [14], which used the same dataset, it is clear that our method achieved better results while [14] did not handle the imbalance of the dataset as we did.
SVM parameters selection based on PSO: In the second experiment, we aim to find the best values of the SVM parameters using the PSO (Particle swarm optimization). The performance of machine learning (ML) algorithms can be improved by choosing the best parameters’ values that affect their training outcome. This stage inputs the best set of features produced by the feature selection stage using the ant colony optimizer. The parameters selection stage precedes building the ML model, which indicates the significance to get high-accuracy results. This includes selecting the parameters of the ML model, which maximizes the model’s accuracy.
There are different optimization techniques to tune ML models, such as Grid Search, Random Search, Hyperband, and Bayesian Optimization. Swarm-based techniques are another family of optimization approaches to select ML models’ parameters, which are inspired by the social behavior of natural species [57]. This paper utilized Particle swarm optimization (PSO) for ML algorithms parameter selection. A simple technique that models the swarm behavior of birds flocking is used to direct the particles while searching for the optimal solution at the global level [57].
For the parameter values selection, the PSO algorithm works for multiple iterations as follows: firstly, an initial random combination of parameters is generated; secondly, each set of parameters is represented by a particle, then the training process starts; thirdly, the performance of the ML algorithm is evaluated, and the result is reported. The PSO algorithm reaches the optimal solution after a predetermined set of iterations with the help of particle communication. The optimal solution is identified by the parameters that achieve the model’s highest performance.
To thoroughly assess the parameters (Gamma, Cost, and kernel functions) of the SVM classifier, we applied the PSPSO package [58], a PSO-based tool implemented by python, to select the best ML algorithms parameters. We utilized the PSPSO tool to select the support vector machine’s parameters (SVM). The tool uses the Area under the Curve (AUC) and accuracy for model performance assessment. There are three parameters for the SVM algorithm to be optimized: the kernel function, the gamma parameter (g), and the cost parameter (c). The gamma parameter is ignored if the linear function is selected as the kernel function. The polynomial kernel function includes an extra degree parameter ignored by all kernels [58]. The initial values of the SVM parameters that we used are shown in Table 7.
The hyperparameter tuning experiments are performed using 5 particles and 10 iterations on the features selected by the ACO. This experiment showed that the best results, shown in Table 8, are obtained when the C = 21, Gamma = 3, and the kernel function = Linear. Comparing the results in Table 6 and Table 8, two remarks can be noticed. Firstly, using the PSO in determining the best values of the SVM classifier can help to improve its performance by around 2% in all evaluation metrics when using the linear function as its kernel. Secondly, SVM with linear function gave better results than with quadratic function, which gave the best without using PSO (Refer to Table 6).

5.4. Comparison with Literature

We compared the related work summarized in Table 1 to further evaluate our proposed method. The comparison was in terms of two factors: used evaluation metrics and used machine learning approach (either deep learning or traditional machine learning).
To evaluate malware detection systems, accuracy could be misleading. Therefore, other evaluation metrics, Recall, Precision, and F1-score, are used to evaluate such a system thoroughly. The recall is a measure that finds the percentage of known harmful packets or files already detected by an intrusion/malware detection system. Precision is another measure that aims to quantify the effectiveness of a malware detection system to recognize malicious packets/applications/files that are malware. The F1-score is a measure that takes recall and precision as inputs and then equally weights them. A good malware detection system can maximize both of them simultaneously rather than making one exceptionally good and poor on the other.
Authors in [15,22] have used machine learning algorithms, i.e., SVM, and achieved accuracy better than our proposed method. However, they did not use other important measures (Recall, Precision, and F1-score) to evaluate the effectiveness of the proposed methods. The cost of a false positive may be different from the cost of a false negative in the used dataset. When they coincide, opting for precision is preferable. However, if they are different, we must look at the F1-score. Precision is also an important performance metric that needs to be considered since it is utilized to determine how well the model can identify positive values. Recall is also mandatory because it measures the capability of a classifier to correctly label all instances that belong to a given category. As shown in Table 8, the accuracy, recall, Precision, and F1-score have been used in our method. The results of these measures are around 95% which shows there is harmony between these measures. Consequently, proving the effectiveness of our proposed method over the work in [15,22]. This also implies that our algorithm balances false negatives and false positives. The rest of the work, which used machine learning algorithms, i.e., [17,23], did not use the metrics recall, recall, precision, and F1-score, to evaluate the effectiveness of the proposed methods. So, it is hard to fairly compare them with our method, which used these measures as shown above. Table 9 presents a summary of this comparison.

5.5. Deep Learning vs. Classical Machine Learning in IDS

Deep learning has many applications, such as image recognition, prediction, medical imaging, and so on, where it has been shown to improve performance significantly more than traditional machine learning. However, recently this year (2021), a study [18] showed that the improvement in performance (i.e., accuracy) comes at a massive computational cost. It was reported that traditional businesses, such as European supermarkets, have relinquished deep-learning-based systems due to the high computational power needed to train and run these systems [18]. Given the limited computational capabilities of the IoT-based systems compared with the business systems, deep-learning-based solutions would not be sustainable in IoT environments such as smart cities, smart homes, smart hospitals, etc. This means that machine-learning-based systems would be more suitable and sustainable for the IoT environment. The main focus would then be on how to improve the performance of these systems.
As the main goal of most malware detection models is to increase detection accuracy, there are other factors to consider when detecting malware in an IoT environment. A trade-off exists between accuracy and time complexity (i.e., better convergence necessitates longer times), between accuracy and analysis speed (i.e., larger times imply slower pace), between analysis speed and computational resources (i.e., faster analysis requires using more resources), and between computational resources and financial cost (more resource devices has a cost). Using n features as an example, it has been proven that increasing the number of n features improves the accuracy of the analysis, but at the expense of the feature space, which grows exponentially with n. A high degree of accuracy may also be achieved by using more data in general to train machine learning models. Our method maintains the traditional trade-offs between anomaly detection accuracy, runtime, analysis speed, and computational resource requirements. It is crucial to track and investigate the relations between n features, accuracy, and speed of execution. The proposed method leverages the lightweight nature of the optimised machine learning approach, compared to a deep learning approach, with a reduced feature set to improve the performance of detection. This makes the proposed approach suitable for highly constrained and compromised IoT devices.
Additionally, applying classical methods for feature extraction using algorithms such as intensity histogram, gray-level co-occurrence matrix (GLCM), gray-level run-length matrix (GLRLM), and invariant moments in our case, highlight certain features in data, and not image-type specific; rather, they are quite generic in nature. Deep neural network features, on the other hand, are highly dependent on the quality of the training dataset and are unlikely to generalize well to new images [59].
As shown earlier, the proposed malware detection method achieved an accuracy of 95.56%, a sensitivity of 96.43%, a specificity of 94.12%, a precision of 94.12%, and an F1 score of 95.26%. After turning its PSO algorithm parameters, these results were accomplished using the traditional machine learning technique (i.e., SVM). Compared with all the related deep learning work summarized in Table 1, it could be remarked that our proposed method achieved better than the work in [14,16,32,35]. There are two studies [33,34] that achieved better results (i.e., accuracy) than ours. However, in addition to using the heavy technique (deep learning), the work in [33] only used the accuracy metric to measure the performance, and this would not be enough to judge the performance of a malware detection system. Although the work in [34] used the metrics of recall and precision, our results are better than those using these metrics.

6. Conclusions

This paper proposed a novel malware detection method for the IoT environment using a visual representation of the network traffic. This method employed a statistical feature extraction method and an ACO-based feature selection approach, which helped to improve the classification results using SVM. Further, the PSO algorithm was used to find the best values of the parameters of the SVM classifier, which further improved the classification performance. Experiments and comparisons with all SVM kernel functions revealed that the quadratic kernel function performed the best in detecting malware network traffic represented as images, with an overall accuracy of 95%. When the PSO algorithm tuned SVM parameters, it was found that the linear function is the best with an accuracy of 95.56%, a recall of 96.43%, a precision of 94.12%, and an F1 score of 95.26%. These results are comparable with the literature using deep learning techniques but better in terms of the computational cost as the proposed method only adopted traditional machine learning, i.e., SVM. The main limitation of this work is that the experiments are conducted on a single dataset and not using a deep learning approach as a feature selector method. In the future, the proposed method could be tested on different forms of image-based datasets which include colored and grey-scale transformed images. Additionally, a deep learning approach could be used to extract features that are then used by classical shallow machine learning algorithms to detect malware network traffic. Numerical features can also be compared with image-based features for deeper analysis.

Author Contributions

Conceptualization, T.G. and A.E.H.; Data curation, K.K.M.; Formal analysis, A.E.H.; Investigation, T.G. and K.K.M.; Methodology, A.E.-G. and T.G.; Resources, A.E.H.; Software, A.E.-G. and K.K.M.; Supervision, A.E.H.; Validation, A.E.-G.; Visualization, A.E.-G. and K.K.M.; Writing—original draft, A.E.-G. and T.G.; Writing—review & editing, T.G. All authors have read and agreed to the published version of the manuscript.

Funding

This research received no external funding.

Institutional Review Board Statement

Not applicable.

Informed Consent Statement

Not applicable.

Data Availability Statement

The dataset is publicly available in reference [14].

Conflicts of Interest

The authors declare no conflict of interest.

References

  1. Nobakht, M.; Sivaraman, V.; Boreli, R. A Host-Based Intrusion Detection and Mitigation Framework for Smart Home IoT Using Openflow. In Proceedings of the 2016 11th International Conference on Availability, Reliability and Security (ARES), Salzburg, Austria, 31 August–2 September 2016; pp. 147–156. [Google Scholar]
  2. Statista Research Department. Internet of Things (IoT) Connected Devices Installed Base Worldwide from 2015 to 2025 (In Billions). Available online: https://bit.ly/2DhYEL0 (accessed on 25 November 2019).
  3. Salloum, S.; Gaber, T.; Vadera, S.; Shaalan, K. Phishing email detection using natural language processing techniques: A literature survey. Procedia Comput. Sci. 2021, 189, 19–28. [Google Scholar] [CrossRef]
  4. Avast. Avast Smart Home Security Report 2019. Available online: https://bit.ly/2pOSf70 (accessed on 25 November 2019).
  5. Antonakakis, M.; April, T.; Bailey, M.; Bernhard, M.; Bursztein, E.; Cochran, J.; Durumeric, Z.; Halderman, J.A.; Invernizzi, L.; Kallitsis, M.; et al. Understanding the Mirai Botnet. In Proceedings of the 26th USENIX Security Symposium (USENIX Security 17), Vancouver, BC, Canda, 16–18 August 2017; pp. 1093–1110. [Google Scholar]
  6. Kolias, C.; Kambourakis, G.; Stavrou, A.; Voas, J. DDos in the IoT: Mirai and other botnets. Computer 2017, 50, 80–84. [Google Scholar] [CrossRef]
  7. Kambourakis, G.; Kolias, C.; Stavrou, A. The Mirai Botnet and the IoT Zombie Armies. In Proceedings of the MILCOM 2017–2017 IEEE Military Communications Conference (MILCOM), Baltimore, MD, USA, 23–25 October 2017; pp. 267–272. [Google Scholar]
  8. Madan, S.; Sofat, S.; Bansal, D. Tools and Techniques for Collection and Analysis of Internet-of-Things malware: A systematic state-of-art review. J. King Saud Univ. Comput. Inf. 2022, 34, 9867–9888. [Google Scholar] [CrossRef]
  9. Gaber, T.; El-Ghamry, A.; Hassanien, A.E. Injection attack detection using machine learning for smart IoT applications. Phys. Commun. 2022, 52, 101685. [Google Scholar] [CrossRef]
  10. Intrusion Detection and Prevention Systems. Available online: https://bit.ly/37Bxvki (accessed on 25 November 2019).
  11. Keegan, N.; Ji, S.Y.; Chaudhary, A.; Concolato, C.; Yu, B.; Jeong, D.H. A survey of cloud-based network intrusion detection analysis. Hum. Cent. Comput. Inf. Sci. 2016, 6, 19. [Google Scholar] [CrossRef] [Green Version]
  12. Kwon, D.; Kim, H.; Kim, J.; Suh, S.C.; Kim, I.; Kim, K.J. A survey of deep learning-based network anomaly detection. Clust. Comput. 2019, 22, 949–961. [Google Scholar] [CrossRef]
  13. Baptista, I. Binary visualization for malware detection. Plymouth Stud. Sci. 2018, 11, 223–237. [Google Scholar]
  14. Bendiab, G.; Shiaeles, S.; Alruban, A.; Kolokotronis, N. IoT Malware Network Traffic Classification Using Visual Representation and Deep Learning. In Proceedings of the 2020 6th IEEE Conference on Network Softwarization (NetSoft), Ghent, Belgium, 29 June–3 July 2020; pp. 444–449. [Google Scholar]
  15. Naeem, H.; Guo, B.; Naeem, M.R. A Lightweight Malware Static Visual Analysis for IoT Infrastructure. In Proceedings of the 2018 International Conference on Artificial Intelligence and Big Data (ICAIBD), Chengdu, China, 26–28 May 2018; pp. 240–244. [Google Scholar]
  16. Su, J.; Vasconcellos, D.V.; Prasad, S.; Sgandurra, D.; Feng, Y.; Sakurai, K. Lightweight Classification of IoT Malware Based on Image Recognition. In Proceedings of the 2018 IEEE 42Nd Annual Computer Software and Applications Conference (COMPSAC), Tokyo, Japan, 23–27 July 2018; Volume 2, pp. 664–669. [Google Scholar]
  17. Han, K.S.; Lim, J.H.; Kang, B.; Im, E.G. Malware analysis using visualized images and entropy graphs. Int. J. Inf. Secur. 2015, 14, 1–4. [Google Scholar] [CrossRef]
  18. Thompson, N.C.; Greenewald, K.; Lee, K.; Manso, G.F. Deep Learning’s Diminishing Returns: The Cost of Improvement is Becoming Unsustainable. IEEE Spectr. 2021, 58, 50–55. [Google Scholar] [CrossRef]
  19. Agarwal, N.; Sondhi, A.; Chopra, K.; Singh, G. Transfer Learning: Survey and Classification. In Smart Innovations in Communication and Computational Sciences; Advances in Intelligent Systems and Computing; Springer: Berlin/Heidelberg, Germany, 2021; pp. 145–155. [Google Scholar]
  20. Niu, S.; Liu, Y.; Wang, J.; Song, H. A decade survey of transfer learning (2010–2020). IEEE Trans. Artif. Intell. 2020, 1, 151–166. [Google Scholar] [CrossRef]
  21. Nataraj, L.; Yegneswaran, V.; Porras, P.; Zhang, J. A Comparative Assessment of Malware Classification Using Binary Texture Analysis and Dynamic Analysis. In Proceedings of the 4th ACM Workshop on Security and Artificial Intelligence 2011, Chicago, IL, USA, 21 October 2011; pp. 21–30. [Google Scholar]
  22. Makandar, A.; Patrot, A. Malware Class Recognition Using Image Processing Techniques. In Proceedings of the 2017 International Conference on Data Management, Analytics and Innovation (ICDMAI), Pune, India, 24–26 February 2017; pp. 76–80. [Google Scholar]
  23. Liu, L.; Wang, B. Malware Classification Using Gray-Scale Images and Ensemble Learning. In Proceedings of the 2016 3rd International Conference on Systems and Informatics (ICSAI), Shanghai, China, 19–21 November 2016; pp. 1018–1022. [Google Scholar]
  24. Tuncer, T.; Ertam, F.; Dogan, S. Automated malware identification method using image descriptors and singular value decomposition. Multimed. Tools Appl. 2021, 80, 10881–10900. [Google Scholar] [CrossRef]
  25. Alani, M.M.; Awad, A.I. AdStop: Efficient flow-based mobile adware detection using machine learning. Comput. Secur. 2022, 117, 102718. [Google Scholar] [CrossRef]
  26. Acharya, S.; Rawat, U.; Bhatnagar, R. A Low Computational Cost Method for Mobile Malware Detection Using Transfer Learning and Familial Classification Using Topic Modelling. Appl. Comput. Intell. Soft Comput. 2022, 2022, 4119500. [Google Scholar] [CrossRef]
  27. Zhang, W.; Luktarhan, N.; Ding, C.; Lu, B. Android malware detection using TCN with bytecode image. Symmetry 2021, 13, 1107. [Google Scholar] [CrossRef]
  28. Al-Fawa’reh, M.; Saif, A.; Jafar, M.T.; Elhassan, A. Malware Detection by Eating a Whole APK. In Proceedings of the 2020 15th International Conference for Internet Technology and Secured Transactions (ICITST), London, UK, 8–10 December 2020; pp. 1–7. [Google Scholar]
  29. Peng, T.; Hu, B.; Liu, J.; Huang, J.; Zhang, Z.; He, R.; Hu, X. A Lightweight Multi-Source Fast Android Malware Detection Model. Appl. Sci. 2022, 12, 5394. [Google Scholar] [CrossRef]
  30. Hadiprakoso, R.B.; Kabetta, H.; Buana, I.K.S. Hybrid-Based Malware Analysis for Effective and Efficiency Android Malware Detection. In Proceedings of the 2020 International Conference on Informatics, Multimedia, Cyber and Information System (ICIMCIS), Jakarta, Indonesia, 19–20 November 2020; pp. 8–12. [Google Scholar]
  31. Mahdavifar, S.; Kadir, A.F.A.; Fatemi, R.; Alhadidi, D.; Ghorbani, A.A. Dynamic Android Malware Category Classification Using Semi-Supervised Deep Learning. In Proceedings of the 2020 IEEE Intl Conf on Dependable, Autonomic and Secure Computing, Intl Conf on Pervasive Intelligence and Computing, Intl Conf on Cloud and Big Data Computing, Intl Conf on Cyber Science and Technology Congress (DASC/PiCom/CBDCom/CyberSciTech), Calgary, AB, Canada, 17–22 August 2020; pp. 515–522. [Google Scholar]
  32. Shire, R.; Shiaeles, S.; Bendiab, K.; Ghita, B.; Kolokotronis, N. Malware Squid: A Novel IoT Malware Traffic Analysis Framework Using Convolutional Neural Network and Binary Visualization. In Internet of Things, Smart Spaces, and Next Generation Networks and Systems; Springer: Cham, Switzerland, 2019; pp. 65–76. [Google Scholar]
  33. Kalash, M.; Rochan, M.; Mohammed, N.; Bruce, N.D.; Wang, Y.; Iqbal, F. Malware Classification with Deep Convolutional Neural Networks. In Proceedings of the 2018 9th IFIP International Conference on New Technologies, Mobility and Security (NTMS), Paris, France, 26–28 February 2018; pp. 1–5. [Google Scholar]
  34. Cui, Z.; Du, L.; Wang, P.; Cai, X.; Zhang, W. Malicious code detection based on CNNs and multi-objective algorithm. J. Parallel Distrib. Comput. 2019, 129, 50–58. [Google Scholar] [CrossRef]
  35. Akarsh, S.; Simran, K.; Poornachandran, P.; Menon, V.K.; Soman, K.P. Deep Learning Framework and Visualization for Malware Classification. In Proceedings of the 2019 5th International Conference on Advanced Computing & Communication Systems (ICACCS), Coimbatore, India, 15–16 March 2019; pp. 1059–1063. [Google Scholar] [CrossRef]
  36. Wang, C.; Zhao, Z.; Wang, F.; Li, Q. A novel malware detection and family classification scheme for IoT based on DEAM and DenseNet. Secur. Commun. Netw. 2021, 2021, 6658842. [Google Scholar] [CrossRef]
  37. Moti, Z.; Hashemi, S.; Karimipour, H.; Dehghantanha, A.; Jahromi, A.N.; Abdi, L.; Alavi, F. Generative Adversarial Network to Detect Unseen Internet of Things Malware. In Ad Hoc Networks; Elsevier: Amsterdam, The Netherlands, 2021; Volume 122, p. 102591. [Google Scholar]
  38. Asam, M.; Khan, S.H.; Akbar, A.; Bibi, S.; Jamal, T.; Khan, A.; Ghafoor, U.; Bhutta, M.R. IoT malware detection architecture using a novel channel boosted and squeezed CNN. Sci. Rep. 2022, 12, 15498. [Google Scholar] [CrossRef]
  39. Marín, G.; Caasas, P.; Capdehourat, G. Deepmal-Deep Learning Models for Malware Traffic Detection and Classification. In Data Science–Analytics and Applications; Springer Vieweg: Wiesbaden, Germany, 2021; pp. 105–112. [Google Scholar]
  40. Xu, P.; Eckert, C.; Zarras, A. Falcon: Malware Detection and Categorization with Network Traffic Images. In International Conference on Artificial Neural Networks; Springer: Cham, Switzerland, 2021; pp. 117–128. [Google Scholar]
  41. Ullah, F.; Alsirhani, A.; Alshahrani, M.M.; Alomari, A.; Naeem, H.; Shah, S.A. Explainable malware detection system using transformers-based transfer learning and multi-model visual representation. Sensors 2022, 22, 6766. [Google Scholar] [CrossRef] [PubMed]
  42. Ullah, F.; Ullah, S.; Naeem, M.R.; Mostarda, L.; Rho, S.; Cheng, X. Cyber-threat detection system using a hybrid approach of transfer learning and multi-model image representation. Sensors 2022, 22, 5883. [Google Scholar] [CrossRef]
  43. Saridou, B.; Rose, J.R.; Shiaeles, S.; Papadopoulos, B. SAGMAD—A Signature Agnostic Malware Detection System Based on Binary Visualisation and Fuzzy Sets. Electronics 2022, 11, 1044. [Google Scholar] [CrossRef]
  44. Krawczyk, B.; Woźniak, M.; Schaefer, G. Cost-sensitive decision tree ensembles for effective imbalanced classification. Appl. Soft Comput. 2014, 14, 554–562. [Google Scholar] [CrossRef] [Green Version]
  45. Dorigo, M.; Di Caro, G.; Gambardella, L.M. Ant algorithms for discrete optimization. Artif. Life 1999, 5, 137–172. [Google Scholar] [CrossRef] [PubMed] [Green Version]
  46. Kennedy, J.; Eberhart, R. Particle Swarm Optimization. In Proceedings of the ICNN’95—International Conference on Neural Networks, Perth, WA, Australia, 27 November–1 December 1995; Volume 4, pp. 1942–1948. [Google Scholar]
  47. Cortes, C.; Vapnik, V. Support-vector networks. Mach. Learn. 1995, 20, 273–297. [Google Scholar] [CrossRef]
  48. Stefanowski, J. Dealing with Data Difficulty Factors While Learning from Imbalanced Data. In Challenges in Computational Statistics and Data Mining; Springer: Cham, Switzerland, 2016; pp. 333–363. [Google Scholar]
  49. Chawla, N.V.; Bowyer, K.W.; Hall, L.O.; Kegelmeyer, W.P. SMOTE: Synthetic minority over-sampling technique. J. Artif. Intell. Res. 2002, 16, 321–357. [Google Scholar] [CrossRef]
  50. Dhal, P.; Azad, C. A comprehensive survey on feature selection in the various fields of machine learning. Appl. Intell. 2021, 52, 4543–4581. [Google Scholar] [CrossRef]
  51. Torabi, M.; Udzir, N.I.; Abdullah, M.T.; Yaakob, R. A review on feature selection and ensemble techniques for intrusion detection system. Int. J. Adv. Comput. Sci. Appl. 2021, 12, 538–553. [Google Scholar] [CrossRef]
  52. Aghdam, M.H.; Kabiri, P. Feature selection for intrusion detection system using ant colony optimization. Int. J. Netw. Secur. 2016, 18, 420–432. [Google Scholar]
  53. Ibrahim, N.M.; Zainal, A. A feature selection technique for Cloud IDS using Ant Colony Optimization and Decision Tree. Adv. Sci. Lett. 2017, 23, 9163–9169. [Google Scholar] [CrossRef]
  54. Sokkalingam, S.; Ramakrishnan, R. An intelligent intrusion detection system for distributed denial of service attacks: A support vector machine with hybrid optimization algorithm-based approach. Concurr. Comput. Pract. Exp. 2022, 34, e7334. [Google Scholar] [CrossRef]
  55. Kunhare, N.; Tiwari, R.; Dhar, J. Particle swarm optimization and feature selection for intrusion detection system. Sādhanā 2020, 45, 109. [Google Scholar] [CrossRef]
  56. Cho, M.Y.; Hoang, T.T. Feature selection and parameters optimization of SVM using particle swarm optimization for fault classification in power distribution systems. Comput. Intell. Neurosci. 2017, 2017, 4135465. [Google Scholar] [CrossRef] [PubMed]
  57. Ab Wahab, M.N.; Nefti-Meziani, S.; Atyabi, A. A comprehensive review of swarm optimization algorithms. PLoS ONE 2015, 10, e0122827. [Google Scholar] [CrossRef] [Green Version]
  58. Haidar, A.; Field, M.; Sykes, J.; Carolan, M.; Holloway, L. PSPSO: A package for parameters selection using particle swarm optimization. SoftwareX 2021, 15, 100706. [Google Scholar] [CrossRef]
  59. O’Mahony, N.; Campbell, S.; Carvalho, A.; Harapanahalli, S.; Hernandez, G.V.; Krpalkova, L.; Riordan, D.; Walsh, J. Deep Learning vs. Traditional Computer Vision. In Advances in Computer Vision, Proceedings of the Science and Information Conference, Tokyo, Japan, 16–19 March 2019; Springer: Cham, Switzerland, 2019; pp. 128–144. [Google Scholar]
Figure 1. A typical SVM model classifying three types of data.
Electronics 12 00708 g001
Figure 2. Image-based IoT malware detection using machine learning.
Electronics 12 00708 g002
Figure 3. Binvis 2D RRB-images of normal and malware pcap files.
Electronics 12 00708 g003
Figure 4. ACO for the feature selection process.
Electronics 12 00708 g004
Figure 5. Malicious traffic samples percentage according to the type of malware.
Electronics 12 00708 g005
Table 1. Literature review summary.
ReferenceYearFeature ExtractionClassifierDatasetTesting ResultsLimitation
Nataraj [21]2011GISTKNNHost-Rx Reference,
Host-Rx Application,
Malhuer Reference,
Malheur Application, VXHeavens
97.18%
accuracy
High computational overhead can be beaten by attackers.
Robert [32]2019CNNCNNSelf-collected dataset91.32%
accuracy
Limited samples did not consider encrypted traffic
Bendiab [14]2020CNNCNNSelf-collected dataset94.5%
accuracy
Low accuracy rate
Naeem [15]2018D-SIFT and GISTSVMCollected from the vision research lab of the University of California97.4%
accuracy
Windows-based malware, high computation time
Su [16]2018CNNCNNIoT DDoS malware dataset newly collected by IoTPOT94%
accuracy
The limited dataset in size and diversity
Makandar [22]2017GIST and Discrete Wavelet TransformSVM and KNNMalimg
Dataset
98.84% and 98.88%
accuracy
Limited samples
Liu [23]2016Local meanEnsemble learning based on K-means and baggingSelf-collected
dataset
98.2%
accuracy
Cannot deal with packet encryption, compression,
deformation
Han [17]2015Entropy GraphsThe similarity between Entropy GraphsSelf-collected dataset from VX Heavens
http://vx.netlux.org/index.html (accessed on 1 December 2022)
97.9% accuracyWorks for windows PE files, cannot deal with packed samples
Kalash [33]2018CNNCNNMalimg and Microsoft
Datasets
98.52%
accuracy
The network architecture of CNN(VGG16) requires a long training time.
Cui [35]2019CNNCNNImage dataset from Vision Research Lab.97.6%
accuracy
Not appropriate with bigger scale images, long training time
Akarsh [35]2019CNN-LSTMCNN-LSTMMalimg
dataset
94.4%
accuracy
Low accuracy rate, result comparison based on one literature.
Turker [25]2021hybrid LBP-SVD-LTPNetLDAMalimg
dataset
88.08%
accuracy
Lower accuracy rate compared with CNN+LSTM model.
Wang [36]2021CNNCNNMalimg dataset,
Microsoft malware classification challenge dataset (BIG 2015)
97.3%
accuracy
No data balancing
Moti [37]2021GAN with CNNCNN, LSTMStandard Windows and IoT malware datasets.accuracy:
97.56
F1 score:
97.61
Computational training time complexity
Asam [39]2022CNNCNNSelf-collected IoT dataset accuracy: 97.93%,
F1-Score: 93.94%, precision: 98.64%,
recall: 88.73%,
Low recall and F1 score values
Marin [39]20211D-CNN + LSTM1D-CNN + LSTM[44]98.60%Large number of features
Xu [40]2021LSTMRFAndroid Malware CICMal201797.16%Long time feature preparation
Ullah
[41]
2022Features from Accelerated Segment Test+ Binary Robust Independent Elementary Features + CNNEnsemble modelCICMalDroid 2020
CIC-InvesAndMal2019
97.76%
98.44%
complex multi-stage feature engineering
Ullah
[42]
2022(SIFTs) and oriented fast and rotated brief transforms + CNNEnsemble modelCIC-AAGM2017 CICMalDroid 202094.11%
99.00%
No data augmentation
Saridou
[43]
2022Hilbert BinVis
+ H-curve SAGMAD
CNNSelf-collected and combined dataset 94.50%Low detection performance
Table 2. Evaluation Metrics.
MetricEquation
Accuracy (A) A = T P + T N T P + T N + F P + F N
Precision (P) P = T P T P + F P
Recall (R) R = T P T P + F N
F-score (F1) F 1 = 2 × P × R P + R
Table 3. Training results without Feature Selection on balanced data.
MethodAccuracyRecallPrecisionF1_Score
linear84.59%78.97%74.81%82.90%
quadratic85.82%80.00%76.05%84.27%
polynomial90.63%89.10%88.64%90.43%
rbf86.19%80.88%77.53%84.86%
Table 4. Testing results without feature selection.
MethodAccuracyRecallPrecisionF1_Score
linear92.22%92.98%88.24%89.55%
quadratic86.67%85.48%73.53%80.65%
polynomial90.56%96.12%94.12%88.28%
rbf91.67%93.69%89.71%89.05%
Table 5. Training results using ACO as a feature selection technique on balanced data.
MethodAccuracyRecallPrecisionF1_Score
linear85.20%79.42%75.31%83.56%
quadratic87.18%81.86%78.77%85.98%
polynomial90.75%89.13%88.64%90.54%
rbf87.05%81.95%79.01%85.91%
Table 6. Testing results using ACO as a feature selection technique.
MethodAccuracyRecallPrecisionF1_Score
linear93.89%94.69%91.18%91.85%
quadratic95%95.58%92.65%93.33%
polynomial91.67%97.09%95.59%89.66%
rbf92.22%93.75%89.71%89.71%
Table 7. Initial values of SVM parameters.
SVM ParameterMin ValueMax Value
C150
gamma110
degree06
kernel[linear, rbf, poly]
Table 8. Results using PSO-SVM Hyperparameter Tuning.
MethodAccuracy Recall PrecisionF1_Score
SVM-linear95.56%96.43%94.12%95.26%
Table 9. Comparison with ML-based methods in terms of evaluation metrics results.
ReferenceFeature ExtractionClassifierEvaluation Metrics
[5]D-SIFT and GISTSVM97.4% (accuracy)
[7]GIST and Discrete Wavelet TransformSVM and KNNSVM 98.84% (accuracy) and KNN 98.88% (accuracy)
[8]Local meanCombination of Bagging and K-means98.2% (accuracy)
[9]Entropy GraphsThe similarity between Entropy Graphs97.9% (accuracy)
Proposed systemStatistical texture featuresSVM with a linear kernel function95.56% (accuracy)
96.43% (Recall)
94.12% (Precision)
95.26% (F1-score)
Disclaimer/Publisher’s Note: The statements, opinions and data contained in all publications are solely those of the individual author(s) and contributor(s) and not of MDPI and/or the editor(s). MDPI and/or the editor(s) disclaim responsibility for any injury to people or property resulting from any ideas, methods, instructions or products referred to in the content.

