Numerous optimization techniques have been proposed to tackles the optimization issue. To fix the service installation issue in a contextual setting, the IoT-SCOM method integrates the widely used simulating annealing (SA) method and ant colony optimization (ACO) method.
3.1. System Overview
Various types of computational power, such as local databases, micro fog, remote cloud cover, or adjacent MEC computers, can be efficiently integrated and used depending on varied processing capabilities, energy prices, and delay. Even if a computer resource (such as mobile cloud computing (MCC)) could meet the job-offloading requirement, the mobile customer can use the work-dumping services of other computational resources, such as edge servers. This considerably improves usability. MCC and MEC are complementary technologies; while MCC has a wealth of computational services and tools, MEC has the qualities of minimal delays, high stability, and flexibility to various network conditions, providing significant support for delay-sensitive operations.
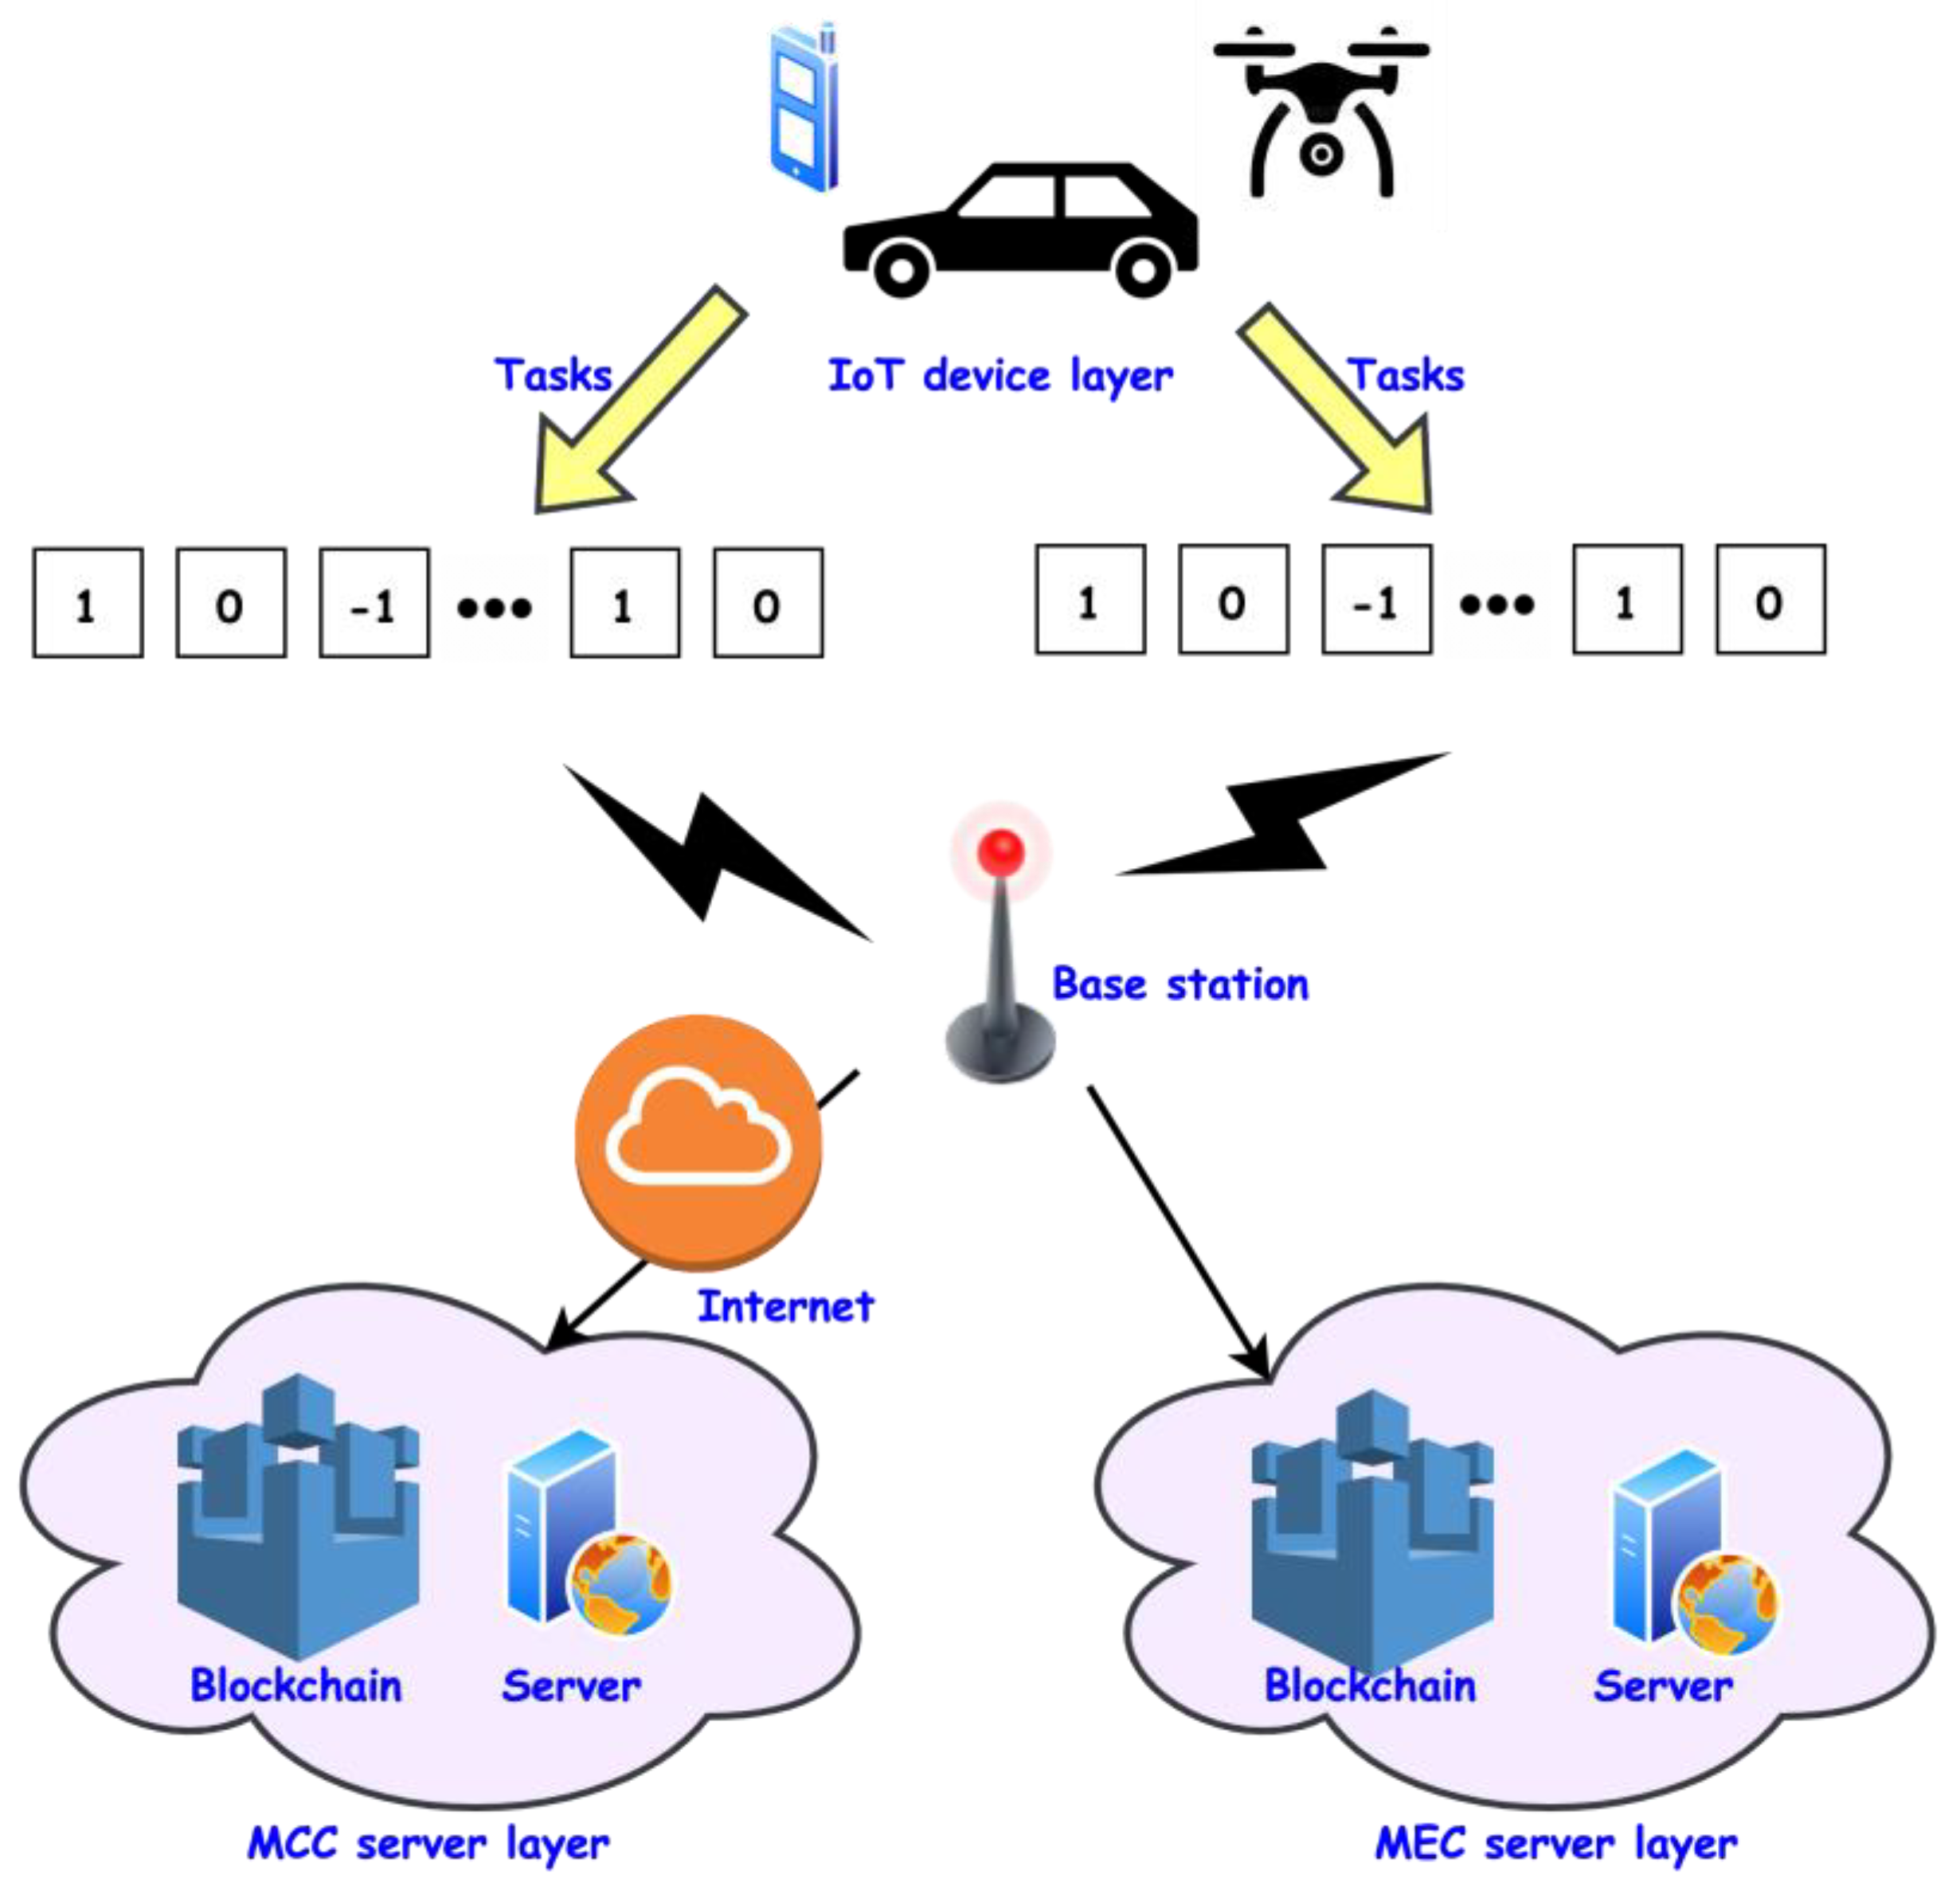
The systematic view of the IoT-SCOM is illustrated in
Figure 1. The system has MCC and MEC servers that are used and controlled via the base station. The different IoT devices and their tasks are classified, and service components are arranged to optimize the results. When meeting the requirement of delay limits, this research proposes to take advantage of MCC’s and MEC’s benefits and offload jobs to sites with diverse data and transmission capacities. It integrates various computational powers to create a cooperative IoT-edge-cloud computing ecosystem. The public blockchain deploys and manages a three-tier hierarchy that includes a specific IoT layer, a MEC server layer, and an MCC server layer. The subsequent are the key characteristics of every layer.
This layer is made up of a blockchain-enabled ecosystem of IoT systems. To enter the network and access MEC and MCC computers via wireless devices, each device has a blockchain identity. To perform mining tasks on the municipal IoT platform (decision: 0), offload people to a nearby MEC server (decision: 1), or offload people to a distant MCC domain controller (decision: 2), the IoT user must make dynamic assignment unloading choices based on Quality of Service (QoS) requirements and technical network capacity (task surface area, available edge assets, transmitting bandwidth assets, and so on) when deciding where else to execute extraction tasks (i.e., the min offloading expenses).
This surface can offer low-latency computing capabilities at the edge of networks by incorporating portable MEC computers for real-time job processing. To prevent work overload, MEC servers must transfer difficult computing jobs through wired connections to the MCC servers. To assure the safety of offloading operations, MEC clients moreover function as chain entities, creating a reliable connection with the specific IoT and the MCC client levels.
This layer contains several virtual servers with strong processing and storage capacities for handling challenging computing jobs for nearby IoT devices. Via the public blockchain, all internet terminals are securely connected to Data centers and Internet of Things devices and run in a decentralized, safe manner. The cloud-based storage on the network can be used to store data that connected systems have offloaded securely.
As a result, it is impossible to directly secure the optimal decision pair in a timely fashion. First, the IoT computing architecture can only carry out simple functions because of resource limitations, such as battery capacity. Applications that cannot tolerate delay should make quick choices with limited resources. The amount of time it took to complete the local Internet of Things processing of the computational task
is represented in Equation (1).
where
and
stands for the IoT device’s processing frequency and
represents the computational task’s burden. Similarly, the quantity of energy used by the IoT system to complete job
is expressed using Equation (2).
where
denotes the IoT device’s energy for implementation. The transmission time is denoted as
, and the IoT device is denoted D. MCC servers have more powerful computational capacities compared to IoT systems and MEC clients. When computing job
is transferred to the MCC servers for completion, the time taken is given using Equation (3).
where
stands for the delay and
stands for the MCC server’s processing frequency.
represents the computational task’s burden and the task is denoted as
. Tasks
and
’s interaction duration can be computed by Equation (4). The
and
’s task interaction duration and the fitness level evaluation are obtained by the rate of task determined by
where
denotes WAN bandwidth and
denotes data exchanged among tasks
. The capacity connecting the IoT system and the MCC servers, which really is fairly low and occasionally even unreliable, and the amount of information to be communicated both have a considerable impact on the connection time. Additionally, the amount of energy used by the IoT system when job
is transferred to the MCC servers for completion as shown by Equation (5).
where
is the energy produced when the Internet of Things gadget is in inactive mode, meaning that the work is being carried out elsewhere. The transmitted power of the task in the cloud layer is denoted
. Bluetooth and WiFi are the only differences between the various wireless transmission protocols MEC computers on the edge can use to connect to nearby IoT devices. MEC computers can offer a low-latency computation service by combining a Local Area Network (LAN) with connected systems.
Whenever task
is offloaded to the edge servers for processing, the implementation time is given in Equation (6).
where
) reflects LAN delay and
indicates the MEC server’s processing frequency. The computational task burden is denoted in
.
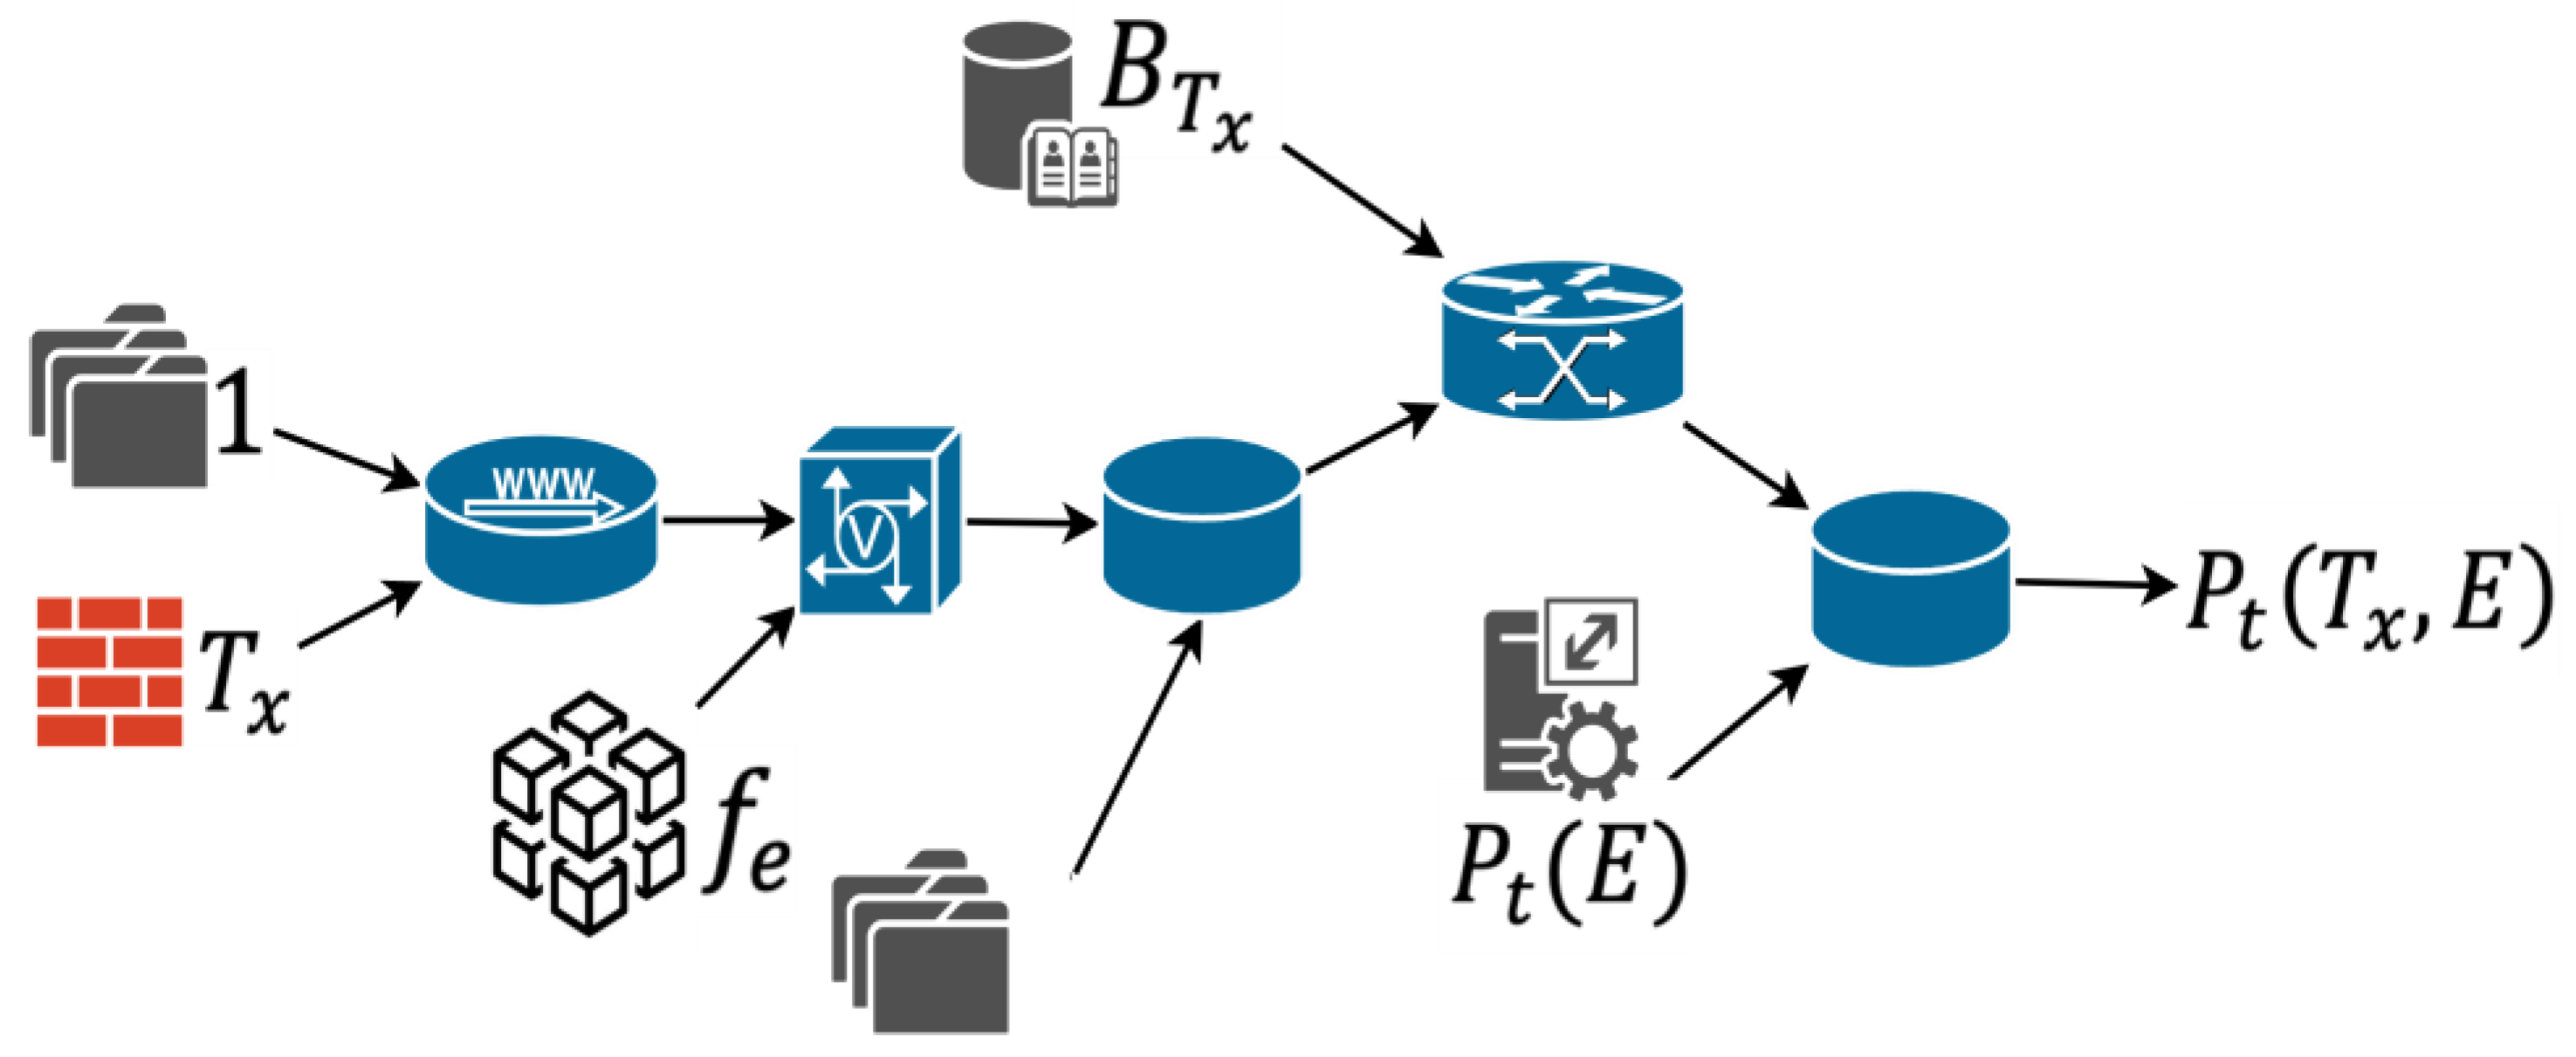
The pictorial representation of the function
is expressed in
Figure 2. The computation burden
, the task is expressed as
, and the edge frequency is denoted as
. It determines the transmission rate among tasks
by and the transmission rate is expressed in Equation (7).
denotes the LAN’s speed. The transmission burden of the different tasks is denoted
. In addition, the energy used by the IoT device when task
is transferred to the edge servers for completion, and the cloud computation time is expressed in Equation (8).
The initial power is denoted as , and the edge IoT device’s task ’s power is denoted as .
Figure 2.
The pictorial representation of the function .
Figure 2.
The pictorial representation of the function .
3.2. IoT-SCOM Model
The activity of ants seeking a route among their nest and a food supply is the basis for Ant Colony Optimization is a method for optimizing ant colonies. Ants emit pheromones while walking to indicate their path and decide where to go based on the pheromones. The ideal scenario would be for all ants to take the direct route. The ant colony optimization method can take a long time at times, but it can also find reasonable solutions. Metallurgical annealing inspired the stochastic optimization algorithm. In the presence of numerous local optimizations, it aids in the discovery of global optimum solutions.
The ant colony optimization method takes too long since it always considers every solution produced during each iteration. The effectiveness is much increased if it only accepts the best approach, which is to disregard ants on long journeys and let ants on short journeys leave their pheromone. But as a consequence, the outcome is readily stuck in local optimization.
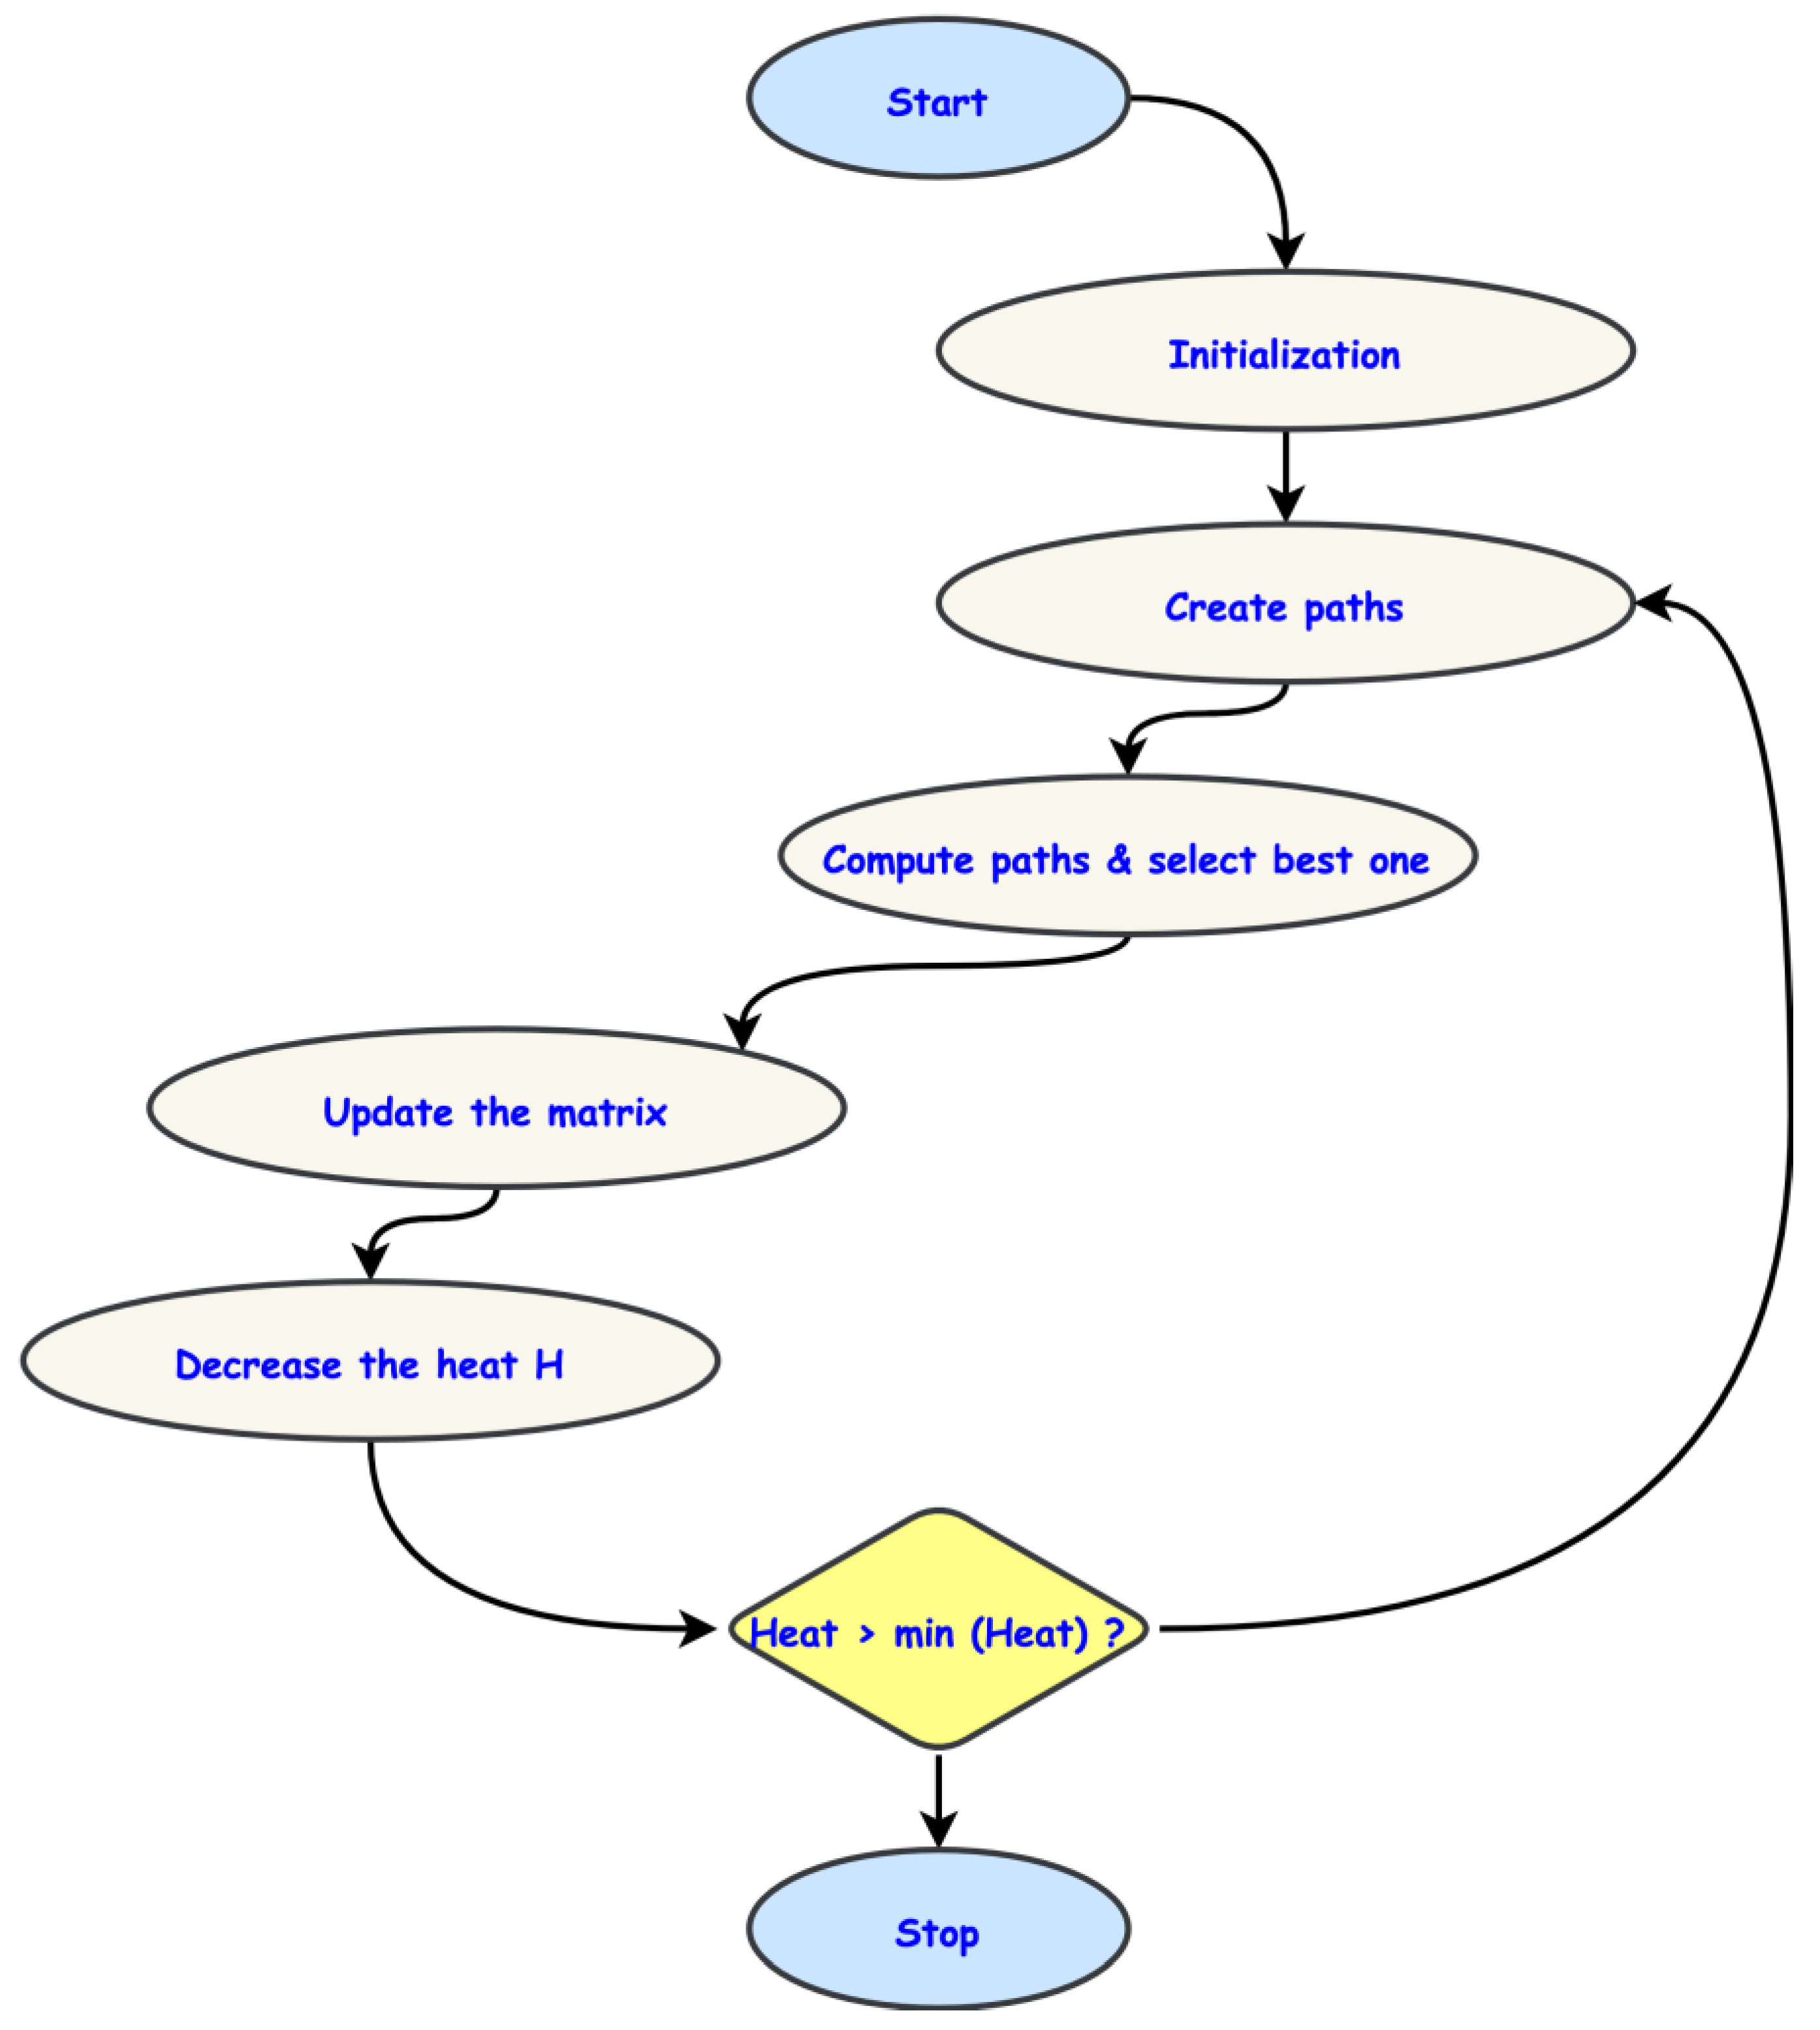
The workflow of the optimization algorithm is expressed in
Figure 3. The optimization procedure starts with initialization; the best path is found using the ants. The local and global best are found, and the best results are found using the updated matrix. The heat value is compared with the limit, and the final optimized result is displayed. In IoT-SCOM, it extends the stochastic optimization process’s beneficial characteristics to the ant colony optimization method. Any good solution is always accepted. Instead, the algorithm determines with what probability this answer should be approved. Doing this can increase the algorithm’s effectiveness and prevent local optima. The workflow is explained as follows:
- (1)
The initialization is completed at the beginning, initializing a matrix to hold the pheromones. Decide on the highest temperature and the lowest temperature . Set the current heat to . The program then begins iterating until it finds the best answer.
- (2)
New routes from the ant colony to the food supply are created per the pheromones matrix.
- (3)
Assess the paths by the rules, then select the best one.
- (4)
Add new tactics to the pheromones matrix.
- (5)
Reduce the heat H. The method terminates if H falls below the required temperature
. Alternatively, return to step (2).
| Algorithm 1:The optimization algorithm for finding the best route |
| 1: | Start |
| 2: | ; , , |
| 3: | M = m,n; |
| 4: | For ; ; |
| 5: | |
| 6: | |
| 7: | End |
| 8: | If ( |
| 9: | Return M |
| 10: | Else |
| 11: | |
| 12: | |
| 13. | End |
| 14. | End |
The algorithm is started, and the initialization is completedfor current heat H with the maximum and minimum temperature, . The matrix element M holds the rows’ values and column m,n. The deployment of the service components is executed. The element is set to 1 for maximum temperature. If the data center is implemented, the value M is returned, otherwise. The service element is executed for minimum temperature. The best route is identified through the entire process of the algorithm.
The routes from the ant colony to the food source correlate with the distribution methods, and the duration of the paths corresponds to the delay of the full service when applying IoT-SCOM to the implementation issue. Therefore, the higher delay method causes the emission of fewer pheromones.
3.2.1. Initialization
Ant colony optimizationis the foundation of the IoT-SCOM technique. The algorithm’s foundations are pheromone traces. Thematrix M is initialized at the start of IoT-SCOM to reflect the pheromones. The number of network elements (m) and data centers (n) are represented in the pheromones matrix M, which has m rows and n columns. The scent concentration in the route corresponding to the deployment of the service components in the data center is indicated by the element . The initial value of each entry in the pheromone matrices M is set to 0. The matrices M is modified as the algorithm proceeds. The effectiveness of every element’s matching approaches positively correlates with each entity’s value. A row’s highest value should ultimately belong to a component corresponding to the ideal system.
3.2.2. Generation
All ant pathways are created randomly during the first round. Each ant uses one of two strategies in later versions to determine the best course of action. First, a probabilistic approach can aid in the convergence of the best answer, which is determined by hormones as well as the appeal of the food. Secondly, a path is picked randomly, which can aid in avoiding local maxima. A route in this study refers to a precisely defined
, and let
stand for the complete set of approaches produced in a cycle. The algorithm determines the number of deployment methods for service elements
using a probabilistic approach in accordance with matrix M. The service element
is then deployed by
approaches by the probabilistic approach and the remaining install it randomly. The probabilistic approach of the service component is denoted in Equation (9).
The updated matrix of the service component is denoted as
, and the quality of the matrix is denoted as
. The program is not ever converged if not enough methods use the probabilistic approach. Therefore, the constant r stands for the probabilistic plan’s weakest pace. There is a high-performance matching approach to deploying service element
when an item in row
of the weight, the matrix is significantly bigger than others. As a result,
is more prominent in such a scenario, and more approaches are selected for the probabilistic approach. The chance of network elements x being installed in the data center
according to the stochastic technique is expressed in Equation (10).
The matrix representation of the service component is denoted as
, the logical deploying function is expressed as
. Food appeal is correlated with data center location fitness. The logic of deploying services element x in data center
is assessed using
and it is expressed in Equation (11).
stands for the amount of data required to run service element x. represents the volume of data kept in the data center . stands for the data center’s storage space. The local endurance can stand in for an information center’s disk resilience. As a result, a data center can expand more easily if its local fitness is higher. Depending on the dynamic likelihood, a data center can be selected to extend a similar service. Additionally, the entire deployment method can be resolved.
3.2.3. Evaluation
In order to select the best strategies as a consequence of the methodology, the assessment of approaches can be utilized to refresh the pheromone matrix.
represents the efficacy of the
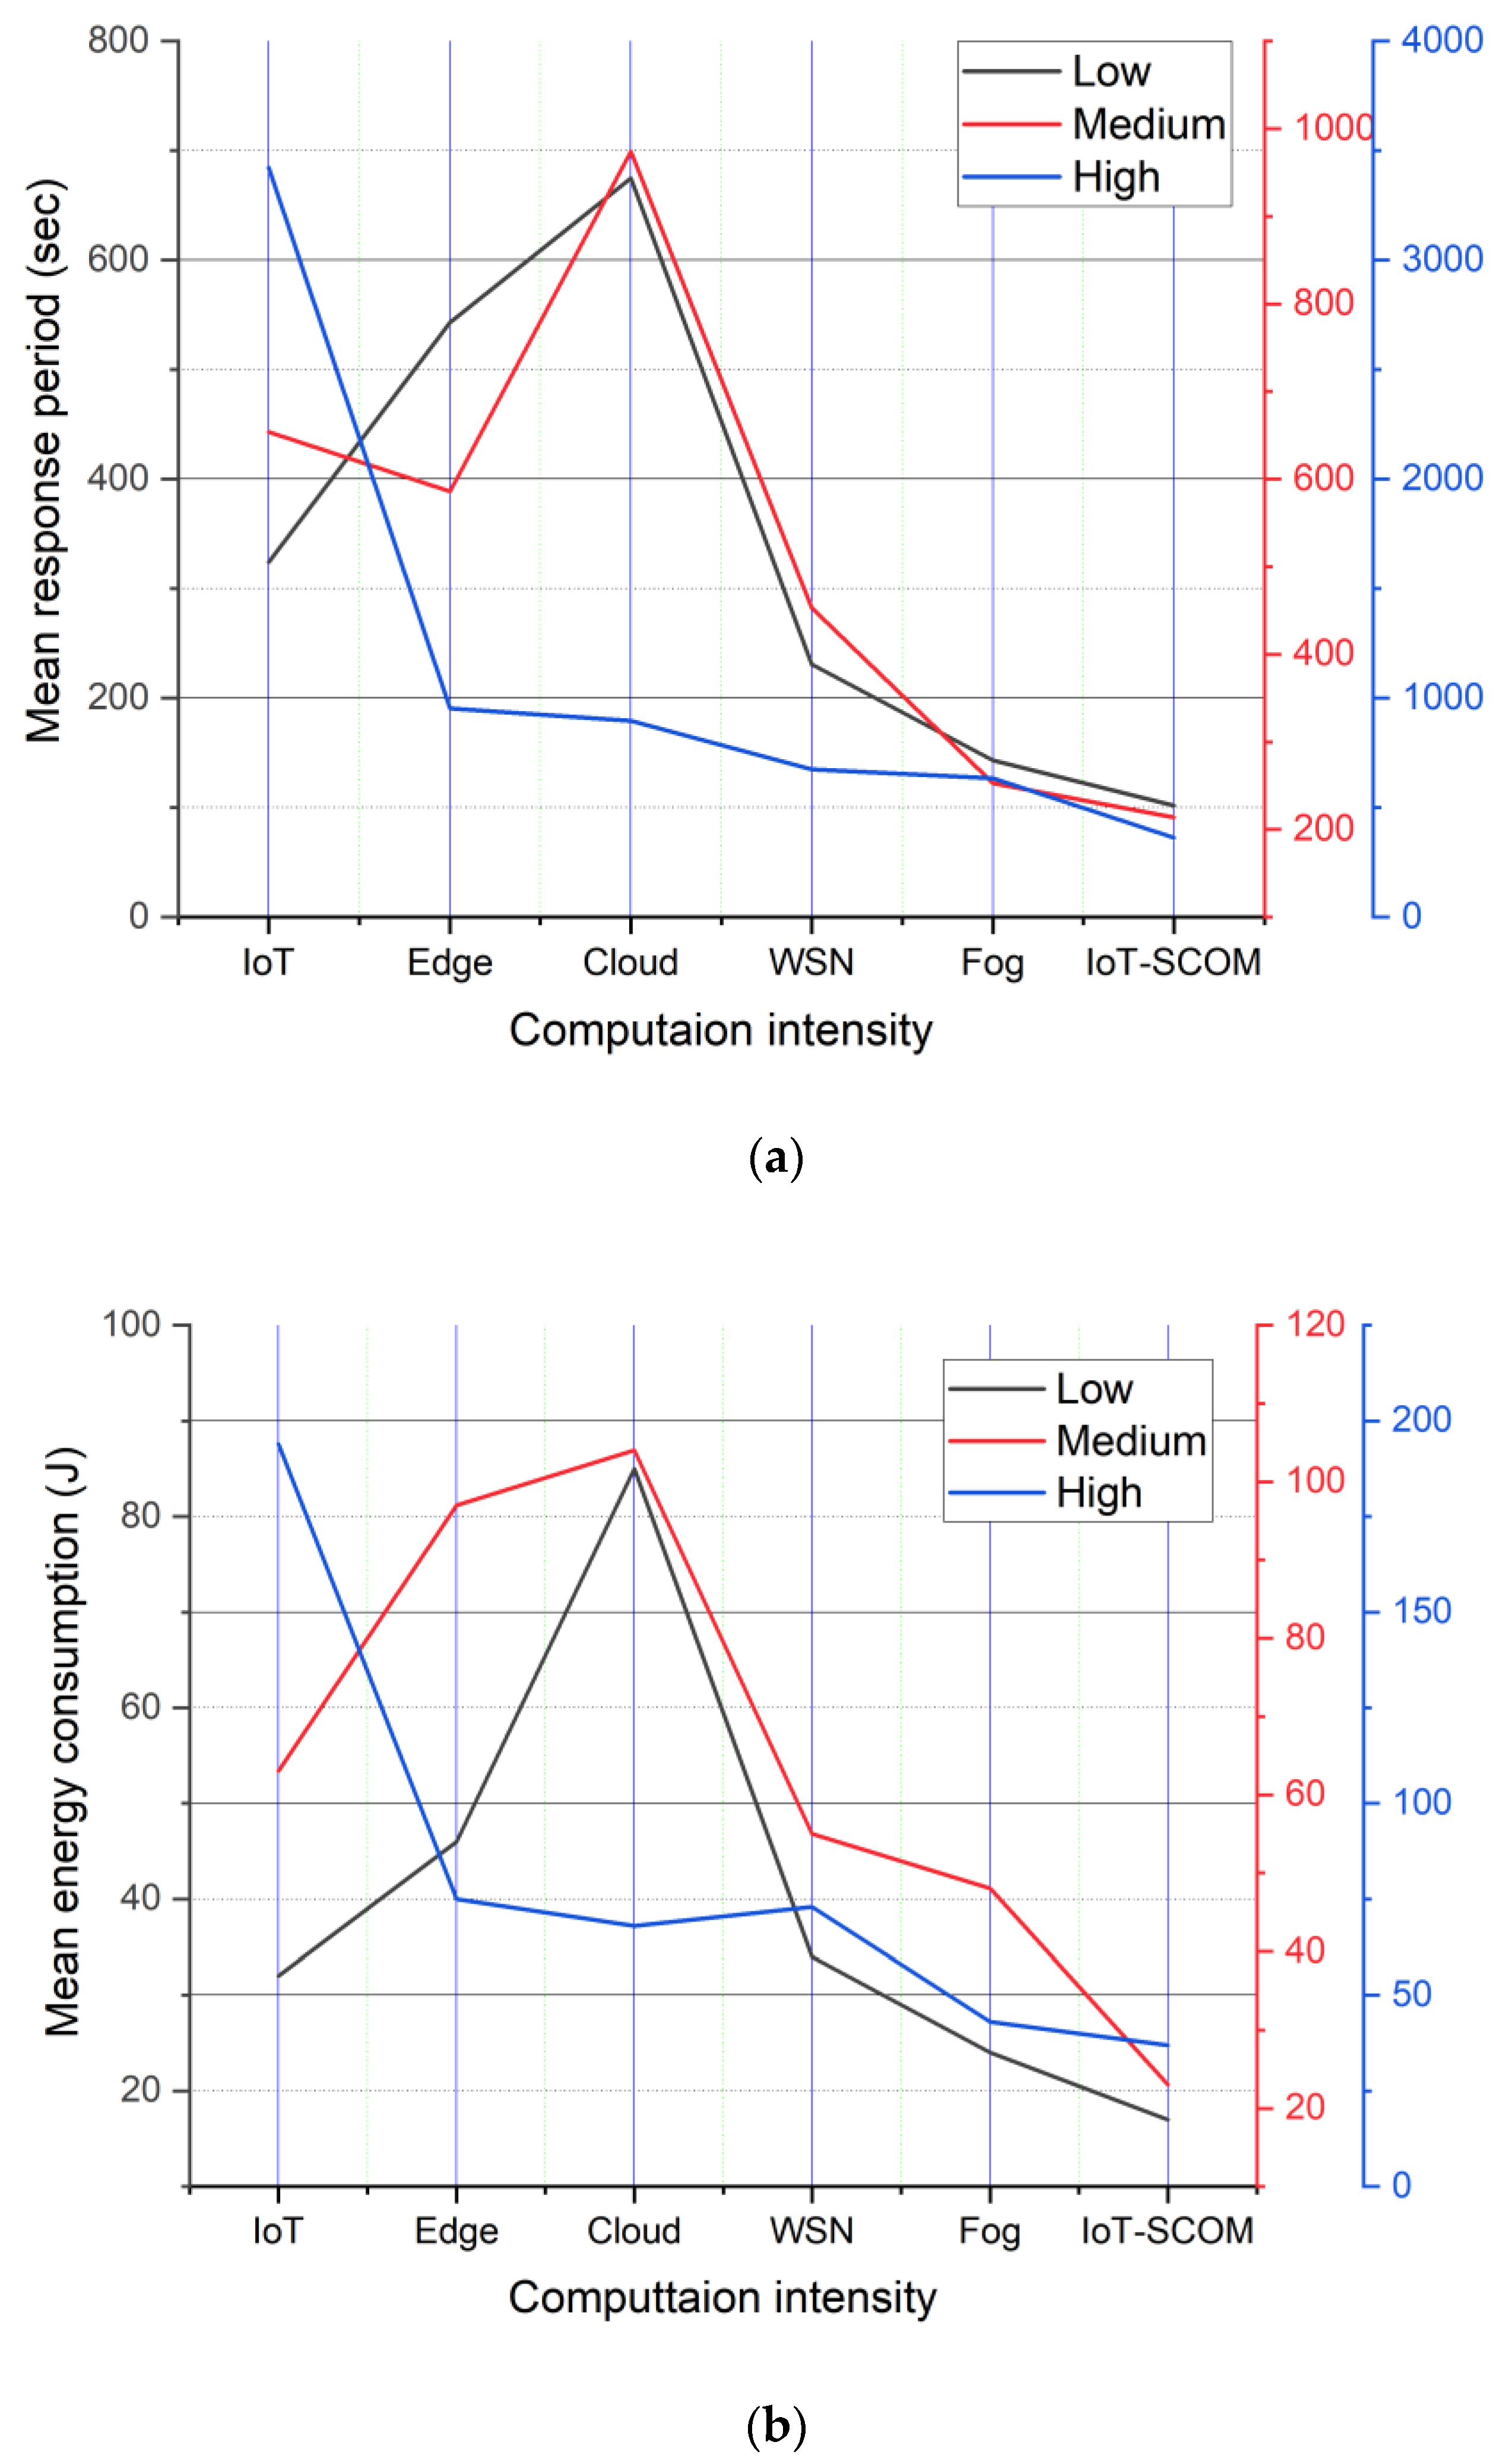
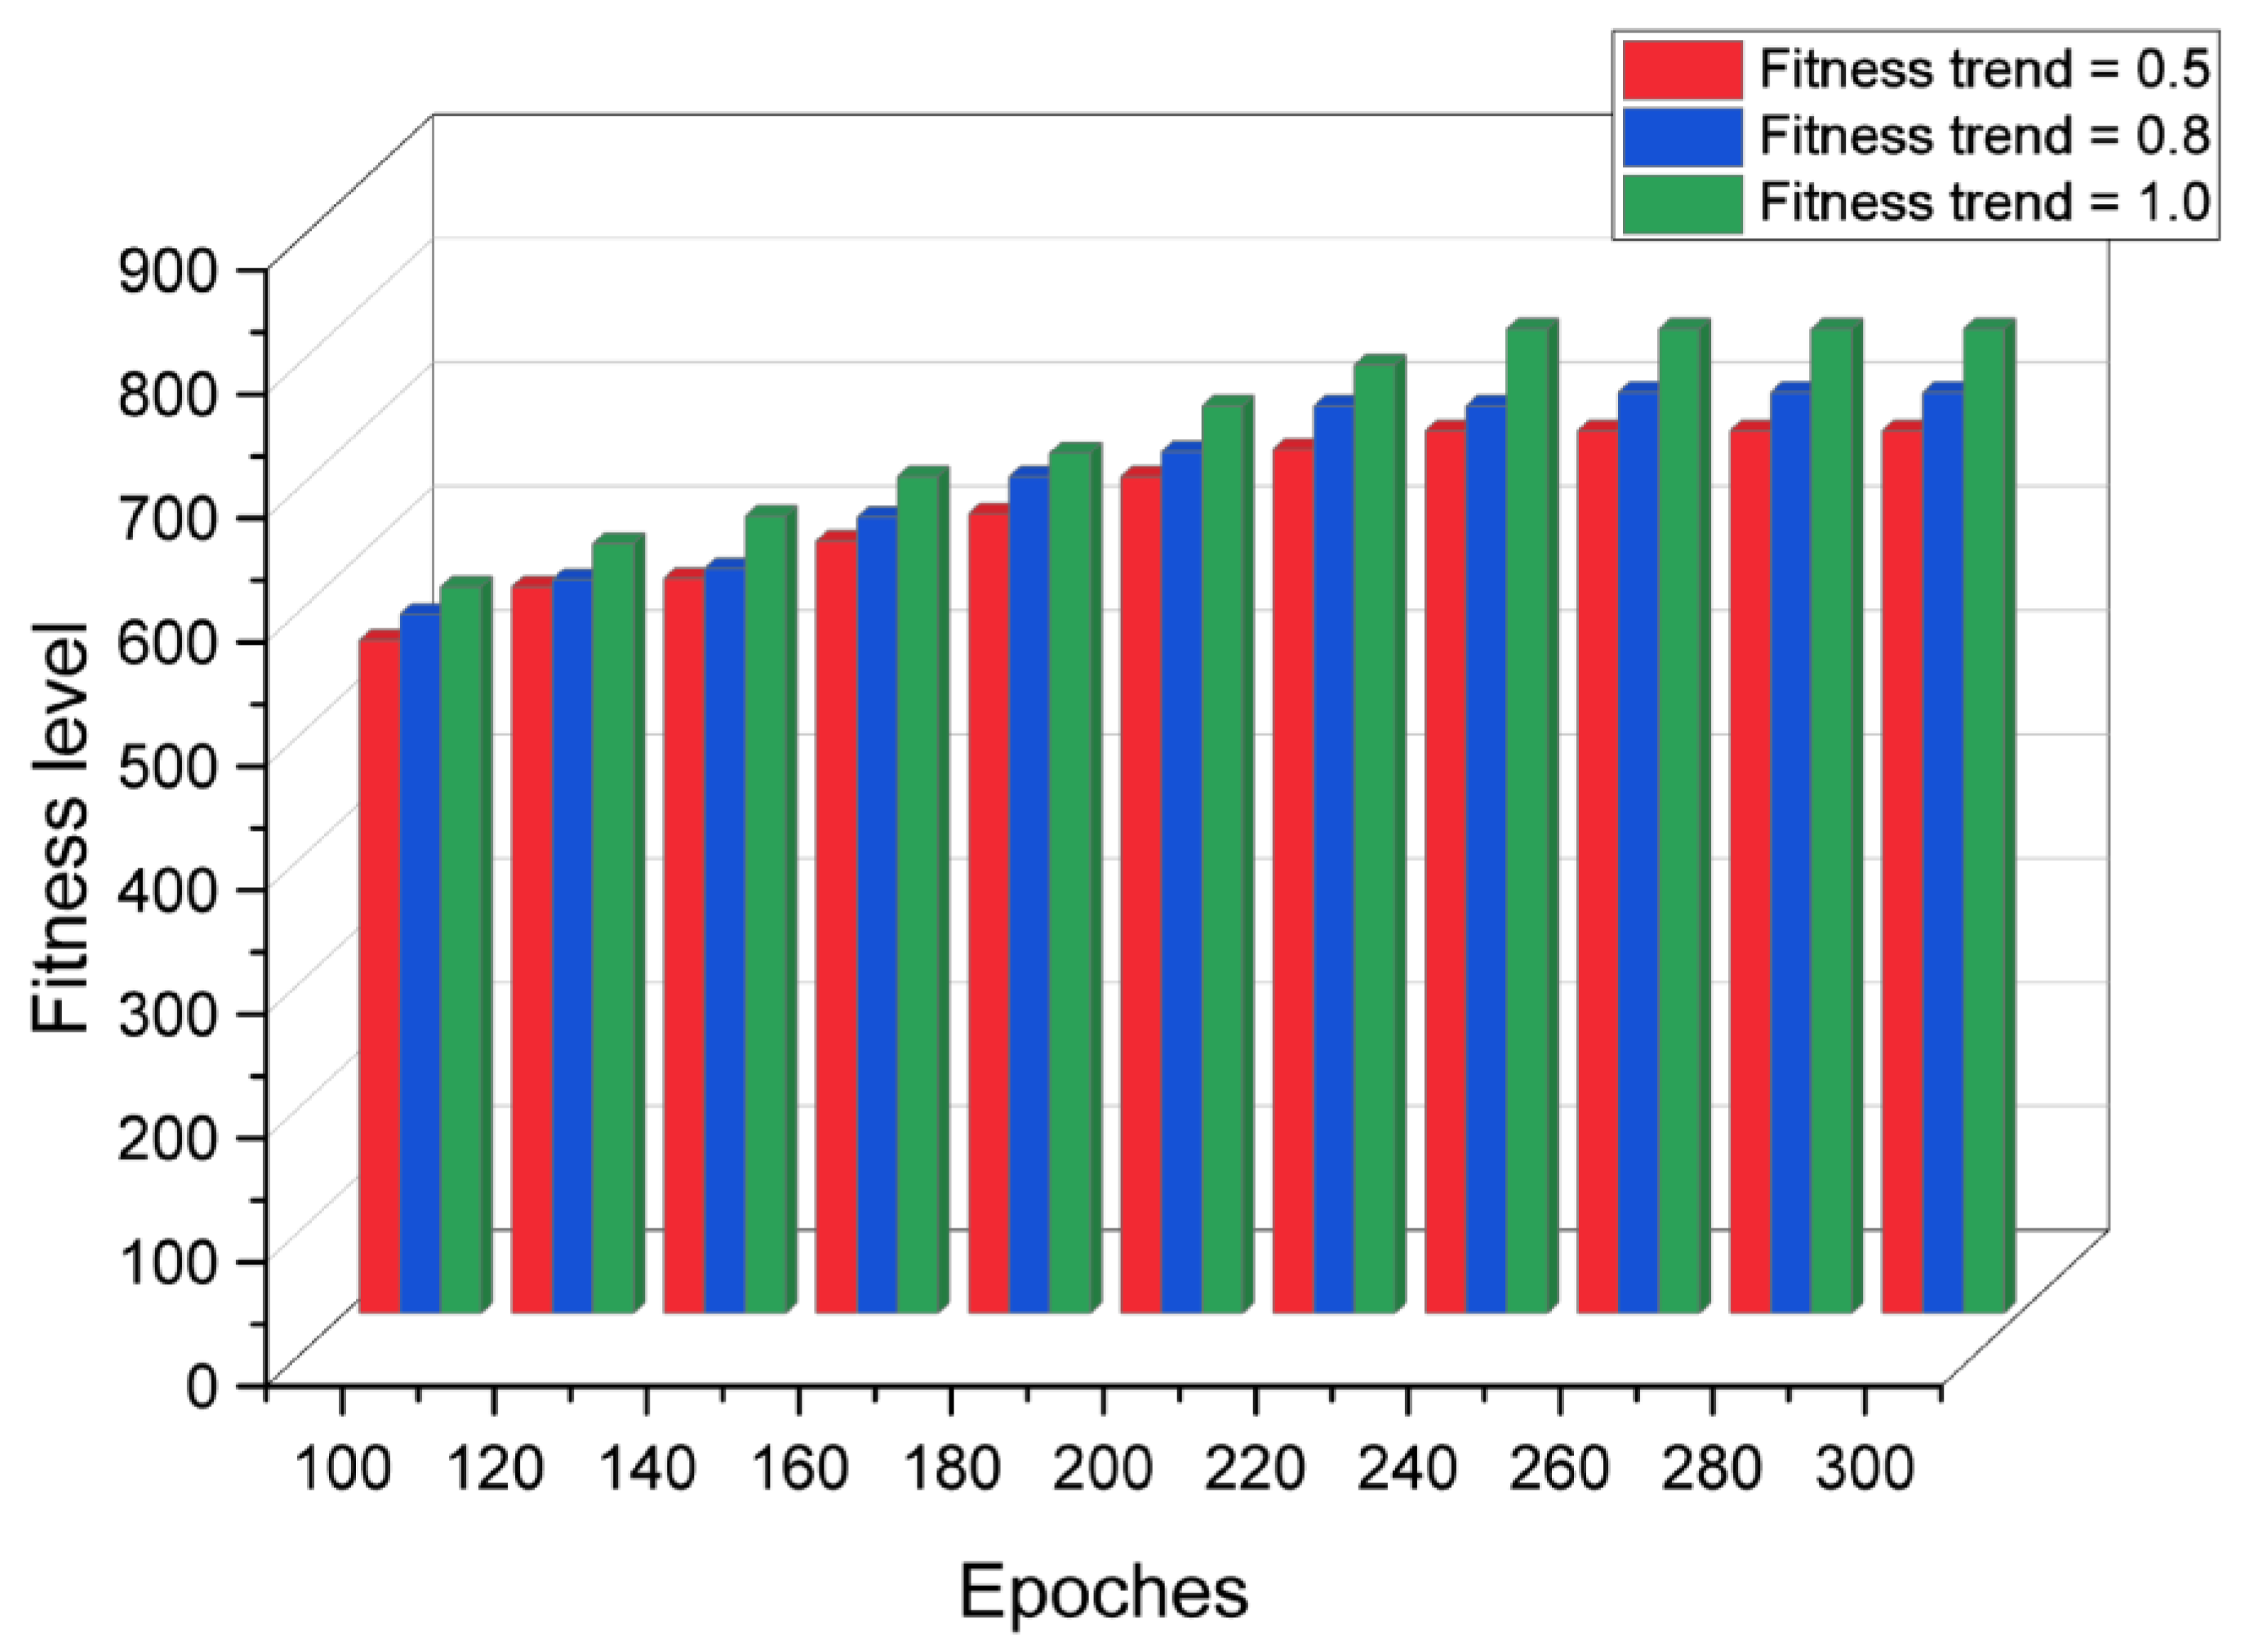
strategic approach and expressed in Equation (12). The mean response of the system is obtained from Equation (12).
A variable coefficient is called k. The time-cost of the application with the techniques employed is indicated by the notation . Only the delay in transmitting data is considered in the study which is denoted .
3.2.4. Update
A successful approach always has its associated components in the matrix M modified. The probability P determines whether the relevant parts are modified for the approach with poor performance. Let
the collection of tactics developed in this iteration. The deviation function
is expressed in Equation (13).
The delay in strategy
is represented by
. The average delay
of the methods is first determined and represented by the symbol
. The matrix M would be changed if
, which denotes that method
’s efficiency is better than the average. If not, it suggests that strategy efficiency is below average, in which case the probability is estimated using Equation (14).
The temperature right now is H. The deviation function is denoted as
. After that,
, a random variable, is produced in (0,1). The matrice is changed if
. This method with reduced latency is likely to succeed, and their ways to link components have been changed. The techniques with poor performance are likely to be chosen in the early stages when the weather is warm. It modifies the matrix afterward to prevent being readily caught in local optimization. Later repetitions, when the heat is low and the probability
P is low, will aid in the convergence of the best course of action and increase the algorithm’s effectiveness.The entries in the pheromones matrix M would be modified as follows if a distribution method
and
is approved using Equation (15).
where
is a constant representing the percentage of pheromones still present after each cycle of volatilization. The delayed performance is denoted
, and the function of the delay service component is denoted as
. The service component is expressed as
.
The evaporation can lessen the imbalance between strategies developed in earlier iterations and those produced in later phases by causing the values of components in matrix M to decrease before the update. IoT-SCOM is more efficient than the ant colony optimization technique since it skips specific subpar solutions during iterations.
3.3. Multi-Agent Optimization
In most situations, it is challenging to find an optimization method for the service component issue in an acceptable amount of time due to its great complexity. Using exploration deconstruction and actual population disturbance, the suggested multi-agent optimization approach can lessen the complexity of the problem.
The multi-agent system, which consists of autonomous agents working together to achieve shared goals concurrently, is frequently employed in parallel and distributed systems. Additionally, it offers a vital capacity to solve nonlinear equations using metaheuristic techniques, enabling one person to individually resolve a sub-optimization issue and pursue the optimum solution by colliding with others. This research uses features to create a multi-agent method for the service component issue based on ant colony optimization, including a discrete agency with a specific function. The design improves IoT-SCOM regarding the total quantity of agents, their operation, and the maintenance of a suitable trade-off between explorative and exploitative mechanisms.
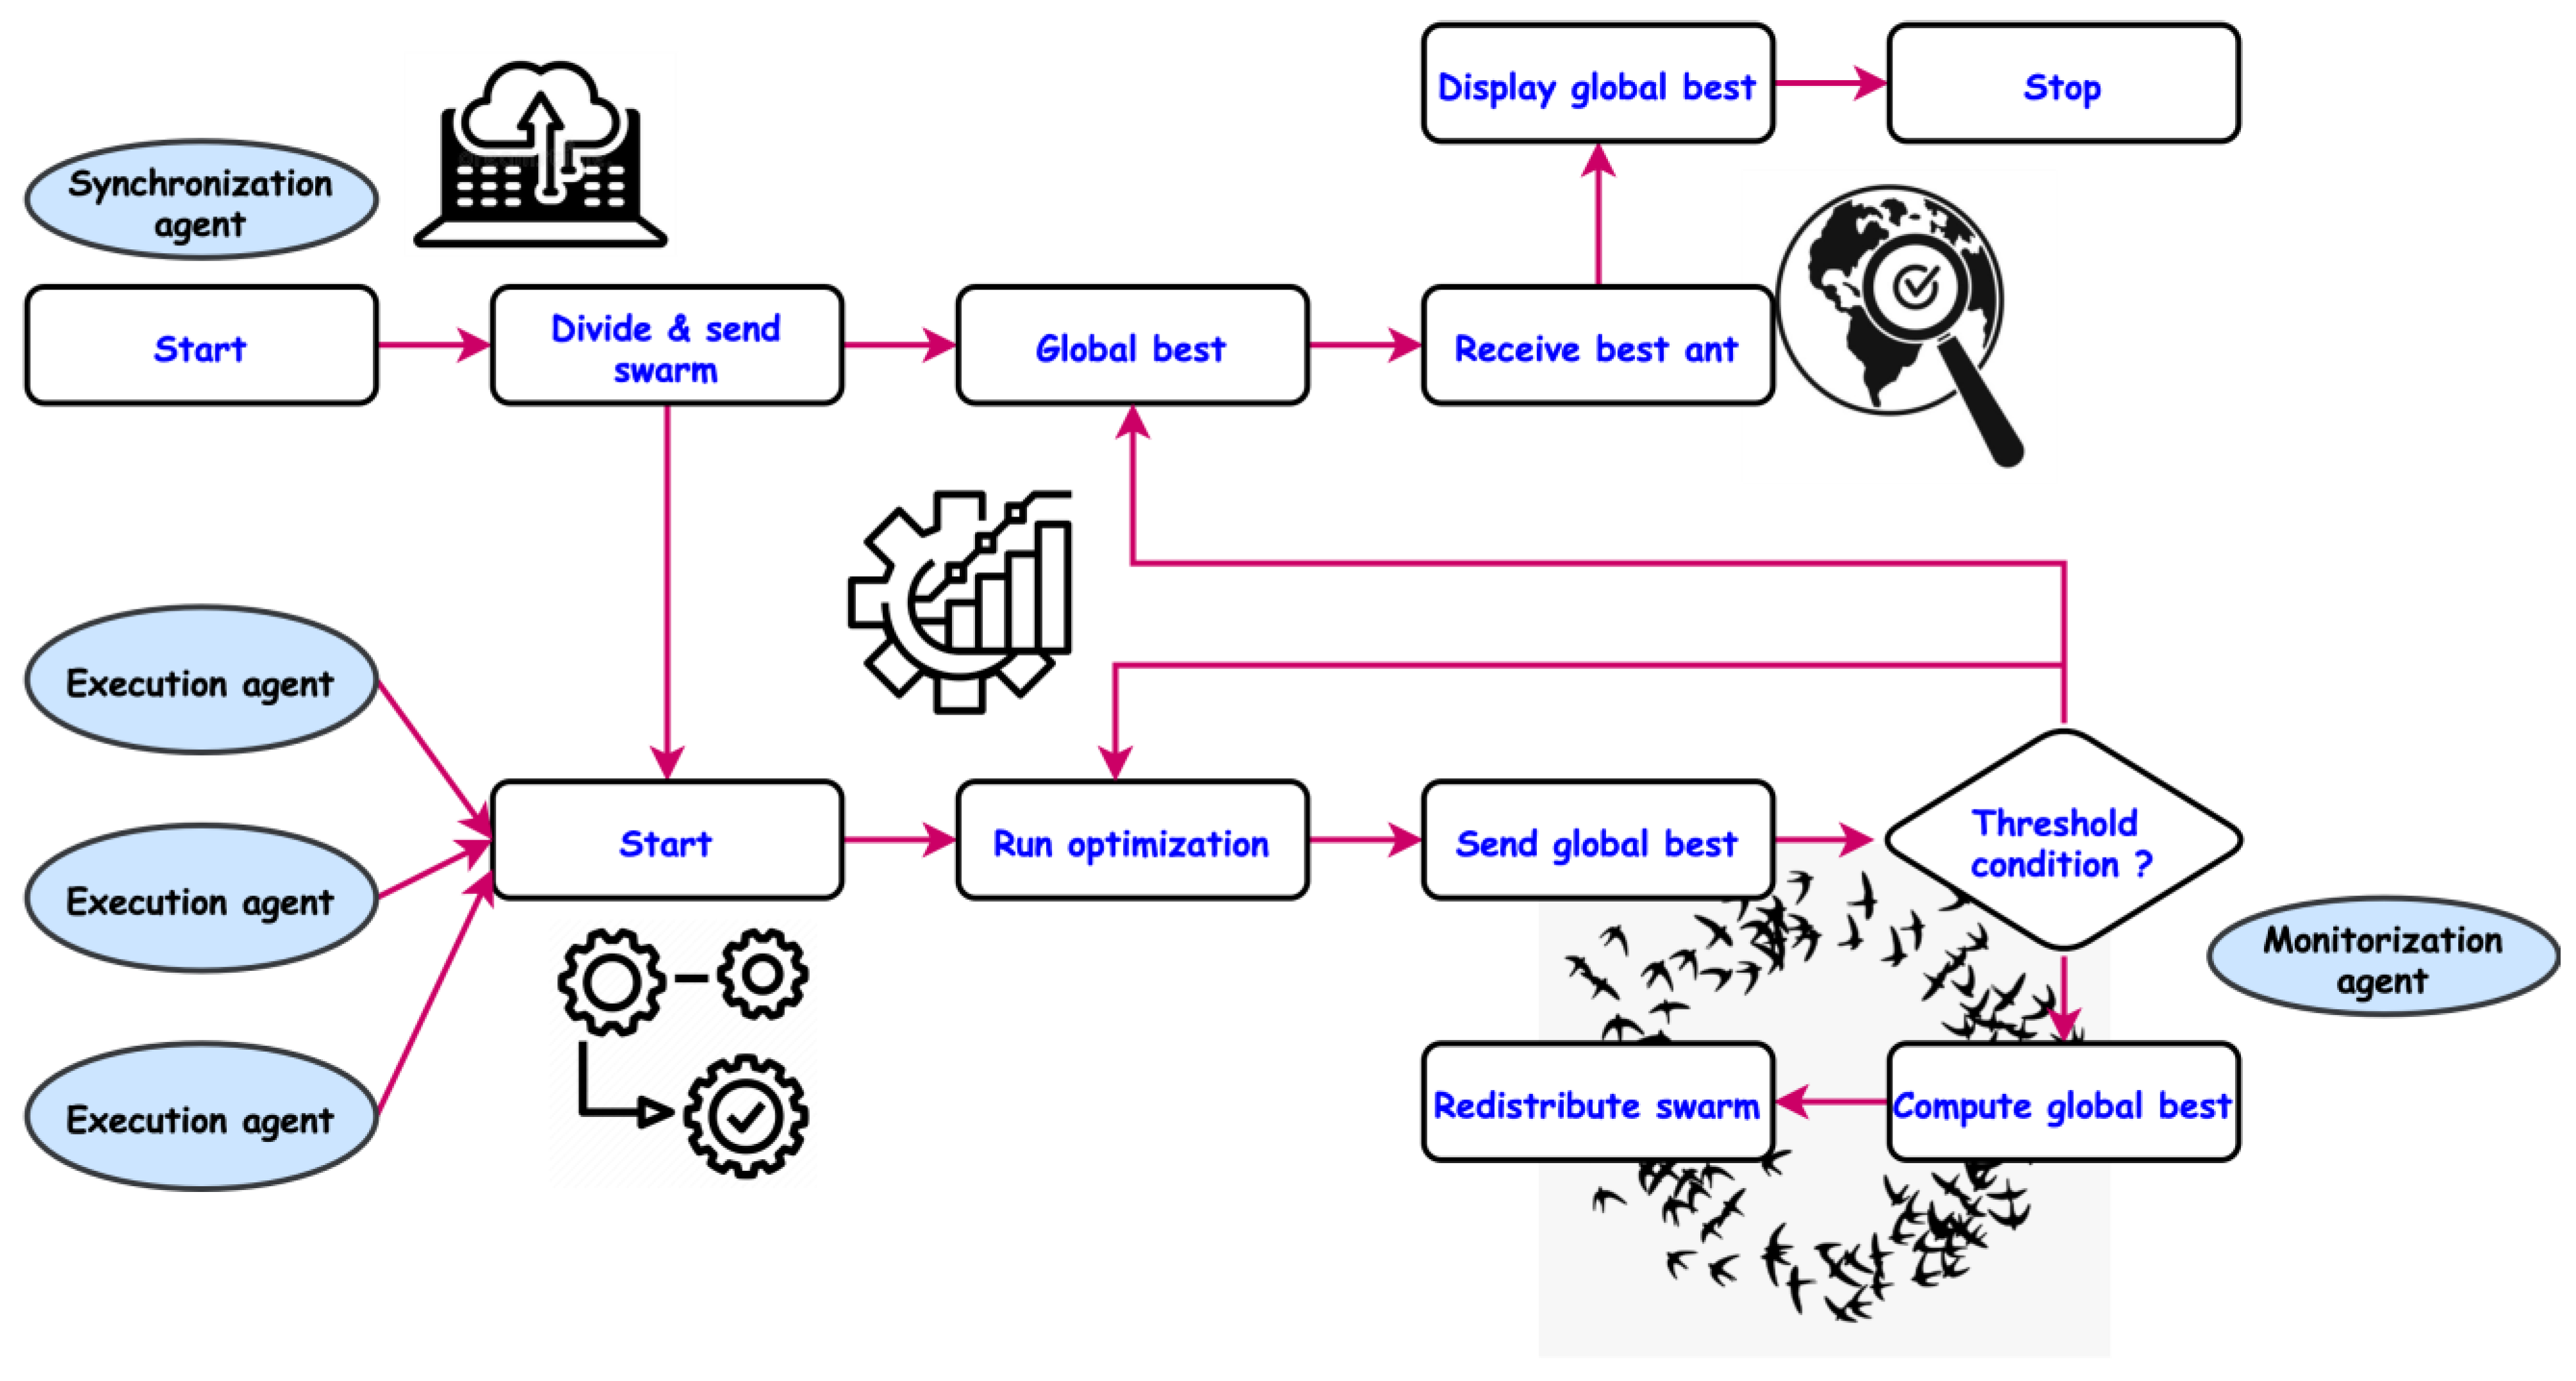
The multi-agent optimization model is represented in
Figure 4. The different agents, such as the synchronization agent, execution agent, and monitorization agent, are used to compute and find the optimum results. The four agents that make up a conceptual IoT-SCOM are one synchronization agent (SA), two executing agents (EAs), and one monitorization agency (MA), each of which has been designed to perform a specific task.
This agent, which has many functions, comprises all the agencies in the network that it is acquainted with. It is in charge of splitting the population in half and distributing the halves to the EAs. Additionally, when the limit point is reached, it signals the MA to obtain the best EA answer. Ultimately, it is responsible for selecting the best overall solution from the several EAs.
This agent carries out the optimization algorithm’s optimization procedure. Each of the two separate EAs has a unique initialization strategy. While the second agent (EA2) initializes the population selfishly, the first agent (EA1) initializes the subpopulation randomly. The program is applied when the subpopulation has been initialized, and at the same time, each agent sends the MA their optimal answer to date. Both EA agencies build a solution during each iteration, maintain the best one thus far (designated guest), and transfer the MA agency to the SA agents if the limit point is achieved.
This agent comprises EAs in the network with which it is acquainted. It adjusts the population’s distribution based on how well EAs are performing. The population is divided into two sections in the SA and then dispatched to the EAs. To promote the utilization of the excellent EA agent, MA favors a good EA that discovers a superior solution by dividing the population into two uneven portions. The SA agent receives the EAs’ answers to evaluate and present as the game’s final solution to the task performed, which is determined by this limit constraint.
The IoT-SCOM system is designed with multiple agents to optimize the results using ant colony optimization, and the results are optimized using service components. The optimization results are analyzed using the simulation tool in the next section.


 ,
, 


