Article

Towards Posture and Gait Evaluation through Wearable-Based Biofeedback Technologies

1
Department of Neuroscience Biomedicine and Movement, University of Verona, 37129 Verona, Italy
2
Department of Computer Science, University of Verona, 37129 Verona, Italy
3
Department of Electrical Engineering and Computer Science, University of Stavanger, 4021 Stavanger, Norway
4
LabofMove Research, 37122 Verona, Italy
*
Authors to whom correspondence should be addressed.
Electronics 2023, 12(3), 644; https://doi.org/10.3390/electronics12030644
Submission received: 13 December 2022 / Revised: 24 January 2023 / Accepted: 26 January 2023 / Published: 28 January 2023

Abstract

:
In medicine and sport science, postural evaluation is an essential part of gait and posture correction. There are various instruments for quantifying the postural system’s efficiency and determining postural stability which are considered state-of-the-art. However, such systems present many limitations related to accessibility, economic cost, size, intrusiveness, usability, and time-consuming set-up. To mitigate these limitations, this project aims to verify how wearable devices can be assembled and employed to provide feedback to human subjects for gait and posture improvement, which could be applied for sports performance or motor impairment rehabilitation (from neurodegenerative diseases, aging, or injuries). The project is divided into three parts: the first part provides experimental protocols for studying action anticipation and related processes involved in controlling posture and gait based on state-of-the-art instrumentation. The second part provides a biofeedback strategy for these measures concerning the design of a low-cost wearable system. Finally, the third provides algorithmic processing of the biofeedback to customize the feedback based on performance conditions, including individual variability. Here, we provide a detailed experimental design that distinguishes significant postural indicators through a conjunct architecture that integrates state-of-the-art postural and gait control instrumentation and a data collection and analysis framework based on low-cost devices and freely accessible machine learning techniques. Preliminary results on 12 subjects showed that the proposed methodology accurately recognized the phases of the defined motor tasks (i.e., rotate, in position, APAs, drop, and recover) with overall F1-scores of 89.6% and 92.4%, respectively, concerning subject-independent and subject-dependent testing setups.

1. Introduction

The control of the postural system is one of the fundamental neurophysiological mechanisms of the human body. It is fundamental to ensuring balance against gravity and fixing body orientation, and functions as a reference frame for perception–action coupling while efficiently dealing with the external world. Postural control is a dynamic process that requires sensory detection of body motions and integration of sensorimotor information within the central nervous system. In more detail, the central nervous system triggers the execution of appropriate musculoskeletal responses in order to obtain an equilibrium between destabilizing and stabilizing forces [1].
It has been shown, in the reference literature of physiatric medicine, that measurements of postural stability are critical for determining predictors of performance [2], for evaluating musculoskeletal injuries [3], for determining the effectiveness of physical training and rehabilitation treatments [4], and to provide injury prevention through the study of injury risk-factor analysis [3,5]. The body’s motion is mainly based on the integration of the proprioceptive, visual, and vestibular inputs [6]. Afferent proprioceptive inputs are conveyed to different levels of the central nervous system [7,8,9]; however, most of them remain unconscious. The joint positions and movement sensing (kinaesthesia) are the expressions of the conscious component, but postural control is primarily based on the unconscious component [9]. Specifically for the antigravity movements, proprioceptive control represents the expression of the effectiveness of the stabilizing reflexes in controlling vertical stability [8]. In fact, antigravity movements are the activities that counteract gravity and postural instability with at least a phase of single-limb stance [6]. In this way, proprioceptive input represents the most relevant sensory system in the maintenance of static postural stability at all ages and fitness levels [10]. This topic is also relevant in neurodegenerative diseases such as Parkinson’s disease (PD). For example, PD patients with postural instability have worse reactions to brief perturbations, more stance sway, and trouble switching between tasks. Moreover, quantifying balance changes in early and moderate-stage PD and the comparison to healthy subjects using clinical assessments of balance and musculoskeletal activation is paramount, primarily if performed through less invasive and costly systems [11,12].
Many tools to detect musculoskeletal activation have been used in sport and rehabilitative medicine. Mainly, electromyography (EMG) is employed for this purpose. However, EMGs are not yet widely used in combination with accelerometers for forecasting and customizing measures for the analysis of the human body’s motion to achieve different goals. This is mainly due to the limited number of investigations that have been focusing on the nature of musculoskeletal response to a broad spectrum of stimuli able to identify the thresholds that establish the standard/ideal status of the postural system. Hence, there is a lack of low-cost technology that habilitates these measurements.
Furthermore, in the last decade, with the advent of the Internet of Things (IoT), embedded sensors have been integrated into personal devices such as smartphones and smartwatches. In several applications, sensors are integrated into clothes or other equipment/objects of daily life, becoming a central research topic due to their importance in many areas, including healthcare, interactive gaming, sports, and monitoring systems for general purposes in controlled and uncontrolled settings [13,14,15].
The primary purpose of the investigation we carried out in this project was to present a preliminary study on the design of a portable and reliable postural system prototype composed of HW and SW, adapted to diverse individual profiles concerning the performance viewpoint, from patients needing rehabilitation to top-level athletes. It is widely accepted in the community of psychiatric medicine that proper quantification of the postural system efficiency represents an essential assessment for improving the quality of life. However, most of the actual measurements are developed in a laboratory environment where natural movements are usually constrained by the instruments applied to subjects’ bodies and the environment. This process is performed to distinguish, as precisely as possible, in the limits of the experimental setting, the roles of proprioception, visual and vestibular input using a low-cost and portable instrument. This habilitates the individuals to move freely and perform activities at home or in other uncontrolled environments (e.g., gyms or sports facilities) [5,16].
The technology integrated into such project includes state-of-the-art apparatus (i.e., force platform, EMG, and motion capture cameras) and wireless three-dimensional inertial units performing computation and data analysis over low-cost devices (i.e., sensors themselves, smartphones, and tablets) or cloud platforms.
In the project, we considered variants of these configurations’ implementations to evaluate possible solutions to different settings. Subsequently, another essential goal will be the usability of the envisioned technology. Thus, the possibility to perform a comparative study with existing state-of-the-art validated systems is needed to obtain a well-ground assessment. Moreover, fundamental analysis of the specific characteristics of the exercises existing in the literature and a combinational calculation will define the subsequent exercise prescriptions; a multitude of exercise combinations will be available to satisfy the actual needs of the different clinical conditions. To identify these exercises, in future works, we are going to investigate the potential of reinforcement learning as a tool for customization (in order to adapt the response of the portable tool to the needs of the setting, such as medical diagnosis, performance test, training evaluation, and training progress measurements) and personalizing (in order to adapt to the individual variability of the applications mentioned above).
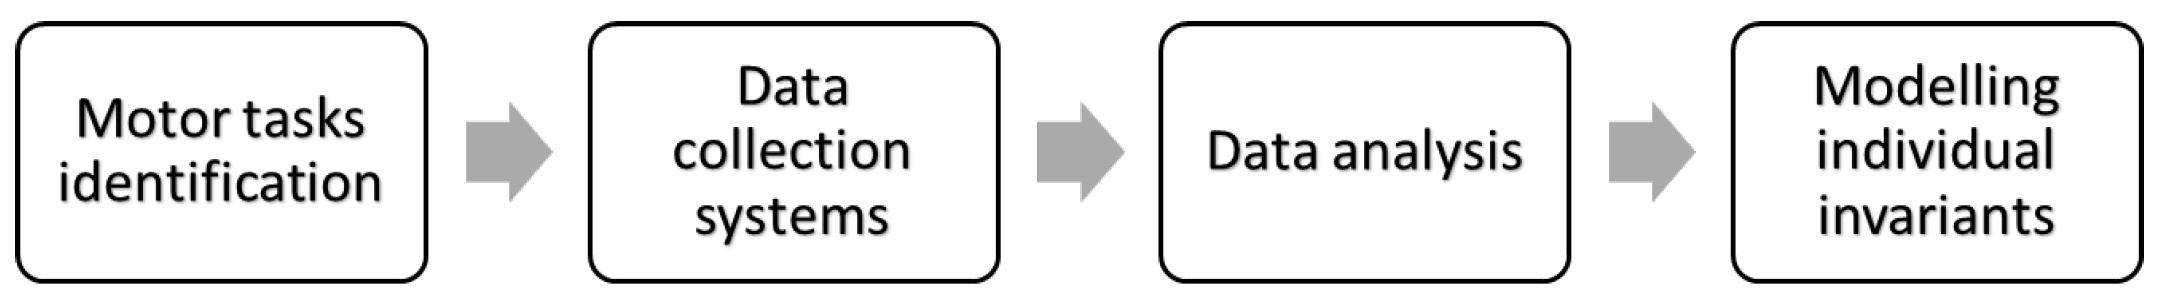
The project has a threefold scope:
(a)
providing a theoretical foundation of a set of motor tasks employed to evaluate the performance of posture and gait in at least three contexts: rehabilitation, sports performance, and good health training at different ages;
(b)
devising and testing a set of sensors that allow obtaining the above measures;
(c)
defining a preliminary set of experiments and algorithms to identify individual profiles and compute, via machine learning methods, the correct set of functional exercises.
Finally, this paper presents the experimental apparatuses and describes the experimental design strictly related to the goals mentioned above. The experiments conducted were structured for a final purpose: obtaining an experimental system for identifying the correct patterns to be devised in the project’s future developments.
The rest of the paper is organized as follows. Section 2 provides an overview of the relevant references to similar studies. Section 3 discusses the project’s expected research outcome, and Section 4 introduces the overall experimental design. Section 5 presents a preliminary evaluation of the data collected by the designed setup. Finally, Section 6 presents some conclusions and sketches further work.

2. Related Work

Posture is studied in two aspects: (a) postural control and (b) postural orientation. The former involves studying the positional control of the body in space and orientation. Instead, the latter involves studying the relationships between body segments. A neutral state (also known as neutral posture) is observed when the upper trunk and head are at zero degrees concerning the vertebral column. Subjects deviating from this neutral posture are said to have low stability that can provoke accelerated intervertebral disc (IVD) degeneration, damage, and misalignment of vertebrae, producing nerve compression that can cause radicular manifestations, such as sensorimotor deficiencies and pain in the involved regions [17]. When considering the maintenance of the vertical posture in everyday life situations, postural control might become a complex task that requires the ability to anticipate and compensate postural strategies when fast actions are performed and when environmental perturbations are applied [18]. How individuals control their preparatory and compensatory postural adjustments is still under debate [19]. Several mechanisms help individuals to keep their posture when task conditions change due to self-inflicted perturbation (e.g., I am suddenly moving my upper arm forward [20] or when somebody is pushing me [21]). These mechanisms are represented by changes in the activation levels of postural muscles called early postural adjustments (EPAs), starting up to 1000ms prior to the impact [22], and anticipatory postural adjustments (APAs), starting 0–150ms prior to the impact [23]. The primary role played by the EPAs is to adjust the posture and facilitate action planning. Typical examples are seen in preparation for making a step [24] or to avoid contact with an approaching object [25]. On the other hand, the function of APAs is to generate forces that act against an effect (mechanical) of a predictable perturbation [26]. Here we concentrate on these ecological motor tasks where individuals are challenged to control posture when facing a highly dynamic situation. The tasks selected in this experimental design involve sequences of actions that require the maintenance of stable posture while standing on an unstable proprioceptive platform and receiving in an unexpected or expected way a perturbation requiring sudden balance recovery. These motor tasks will help unveil the individual strategies adopted given the individual’s level of skill. Based on the literature background, a single limb stance is regularly used to examine the postural system [16,27,28,29],
EMG, electrocardiography (ECG), and inertial sensors integrated into wearables are emerging as promising low-cost and easily usable solutions in everyday life [13] and health care contexts [30]. Inertial measurement unit (IMU)-based movement identification can be achieved by statistical classification or be threshold-based [31]. Such statistical methods utilize supervised machine learning, which links features of a movement to possible movement states in terms of the observation’s possibility [32]. Many of these studies are devoted explicitly to disabled people with diminished gait/posture abilities. This holds for multiple sclerosis patients [33] and Parkinson’s disease sufferers [30,34,35]. The ability to monitor the gait of multiple sclerosis patients and provide correct biofeedback can help prevent falls and detect freezing (an aspect that can be fruitful also for Parkinson’s patients) [33,36]. Prototype systems often include integrated sensors located on the ankles to track gait movements. Body sensors are positioned near the cervical vertebra or on the shoulders to monitor body posture [13]. Many systems can also measure parameters that might be difficult to provide manually, such as the maximum acceleration of the patients during standing up, or the time it takes from sitting to standing [37,38].
Moreover, the current diffusion of machine learning methods employed in gait, posture analysis, and feedback is not comprehensive, but a few significant results have already been achieved. A relevant group of investigations has been designed for decoding algorithms for brain–machine interactions (BMIs) that use the spiking activity as their control signal [39]. These approaches are powerful in devising usable technologies. Specifically, feedback for reinforcement-learning-based brain–machine interfaces using confidence metrics has been addressed [40]. Some studies show how to derive the required evaluative feedback from a biological source, using both the feedback’s quantity and quality, and incorporate it into reinforcement learning controller architecture to maximize performance. Analogously, the Berlin BCI has developed an accurate system that works from the first session in BCI-naive Subjects [41].
An overview of the various steps in the brain–computer interface (BCI) cycle, i.e., the loop from the measurement of brain activity, classification of data, feedback to the subject, and the effect of feedback on brain activity, is the focus of [30,42]. On the other hand, the role of technology for accelerated motor learning in sports is investigated in [43]. Finally, parallel man–machine training in ECG-based cursor control development is the subject of [30,44]. Some references should be given to smart environment previous investigations as a foundation of the method developed here, emphasizing some development related to energy management [45] and concerning the design of energy-efficient transmission protocols for wireless body area networks [46,47]. However, the systems mentioned above present many limitations related to accessibility, economic cost, size, battery life, intrusiveness, and usability (i.e., controlled and uncontrolled home or working context) environments.

3. Expected Research Outcomes of the Project

This section illustrates the project goals, reporting the most suitable application scenarios of the technology we envision and an overview of the presented architecture design. For better comprehension, the goals are presented from a top-down perspective.
(a)
basic application scenarios;
(b)
envisioned technology;
(c)
system architecture workflow.

3.1. Application Scenarios

Three different potential application scenarios have been devised under the supervision and collaboration of psychiatric medicine personal and sports training experts. Scenario 1 was a controlled environment enriched with a set of sensors to the extent that it makes this environment smart. Scenario 2 was set without specifying whether the performed activities were to be carried out indoors or outdoors. It is legitimate to suppose that the environmental setting shall be relatively poor regarding available interactions, including the potential unavailability of an Internet connection. Scenario 3 identified variations determined by post-traumatic rehabilitation, personalized performance control over the evolution of illnesses with harmful consequences on the patient’s stability, and training of athletes with special needs.
  • Scenario 1: Diagnostic Evaluation
In the context of a psychiatric medical practice, a patient who suffers from postural instability due to a traumatic event (e.g., car accident) or neurodegenerative disorder is visited by medical personnel. The diagnostic process is assisted with the envisioned technology. The patient is asked to execute a sequence of three exercises: single-stance stability test, forward movement of arms with weights, and step-on gait on a free-range. During the exercises, the patient wears a jacket equipped with a set of sensors and interacts with a visual focus tool that helps her to identify a fixed point at a given distance. The jacket interacts with an application that works on the cloud, measures the reaction time or other variables, including anticipation’s effectiveness in the movements, and provides the operator the possibility of marking progress in performance quality based on a fixed threshold that the operator can define concerning age, sex, and the clinical condition of the patient. The whole process is recorded on video, and the instrumental measures are saved on the patient’s profile.
  • Scenario 2: Sport performance benchmarking
An athlete training for a sporting event is monitored by her coach. He provides her with a performance benchmark in line with the event requirements and expectations. The athlete has a given training period for preparing for the event and a performance level she has to accomplish in order to be competitive. The performance benchmarks have been defined by the coach based on the athletic preparation path of the athlete. While following the coach’s requests, the athlete executes some training exercises while wearing the jacket described in Scenario 1. Every athlete’s exercise is compared against the benchmark performance and consequently identified in terms of a negative gradient concerning the benchmark itself.
  • Scenario 3: Rehabilitation Follow-Up
During the rehabilitation period, a patient wearing the jacket described in Scenario 1 attends a program consisting of a series of exercises. Each step in the series requires comparing the performance with the provided reference benchmark defined by the psychiatrist during the diagnostic process. The patient measures are the same as in Scenario 2 and represent how a patient uses the jacket in a medical context.

3.2. Envisioned Technology

Our project’s aim is to design an accessible, low-cost, small, dedicated low-cost technological solution (i.e., Gait and Posture Smart Jacket (GPSJack)) suitable for the previously introduced application scenarios. Figure 1 shows a graphic representation of the envisioned technology where the subject is wearing the GPSJack and is immersed in the Gait and Posture Smart Environment (GPSEnv). Numbers 1–5 mark the sensors attached to the jacket, and number 6 marks the tablet application used by the top-level user. Medical and potentially sports training staff can interact with the GPSJack/GPSEnv through a tablet to guarantee total portability and versatility of the envisioned technological solutions.
Therefore, the GPSJack system represents the low-cost inertial sensor-based system, which is the project’s final goal. GPSEnv represents the adaption of the existing state-of-the-art technologies to the presented scenarios for validation purposes. The final GSPJack/GPSEnv architecture will provide to medical/sports staff the capability to perform the following actions:
  • register a GPSJack/GPSEnv administrator;
  • start setup of a GPSJack/GPSEnv;
  • registration of a new user;
  • definition of the profile of a registered user;
  • eliminate a profile;
  • execution of a base test for a registered user;
  • registration of a new exercise;
  • registration of a new benchmark for an existing exercise;
  • assignment of a benchmark for a given exercise to a specific user;
  • execution of an exercise;
  • registration of a sequence of exercises as a training path;
  • association of benchmark values for a training path;
  • assignment of benchmark values for a training path to a given user;
  • visualization of a single test progresses along a temporal interval;
  • visualization of progresses with respect to a given benchmark;
Based on the above-defined functions, several background software instruments are required. The technologies for managing and analyzing the data from the sensors, which we may name the GPSJack Framework, have been envisioned. Nevertheless, machine-learning-based algorithms will guide the personalization of the benchmark process by employing intelligent reinforcement learning methods. Finally, since the proposed technology has its main applications in healthcare, it will provide, in addition to the classical data protection techniques, a physical protection layer that, based on the radio signals’ propagation patterns, will habilitate the possibility of utilizing the tablet if and only if the tablet is under a certain distance (e.g., 5 m) from the GPSJack nodes.

3.3. Architecture Workflow

The system’s architecture is composed of several modules, each one with a single responsibility, the logic model of which is reported in Figure 2.
Every module is related to at least another one:
User Interface: 
allows the user to input “environments” and provides visualization of all data/results returned by the Machine Learning module;
Configurator: 
takes as input a set of environments and gives as output a set of feasible “exercises” to be used by the Trainer, according to user input and machine learning algorithms’ indications;
Trainer: 
uses the exercises and determines the “should be” paths, meaning which exercises shall be executed and with which environment;
Evaluator: 
responsible for the evaluation of data and automatic comparison with benchmarks;
Sensor: 
deals with wearable sensors, collecting and normalizing data;
Machine Learning: 
gathers data and induces models.
The User Interface’s output is an ordered set of “environments”, which are one of the inputs of the Configurator. The Configurator continuously computes, and at given times uses models from the Machine Learning module to produce a set of feasible “exercises”. These exercises are to be given to the Trainer, whose outputs are chains of exercises, also named “paths”, to be executed by patients (or athletes). At different times, different paths are possible due to the work of the Trainer. The data are then gathered from the Sensor module and sent to the Evaluator to be stored, visualized, and compared with benchmarks. They are also used to devise possible “paths” and exercises to be delivered as hints to the user. This is the responsibility of Machine Learning, which acts as a feedback generator for the whole system, enabling the system to enhance performances continuously.

4. Methodology Design Workflow

This section presents the overall project information concerning hardware composing the GPSEnv and GPSJack, and software regarding edge computation and the preliminary data analysis pipeline. To achieve the system’s architectural requirements, we have designed a four-step method, illustrated in Figure 3.
-
the first step consists of the identification of the most suitable motor tasks;
-
the second step consists of the description and design of the used data collection systems composing the GPSEnv/GPSJack;
-
the third step exploits the collected data analysis workflow;
-
the fourth step exploits the modeling of individuals’ gait and posture invariants by machine learning.

4.1. Identification of Motor Tasks

The motor tasks should contain specific characteristics. We aimed to select tasks that challenge postural stability and require the ability to foresee and anticipate the consequences of actions given the presence of a sudden perturbation that might change posture from a stable to an unstable state. In this way, we will be able to train fundamental motor skills such as action adaptation, compensation, and anticipation, while, on the other hand, measuring the performance of such skills. We will describe a typical trial involving a sequence of movements that satisfies the task requirements stated above:
(1)
The subject stands on an unstable proprioceptive board (Figure 4) while holding a heavy ball. The task is to rotate at an angle of 30 or 60 or 90 , both right and left, while keeping his feet still and rotating only the torso, without losing equilibrium. Body balance is evaluated by analyzing the center of pressure (COP) migration. This sequence of activities identifies two distinct motor task phases: (a) rotate and (b) in position.
(2)
Once in position, the subject is asked to drop the ball quickly (in the 150 ms preceding this action, the anticipatory postural adjustments (APAs) can be identified and analyzed) captured by the EMG and the force platform. This sequence of activities identifies two distinct motor task phases: (c) APAs and (d) drop.
(3)
After the loss of balance (due to the fast drop of the ball), the subject is asked to regain the balance as fast as possible. The analysis of COP migration for defining the balance recovery after the perturbation is considered. This activity identifies one motor task phase: (d) recover.
We analyzed different experimental conditions to define the departure from the standard measurements by considering the same task while changing the biomechanical and perceptual conditions and testing different populations ranging from elite athletes to individuals affected by neuromuscular diseases. Figure 5 presents an overview of the force platform x-axis data of a motor task. As shown, it is composed by five different movements: (a) rotate, (b) in position, (c) APAs, (d) drop, and (e) recover. The task starts at most 10 s after the emission of an audio signal. Such a signal is later used during the manual synchronization of the GPSJack and GPSEnv data streams.

Data Collection Procedure

To validate the GPSJack system, subjects of different ages, genders, and motor backgrounds performed the introduced protocol of exercises. This protocol aimed to analyze the tested subjects’ gait and posture using state-of-the-art instrumentation to identify the anticipatory movements and minimum requirements that the GPSJack nodes (as shown in Figure 1) will have to implement.
Figure 4 presents the proprioceptive board. Area dimensions were 0.45 m × 0.45 m, and height was 0.025 m. On the bottom of the surface, the board was touching the ground utilizing a beam glued along the board mid-line, having the same length as the wooden board, and being 0.025 m in height and 0.06 m in width. Figure 6, on the left, presents how the board was used during the exercise.

4.2. Data Collection Systems

This section presents the instruments involved in the design of the GPSEnv and GPSJack systems. GPSEnv is defined as a state-of-the-art apparatus. GPSJack was designed to be a low-cost and long-battery-life system on chip (SoC).

4.2.1. GPSEnv Apparatus

It performs gait and posture analyses based on the combination of three different instruments:
  • Force platform;
  • Surface EMGs;
  • Motion capture cameras.

Force Platform

The forces in three orthogonal directions, along with the COP migration, are measured by a force platform (https://tinyurl.com/rhkktv4 accessed on 10 December 2022), coupled with a 6-channel strain gauge amplifier (https://tinyurl.com/zy2efpn8 accessed on 10 December 2022), with a sampling frequency of 1000 Hz, presenting a size of 0.9 m × 0.9 m. The AMTI Biomechanics Force Platform, model BP900900, features composite construction, resulting in a low-mass instrument with excellent frequency response. Specifically designed for the precise measurement of ground reaction forces, the BP900900 measures the three orthogonal force components, the moments about the three axes, and the center of pressure in the horizontal plane producing a total of eight outputs. The high sensitivity, low crosstalk, excellent repeatability, and long term stability of this platform make it ideal for research and clinical studies. The BP900900 is easy to use and is available with 1000, 2000, or 4000 pound (4450, 8900, or 17,800 Newtons) vertical capacity. This force platform is shown in Figure 6, on the left part, under the subject’s feet, and in right image, represented virtually as platform 1.

Surface electromyography (EMG)

The surface EMG activity of sixteen postural muscles, on both sides of the body, is recorded using electrocardiographic electrodes located on the subject’s body, as shown by the red markers in Figure 7. The muscles used are: the rectus abdominis (RA), erector spinae (ES), rector femoris (RF), biceps femoris (BF), vastus lateralis (VL), tensor fasciae latae (TL), tibialis anterior (TA), and soleus (SO). Guidelines from the http://www.seniam.org/ accessed on 10 December 2022 (Surface ElectroMyoGraphy for the Non-Invasive Assessment of Muscles) are used to guarantee consistency in the muscles’ anatomical localization. The https://fccid.io/VH6ZWTX07/User-Manual/User-Manual-903877 accessed on 10 December 2022 EMG system, produced by Aurion S.r.l., is used to collect and amplify EMG signals at a sampling rate of 1000 Hz.

Motion Capture Cameras

Concerning the kinematic analysis, five retro-reflective markers are attached to each subject. Markers’ positions are located on the subject’s body as shown by the black markers in Figure 7.
The markers are placed on the backs of both hands, on the forehead, on the lowerback, and on the lateral malleoulus on the dominant leg. The position, velocity, and acceleration of every marker are recorded at a sampling rate of 200 Hz, using eight motion capture cameras (https://www.evl.uic.edu/sjames/mocap/resources/Doc/MXhardware_Reference.pdf accessed on 10 December 2022), featuring multiple high-speed processors that perform real-time proprietary image processing and Vicon Nexus 2.6 software.

4.2.2. GPSJack Apparatus

The GPSJack prototype uses the nRF52840 system on chip (SoC), built over the 32-bit ARM CortexTM-M4 CPU with a floating-point unit running at 64 MHz. The nRF52840 is the most advanced member of the Nordic Semiconductor nRF52 Series SoC family (https://www.nordicsemi.com/Products/Low-power-short-range-wireless/nRF52840 accessed on 10 December 2022). It is fully multi-protocol and capable of supporting Bluetooth 5, Bluetooth mesh, Thread, Zigbee, 802.15.4, ANT, and 2.4 GHz proprietary stacks [48]. Furthermore, the nRF52840 uses a sophisticated on-chip adaptive power management system achieving exceptionally low energy consumption.
This SoC interfaces with various electronic devices capable of perceiving different types of measurement of the movement context. In the setup we discuss here, the nRF52840 defines the core of each GPSJack node. On the same HW board, each SoC core communicates with various sensors, such as an accelerometer, gyroscope, and magnetometer. However, since the design of every single node of the GPSJack from scratch would require further targeted effort, and since the goal of the project is to show the suitability of the system in recognizing the different phases of the defined task, we made use of the Nordic Thingy 52 IoT Sensors kit shown in Figure 8. In future developments, the Nordic Thingy 52 can be replaced by dedicated data collection nodes based on the nRF52840 SoC, presenting reduced dimensions and integrating only sensors relevant to the scenario. It transmits data to/from its sensors and actuators to a receiver implemented through a PC, single board computing (SBC) (e.g., Raspberry pi 4 or Odroid H2+), or a mobile application running on a tablet or smartphone [48]. Extended device characteristics are listed in the following:
  • Dimensions: 5 cm × 5 cm × 1.5 cm, weight: 47 g;
  • Motion-tracking sensors: nine axis motion sensor including 3-axis gyroscope, 3-axis accelerometer, and 3-axis magnetometer;
    -
    Sampling frequency: up to 200 Hz;
    -
    Full scale: up to 16 g for accelerometer and up to 2000 dps for gyroscope;
  • Battery: rechargeable Li-Po battery with 1440 mAh capacity;
  • Microprocessor: 64 Mhz Cortex M4 MCU;
  • Communication: Bluetooth Low Energy (BLE);
  • Cost: 38 Dollars.
Nodes positions and number are not definitive, since their positions directly depend on the preliminary study carried out with the previously introduced instrumentation. The GPSJack sampling frequency, the number of nodes, and the positions will be adjusted (reduced) based on the previous phase’s outcome, thereby reducing the battery consumption of the overall system.
Moreover, the designed GPSJack system can be composed of up to 11 different nodes that collect data and communicate with a single tablet or SBC device. Based on the performed tests, the designed GPSJack (configured as shown in Figure 1, 5 nodes and 1 data aggregator) can communicate, without data loss, with the tablet device at a maximal distance of 45 m. Concerning the battery life, the GPSJack data collection nodes can compute for more than 48 h at a sampling frequency of 200 Hz.
Figure 9 presents an overview of the main characteristics of the GPSJack android mobile application running over a tablet device, presenting data collection and visualization.
The raw data (aka, time series), perceived by the GPSJack prototype (at a maximal sampling frequency of 200 Hz) and the existing in-laboratory architecture (perceived at a frequency of 200–1000 Hz), will be pre-treated by applying different data processing steps.
Finally, the GPSJack android mobile application executing on a tablet device has the ability to video-record at 60 FPS the performed tasks. Such recording is synchronized with the data stream perceived by the data collection nodes (i.e., Nordic Thingy 52).

4.2.3. GPSJack/GPSEnv Synchronization

The GPSJack and the GPSEnv data streams present different timestamps and are not synchronized. The synchronization is manually performed offline, using the audio start signal emitted by the Vicon system and the video recording of the task performed by the GPSJack system. The annotator identifies the precise timestamp of the GPSJack system where the start audio signal is emitted by the GPSEnv system. In particular, the annotator identifies the precise video frame during which the signal is emitted (i.e., a granularity of 16 ms). In future developments, the aim will be to automatically synchronize the GPSJack/GPSEnv data streams using existing solutions [49], thereby excluding the time-consuming offline synchronization process.

4.3. Data Analysis

This section presents, starting with the data collected by the mentioned instruments (i.e., EMGs, force platform, kinematic, and GPSJack), the main data processing steps, performed with different processing methods in a defined order [50]. This workflow is presented in Figure 10.

4.3.1. Data Cleaning

This phase emphasizes data patterns by reducing their dependence on environmental/HW noise and the data collection architecture, which often leads to data loss or corruption during transmission. In particular, dedicated data cleaning techniques must handle missing or corrupted data to maintain the time series structure and information. In this step, the corrupted and missing data issue is handled by applying an interpolation data-filling method that replaces such data with a value that follows the time series’s previous and consequent pattern [51]. The noise’s impact is reduced by applying a 4-order low-pass filter with a cut-off frequency of 20 Hz. We do not apply any data cleaning method to the existing in-lab architecture, since the architecture’s proprietary software already performs such a step.

4.3.2. Feature Extraction

Furthermore, since standard pattern-recognition models are not always suitable for raw data, the machine learning training phase is anticipated by a feature extraction step during which time-series are represented as a set of features in the time and/or frequency domain [52,53]. We make use of the https://github.com/fraunhoferportugal/tsfel accessed on 10 December 2022 [54] to represent each time window of 150 ms (equal to the APAs movement duration) perceived by the mentioned instrumentation in a set of 160 features in the frequency and time domains.
Table 1 shows the most commonly extracted time (e.g., min, max, mean, std, etc.) and frequency (e.g., Fast Fourier Transform (FFT), Discrete Fourier Transform (DFT), Discrete Wavelet Transform (DWT), etc.) domain features that are usually combined, further increasing the recognition accuracy. Other features, extracted by using other frameworks or handcrafted (extracted manually), can be used, since the proposed workflow is modular. Thus, we can easily substitute each module.
BUsers could also decide not to apply the feature extraction step and use the date in the form provided by the previous block applying a standard data segmentation phase. In such a case, the feature selection algorithm is not applied [13,50].

4.3.3. Preprocessing of Features

The extracted features could present a wide range of values that will govern the training process, but such features are not those that primarily represent the dataset’s characteristics or the final pattern-recognition model’s accuracy. Data normalization transforms multi-scaled data to the same scale, and all variables equally influence the model, improving the learning algorithm’s stability and performance [55]. Our methodology makes use of the robust scaling normalization technique that scales each feature of the dataset by subtracting the median ( Q 2 ( x ) ) of this feature and then dividing by the interquartile range (IQR) ( Q 3 ( x ) Q 1 ( x ) ). This scaler is robust to outliers, in contrast with the other scalers that arehighly affected by outliers. When working with datasets in which different features are used to represent every single sample, the datasets perform independent normalization for every feature.
Moreover, a large number of features does not imply high recognition quality, since they can positively or negatively impact the recognition process. Therefore, feature selection techniques identify features that positively and negatively influence the recognition process, reducing the model’s dependence on irrelevant features. The exclusion of a certain number of features decreases the training process’s complexity, since a smaller dataset generally requires less training time. The main benefits of such techniques are (i) reducing overfitting by eliminating redundant data, which consequently reduces noise-related issues; (ii) improving accuracy, since misleading data are eliminated; (iii) reducing training time due to fewer data points; and iv) raising interest in certain features demonstrating higher importance [55,56]. We use the tree-based feature selection technique to compute impurity-based feature importances, discarding irrelevant features in cooperation with other feature selection techniques.
In conclusion, the execution of this series of data treatment steps transforms the raw data, subject to noise and errors, to an optimal number of features in the time and frequency domains. This features set will be used by the machine learning models in the fourth phase of the methodology, as shown in Figure 3. The features-preprocessing step is anticipated by the hold/leave-out validation techniques, generating the training and testing datasets. Then, the training dataset will be preprocessed as mentioned above, and then the testing dataset is preprocessed based on the training dataset’s requirements.

5. Preliminary Experimental Evaluation

Following the experimental design of Section 4, we collected data from 12 different male subjects, whose physical characteristic are shown in Table 2.
At the end of the data collection phase, each subject had performed a total of 84 7 tasks (i.e., do not rotate, rotate of an angle of 30 or 60 or 90 , both right and left) × 2 statuses (i.e., stable/unstable) × 6 repetitions) data collection sessions. Each session involved the five movements phases (i.e., rotate, in position, APAs, drop, and recover) described in Section 4.1 and shown in Figure 5.
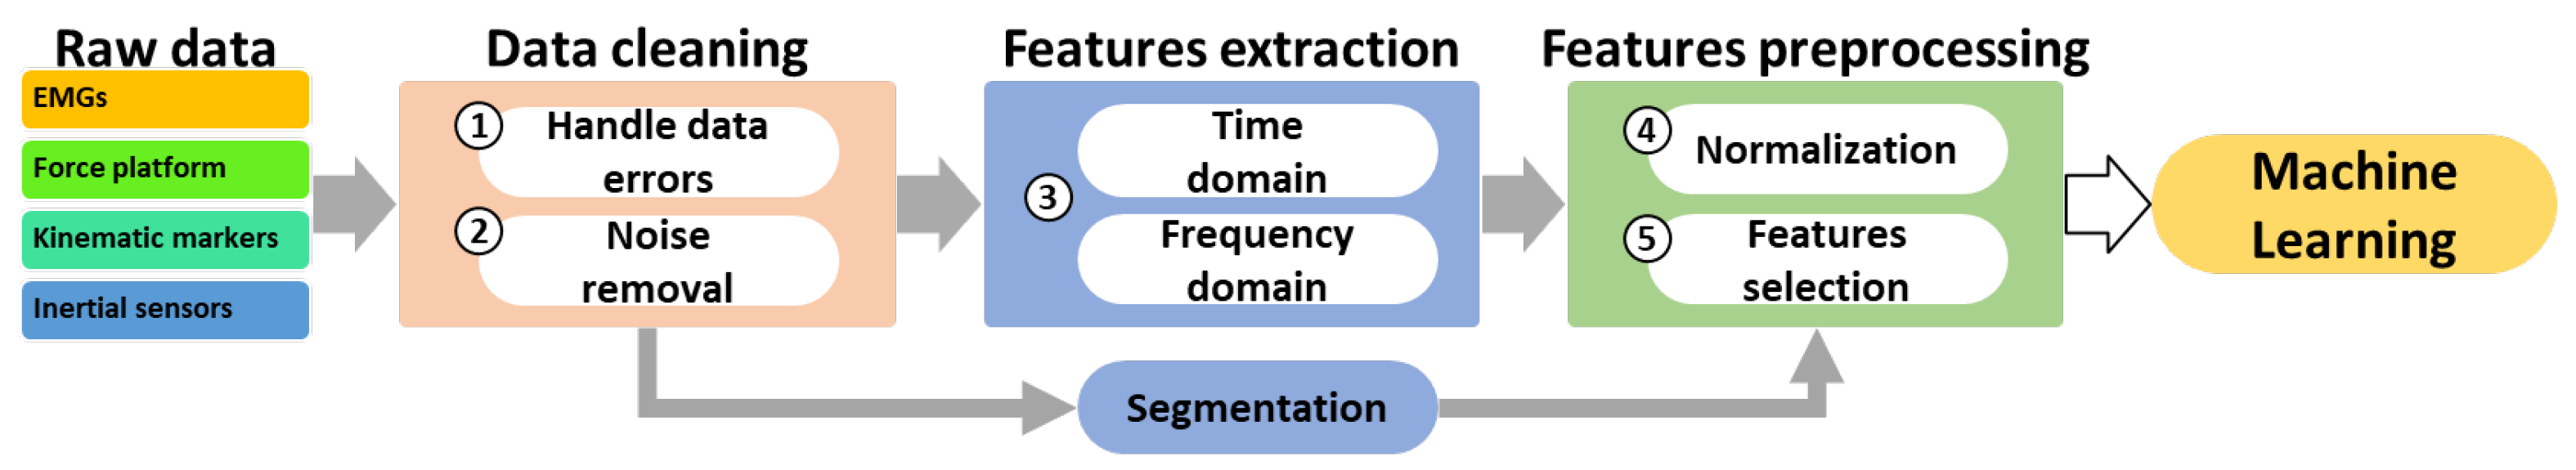
In this preliminary evaluation, the collected data are divided based on the data collection technologies we utilized (force platform, EMGs, or acceleration data) into three different datasets, as shown in Table 3.
Subsequently, for each dataset type (i.e., A, B, and C), we applied the data-processing pipeline defined in Section 4.3 and shown in Figure 10. In particular, the data, in segmentation and feature representation forms were segmented in time windows of 150 ms as the hypothetical duration of the APA movement phase), were used to train three different machine learning models, whose performances in recognizing the movement phases of Figure 5 were measured in terms of accuracy A), precision (P), recall (R), and F1-score (F1), defined as follows [57]:
A = t p + t n t p + t n + f p + f n P = t p t p + f p R = t p t p + f n F 1 = 2 × P × R P + R
Here, tp represents the number of true positives, n represents the number of true negatives, fn represents the number of false negatives, and fp represents the number of false positives.

5.1. Preliminary Results

Table 4 and Table 5 present the results of our preliminary analysis. Table 4 presents the results for datasets A, B, and C from all subjects simultaneously by performing a k-fold test (k = 5) on all subjects’ data. Table 5 presents the results for datasets A, B, and C for every single subject by performing a k-fold test (k = 5) on each subject’s data.
The results of Table 4 show that the random forest performed the best on all three datasets (i.e., A, B, and C), and for both data-treatment types (i.e., segmentation and feature extraction). Moreover, when differentiating by dataset type, the results show that the conjunct information of dataset A (i.e., EMGs and Force Platform) and dataset B (i.e., acceleration values) was put to use significantly better than when used separately. In particular, in terms of F1-score, there was an increment of 12.2% from dataset A to dataset C and 39.9% from dataset B to dataset C. Such results indicate that the acceleration provides precious information concerning the recognition of the studied activities. Overall, the achieved F1-scores for all subjects using the random forest model and dataset C were 88.2% and 89.6%, respectively, in segmentation and feature representation modes.
Table 5 shows that when training and testing the models with one specific subject, the models’ performances are subject-dependent. As shown from the statistics of each model for all subjects (bottom of the table), the RF model performed much better (F1 score > 91.6%) in both segmentation and feature representation modes, showing that the recognition accuracy, in terms of F1-score, is on average 5% higher than when training and testing with all 12 subjects’ data (see Table 4). Again, differentiating by dataset type, the results show that the conjunct information of dataset A (i.e., EMGs and Force Platform) and dataset B (i.e., acceleration values) performed significantly better than when used separately. In particular, on average, there was an increment of 7.3% in the F1-score from dataset A to dataset C and 31.1% from dataset B to dataset C.

5.2. GPSJack Evaluation

Concerning the suitability and principal characteristics of the GPSJack system, this section presents its evaluation in terms of RAM, storage, CPU, battery consumption, and data loss. In particular, a Samsung Galaxy Tab A7 with the following HW/SW characteristics has been tested in the setup described below.
  • Processor: Qualcomm Snapdragon Octo-Core (4 × 2 GHz + 4 × 1.8 GHz);
  • Operating system: Android 10;
  • RAM: 3 GB;
  • Storage: 32 GB;
  • Connectivity: Bluetooth 5.0, Wi-Fi a/b/g/n/ac Dual Band;
  • Battery: 7040 mAh;
  • Dimension: 247.6 × 157.4 × 7 mm per 476 g;
  • Price: $140.
Three Nordic Thingy 52 were connected to the Samsung Galaxy for three consecutive hours. The setup was tested once for each sampling frequency: (i) 50 Hz, (ii) 100 Hz, and (iii) 200 Hz. Table 6 presents the evaluation results obtained using the Android Studio Profiler suit.
As observed, the designed system can work on various setups with no data loss and low storage, RAM, and CPU usage. Moreover, its battery consumption allows a data collection phase of almost 8 h. Based on the tests performed during the project, the Nordic Thingy 52 can efficiently compute for more than 48 consecutive hours at 200 Hz.

5.3. Discussion

The results of these preliminary experiments clearly show that the conjugate of EMG, Force Platform, and acceleration data performs considerably better than their separate utilization. This improvement enables a better understanding and in-depth study of human motion. In fact, the GPSJack prototype has good potential to capture relevant information, enabling the possibility to recognize the studied motion classes with an average F1-score of 89.6% when using all the subjects’ data at once. Furthermore, when tested on single subjects, the F1-score ranged from a minimum of 83.2% to a maximum of 100%, outperforming the usage of only one of the aforementioned data sources. Even though the collected acceleration data present precious information, further work must be conducted to increase the overall performance and reduce the dependence on state-of-the-art technology. This can be done by: (i) implementing more complex recognition models than the used k-NN, RF, and LDA; and (ii) exploiting the utilization of a larger number and different positions of data collection nodes on the human body. Nevertheless, the information generated by the EMG and Force Platforms is paramount; thus, a possible next step in addition to those mentioned above would be the integration of EGM sensors into the same GPSJack nodes.

6. Conclusions and Further Development

This paper has dealt with defining the experimental design of the “Biofeedback Wearable and Environmental Technologies for Postural Correction” project. We illustrated the target technology, described the project’s evaluation workflow (i.e., state-of-the-art instruments and low-cost wearable sensors, data processing flow, and machine learning-based analysis), and provided a high-level description of the context in which the envisioned technologies are forecasted to operate. In particular, we devised a methodology investigating how to build the parameters that allow the physiatric medical staff to evaluate the patient. Three challenging motor tasks were identified to, on the one hand, train fundamental motor skills such as action adaptation, compensation, and anticipation, and on the other hand, to measure the performance levels fir such skills. To measure the quality of the performed motor tasks, we evaluated a low-cost body area network (aka GPSJack). GPSJack uses at most eleven data collection nodes integrating an accelerometer, gyroscope, and magnetometer sensors and can compute for 48 h at a sampling frequency of 200 Hz. Moreover, we used an android mobile application that works as a data aggregator and controller for the GPSJack system, through which the user can observe the collected data and the posture and gait quality indicators. Nevertheless, in conjunction with the GPSJack, we integrated the GPSEnv based on state-of-the-art gait and posture evaluation systems.
Tests on data collected from 12 subjects for a total of 84 data collection sessions each showed that the designed system could highly accurately recognize the phases of the defined motor tasks. In particular, in a subject-independent setup, we achieved an F1-score of 89.6% in recognizing the five studied movement states (i.e., rotate, in position, APAs, drop, and recover). With a subject-dependent setup, the F1-score ranged from 100% for subjects 23 and 26 to 83.2% for subject 22. These results show that the acceleration information that we will add to the state-of-the-art systems significantly increases recognition capabilities.
It is widely accepted in the community of psychiatric medicine that proper quantification of the postural system’s efficiency represents an essential assessment for improving quality of life in the elderly, patients with neurological pathologies, and athletes. Moreover, since most of the actual measurements are made in a laboratory environment where natural movements are constrained by the instruments applied to subjects’ bodies and the environment, a system usable in uncontrolled and unconstrained environments (e.g., home, gym, or sports facilities) habilitates the individuals to move freely in their natural environment and perform the required motor tasks. Thus, the designed system will evaluate profiles from the performance viewpoint of individuals ranging from patients undergoing rehabilitation to top-level elite athletes in controlled and uncontrolled environments.
Since the final goal of the project is performing the defined task in uncontrolled environments and using only the acceleration information provided by a system such as GPSJack, the next step will concern the exploitation of the data collection phase while making use of a large number of nodes positioned on different body parts and of more complex pattern-recognition models than the used k-NN, RF, and LDA. In particular, deep learning models such as recurrent neural networks (RNN) and long short-term memory (LSTM) have shown optimal results in such fields. Moreover, since the information captured by the EMG sensors is paramount, integrating an EMG sensor into the GPSJack nodes should be considered.

Author Contributions

Conceptualization, P.C., G.P., P.M.P. and M.C.; methodology, P.C., G.P., F.D., P.M.P. and M.C.; software, T.C.W., F.D., C.T. (Claudio Tomazzoli), C.T. (Cristian Turetta) and F.P.; validation, T.C.W., F.D., L.Z., C.T. (Claudio Tomazzoli), C.T. (Cristian Turetta) and F.P.; formal analysis, P.C., G.P., F.D., P.M.P. and M.C.; investigation, All Authors; writing—original draft preparation, All authors; writing—review and editing, F.D., T.C.W., M.C., G.P. and P.C.; supervision, P.C., G.P. and M.C.; project administration, P.C., G.P., P.M.P. and M.C.; funding acquisition, P.C., G.P., P.M.P. and M.C. All authors have read and agreed to the published version of the manuscript.

Funding

This research was funded by Regione del Veneto grant number 1695-0007-1463-2019.

Data Availability Statement

Data are available at request.

Conflicts of Interest

The authors declare no conflict of interest.

References

  1. Sell, T.C. An examination, correlation, and comparison of static and dynamic measures of postural stability in healthy, physically active adults. Phys. Ther. Sport 2012, 13, 80–86. [Google Scholar] [CrossRef] [PubMed]
  2. Sell, T.; Tsai, Y.S.; Smoliga, J.; Myers, J.; Lephart, S. Strength, flexibility, and balance characteristics of highly proficient golfers. J. Strength Cond. Res. 2007, 21, 1166–1171. [Google Scholar]
  3. Riva, D.; Bianchi, R.; Rocca, F.; Mamo, C. Proprioceptive Training and Injury Prevention in a Professional Men’s Basketball Team: A Six-Year Prospective Study. J. Strength Cond. Res. 2016, 30, 461–475. [Google Scholar] [CrossRef] [PubMed] [Green Version]
  4. Riva, D.; Rossitto, F.; Battocchio, L. Postural muscle atrophy prevention and recovery and bone remodelling through high frequency proprioception for astronauts. Acta Astronaut. 2009, 65, 813–819. [Google Scholar] [CrossRef]
  5. Ageberg, E.; Roberts, D.; Holmstrom, E.; Friden, T. Balance in Single-Limb Stance in Patients with Anterior Cruciate Ligament Injury: Relation to Knee Laxity, Proprioception, Muscle Strength, and Subjective Function. Am. J. Sport. Med. 2005, 33, 1527–1537. [Google Scholar] [CrossRef]
  6. Rosengren, K.; Riva, D.; Mamo, C.; Fanì, M.; Saccavino, P.; Rocca, F.; Momenté, M.; Fratta, M. Single Stance Stability and Proprioceptive Control in Older Adults Living at Home: Gender and Age Differences. J. Aging Res. 2013, 2013, 561695. [Google Scholar] [CrossRef] [Green Version]
  7. Kobayashi, H.; Hayashi, Y.; Higashino, K.; Saito, A.; Kunihiro, T.; Kanzaki, J.; Goto, F. Dynamic and static subjective visual vertical with aging. Auris Nasus Larynx 2002, 29, 325–328. [Google Scholar] [CrossRef]
  8. Sherrington, C.S. The Integrative Action of the Nervous System; Cambridge University Press: Cambridge, UK, 2016. [Google Scholar] [CrossRef]
  9. Riemann, B.L.; Lephart, S.M. The sensorimotor system, part I: The physiologic basis of functional joint stability. J. Athl. Train. 2002, 37, 71–79. [Google Scholar]
  10. Cohen, H.; Heaton, L.G.; Congdon, S.L.; Jenkins, H.A. Changes in Sensory Organization Test Scores with Age. Age Ageing 1996, 25, 39–44. [Google Scholar] [CrossRef] [Green Version]
  11. Feller, K.J.; Peterka, R.J.; Horak, F.B. Sensory re-weighting for postural control in Parkinson’s disease. Front. Hum. Neurosci. 2019, 13, 126. [Google Scholar] [CrossRef] [Green Version]
  12. Kamieniarz, A.; Michalska, J.; Marszałek, W.; Stania, M.; Słomka, K.J.; Gorzkowska, A.; Juras, G.; Okun, M.S.; Christou, E.A. Detection of postural control in early Parkinson’s disease: Clinical testing vs. modulation of center of pressure. PLoS ONE 2021, 16, e0245353. [Google Scholar] [CrossRef] [PubMed]
  13. Demrozi, F.; Pravadelli, G.; Bihorac, A.; Rashidi, P. Human Activity Recognition Using Inertial, Physiological and Environmental Sensors: A Comprehensive Survey. IEEE Access 2020, 8, 210816–210836. [Google Scholar] [CrossRef] [PubMed]
  14. Demrozi, F.; Pravadelli, G.; Tighe, P.J.; Bihorac, A.; Rashidi, P. Joint Distribution and Transitions of Pain and Activity in Critically Ill Patients. In Proceedings of the 2020 42nd Annual International Conference of the IEEE Engineering in Medicine & Biology Society (EMBC), Montreal, QC, Canada, 20–24 July 2020; pp. 4534–4538. [Google Scholar]
  15. Mikos, V.; Heng, C.H.; Tay, A.; Yen, S.C.; Chia, N.S.Y.; Koh, K.M.L.; Tan, D.M.L.; Au, W.L. A wearable, patient-adaptive freezing of gait detection system for biofeedback cueing in Parkinson’s disease. IEEE Trans. Biomed. Circuits Syst. 2019, 13, 503–515. [Google Scholar] [CrossRef]
  16. Verhagen, E.; Bobbert, M.; Inklaar, M.; van Kalken, M.; van der Beek, A.; Bouter, L.; van Mechelen, W. The effect of a balance training programme on centre of pressure excursion in one-leg stance. Clin. Biomech. 2005, 20, 1094–1100. [Google Scholar] [CrossRef] [Green Version]
  17. Yoong, N.K.M.; Perring, J.; Mobbs, R.J. Commercial postural devices: A review. Sensors 2019, 19, 5128. [Google Scholar] [CrossRef] [Green Version]
  18. Piscitelli, D.; Falaki, A.; Solnik, S.; Latash, M.L. Anticipatory postural adjustments and anticipatory synergy adjustments: Preparing to a postural perturbation with predictable and unpredictable direction. Exp. Brain Res. 2017, 235, 713–730. [Google Scholar] [CrossRef] [Green Version]
  19. Latash, M.L. Muscle coactivation: Definitions, mechanisms, and functions. J. Neurophysiol. 2018, 120, 88–104. [Google Scholar] [CrossRef]
  20. Aruin, A.S.; Forrest, W.R.; Latash, M.L. Anticipatory postural adjustments in conditions of postural instability. Electroencephalogr. Clin. Neurophysiol. Mot. Control. 1998, 109, 350–359. [Google Scholar] [CrossRef]
  21. Bertucco, M.; Nardello, F.; Magris, R.; Cesari, P.; Latash, M.L. Postural Adjustments during Interactions with an Active Partner. Neuroscience 2021, 463, 14–29. [Google Scholar] [CrossRef]
  22. Krishnan, V.; Aruin, A.S.; Latash, M.L. Two stages and three components of the postural preparation to action. Exp. Brain Res. 2011, 212, 47–63. [Google Scholar] [CrossRef] [Green Version]
  23. Massion, J. Movement, posture and equilibrium: Interaction and coordination. Prog. Neurobiol. 1992, 38, 35–56. [Google Scholar] [CrossRef] [PubMed]
  24. Crenna, P.; Frigo, C. A motor programme for the initiation of forward-oriented movements in humans. J. Physiol. 1991, 437, 635–653. [Google Scholar] [CrossRef]
  25. Krishnan, V.; Latash, M.L.; Aruin, A.S. Early and late components of feed-forward postural adjustments to predictable perturbations. Clin. Neurophysiol. 2012, 123, 1016–1026. [Google Scholar] [CrossRef] [PubMed] [Green Version]
  26. Cordo, P.; Nashner, L.M. Properties of postural adjustments associated with rapid arm movements. J. Neurophysiol. 1982, 47, 287–302. [Google Scholar] [CrossRef] [PubMed]
  27. Clark, R.A.; Pua, Y.H.; Oliveira, C.C.; Bower, K.J.; Thilarajah, S.; McGaw, R.; Hasanki, K.; Mentiplay, B.F. Reliability and concurrent validity of the Microsoft Xbox One Kinect for assessment of standing balance and postural control. Gait Posture 2015, 42, 210–213. [Google Scholar] [CrossRef] [PubMed]
  28. Hertel, J.; Olmsted-Kramer, L.C.; Challis, J.H. Time-to-Boundary Measures of Postural Control during Single Leg Quiet Standing. J. Appl. Biomech. 2006, 22, 67–73. [Google Scholar] [CrossRef] [PubMed] [Green Version]
  29. Messier, S.P.; Royer, T.D.; Craven, T.E.; O’Toole, M.L.; Burns, R.; Ettinger, W.H. Long-Term Exercise and its Effect on Balance in Older, Osteoarthritic Adults: Results from the Fitness, Arthritis, and Seniors Trial (FAST). J. Am. Geriatr. Soc. 2000, 48, 131–138. [Google Scholar] [CrossRef]
  30. De Venuto, D.; Mezzina, G. Multi-Sensing System for Parkinson’s Disease Stage Assessment based on FPGA-embedded Serial SVM Classifier. IEEE Des. Test 2019, 38, 44–51. [Google Scholar] [CrossRef]
  31. McKinney, Z.; Heberer, K.; Nowroozi, B.N.; Greenberg, M.; Fowler, E.; Grundfest, W. Pilot evaluation of wearable tactile biofeedback system for gait rehabilitation in peripheral neuropathy. In Proceedings of the 2014 IEEE Haptics Symposium (HAPTICS), Houston, TX, USA, 23–26 February 2014; pp. 135–140. [Google Scholar]
  32. Baldini, G.; Steri, G.; Dimc, F.; Giuliani, R.; Kamnik, R. Experimental identification of smartphones using fingerprints of built-in micro-electro mechanical systems (MEMS). Sensors 2016, 16, 818. [Google Scholar] [CrossRef]
  33. McGinnis, R.S.; Mahadevan, N.; Moon, Y.; Seagers, K.; Sheth, N.; Wright, J.A., Jr.; DiCristofaro, S.; Silva, I.; Jortberg, E.; Ceruolo, M.; et al. A machine learning approach for gait speed estimation using skin-mounted wearable sensors: From healthy controls to individuals with multiple sclerosis. PLoS ONE 2017, 12, e0178366. [Google Scholar] [CrossRef]
  34. Demrozi, F.; Bacchin, R.; Tamburin, S.; Cristani, M.; Pravadelli, G. Towards a wearable system for predicting the freezing of gait in people affected by Parkinson’s disease. IEEE J. Biomed. Health Inform. 2019, 24, 2444–2451. [Google Scholar] [CrossRef] [PubMed]
  35. Borzì, L.; Mazzetta, I.; Zampogna, A.; Suppa, A.; Olmo, G.; Irrera, F. Prediction of freezing of gait in Parkinson’s disease using wearables and machine learning. Sensors 2021, 21, 614. [Google Scholar] [CrossRef] [PubMed]
  36. Angelini, L.; Hodgkinson, W.; Smith, C.; Dodd, J.M.; Sharrack, B.; Mazzà, C.; Paling, D. Wearable sensors can reliably quantify gait alterations associated with disability in people with progressive multiple sclerosis in a clinical setting. J. Neurol. 2020, 267, 2897–2909. [Google Scholar] [CrossRef] [PubMed]
  37. Bolam, S.M.; Batinica, B.; Yeung, T.C.; Weaver, S.; Cantamessa, A.; Vanderboor, T.C.; Yeung, S.; Munro, J.T.; Fernandez, J.W.; Besier, T.F.; et al. Remote patient monitoring with wearable sensors following knee arthroplasty. Sensors 2021, 21, 5143. [Google Scholar] [CrossRef]
  38. Pandhare, V.; Miller, M.; Vogl, G.W.; Lee, J. Ball Screw Health Monitoring with Inertial Sensors. IEEE Trans. Ind. Inform. 2022. [Google Scholar] [CrossRef]
  39. Li, Z.; Zhao, S.; Duan, J.; Su, C.Y.; Yang, C.; Zhao, X. Human cooperative wheelchair with brain–machine interaction based on shared control strategy. IEEE/ASME Trans. Mechatron. 2016, 22, 185–195. [Google Scholar] [CrossRef]
  40. Prins, N.W.; Sanchez, J.C.; Prasad, A. Feedback for reinforcement learning based brain–machine interfaces using confidence metrics. J. Neural Eng. 2017, 14, 036016. [Google Scholar] [CrossRef]
  41. Blankertz, B.; Losch, F.; Krauledat, M.; Dornhege, G.; Curio, G.; Müller, K. The Berlin Brain-Computer Interface: Accurate performance from first-session in BCI-naive subjects. IEEE Trans. Biomed. Eng. 2008, 55, 2452–2462. [Google Scholar] [CrossRef]
  42. van Gerven, M.; Farquhar, J.; Schaefer, R.; Vlek, R.; Geuze, J.; Nijholt, A.; Ramsey, N.; Haselager, P.; Vuurpijl, L.; Gielen, S.; et al. The brain–computer interface cycle. J. Neural Eng. 2009, 6, 041001. [Google Scholar] [CrossRef]
  43. Pustišek, M.; Wei, Y.; Sun, Y.; Umek, A.; Kos, A. The role of technology for accelerated motor learning in sport. Pers. Ubiquitous Comput. 2021, 25, 969–978. [Google Scholar] [CrossRef]
  44. Kostov, A.; Polak, M. Parallel man-machine training in development of EEG-based cursor control. IEEE Trans. Rehabil. Eng. 2000, 8, 203–205. [Google Scholar] [CrossRef] [PubMed]
  45. Tomazzoli, C.; Cristani, M.; Karafili, E.; Olivieri, F. Non-monotonic reasoning rules for energy efficiency. J. Ambient. Intell. Smart Environ. 2017, 9, 345–360. [Google Scholar] [CrossRef] [Green Version]
  46. Sodhro, A.H.; Li, Y.; Shah, M.A. Energy-efficient adaptive transmission power control for wireless body area networks. IET Commun. 2016, 10, 81–90. [Google Scholar] [CrossRef]
  47. Sodhro, A.H.; Sangaiah, A.K.; Sodhro, G.H.; Lohano, S.; Pirbhulal, S. An energy-efficient algorithm for wearable electrocardiogram signal processing in ubiquitous healthcare applications. Sensors 2018, 18, 923. [Google Scholar] [CrossRef] [PubMed] [Green Version]
  48. Turetta, C.; Demrozi, F.; Pravadelli, G. A freely available system for human activity recognition based on a low-cost body area network. In Proceedings of the 2022 IEEE 46th Annual Computers, Software, and Applications Conference (COMPSAC), Online, 27 June–1 July 2022; pp. 395–400. [Google Scholar]
  49. Coviello, G.; Florio, A.; Avitabile, G.; Talarico, C.; Wang-Roveda, J.M. Distributed full synchronized system for global health monitoring based on flsa. IEEE Trans. Biomed. Circuits Syst. 2022, 16, 600–608. [Google Scholar] [CrossRef]
  50. Demrozi, F.; Turetta, C.; Pravadelli, G. B-HAR: An open-source baseline framework for in depth study of human activity recognition datasets and workflows. arXiv 2021, arXiv:2101.10870. [Google Scholar]
  51. Pratama, I.; Permanasari, A.E.; Ardiyanto, I.; Indrayani, R. A review of missing values handling methods on time-series data. In Proceedings of the 2016 International Conference on Information Technology Systems and Innovation (ICITSI), Bali, Indonesia, 24–27 October 2016; pp. 1–6. [Google Scholar]
  52. Guyon, I.; Gunn, S.; Nikravesh, M.; Zadeh, L.A. Feature Extraction: Foundations and Applications; Springer: Cham, Switzerland, 2008; Volume 207. [Google Scholar]
  53. Storcheus, D.; Rostamizadeh, A.; Kumar, S. A survey of modern questions and challenges in feature extraction. In Feature Extraction: Modern Questions and Challenges; Microtome Publishing: Brookline, MA, USA, 2015; pp. 1–18. [Google Scholar]
  54. Barandas, M.; Folgado, D.; Fernandes, L.; Santos, S.; Abreu, M.; Bota, P.; Liu, H.; Schultz, T.; Gamboa, H. TSFEL: Time Series Feature Extraction Library. SoftwareX 2020, 11, 100456. [Google Scholar] [CrossRef]
  55. Bishop, C.M. Pattern Recognition and Machine Learning; Springer: Cham, Switzerland, 2006. [Google Scholar]
  56. Scikit Learn. Available online: https://scikit-learn.org/stable/modules/feature_selection.html (accessed on 2 November 2020).
  57. Powers, D.M. Evaluation: From precision, recall and F-measure to ROC, informedness, markedness and correlation. arXiv 2020, arXiv:2010.16061. [Google Scholar]
Figure 1. Visual description of the GPSJack technology and application scenario.
Electronics 12 00644 g001
Figure 2. Logic model of system architecture.
Electronics 12 00644 g002
Figure 3. GPSJack/GPSEnv system design workflow.
Electronics 12 00644 g003
Figure 4. The wooden board: bottom and lateral views.
Electronics 12 00644 g004
Figure 5. Overview of motor task phases: (blue) rotate, (red) in position, (green) APAs, (purple) drop, and (yellow) recover.
Electronics 12 00644 g005
Figure 6. Experimental setup: the task.
Electronics 12 00644 g006
Figure 7. Locations of retro-reflective markers (black) and EMG electrodes (red). EMGs were placed on both sides of the body.
Electronics 12 00644 g007
Figure 8. Nordic Thingy 52 board (on the left) and its usage in the data collection setup (on the right).
Electronics 12 00644 g008
Figure 9. GPSJack Android mobile application running on the tablet: node connection and data visualization.
Electronics 12 00644 g009
Figure 10. Data analysis workflow.
Electronics 12 00644 g010
Table 1. Most used time and frequency-domain features.
Time Domain FeaturesFrequency Domain Features
(1) maximum, (2) minimum, (3) mean, (4) standard deviation, (5) root mean square, (6) range, (7) median, (8) skewness, (9) kurtosis, (10) time-weighted variance, (11) interquartile range, (12) empirical cumulative density function, (13) percentiles (10, 25, 75, and 90), (14) sum of values above or below percentile (10, 25, 75, and 90), (15) square sum of values above or below percentile (10, 25, 75, and 90), (16) number of crossings above or below percentile (10, 25, 75, and 90), (17) mean amplitude deviation, (18) mean power deviation, (19) signal magnitude area, (20) signal vector magnitude, (21) covariance, (22) simple moving average of sum of range of a signal, (23) sum of range of a signal, (24) sum of standard deviation of a signal, (25) maximum slope of simple moving average of sum of variances of a signal, (26) autoregression.(1) Fast Fourier Transform (FFT) coefficients, (2) Discrete Fourier Transform (DFT), (3) Discrete Wavelet Transform (DWT), (4) first dominant frequency, (5) ratio between the power at the dominant frequency and the total power, (6) ratio between the power at frequencies higher than 3.5 Hz and the total power, (7) two signal fragmentation features, (8) DC component in FFT spectrum, (10) energy spectrum, (11) entropy spectrum, (12) sum of the wavelet coefficients, (13) squared sum of the wavelet coefficients and energy of the wavelet coefficients, (14) auto-correlation, (15) mean-crossing rate, (16) spectral entropy, (17) spectral energy, (18) wavelet entropy values, (19) mean frequency, (20) energy band.
Table 2. Subjects’ characteristics.
SubjectAge (Years)Height (cm)Weight (kg)
222418272.6
232418361.1
242218697.7
252817665.1
262817269.7
282317064.7
292417469.0
302817678,0
312518786.9
322318978.1
332317666.9
341917572.8
Min.1917061.1
Max.2818997.7
Avg.24.76178.6573.71
Std.2.786.159.97
Table 3. Overview of the three types of datasets analyzed.
DatasetTimeForce PlatformEMG’sAccelerationSampling Frequency
ID[ms](#1)(#10)(#9)[Hz]
A 1000
B 200
C200
Table 4. Average results for segmentation and feature-extraction data representation of all 12 subjects’ data.
SegmentationFeature Extraction
ABCABC
ModelAPRF1APRF1APRF1APRF1APRF1APRF1
k-NN58.156.258.155.247.445.047.444.057.355.557.354.442.739.442.740.238.936.838.935.871.467.771.469.2
RF77.780.277.776.054.555.354.548.388.889.388.888.284.084.884.083.563.068.663.059.589.990.289.989.6
LDA49.248.949.247.342.564.742.525.749.549.249.548.436.834.634.531.4561.367.661.356.965.167.465.063.6
Table 5. Results on segmentation and feature extraction data representation for each subject.
SegmentationFeature Extraction
ABCABC
SubjectModelAPRF1APRF1APRF1APRF1APRF1APRF1
P22k-NN56.855.656.854.440.042.140.039.056.555.356.554.239.437.439.437.734.531.934.532.644.560.544.548.9
RF83.684.883.682.754.155.954.149.284.985.784.984.183.684.883.683.061.563.361.559.483.985.183.983.2
LDA59.559.559.559.432.130.832.131.254.856.454.855.539.376.039.340.03.08.33.00.444.560.544.548.9
P23k-NN66.767.366.764.342.142.842.137.465.863.565.863.049.146.849.147.837.834.737.835.082.981.482.880.3
RF86.187.786.185.648.947.948.943.599.899.899.899.887.688.087.687.262.464.962.460.3100100100100
LDA61.161.961.161.437.833.737.833.498.698.798.698.630.50.13.10.013.612.93.61.297.497.597.497.4
P24k-NN63.764.063.762.646.143.946.141.064.463.764.463.146.144.246.144.940.938.040.937.265.861.665.863.5
RF89.490.889.488.856.260.656.249.888.189.688.187.391.491.791.491.165.370.565.362.392.192.392.191.7
LDA59.760.859.760.035.032.335.033.852.857.252.854.558.266.658.257.130.034.430.015.061.864.361.862.9
P25k-NN63.362.863.360.949.550.949.546.563.463.063.461.148.045.448.046.437.637.637.634.968.365.068.366.2
RF85.085.685.284.755.963.455.952.190.190.390.189.786.185.986.185.865.272.365.262.490.190.090.189.7
LDA55.956.155.955.737.535.237.535.654.154.454.154.120.07.820.010.53.711.63.71.940.046.440.031.8
P26k-NN65.064.165.062.348.146.448.143.165.064.165.062.349.746.749.747.537.332.937.334.280.476.980.477.7
RF86.386.586.385.958.761.558.752.799.899.899.899.888.488.388.488.165.365.265.360.8100100100100
LDA57.958.657.958.241.738.741.738.698.398.498.398.341.325.741.331.031.411.231.415.898.398.498.398.3
P28k-NN65.564.365.562.846.746.246.741.765.564.365.662.852.349.552.350.238.733.638.735.064.060.764.162.2
RF84.285.484.283.156.760.756.749.785.886.585.884.886.186.886.185.463.467.163.459.085.586.185.584.8
LDA58.859.358.859.046.741.446.739.153.656.253.554.556.662.756.660.63.417.93.40.650.857.050.152.5
P29k-NN61.060.161.058.146.847.546.842.761.160.661.158.449.046.049.046.739.637.939.636.569.465.469.467.0
RF85.087.085.084.359.359.559.351.484.886.584.884.086.187.486.185.665.168.465.158.987.888.887.887.3
LDA61.761.361.761.339.035.139.035.954.657.454.655.459.965.659.961.546.922.946.930.549.254.949.250.3
P30k-NN59.262.059.255.951.454.551.443.559.759.359.756.542.639.842.640.437.934.937.934.677.875.377.874.2
RF84.685.884.683.661.865.061.857.299.899.899.899.886.487.186.485.969.972.869.967.399.899.899.899.8
LDA53.455.353.454.141.138.341.138.999.099.099.099.011.945.411.913.430.117.530.114.998.798.898.798.8
P31k-NN58.255.458.254.845.844.345.838.355.652.655.652.542.939.842.939.438.937.138.935.777.872.778.874.4
RF81.283.181.280.253.759.653.647.599.899.899.899.886.487.386.485.862.067.262.058.999.999.999.999.9
LDA59.860.059.859.744.141.144.140.498.998.998.998.965.366.165.365.316.866.116.820.598.498.498.498.4
P32k-NN68.367.868.365.130.736.830.730.268.367.868.365.056.353.756.354.341.037.541.138.271.267.571.268.7
RF87.287.387.286.158.563.658.553.289.387.089.387.988.387.588.387.567.466.167.464.488.687.988.687.9
LDA56.856.756.856.742.337.542.337.953.655.553.654.415.33.915.306.218.620.318.67.042.225.442.228.8
P33k-NN69.265.569.266.545.046.145.043.469.465.369.466.753.249.053.250.338.135.038.134.870.466.570.467.7
RF89.890.389.889.253.954.853.948.292.092.592.091.391.491.291.490.963.964.763.959.693.894.093.893.2
LDA60.060.360.060.138.937.738.937.354.256.454.255.014.345.814.318.33.335.13.30.850.057.650.046.9
P34k-NN73.473.373.471.652.851.452.845.673.973.973.972.057.654.157.755.640.536.440.537.276.473.076.474.5
RF91.691.891.691.358.867.958.852.193.894.193.893.491.791.691.691.566.270.166.260.592.492.392.492.2
LDA63.363.563.363.443.137.643.139.057.758.957.758.228.89.128.813.428.926.828.913.749.549.249.548.4
k-NNMin56.855.456.854.430.736.830.730.255.652.655.652.539.437.439.437.734.531.934.532.644.560.544.548.9
Max69.267.869.266.551.454.551.446.569.467.869.466.756.353.756.354.3413841.138.282.981.482.880.3
Avg63.462.663.460.744.745.644.740.663.261.863.260.548.145.348.146.038.435.638.435.370.268.570.368.3
RFMin81.283.181.280.248.947.948.943.584.885.784.884.083.684.883.68361.563.361.558.983.985.183.983.2
Max89.490.889.488.861.86561.857.299.899.899.899.891.491.791.491.169.972.869.967.3100100100100
Avg85.386.485.384.556.459.856.450.692.292.592.291.787.087.587.086.564.867.864.861.492.893.092.892.4
LDAMin53.455.353.454.132.130.832.131.252.854.452.854.111.90.13.10.013.08.33.00.440.025.440.028.8
Max61.761.961.761.446.741.446.740.499.099.099.099.065.376.065.365.346.966.146.930.598.798.898.798.8
Avg58.559.058.558.639.736.439.736.571.873.271.872.339.842.037.134.618.822.318.810.868.170.268.166.8
Table 6. Data aggregators’ profiling using Android Studio 4.1.2.
Galaxy Tab A7
Frequency (Hz)50100200
RAM (MB/h)147180224
Storage (Mb/h)50102185
CPU (%)314046
Battery (mAh)312325342
Data loss (%)000
Disclaimer/Publisher’s Note: The statements, opinions and data contained in all publications are solely those of the individual author(s) and contributor(s) and not of MDPI and/or the editor(s). MDPI and/or the editor(s) disclaim responsibility for any injury to people or property resulting from any ideas, methods, instructions or products referred to in the content.

